Attached files
| file | filename |
|---|---|
| 8-K - 8-K - ERICKSON INC. | a12-12054_18k.htm |
Exhibit 99.1
|
|
Presentation To May 2012 Oppenheimer 7th Annual Industrials Conference |
|
|
Disclaimer Statements in this presentation, as well as oral statements made by officers, directors or employees of Erickson Air-Crane Incorporated (the “Company”), in connection with this presentation, that are not historical facts (including, without limitation, statements containing financial forecasts, statements concerning plans, goals, targets and objectives of management for future operations, statements concerning the Company’s future economic performance, statements containing words and phrases such as “may,” “expects,” “should,” “believes,” “anticipates,” “estimates,” “intends,” “forecasts,” “proposes,” “potential” or similar expressions and any statement of the assumptions relating to any of the foregoing) constitute “forward-looking statements” that are predictive in nature and inherently uncertain. These forward-looking statements are based upon management’s current views, expectations and beliefs concerning future events and therefore are subject to a number of significant risks, uncertainties and contingencies (many of which are beyond the Company’s control or subject to change) that could cause the actual results of the Company to differ materially from historical results or from those results expressed or implied by the forward-looking statements. The risk factors that could cause actual results to differ materially from those in our forward-looking statements are disclosed in our most recent Quarterly Report on Form 10-Q and other filings we have filed with the SEC. You are cautioned not to place undue reliance on any of these forward-looking statements. Except as required under the federal securities laws, the Company does not intend, and does not undertake any obligation, to update any forward-looking statements to reflect future events or circumstances after the date of such statements. |
|
|
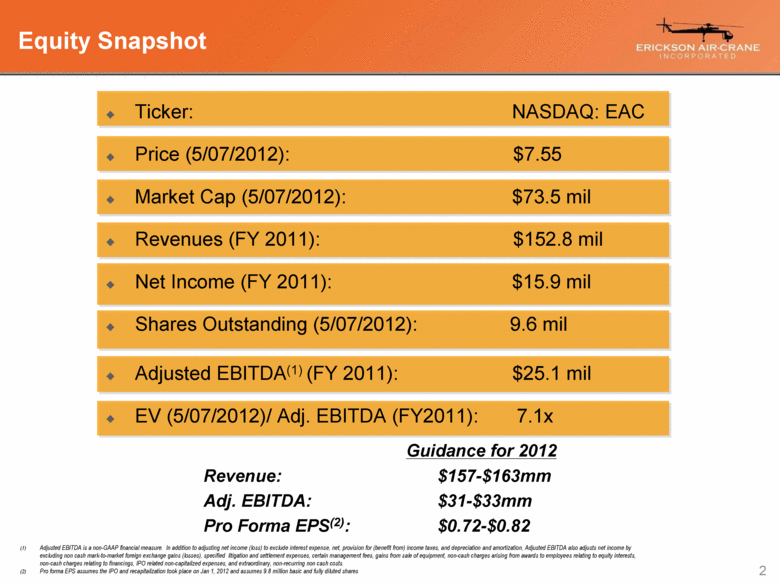
Equity Snapshot Ticker: NASDAQ: EAC Price (5/07/2012): $7.55 Market Cap (5/07/2012): $73.5 mil Revenues (FY 2011): $152.8 mil Net Income (FY 2011): $15.9 mil Shares Outstanding (5/07/2012): 9.6 mil Adjusted EBITDA(1) (FY 2011): $25.1 mil EV (5/07/2012)/ Adj. EBITDA (FY2011): 7.1x Guidance for 2012 Revenue: $157-$163mm Adj. EBITDA: $31-$33mm Pro Forma EPS(2): $0.72-$0.82 Adjusted EBITDA is a non-GAAP financial measure. In addition to adjusting net income (loss) to exclude interest expense, net, provision for (benefit from) income taxes, and depreciation and amortization, Adjusted EBITDA also adjusts net income by excluding non cash mark-to-market foreign exchange gains (losses), specified litigation and settlement expenses, certain management fees, gains from sale of equipment, non-cash charges arising from awards to employees relating to equity interests, non-cash charges relating to financings, IPO related non-capitalized expenses, and extraordinary, non-recurring non cash costs. Pro forma EPS assumes the IPO and recapitalization took place on Jan 1, 2012 and assumes 9.8 million basic and fully diluted shares |
|
|
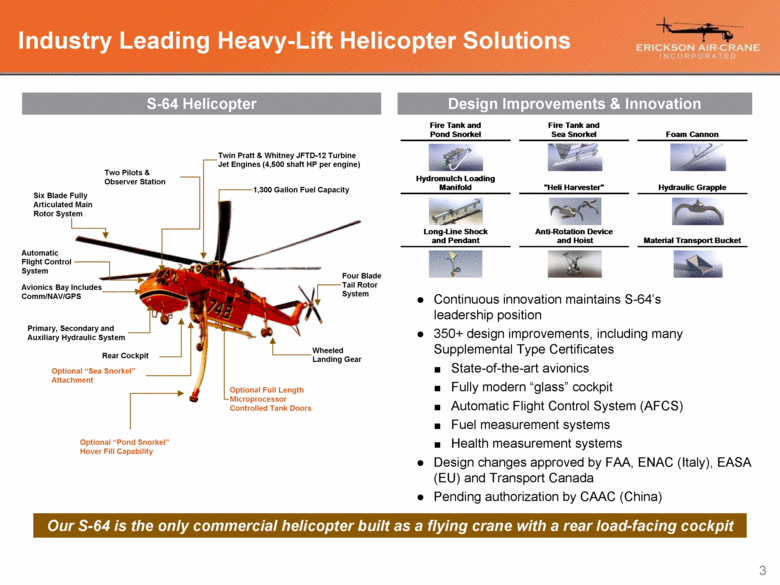
Industry Leading Heavy-Lift Helicopter Solutions Continuous innovation maintains S-64’s leadership position 350+ design improvements, including many Supplemental Type Certificates State-of-the-art avionics Fully modern “glass” cockpit Automatic Flight Control System (AFCS) Fuel measurement systems Health measurement systems Design changes approved by FAA, ENAC (Italy), EASA (EU) and Transport Canada Pending authorization by CAAC (China) S-64 Helicopter Design Improvements & Innovation Our S-64 is the only commercial helicopter built as a flying crane with a rear load-facing cockpit Six Blade Fully Articulated Main Rotor System Two Pilots & Observer Station Automatic Flight Control System Avionics Bay Includes Comm/NAV/GPS Primary, Secondary and Auxiliary Hydraulic System Optional “Sea Snorkel” Attachment Optional “Pond Snorkel” Hover Fill Capability Twin Pratt & Whitney JFTD-12 Turbine Jet Engines (4,500 shaft HP per engine) 1,300 Gallon Fuel Capacity Four Blade Tail Rotor System Wheeled Landing Gear Optional Full Length Microprocessor Controlled Tank Doors Rear Cockpit Fire Tank and Pond Snorkel Fire Tank and Sea Snorkel Foam Cannon Hydromulch Loading Manifold "Heli Harvester" Hydraulic Grapple Long-Line Shock and Pendant Anti-Rotation Device and Hoist Material Transport Bucket |
|
|
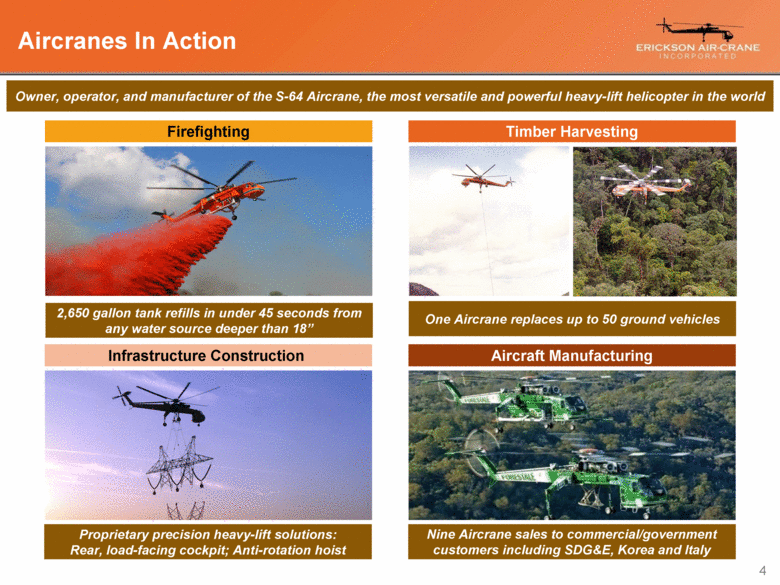
Aircranes In Action Firefighting Timber Harvesting Infrastructure Construction Aircraft Manufacturing 2,650 gallon tank refills in under 45 seconds from any water source deeper than 18” One Aircrane replaces up to 50 ground vehicles Nine Aircrane sales to commercial/government customers including SDG&E, Korea and Italy Proprietary precision heavy-lift solutions: Rear, load-facing cockpit; Anti-rotation hoist Owner, operator, and manufacturer of the S-64 Aircrane, the most versatile and powerful heavy-lift helicopter in the world |
|
|
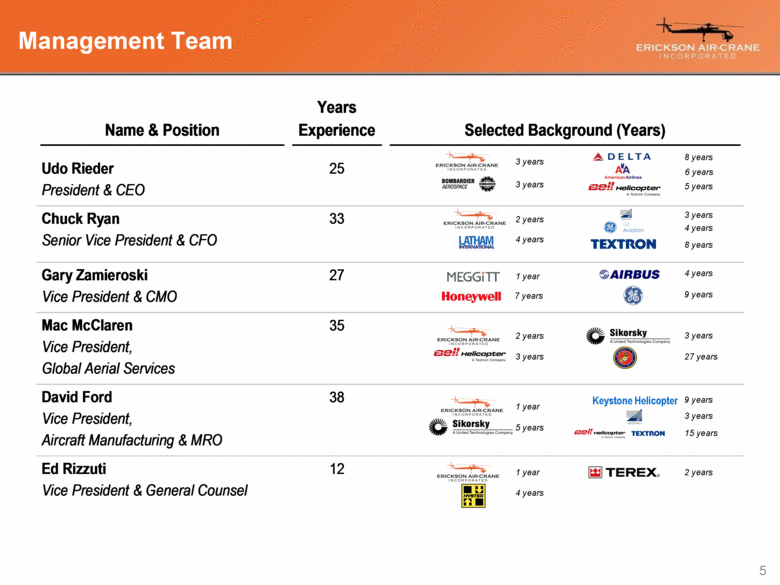
Management Team 2 years 2 years 4 years 1 year 4 years 1 year 2 years 9 years Keystone Helicopter 5 years 4 years 3 years 3 years 8 years 6 years 5 years 3 years 4 years 8 years 3 years 27 years 3 years 7 years 3 years 15 years 1 year 9 years Name & Position Years Experience Selected Background (Years) Udo Rieder President & CEO 25 Chuck Ryan Senior Vice President & CFO 33 Gary Zamieroski Vice President & CMO 27 Mac McClaren Vice President, Global Aerial Services 35 David Ford Vice President, Aircraft Manufacturing & MRO 38 Ed Rizzuti Vice President & General Counsel 12 |
|
|
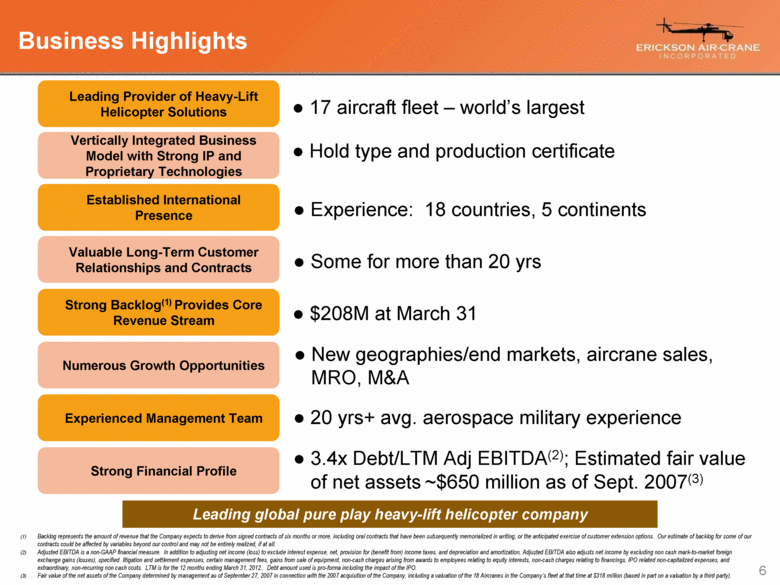
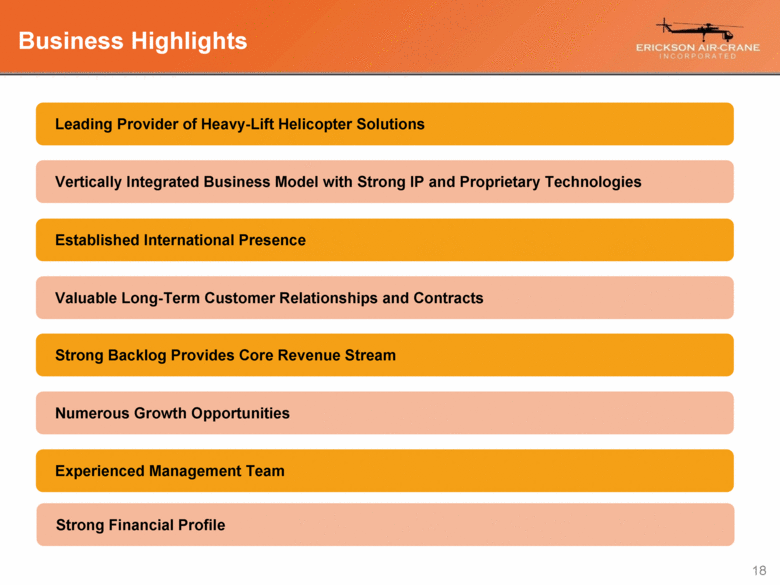
Experienced Management Team Leading Provider of Heavy-Lift Helicopter Solutions Vertically Integrated Business Model with Strong IP and Proprietary Technologies Established International Presence Valuable Long-Term Customer Relationships and Contracts Numerous Growth Opportunities Business Highlights Leading global pure play heavy-lift helicopter company Strong Backlog(1) Provides Core Revenue Stream 17 aircraft fleet – world’s largest Strong Financial Profile Experience: 18 countries, 5 continents Some for more than 20 yrs $208M at March 31 New geographies/end markets, aircrane sales, MRO, M&A 20 yrs+ avg. aerospace military experience 3.4x Debt/LTM Adj EBITDA(2); Estimated fair value of net assets ~$650 million as of Sept. 2007(3) Hold type and production certificate (1) Backlog represents the amount of revenue that the Company expects to derive from signed contracts of six months or more, including oral contracts that have been subsequently memorialized in writing, or the anticipated exercise of customer extension options. Our estimate of backlog for some of our contracts could be affected by variables beyond our control and may not be entirely realized, if at all. (2) Adjusted EBITDA is a non-GAAP financial measure. In addition to adjusting net income (loss) to exclude interest expense, net, provision for (benefit from) income taxes, and depreciation and amortization, Adjusted EBITDA also adjusts net income by excluding non cash mark-to-market foreign exchange gains (losses), specified litigation and settlement expenses, certain management fees, gains from sale of equipment, non-cash charges arising from awards to employees relating to equity interests, non-cash charges relating to financings, IPO related non-capitalized expenses, and extraordinary, non-recurring non cash costs. LTM is for the 12 months ending March 31, 2012.. Debt amount used is pro-forma including the impact of the IPO. (3) Fair value of the net assets of the Company determined by management as of September 27, 2007 in connection with the 2007 acquisition of the Company, including a valuation of the 18 Aircranes in the Company’s fleet at that time at $318 million (based in part on a valuation by a third party). |
|
|
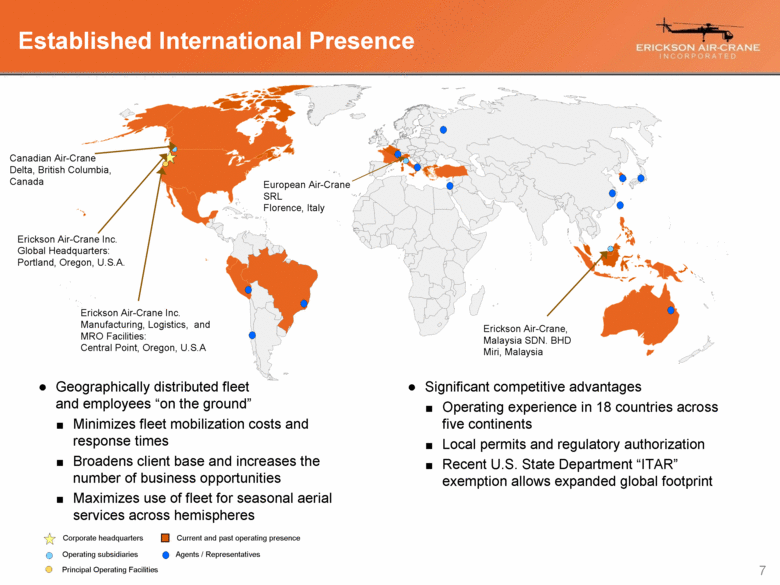
Established International Presence Geographically distributed fleet and employees “on the ground” Minimizes fleet mobilization costs and response times Broadens client base and increases the number of business opportunities Maximizes use of fleet for seasonal aerial services across hemispheres Significant competitive advantages Operating experience in 18 countries across five continents Local permits and regulatory authorization Recent U.S. State Department “ITAR” exemption allows expanded global footprint Corporate headquarters Operating subsidiaries Current and past operating presence Canadian Air-Crane Delta, British Columbia, Canada European Air-Crane SRL Florence, Italy Erickson Air-Crane, Malaysia SDN. BHD Miri, Malaysia Erickson Air-Crane Inc. Manufacturing, Logistics, and MRO Facilities: Central Point, Oregon, U.S.A Erickson Air-Crane Inc. Global Headquarters: Portland, Oregon, U.S.A. Agents / Representatives Principal Operating Facilities |
|
|
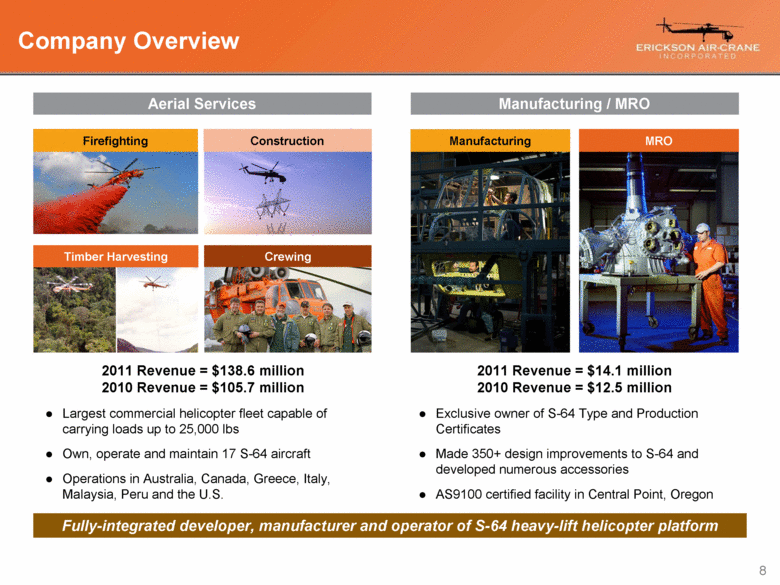
Company Overview Exclusive owner of S-64 Type and Production Certificates Made 350+ design improvements to S-64 and developed numerous accessories AS9100 certified facility in Central Point, Oregon Largest commercial helicopter fleet capable of carrying loads up to 25,000 lbs Own, operate and maintain 17 S-64 aircraft Operations in Australia, Canada, Greece, Italy, Malaysia, Peru and the U.S. Firefighting Timber Harvesting Manufacturing MRO Fully-integrated developer, manufacturer and operator of S-64 heavy-lift helicopter platform 2011 Revenue = $138.6 million 2010 Revenue = $105.7 million 2011 Revenue = $14.1 million 2010 Revenue = $12.5 million Crewing Construction Aerial Services Manufacturing / MRO |
|
|
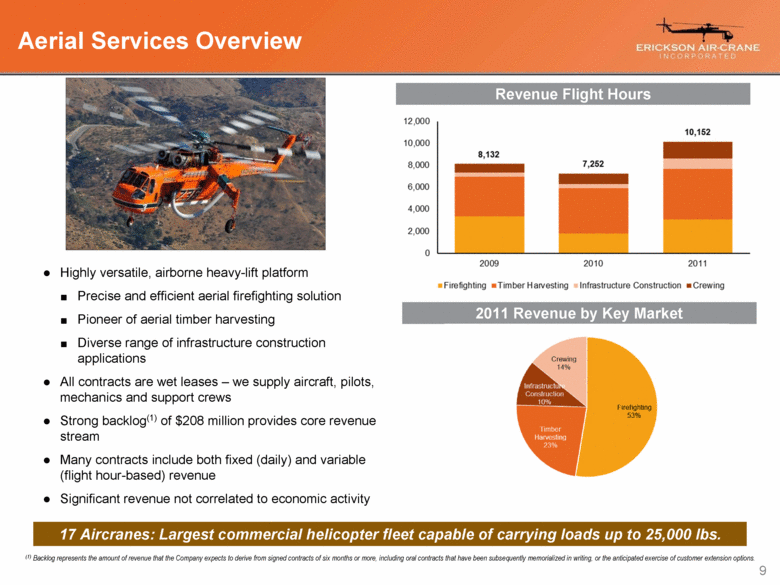
Aerial Services Overview Revenue Flight Hours 2011 Revenue by Key Market Highly versatile, airborne heavy-lift platform Precise and efficient aerial firefighting solution Pioneer of aerial timber harvesting Diverse range of infrastructure construction applications All contracts are wet leases – we supply aircraft, pilots, mechanics and support crews Strong backlog(1) of $208 million provides core revenue stream Many contracts include both fixed (daily) and variable (flight hour-based) revenue Significant revenue not correlated to economic activity 17 Aircranes: Largest commercial helicopter fleet capable of carrying loads up to 25,000 lbs. (1) Backlog represents the amount of revenue that the Company expects to derive from signed contracts of six months or more, including oral contracts that have been subsequently memorialized in writing, or the anticipated exercise of customer extension options. |
|
|
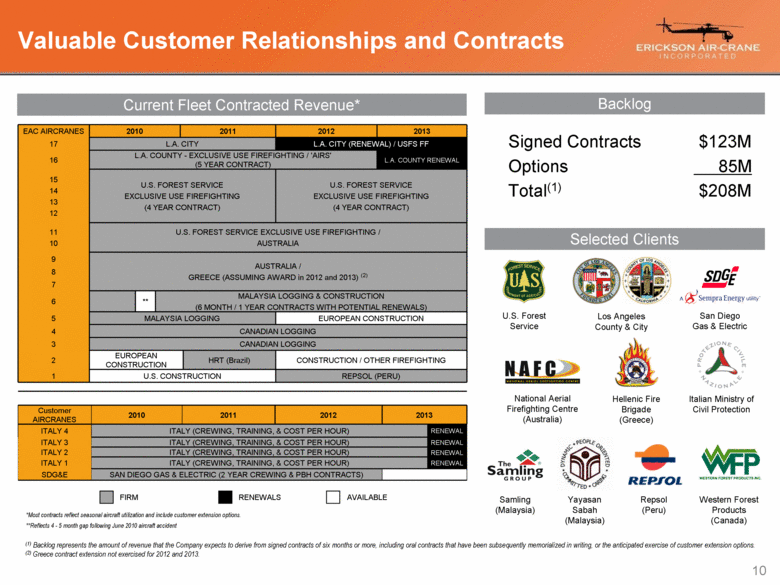
Valuable Customer Relationships and Contracts San Diego Gas & Electric Repsol (Peru) U.S. Forest Service Samling (Malaysia) Los Angeles County & City Current Fleet Contracted Revenue* EAC AIRCRANES 2010 2011 2012 2013 17 L.A. CITY L.A. CITY (RENEWAL) / USFS FF 16 L.A. COUNTY - EXCLUSIVE USE FIREFIGHTING / 'AIRS' (5 YEAR CONTRACT) L.A. COUNTY RENEWAL 15 14 13 12 U.S. FOREST SERVICE EXCLUSIVE USE FIREFIGHTING (4 YEAR CONTRACT) U.S. FOREST SERVICE EXCLUSIVE USE FIREFIGHTING (4 YEAR CONTRACT) 11 10 U.S. FOREST SERVICE EXCLUSIVE USE FIREFIGHTING / AUSTRALIA 9 AUSTRALIA / GREECE (ASSUMING AWARD in 2012 and 2013) (2) 8 7 6 ** MALAYSIA LOGGING & CONSTRUCTION (6 MONTH / 1 YEAR CONTRACTS WITH POTENTIAL RENEWALS) 5 MALAYSIA LOGGING EUROPEAN CONSTRUCTION 4 CANADIAN LOGGING 3 CANADIAN LOGGING 2 EUROPEAN CONSTRUCTION HRT (Brazil) CONSTRUCTION / OTHER FIREFIGHTING 1 U.S. CONSTRUCTION REPSOL (PERU) Customer AIRCRANES 2010 2011 2012 2013 ITALY 4 ITALY (CREWING, TRAINING, & COST PER HOUR) RENEWAL ITALY 3 ITALY (CREWING, TRAINING, & COST PER HOUR) RENEWAL ITALY 2 ITALY (CREWING, TRAINING, & COST PER HOUR) RENEWAL ITALY 1 ITALY (CREWING, TRAINING, & COST PER HOUR) RENEWAL SDG&E SAN DIEGO GAS & ELECTRIC (2 YEAR CREWING & PBH CONTRACTS) *Most contracts reflect seasonal aircraft utilization and include customer extension options. **Reflects 4 - 5 month gap following June 2010 aircraft accident Yayasan Sabah (Malaysia) Hellenic Fire Brigade (Greece) Italian Ministry of Civil Protection Selected Clients FIRM AVAILABLE National Aerial Firefighting Centre (Australia) RENEWALS Backlog Signed Contracts $123M Options 85M Total(1) $208M Western Forest Products (Canada) (1) Backlog represents the amount of revenue that the Company expects to derive from signed contracts of six months or more, including oral contracts that have been subsequently memorialized in writing, or the anticipated exercise of customer extension options. (2) Greece contract extension not exercised for 2012 and 2013. |
|
|
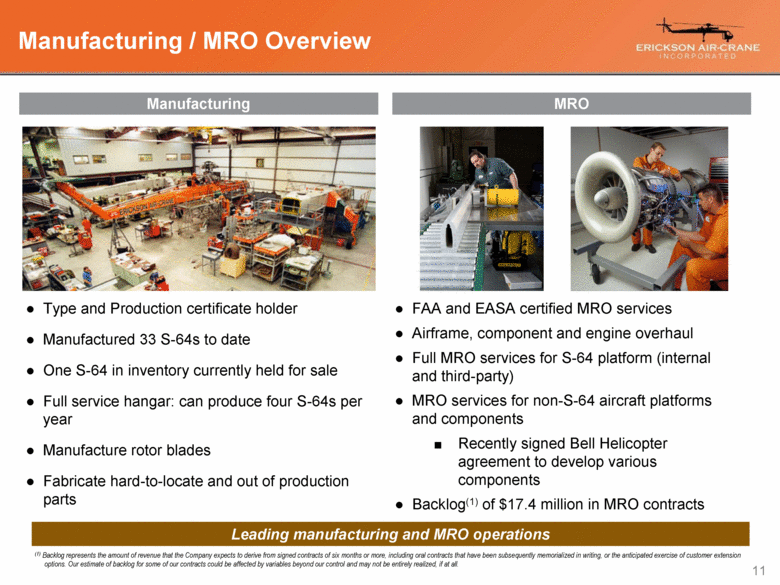
Manufacturing / MRO Overview Type and Production certificate holder Manufactured 33 S-64s to date One S-64 in inventory currently held for sale Full service hangar: can produce four S-64s per year Manufacture rotor blades Fabricate hard-to-locate and out of production parts FAA and EASA certified MRO services Airframe, component and engine overhaul Full MRO services for S-64 platform (internal and third-party) MRO services for non-S-64 aircraft platforms and components Recently signed Bell Helicopter agreement to develop various components Backlog(1) of $17.4 million in MRO contracts Manufacturing MRO Leading manufacturing and MRO operations (1) Backlog represents the amount of revenue that the Company expects to derive from signed contracts of six months or more, including oral contracts that have been subsequently memorialized in writing, or the anticipated exercise of customer extension options. Our estimate of backlog for some of our contracts could be affected by variables beyond our control and may not be entirely realized, if at all. |
|
|
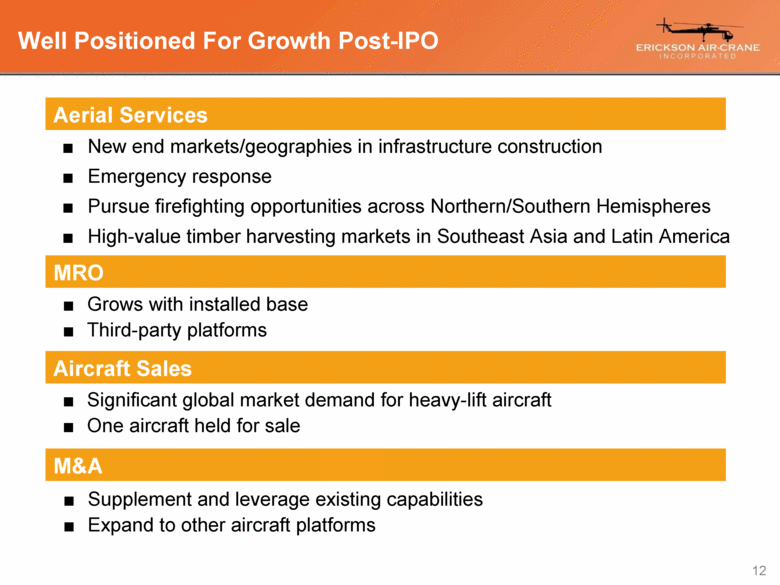
Well Positioned For Growth Post-IPO Aerial Services New end markets/geographies in infrastructure construction Emergency response Pursue firefighting opportunities across Northern/Southern Hemispheres High-value timber harvesting markets in Southeast Asia and Latin America MRO Grows with installed base Third-party platforms M&A Supplement and leverage existing capabilities Expand to other aircraft platforms Aircraft Sales Significant global market demand for heavy-lift aircraft One aircraft held for sale |
|
|
Financial Overview |
|
|
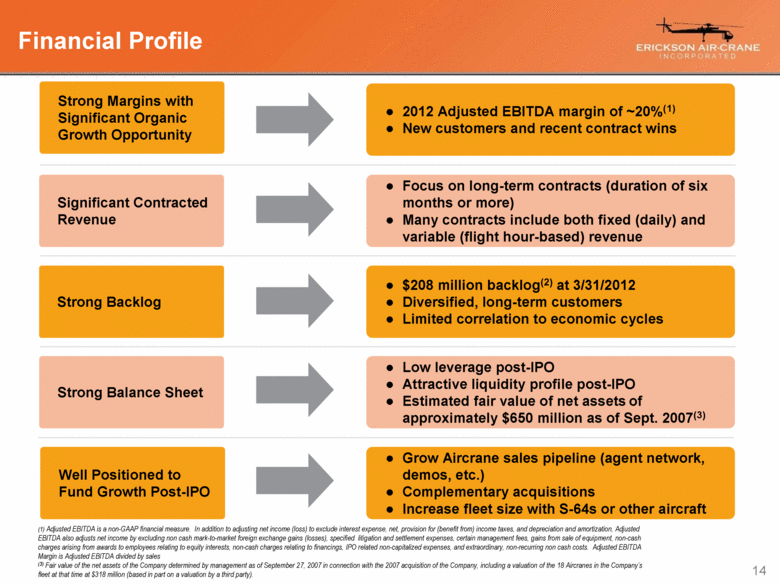
Financial Profile Strong Backlog Strong Balance Sheet Well Positioned to Fund Growth Post-IPO 2012 Adjusted EBITDA margin of ~20%(1) New customers and recent contract wins $208 million backlog(2) at 3/31/2012 Diversified, long-term customers Limited correlation to economic cycles Low leverage post-IPO Attractive liquidity profile post-IPO Estimated fair value of net assets of approximately $650 million as of Sept. 2007(3) Grow Aircrane sales pipeline (agent network, demos, etc.) Complementary acquisitions Increase fleet size with S-64s or other aircraft Strong Margins with Significant Organic Growth Opportunity Significant Contracted Revenue Focus on long-term contracts (duration of six months or more) Many contracts include both fixed (daily) and variable (flight hour-based) revenue Adjusted EBITDA is a non-GAAP financial measure. In addition to adjusting net income (loss) to exclude interest expense, net, provision for (benefit from) income taxes, and depreciation and amortization, Adjusted EBITDA also adjusts net income by excluding non cash mark-to-market foreign exchange gains (losses), specified litigation and settlement expenses, certain management fees, gains from sale of equipment, non-cash charges arising from awards to employees relating to equity interests, non-cash charges relating to financings, IPO related non-capitalized expenses, and extraordinary, non-recurring non cash costs. Adjusted EBITDA Margin is Adjusted EBITDA divided by sales (3) Fair value of the net assets of the Company determined by management as of September 27, 2007 in connection with the 2007 acquisition of the Company, including a valuation of the 18 Aircranes in the Company’s fleet at that time at $318 million (based in part on a valuation by a third party). |
|
|
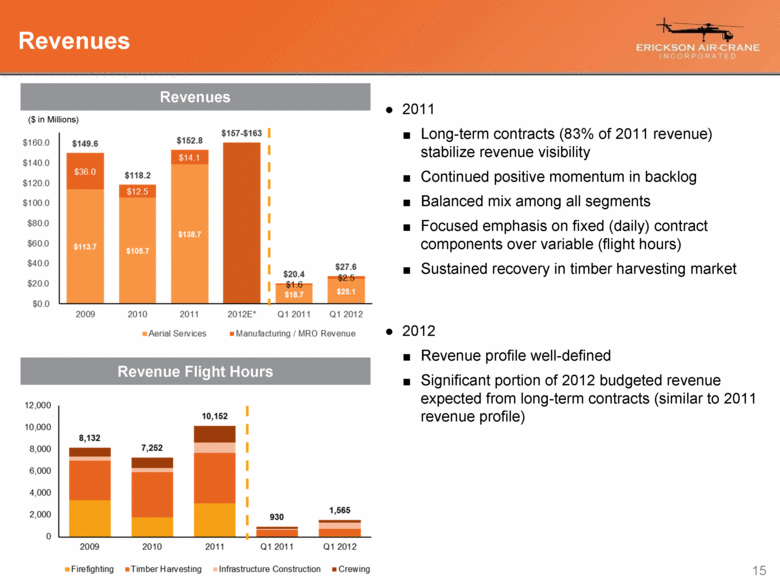
Revenues Revenues 2011 Long-term contracts (83% of 2011 revenue) stabilize revenue visibility Continued positive momentum in backlog Balanced mix among all segments Focused emphasis on fixed (daily) contract components over variable (flight hours) Sustained recovery in timber harvesting market 2012 Revenue profile well-defined Significant portion of 2012 budgeted revenue expected from long-term contracts (similar to 2011 revenue profile) ($ in Millions) Revenue Flight Hours |
|
|
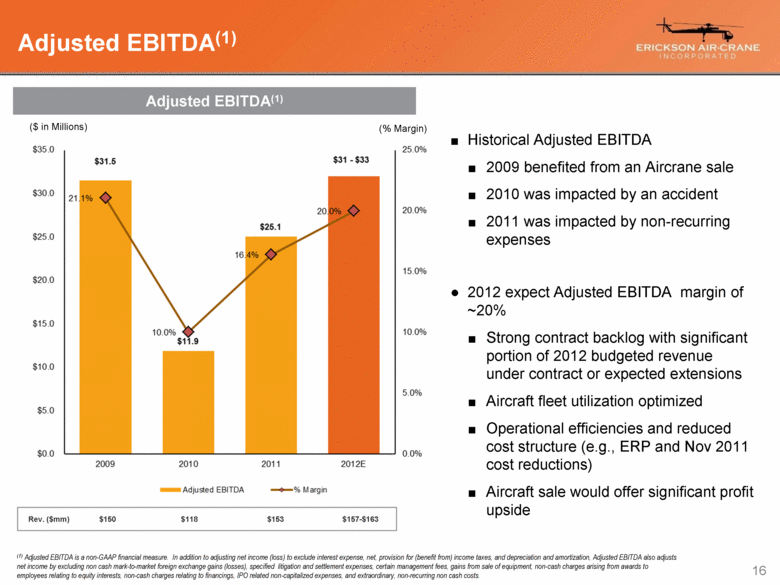
Adjusted EBITDA(1) Adjusted EBITDA(1) Historical Adjusted EBITDA 2009 benefited from an Aircrane sale 2010 was impacted by an accident 2011 was impacted by non-recurring expenses 2012 expect Adjusted EBITDA margin of ~20% Strong contract backlog with significant portion of 2012 budgeted revenue under contract or expected extensions Aircraft fleet utilization optimized Operational efficiencies and reduced cost structure (e.g., ERP and Nov 2011 cost reductions) Aircraft sale would offer significant profit upside Rev. ($mm) $150 $118 $153 $157-$163 ($ in Millions) (% Margin) (1) Adjusted EBITDA is a non-GAAP financial measure. In addition to adjusting net income (loss) to exclude interest expense, net, provision for (benefit from) income taxes, and depreciation and amortization, Adjusted EBITDA also adjusts net income by excluding non cash mark-to-market foreign exchange gains (losses), specified litigation and settlement expenses, certain management fees, gains from sale of equipment, non-cash charges arising from awards to employees relating to equity interests, non-cash charges relating to financings, IPO related non-capitalized expenses, and extraordinary, non-recurring non cash costs. |
|
|
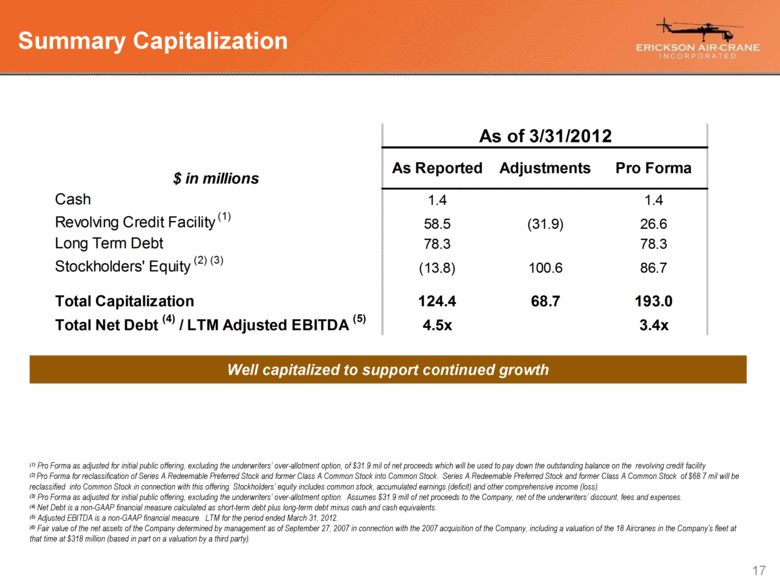
Summary Capitalization Well capitalized to support continued growth (1) Pro Forma as adjusted for initial public offering, excluding the underwriters’ over-allotment option, of $31.9 mil of net proceeds which will be used to pay down the outstanding balance on the revolving credit facility (2) Pro Forma for reclassification of Series A Redeemable Preferred Stock and former Class A Common Stock into Common Stock. Series A Redeemable Preferred Stock and former Class A Common Stock of $68.7 mil will be reclassified into Common Stock in connection with this offering. Stockholders’ equity includes common stock, accumulated earnings (deficit) and other comprehensive income (loss). (3) Pro Forma as adjusted for initial public offering, excluding the underwriters’ over-allotment option. Assumes $31.9 mill of net proceeds to the Company, net of the underwriters’ discount, fees and expenses. (4) Net Debt is a non-GAAP financial measure calculated as short-term debt plus long-term debt minus cash and cash equivalents. (5) Adjusted EBITDA is a non-GAAP financial measure. LTM for the period ended March 31, 2012. (6) Fair value of the net assets of the Company determined by management as of September 27, 2007 in connection with the 2007 acquisition of the Company, including a valuation of the 18 Aircranes in the Company’s fleet at that time at $318 million (based in part on a valuation by a third party). $ in millions Cash 1.4 1.4 Revolving Credit Facility (1) 58.5 (31.9) 26.6 Long Term Debt 78.3 78.3 Stockholders' Equity (2) (3) (13.8) 100.6 86.7 Total Capitalization 124.4 68.7 193.0 Total Net Debt (4) / LTM Adjusted EBITDA (5) 4.5x 3.4x As of 3/31/2012 As Reported Adjustments Pro Forma |
|
|
Business Highlights Experienced Management Team Leading Provider of Heavy-Lift Helicopter Solutions Vertically Integrated Business Model with Strong IP and Proprietary Technologies Established International Presence Valuable Long-Term Customer Relationships and Contracts Numerous Growth Opportunities Strong Backlog Provides Core Revenue Stream Strong Financial Profile |
|
|
Appendix |
|
|
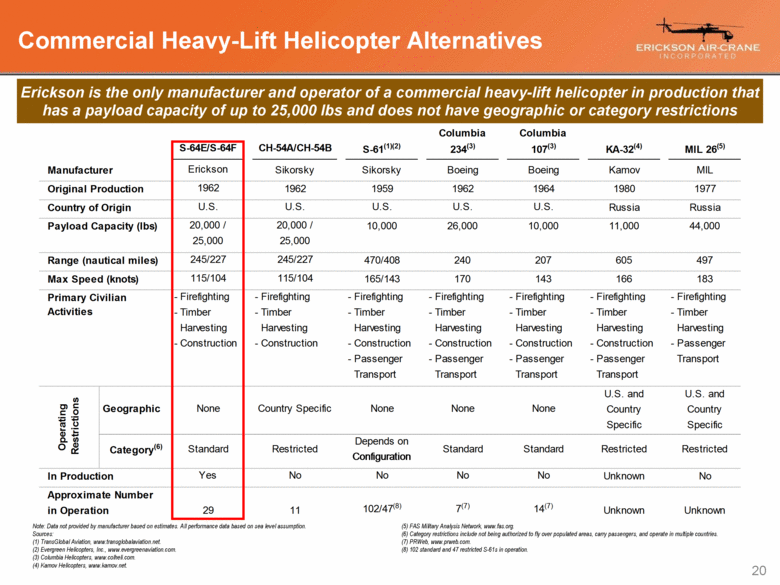
Erickson is the only manufacturer and operator of a commercial heavy-lift helicopter in production that has a payload capacity of up to 25,000 lbs and does not have geographic or category restrictions Commercial Heavy-Lift Helicopter Alternatives Note: Data not provided by manufacturer based on estimates. All performance data based on sea level assumption. Sources: (1) TransGlobal Aviation, www.transglobalaviation.net. (2) Evergreen Helicopters, Inc., www.evergreenaviation.com. (3) Columbia Helicopters, www.colheli.com. (4) Kamov Helicopters, www.kamov.net. (5) FAS Military Analysis Network, www.fas.org. (6) Category restrictions include not being authorized to fly over populated areas, carry passengers, and operate in multiple countries. (7) PRWeb, www.prweb.com. (8) 102 standard and 47 restricted S-61s in operation. Columbia Columbia S-64E/S-64F CH-54A/CH-54B S-61 (1)(2) 234 (3) 107 (3) KA-32 (4) MIL 26 (5) Manufacturer Erickson Sikorsky Sikorsky Boeing Boeing Kamov MIL Original Production 1962 1962 1959 1962 1964 1980 1977 Country of Origin U.S. U.S. U.S. U.S. U.S. Russia Russia Payload Capacity (lbs) 20,000 / 20,000 / 10,000 26,000 10,000 11,000 44,000 25,000 25,000 Range (nautical miles) 245/227 245/227 470/408 240 207 605 497 Max Speed (knots) 115/104 115/104 165/143 170 143 166 183 Primary Civilian - Firefighting - Firefighting - Firefighting - Firefighting - Firefighting - Firefighting - Firefighting Activities - Timber - Timber - Timber - Timber - Timber - Timber - Timber Harvesting Harvesting Harvesting Harvesting Harvesting Harvesting Harvesting - Construction - Construction - Construction - Construction - Construction - Construction - Passenger - Passenger - Passenger - Passenger - Passenger Transport Transport Transport Transport Transport U.S. and U.S. and Country Country Specific Specific Depends on Configuration In Production Yes No No No No Unknown No Approximate Number in Operation 29 11 102/47 (8) 7 (7) 14 (7) Unknown Unknown Standard Standard Restricted Restricted None Country Specific None None None Geographic Category (6) Operating Restrictions Standard Restricted |
|
|
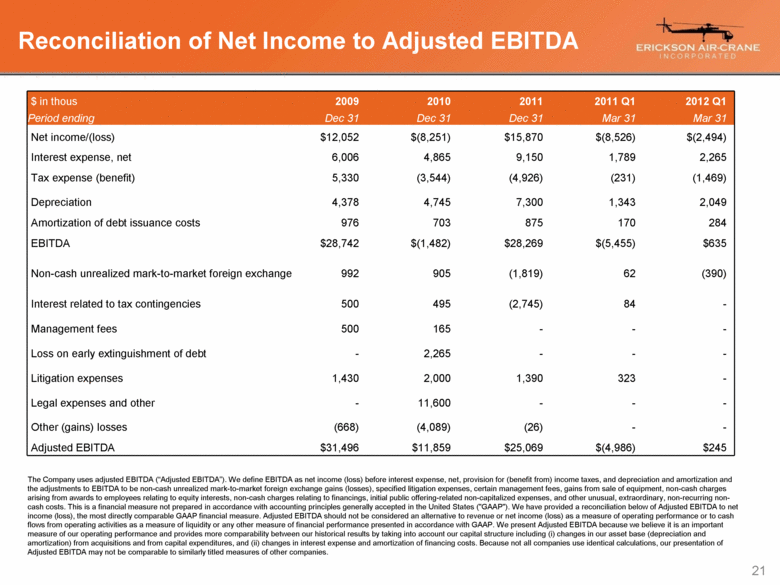
Reconciliation of Net Income to Adjusted EBITDA $ in thous 2009 2010 2011 2011 Q1 2012 Q1 Period ending Dec 31 Dec 31 Dec 31 Mar 31 Mar 31 Net income/(loss) $12,052 $(8,251) $15,870 $(8,526) $(2,494) Interest expense, net 6,006 4,865 9,150 1,789 2,265 Tax expense (benefit) 5,330 (3,544) (4,926) (231) (1,469) Depreciation 4,378 4,745 7,300 1,343 2,049 Amortization of debt issuance costs 976 703 875 170 284 EBITDA $28,742 $(1,482) $28,269 $(5,455) $635 Non-cash unrealized mark-to-market foreign exchange 992 905 (1,819) 62 (390) Interest related to tax contingencies 500 495 (2,745) 84 - Management fees 500 165 - - - Loss on early extinguishment of debt - 2,265 - - - Litigation expenses 1,430 2,000 1,390 323 - Legal expenses and other - 11,600 - - - Other (gains) losses (668) (4,089) (26) - - Adjusted EBITDA $31,496 $11,859 $25,069 $(4,986) $245 The Company uses adjusted EBITDA (“Adjusted EBITDA”). We define EBITDA as net income (loss) before interest expense, net, provision for (benefit from) income taxes, and depreciation and amortization and the adjustments to EBITDA to be non-cash unrealized mark-to-market foreign exchange gains (losses), specified litigation expenses, certain management fees, gains from sale of equipment, non-cash charges arising from awards to employees relating to equity interests, non-cash charges relating to financings, initial public offering-related non-capitalized expenses, and other unusual, extraordinary, non-recurring non-cash costs. This is a financial measure not prepared in accordance with accounting principles generally accepted in the United States ("GAAP"). We have provided a reconciliation below of Adjusted EBITDA to net income (loss), the most directly comparable GAAP financial measure. Adjusted EBITDA should not be considered an alternative to revenue or net income (loss) as a measure of operating performance or to cash flows from operating activities as a measure of liquidity or any other measure of financial performance presented in accordance with GAAP. We present Adjusted EBITDA because we believe it is an important measure of our operating performance and provides more comparability between our historical results by taking into account our capital structure including (i) changes in our asset base (depreciation and amortization) from acquisitions and from capital expenditures, and (ii) changes in interest expense and amortization of financing costs. Because not all companies use identical calculations, our presentation of Adjusted EBITDA may not be comparable to similarly titled measures of other companies. |

