Attached files
| file | filename |
|---|---|
| 8-K - FORM 8-K - ENCORE CAPITAL GROUP INC | d351477d8k.htm |
 ENCORE CAPITAL GROUP
JMP Securities Research Conference
May 14, 2012
PROPRIETARY
Exhibit 99.1 |
 2
CAUTIONARY NOTE ABOUT FORWARD-LOOKING STATEMENTS
The statements in this presentation that are not historical facts, including,
most importantly, those statements preceded by, or that include,
the words
“will,”
“may,”
“believe,”
“projects,”
“expects,”
“anticipates”
or the negation
thereof, or similar expressions, constitute “forward-looking
statements” within
the meaning of the Private Securities Litigation Reform Act of 1995 (the
“Reform Act”).
These statements may include, but are not limited to,
statements regarding our future operating results and growth.
For all
“forward-looking statements,”
the Company claims the protection of the safe
harbor for forward-looking statements contained in the Reform Act.
Such
forward-looking statements involve risks, uncertainties and other factors which
may cause actual results, performance or achievements of the Company and
its subsidiaries to be materially different from any future results,
performance or achievements expressed or implied by such forward-looking
statements. These risks, uncertainties and other factors are discussed in
the reports filed by the Company with the Securities and Exchange
Commission, including the most recent reports on Forms 10-K, 10-Q
and 8-K, each as it may be amended from time to time.
The Company disclaims any intent or obligation
to update these forward-looking statements.
PROPRIETARY |
 3
INVESTMENT HIGHLIGHTS
•
Operating results continue to be strong and surpass our internal
projections
•
Recently completed the acquisition of the market leader in tax
lien transfer business
•
Exiting the underperforming bankruptcy servicing business
•
Significant purchases in late 2011 and early 2012 will drive
growth throughout this year and into 2013
PROPRIETARY
•
Effectively managing through a regulatory environment that
continues to be challenging |
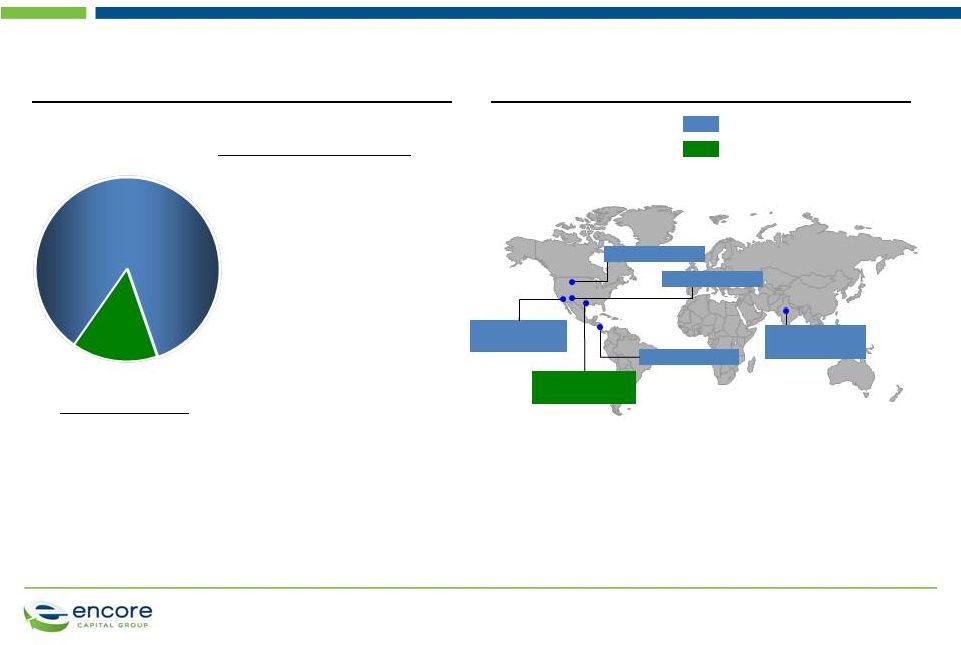 4
ENCORE IS A LEADING PLAYER IN THE CONSUMER DEBT BUYING AND
RECOVERY INDUSTRY
Global Capabilities
St Cloud, MN
San Antonio, TX
Phoenix, AZ
Delhi, India
Call Center /
Technology Site
Call Center Site
Propel Financial
Services
Call Center Site
San Diego, CA
Debt Purchasing & Collections
Tax Lien Purchasing
Headquarters/
Call Center Site
Receivable Portfolio Composition
Pro forma as of March 31, 2012
Debt Purchasing & Collections
Tax Lien Purchasing
•
Purchase and collection of
charged-off unsecured
consumer receivables
(primarily credit card)
•
Robust business model
emphasizing consumer
intelligence and
operational
specialization
•
Invested ~$2.2 billion to
acquire receivables with a
face value of ~$66 billion
•
Acquired ~40 million
consumer accounts
since
inception
•
Consumer and municipality friendly asset class with superior
returns
•
Allows consumers to protect their homes in a cost effective
manner
•
Highly secured position as tax liens rank above almost all other
liens
Call Center Site
Costa Rica
PROPRIETARY
15%
85%
15%
85% |
 5
WE HAVE SIGNIFICANTLY INCREASED OPERATING CASH FLOW
(ADJUSTED EBITDA) AND CASH COLLECTIONS
($M)
*
Adjusted EBITDA is a non-GAAP number. The Company considers Adjusted EBITDA to
be a meaningful indicator of operating performance and uses it as a measure
to assess the operating performance of the Company. See Reconciliation of Adjusted EBITDA to GAAP Net Income at the end of this presentation.
Adjusted EBITDA* and gross collections by year
PROPRIETARY
Gross
collections
Adjusted
EBITDA
24%
CAGR
28%
CAGR
150
250
350
450
550
650
750
850
2007
2008
2009
2010
2011
Q1 2012
TTM |
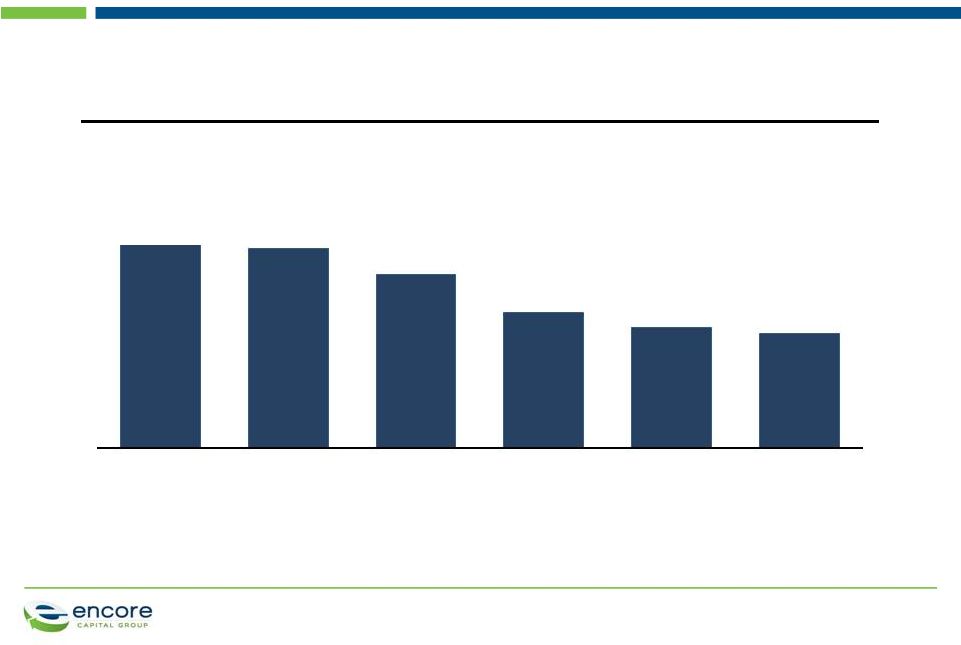 6
WHILE FUNDAMENTALLY CHANGING THE COST STRUCTURE OF THE
COMPANY
PROPRIETARY
51.5
50.2
47.6
43.7
42.2
41.6
Annual, overall cost-to-collect
(%)
2007
2008
2009
2010
2011
Q1 2012
TTM |
 7
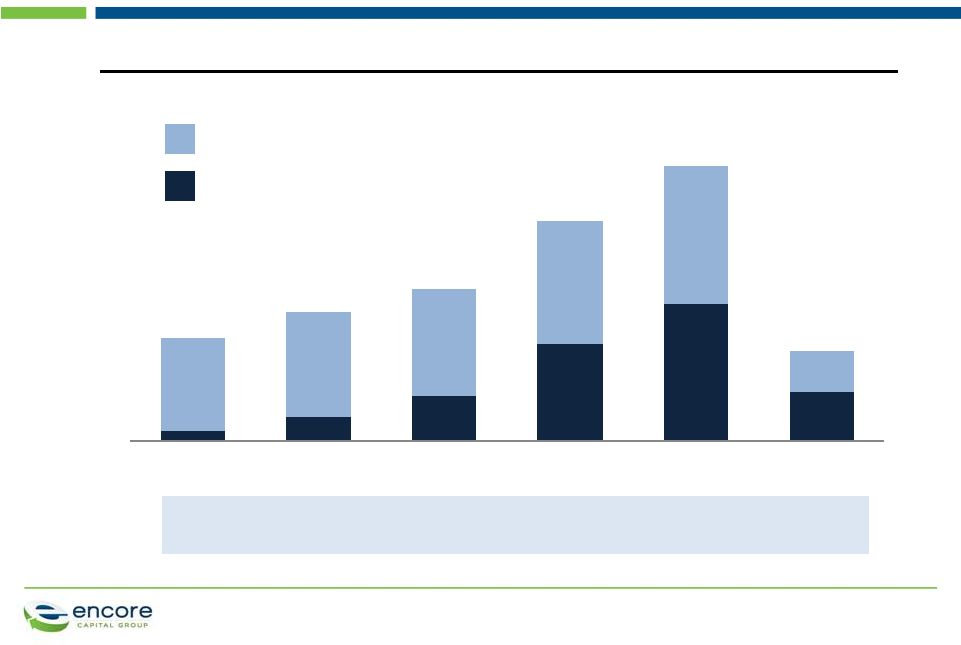
DRIVEN PRIMARILY BY THE GROWTH OF OUR INDIA OPERATIONS
CENTER
Collections from all call centers
($M)
126
157
186
268
Percent
of Total:
10%
19%
30%
44%
336
50%
PROPRIETARY
54%
110
India
U.S.
2007
2008
2009
2010
2011
Q1 2012 |
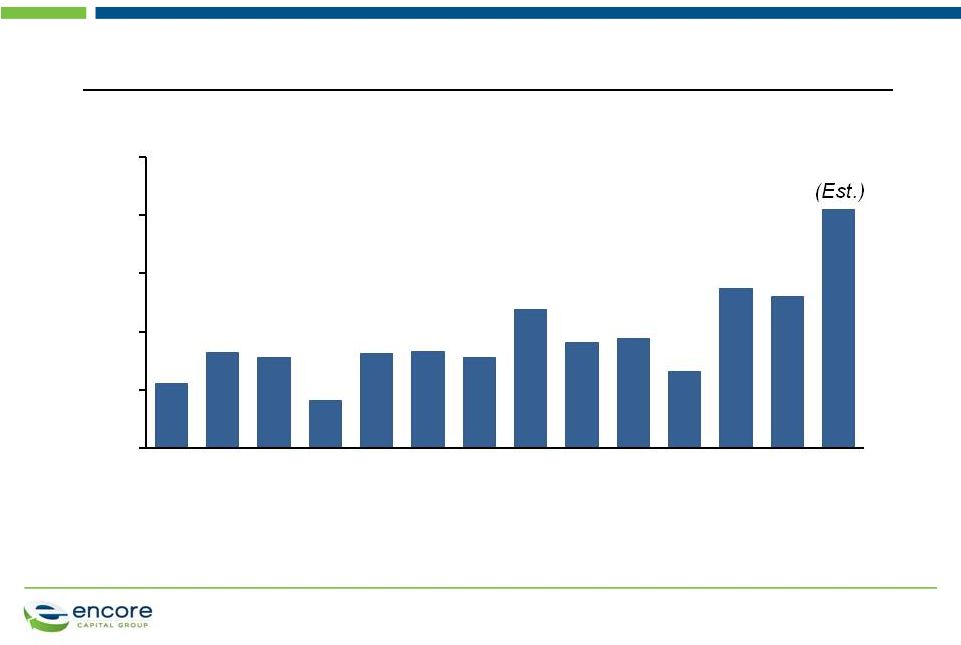 Quarterly purchases
($M)
(Est.)
THE STRONG COLLECTIONS AND IMPROVING COST STRUCTURE
HAVE CONTRIBUTED TO OUR ABILITY TO INCREASE PURCHASES
PROPRIETARY
8
0
50
100
150
200
250
Q1
2009
Q1
2010
Q1
2011
Q1
2012 |
 OUR FLEXIBLE OPERATING PLATFORM ADJUSTS TO DIFFERENT
TYPES OF PORTFOLIOS, ALLOWING US TO MAXIMIZE RETURNS
9
Historical purchase mix by year
($M)
PROPRIETARY |
 10
AND BUILD VALUE FOR THE FUTURE
Annual estimated remaining gross collection (ERC) and total debt
($M, End of period)
PROPRIETARY
1,338
1,724
385
398
0
200
400
600
800
1,000
1,200
1,400
1,600
1,800
2,000
2006
2007
2008
2009
2010
2011
Q1 2012
ERC
Total Debt |
 11
PURCHASING ACCURACY AND OUR ANALYTIC OPERATING MODEL
HAVE LED US TO CONSISTENTLY OUTPERFORM OUR PEERS
Cumulative actual collection multiples by vintage year as of March 31, 2012
(Total Collections / Purchase Price)
Source: SEC Filings, Encore Capital Group Inc.
PROPRIETARY
0.00x
0.50x
1.00x
1.50x
2.00x
2.50x
2005
2006
2007
2008
2009
2010
2011
2012
ECPG
Peer 1
Peer 2 |
 12
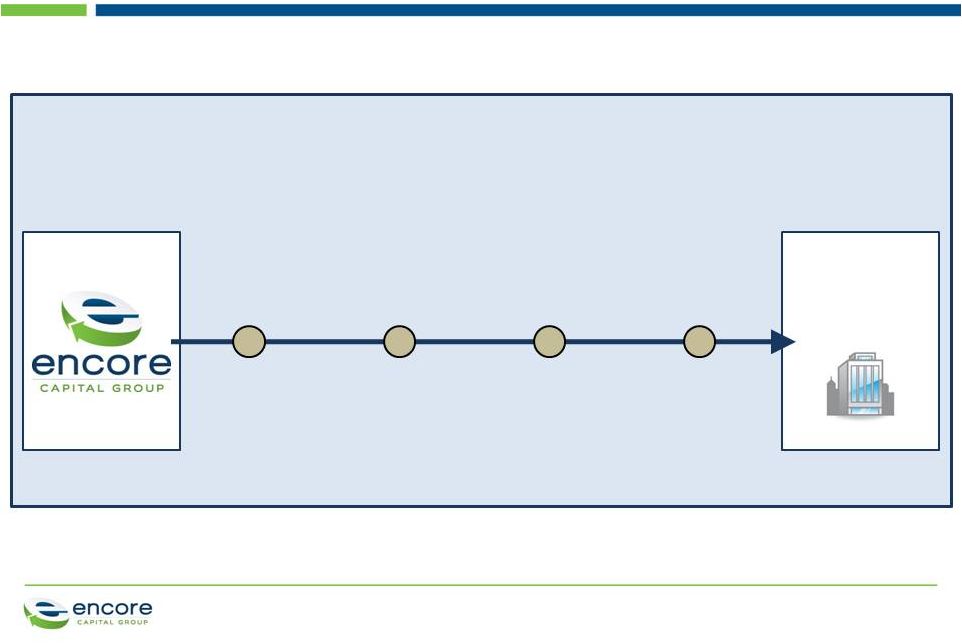
OUR BUSINESS MODEL IS CRITICALLY IMPORTANT, AS IT PROVIDES
THE CONSUMER WITH TIME TO RECOVER
Time frame
Process and
relationship
with consumers
Outcome
•
Charge-off threshold
extends a maximum of
6 months
Transactional
•
Attempt immediate
resolution during
delinquency cycle
(days 30 –
180)
•
Consumer is “charged-
off”
by issuer on day 181
•
Issuer offers to sell
unsecured, charged-off
debt or service through
3rd party agencies
•
Four-to-six month
collection cycle
Pressured
•
Artificial deadlines
•
Multiple collection
companies
•
Counterproductive
incentive structure
•
Consumer is
confused and
frustrated
•
Consumer has 84 months
to recover financially
Partnership
•
Create partnership strategy
and set goals
•
Tailor work strategies to
individual circumstances,
giving time for a consumer
to recover
•
Maximizes likelihood of
repayment, creates
consistency, and ensures
that consumers are treated
fairly
PROPRIETARY
CONTINGENCY
COLLECTION
AGENCY
ORIGINAL
CREDITOR |
 13
WE HAVE POSITIONED OURSELVES TO
ADDRESS REGULATORY CHALLENGES AS THEY EMERGE
Building a consumer intelligence platform, focused on
financially stressed consumers, that can inform policy
discussions and identify strategies to promote financial
recovery
Revamped our consumer relations process and introduced
a Consumer Bill of Rights
Met with leadership of the CFPB and the staff of key federal
and state legislators
Hired a government relations firm and lobbyists in key
states
PROPRIETARY
Consumer
Alignment
Regulatory
Outreach
Advisors
Analytics |
 WE ARE IN THE PROCESS OF TRANSITIONING OUR BANKRUPTCY
BUSINESS TO A NEW, MORE NATURAL OWNER
New,
strategic
owner
Bankruptcy
volumes
have shrunk
ACG has not
been, and
would not
be, material
to Encore
Business
requires a
significant
technology
investment
Buyer has
focused IT and
bankruptcy
expertise, and
currently serves
large, financial
institutions
PROPRIETARY
14 |
 AN EXTENSIVE SEARCH FOR COMPLIMENTARY OPPORTUNITIES LED
US TO THE PROPERTY TAX LIEN SPACE
•
Provides significant portion of municipality
revenue, often used to fund essential services
•
Allows consumers to protect home from
foreclosure and avoid financial penalties
•
Propel enjoys 99% customer satisfaction
scores and was recently recognized as a “Top
Workplace”
by employees
Consumer
focus
Market
opportunity
•
Between $7B and $10B sold each year
•
Tax liens rank above mortgages and other
obligations, and bear high statutory interest
rates
•
Advantageous timing as large players exit
market for non-financial reasons
Encore’s
strengths
•
Consumer intelligence platform focused on
financially stressed consumers and recovery
•
Industry-leading asset valuation methodology
•
Low-cost operational platform dedicated to
building relationships and encouraging
repayment
PROPRIETARY
15
Acquisition of
dominant player
in tax lien space
Geography
Asset class
diversification
Operational
strengths |
 Leading provider of
responsible debt
management and
recovery solutions
for consumers and
property owners
across a broad range
of asset classes
Property
Owners
Structured payment plans to
help residential and commercial
property owners settle tax
obligations and avoid
foreclosure
Consumer
Debt Holders
Robust collection plans to
maximize ability of consumers
to repay obligations and
ensure that consumers are
treated fairly
Financial
Institutions
Payment for
consumer debt
obligations
Municipal
Governments
Payment for residential
and commercial
property tax obligations
PROPRIETARY
16
THIS ACQUISITION EXPANDS UPON OUR ABILITY TO PARTNER WITH
FINANCIALLY STRESSED CONSUMERS |
 THE LARGE VOLUME OF PORTFOLIO PURCHASES AND THE PROPEL
ACQUISITION WILL GENERATE SIGNIFICANT, ONGOING VALUE
Price
Source
of funds
Value
drivers
Nine portfolio purchases
from one seller
Propel acquisition
•
> $100 million
•
$187 million
•
Cash on hand and current
$555.5 million syndicated
lending facility (led by
SunTrust)
•
$160 million syndicated lending
facility (led by Texas Capital
Bank)
•
$65 million from current lending
facility
•
The portfolios are made up of
credit card and consumer debt
obligations
•
We know the products and
consumers well (1/3+ are
already in our database)
•
Large sample size (1.4 million
accounts) greatly increases
confidence in performance
•
Strong asset class that benefits
from our expertise with
distressed consumers
•
Attractive market that can be
served by leveraging our low
cost platform and marketing
experience
•
Consumer and municipality-
friendly
PROPRIETARY
17 |
 WHILE WE REMAIN WELL WITHIN OUR COVENANT LIMITS
($M)
Covenant
analysis
(Encore
actuals
for
2010
and
2011,
Pro
forma
includes
Encore
with
May 2012 competitor portfolio purchases and Propel Financial Services)
Cash flow leverage ratio
Debt
Trailing 4-quarter adjusted EBITDA
Debt/adjusted EBITDA (maximum 2.0x)
Minimum net worth
Excess room
Interest coverage ratio
EBIT/interest expense (minimum 2.0x)
*
Subject to adjustments at closing based on originations and collections
2010
385.3
346.7
1.11
95.1
5.0
2011
389.0
444.9
0.87
133.5
5.7
Pro forma*
Q1 2012 TTM
715.5
515.4
1.39
140.7
4.8
PROPRIETARY
18 |
 IN JUNE, WE WILL PROVIDE ADDITIONAL DETAIL ON THESE
TRANSACTIONS AND OUR GROWTH STRATEGY
Please
join
us
on
June
6
,
2012
for
our
Annual Investor Day meeting in New York
During the meeting we will discuss our evolving
operational and financial strategy, in addition to
providing new details about:
PROPRIETARY
19
•
Purchasing
and
financial
guidance
for
the
remainder of 2012
•
Performance
metrics
and
detailed
growth
strategy for Propel Financial Services
•
Update
on
our
Internal
Legal
platform
and
our
India and Costa Rica call centers
th |
 20
SUMMARY
•
Operating results continue to be strong and surpass our internal
projections
•
Recently completed the acquisition of the market leader in tax
lien transfer business
•
Exiting the underperforming bankruptcy servicing business
•
Significant purchases in late 2011 and early 2012 will drive
growth throughout this year and into 2013
PROPRIETARY
•
Effectively managing through a regulatory environment that
continues to be challenging |
 21
APPENDIX
PROPRIETARY |
 22
APPENDIX A: CUMULATIVE COLLECTIONS BY PORTFOLIO VINTAGE
Cumulative Collections through March 31, 2012 (000’s)
Year
of
Purchase
Purchase
Price
<
2006
2006
2007
2008
2009
2010
2011
2012
Total
CCM
<
2005
$385,471
$974,411
$164,211
$85,333
$45,893
$27,708
$19,986
$15,180
$3,006
$1,335,728
3.5
2005
192,585
66,491
129,809
109,078
67,346
42,387
27,210
18,651
3,636
464,608
2.4
2006
141,027
42,354
92,265
70,743
44,553
26,201
18,306
3,771
298,193
2.1
2007
204,096
68,048
145,272
111,117
70,572
44,035
8,694
447,738
2.2
2008
227,862
69,049
165,164
127,799
87,850
17,456
467,318
2.1
2009
253,362
96,529
206,773
164,605
32,634
500,541
2.0
2010
358,786
125,853
288,788
64,005
478,646
1.3
2011
385,502
123,596
85,220
208,816
0.5
2012
129,998
12,586
12,586
0.1
Total
$2,278,689
$1,040,902
$336,374
$354,724
$398,303
$487,458
$604,394
$761,011
$231,008
$4,214,174
1.8
PROPRIETARY |
 23
APPENDIX B: RECONCILIATION OF ADJUSTED EBITDA
Reconciliation of Adjusted EBITDA to GAAP Net Income
(Unaudited, In Thousands)
Three Months Ended
Note:
The
periods
3/31/07
through
12/31/08
have
been
adjusted
to
reflect
the
retrospective
application
of
ASC
470-20
PROPRIETARY
3/31/07
6/30/07
9/30/07
12/31/07
3/31/08
6/30/08
9/30/08
12/31/08
3/31/09
6/30/09
9/30/09
12/31/09
GAAP net income, as reported
4,991
(1,515)
4,568
4,187
6,751
6,162
3,028
(2,095)
8,997
6,641
9,004
8,405
Interest expense
4,042
4,506
4,840
5,260
5,200
4,831
5,140
5,401
4,273
3,958
3,970
3,959
Contingent interest expense
3,235
888
-
-
-
-
-
-
-
-
-
-
Pay-off of future contingent interest
-
11,733
-
-
-
-
-
-
-
-
-
-
Provision for income taxes
3,437
(1,031)
1,315
2,777
4,509
4,225
2,408
(1,442)
5,973
4,166
5,948
4,609
Depreciation and amortization
869
840
833
810
722
766
674
652
623
620
652
697
Amount applied to principal on receivable portfolios
28,259
29,452
26,114
29,498
40,212
35,785
35,140
46,364
42,851
48,303
49,188
47,384
Stock-based compensation expense
801
1,204
1,281
1,001
1,094
1,228
860
382
1,080
994
1,261
1,049
Impairment charge for goodwill and identifiable
intangible assets
-
-
-
-
-
-
-
-
-
-
-
-
Acquisition related expense
-
-
-
-
-
-
-
-
-
-
-
-
Adjusted EBITDA
45,634
46,077
38,951
43,533
58,488
52,997
47,250
49,262
63,797
64,682
70,023
66,103
3/31/10
6/30/10
9/30/10
12/31/10
3/31/11
6/30/11
9/30/11
12/31/11
3/31/12
GAAP net income, as reported
10,861
11,730
12,290
14,171
13,679
14,775
15,370
17,134
11,406
Interest expense
4,538
4,880
4,928
5,003
5,593
5,369
5,175
4,979
5,515
Contingent interest expense
-
-
-
-
-
-
-
-
-
Pay-off of future contingent interest
-
-
-
-
-
-
-
-
-
Provision for income taxes
6,490
6,749
6,632
9,075
8,601
9,486
9,868
10,351
7,344
Depreciation and amortization
673
752
816
958
1,053
1,105
1,194
1,309
1,363
Amount applied to principal on receivable portfolios
58,265
64,901
63,507
53,427
85,709
83,939
73,187
69,462
104,603
Stock-based compensation expense
1,761
1,446
1,549
1,254
1,765
1,810
2,405
1,729
2,266
Impairment charge for goodwill and identifiable
intangible assets
-
-
-
-
-
-
-
-
10,349
Acquisition related expense
-
-
-
-
-
-
-
-
489
Adjusted EBITDA
82,588
90,458
89,722
83,888
116,400
116,484
107,199
104,964
143,335
|