Attached files
| file | filename |
|---|---|
| 8-K - FORM 8-K - DORCHESTER MINERALS, L.P. | d352600d8k.htm |
 1
Dorchester Minerals, LP
Annual Meeting
May 16, 2012
Dorchester Minerals
NASDAQ: DMLP
Exhibit 99.1 |
 Dorchester Minerals
NASDAQ: DMLP
2
Forward-Looking Statements
•
Portions of this document may constitute "forward-looking
statements" as defined by federal law. Such statements are
subject to certain risks, uncertainties and assumptions.
Should one or more of these risks or uncertainties
materialize, or should underlying assumptions prove
incorrect, actual results may vary materially from those
anticipated, estimated or projected. Examples of such
uncertainties and risk factors include, but are not limited to,
changes in the price or demand for oil and natural gas,
changes in the operations on or development of the
Partnership’s properties, changes in economic and industry
conditions and changes in regulatory requirements (including
changes in environmental requirements) and the
Partnership’s consolidated financial position, business
strategy and other plans and objectives for future operations.
These and other factors are set forth in the Partnership's
filings with the Securities and Exchange Commission.
|
 Dorchester Minerals
NASDAQ: DMLP
3
•
Overview of 2011
–
Distributions and Financial Results
–
Production
–
Reserves
•
Royalty Overview
•
Net Profits Interest Overview
–
Minerals NPI
•
Property Highlights
–
Barnett Shale
–
Hugoton Operations
–
Fayetteville Shale
–
Bakken/Three Forks
–
Permian Basin
•
Developing Plays
Presentation Outline |
 Dorchester Minerals
NASDAQ: DMLP
4
Overview of 2011 Results |
 Dorchester Minerals
NASDAQ: DMLP
5
2011 Distributions
•
Cash Distributions Paid in Calendar 2011
–
Reflects Q4 2010 to Q3 2011 activity
Royalty
Revenue
$47.1 MM
Other
Revenue
$0.6 MM
NPI
Revenue
$10.5 MM
Total Revenue
$58.2 MM
LP
Distribution
$50.7 MM
GP
Distribution
$1.8 MM
Total
Expenses
$5.7 MM |
 Dorchester Minerals
NASDAQ: DMLP
6
2011 Financial Results
Operating Revenue ($MM)
(Accrual Basis)
Gas Price ($/Mcf)
Distributions ($/unit)
(Cash Basis)
•
Revenue –
Price –
Distributions
–
Royalty properties contributed 78% to total operating revenues
–
Gross Revenue
51% gas & plant product sales, 48% oil sales, 1% other revenue
–
NPI and lease bonuses have become a smaller portion of total revenues
Note:
Operating
Revenue
does
not
reflect
production
costs
or
other
expenses
incorporated
in
calculating
the
net
profits
interest
payments |
 Dorchester Minerals
NASDAQ: DMLP
7
2011 Production Overview
Geographic
Breakdown
Fayetteville
Shale
15%
Mid-Continent
(Other)
5%
Permian
Basin
20%
South TX/
Gulf Coast
8%
Miscellaneous
11%
Mid-Continent
(Hugoton NPI)
25%
Daily Production (MMcfepd)
1-year Decline
+18.0%
3-year Decline
+24.1%
Decline Since Inception
+14.2%
Annualized Decline Rate
+1.7%
Production
Profile
•
Total Production of 12.7 Bcfe
–
82% of total production was gas and plant products, 18% oil and condensate
–
High
quality
properties
+
Diverse
portfolio
Low
decline
rate
–
Year-over-year
production
rate
increased
18%
Inclusion
of
Minerals
NPI
Note: Total production on wellhead basis, daily production on sales basis,
gas-oil equivalency of 6:1 ratio used throughout this presentation Barnett
Shale 10%
Rockies
3%
Bakken
3% |
 Dorchester Minerals
NASDAQ: DMLP
2011 Production Overview
8
Daily Equivalent Rate (Mcfed)
2003
50% Royalty
Royalty
Mid-2007
57% Royalty
Q3 2011
72% Royalty
Q4 2011
63% Royalty
Net Profits Interests
•
Historical Production Profile
–
Portfolio has shifted toward royalties over time, but net profits interests have a
new source
of
production
growth
after
inclusion
of
the
Minerals
NPI
Minerals
NPI Payout
-
5,000
10,000
15,000
20,000
25,000
30,000
35,000
40,000
2003
2004
2005
2006
2007
2008
2009
2010
2011 |
 Dorchester Minerals
NASDAQ: DMLP
9
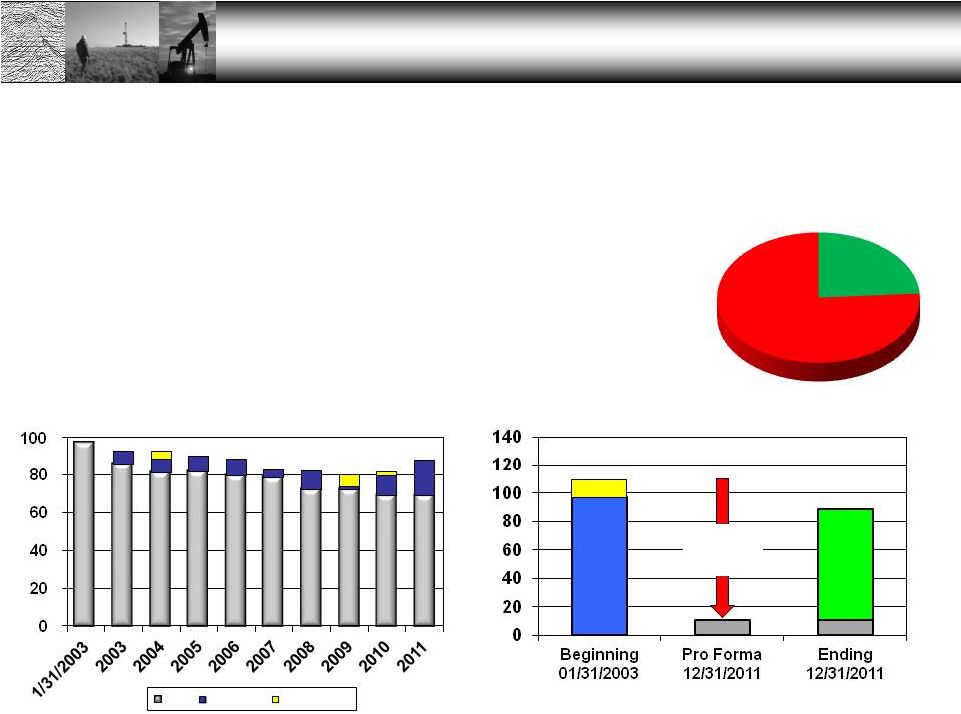
2011 Reserves Overview
•
Total Proved Reserves of 88.4 Bcfe on 12/31/11
Gas &
Products
76%
Oil
24%
Year-end Reserves (Bcfe)
97.0
10.5
Cumulative Reserve Revisions (Bcfe)
2003-2011
Production
(99.0 Bcfe)
–
All reserves are Proved Developed Producing
–
Demonstrated history of positive revisions
–
Revisions accounted for 88% of total reserves at year-end
–
Driven by new plays, field extensions, infill drilling, new
technology, etc.
–
Fayetteville Shale (RI & WI) represent 13% of reserves
Reserve
Revisions
Acquisitions
Pro Forma
Reserves
Note: 12.5 Bcfe of acquired reserves at time transactions closed.
88.4
Total
Reserves
77.9
12.5
109.5
Base
Revisions
Acquisitions |
 Dorchester Minerals
NASDAQ: DMLP
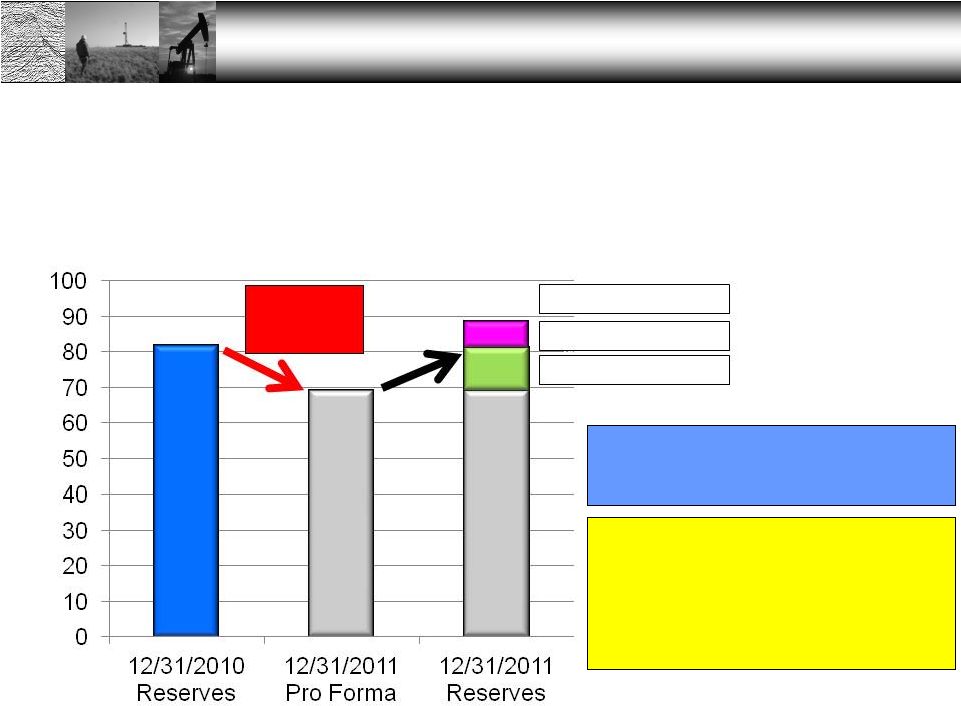
2011 Reserves Overview
10
Equivalent Reserves (Bcfe)
Replacement w/o Minerals NPI
96%
Replacement w/ Minerals NPI
153%
Change in Reserves (2010-2011)
+8.2%
81.7
2011
Production
12.7 Bcfe
7.2
12.2
88.4
•
12/31/2011 Revisions to Reported PDP Reserves
69.0
69.0
Minerals NPI
Base Revisions
Total Reserves
Major sources of upward revisions in
excess of 2011 production:
Minerals NPI
+7.2 Bcfe
Barnett Royalty
+3.4 Bcfe
Fayetteville Royalty +3.0 Bcfe |
 Dorchester Minerals
NASDAQ: DMLP
2011 Reserves Overview
•
Composition of DMLP reserves
Geographic Breakdown
Royalty-NPI Split
Equivalent Reserves (Bcfe)
11
Barnett
8%
Bakken
2%
Other Mid-
Continent
5%
South TX/
Gulf Coast
6%
58.8
Bcfe
Royalty
67%
NPI
33%
29.6
Bcfe
Royalty
NPI
Gas
Oil
0
10
20
30
40
50
60
70 |
 Dorchester Minerals
NASDAQ: DMLP
12
Royalty Overview |
 Dorchester Minerals
NASDAQ: DMLP
13
Royalty Overview
Williston
110,000 net acres
Mid-Continent
35,000 net acres
Texas
152,000 net acres
Gulf Coast
20,000 net acres
Eastern
26,000 net acres
Appalachia
26,000 net acres
Other
4,000 net acres
Rockies
5,000 net acres
•
Diverse Portfolio –
574 counties in 25 states
–
378,000 net mineral acres (2,308,000 gross acres)
–
Varying NPRI’s, ORRI’s and leasehold interests in 862,000 gross
acres –
Majority of acreage is undeveloped
–
Wide geographic spread including most major producing basins
–
Assets range from mature legacy production to areas with exploratory
potential Basin/Area
Legacy
Production
Ongoing
Development
Expansion
Potential
West Texas
Southeast NM
Denver Unit
Wasson
Wolfberry
Bone Springs
Delaware Basin
West TX Overthrust
Gulf Coast
South Texas
Jeffress
McAllen Ranch
Horizontal Wilcox
Mid-Continent
Hugoton
Fayetteville
Horizontal
Granite Wash
Williston
Basin
Nesson
Anticline
Bakken
Red River
Three Forks
Sanish
Appalachia
Marcellus/Utica
Upper Devonian
Note: Acreage count as of 12/31/2011. Gross acres are not additive due to
overlapping ownership among categories |
 Dorchester Minerals
NASDAQ: DMLP
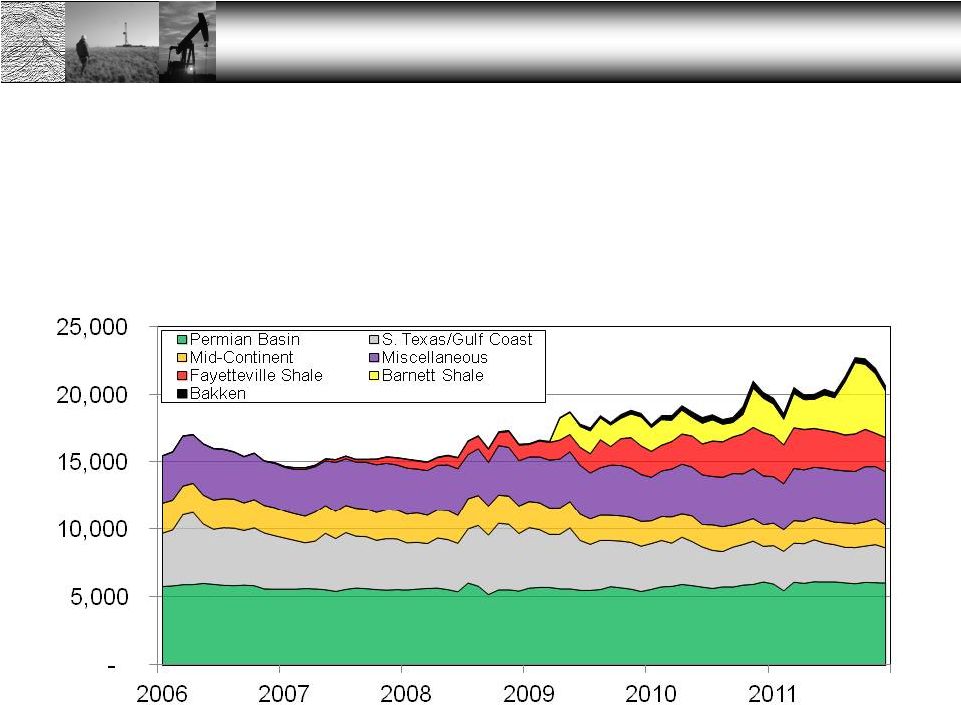
•
Diverse Sources of Production
Royalty Overview
14
–
New plays are replacing declines in legacy assets
–
Opportunities for production growth in mature basins
Daily Equivalent Rate (Mcfed) |
 Dorchester Minerals
NASDAQ: DMLP
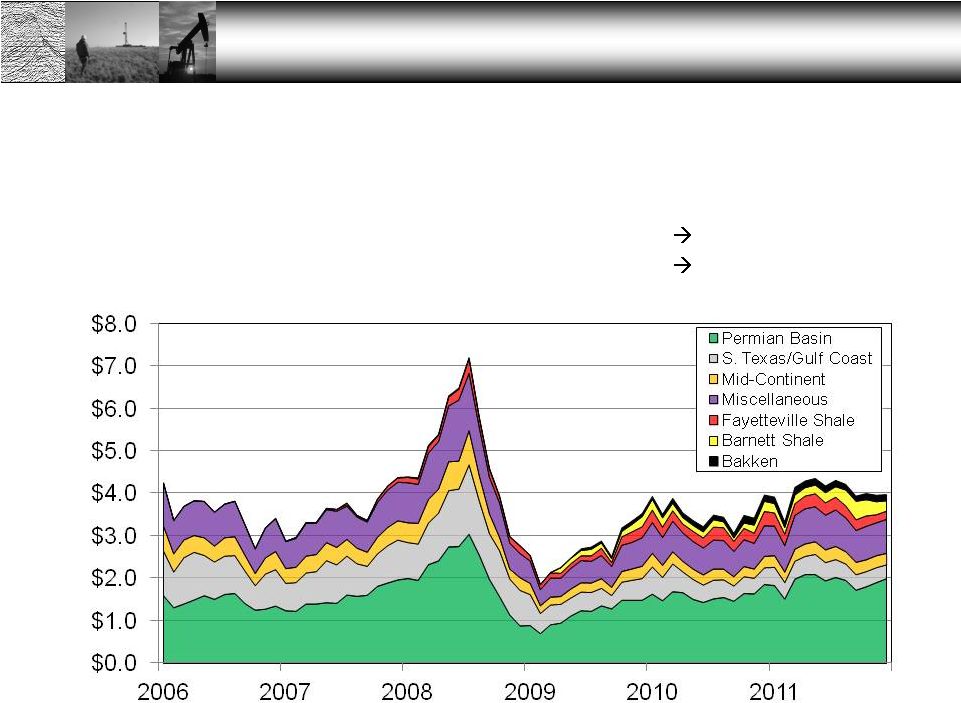
•
Revenue by Geographic Area
Royalty Overview
15
–
Permian Basin revenue share:
32% in March 2009
50% in December 2011
–
South Texas/Gulf Coast share:
30%
in March 2009
8% in December 2011
Net Revenue ($ millions)
Note: Journal Basis Net Revenue |
 Dorchester Minerals
NASDAQ: DMLP
16
Royalty Overview
•
Leasing and Development Activity
–
Consummated 42 leases/elections on 1,127 net acres in 26 counties/ parishes in
seven states
–
Lease bonus payments up to $2,500/acre
–
Initial royalty terms up to 26%
–
Identified 356 new wells on royalty properties in nine states
–
Fayetteville Shale activity decreased in 2011
–
The price disparity between oil and gas has redistributed activity
•
Low gas prices
significant reduction of activity on legacy gas assets
•
High oil prices
increased infill drilling and redevelopment on legacy oil assets
–
85 active lease offers as of May 2012 |
 Dorchester Minerals
NASDAQ: DMLP
17
Net Profits Interests
Overview |
 Dorchester Minerals
NASDAQ: DMLP
18
Net Profits Interests Overview
•
NPI Provides LP Exposure to Working Interest
Potential Without Generating UBTI
–
Four NPI groups were created at the time of formation in 2003 and
two additional NPI groups created subsequently
–
Capitalize on strong negotiating position to capture additional value
–
Leverage information franchise
–
Optional working interest participation in numerous leases
–
Minerals NPI represents the majority of new development activity
–
Added 75 new wells located in Alabama, Arkansas, North Dakota,
Oklahoma and Texas |
 Dorchester Minerals
NASDAQ: DMLP
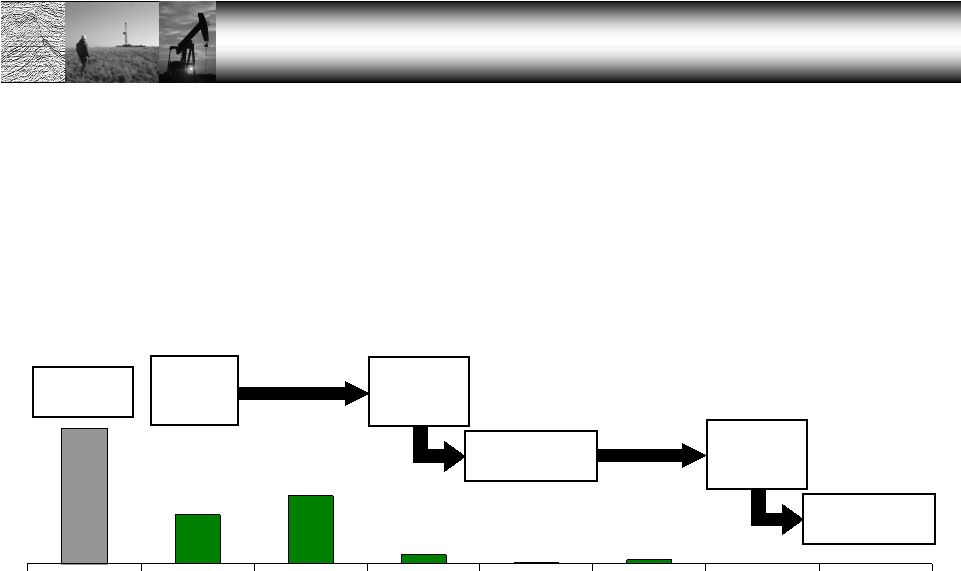
19
Net Profits Interests Overview
Historical NPI CAPEX ($MM)
•
Actual Capital Expenditures Through Year-end 2011
–
$33.3 million of cumulative investments in all net profits interest
properties –
Majority of CAPEX was used to drill new wells in the Minerals NPI
–
Continue to reinvest Minerals NPI cash flow
2011 NPI CAPEX
Note: CAPEX
incurred
by
the
operating
partnership
on
a
cash
basis.
Capital
commitments
are
included
in
calculating
the
Minerals
NPI
payout
status.
$0.0
$1.0
$2.0
$3.0
$4.0
$5.0
$6.0
$7.0
$8.0
Capital Commitments
Development CAPEX
85%
6%
3%
6%
Fayetteville
Bakken
Permian
Other |
 Dorchester Minerals
NASDAQ: DMLP
•
Relative contribution of NPI’s has shifted over time
Net Profits Interests Overview
–
Hugoton
accounted
for
96%
of
NPI
production
at
inception
64%
at
year-end
2011
–
Minerals NPI volumes prior to Q3 2011 were not included in DMLP results
Daily Equivalent Rate (Mcfed)
20 |
 Dorchester Minerals
NASDAQ: DMLP
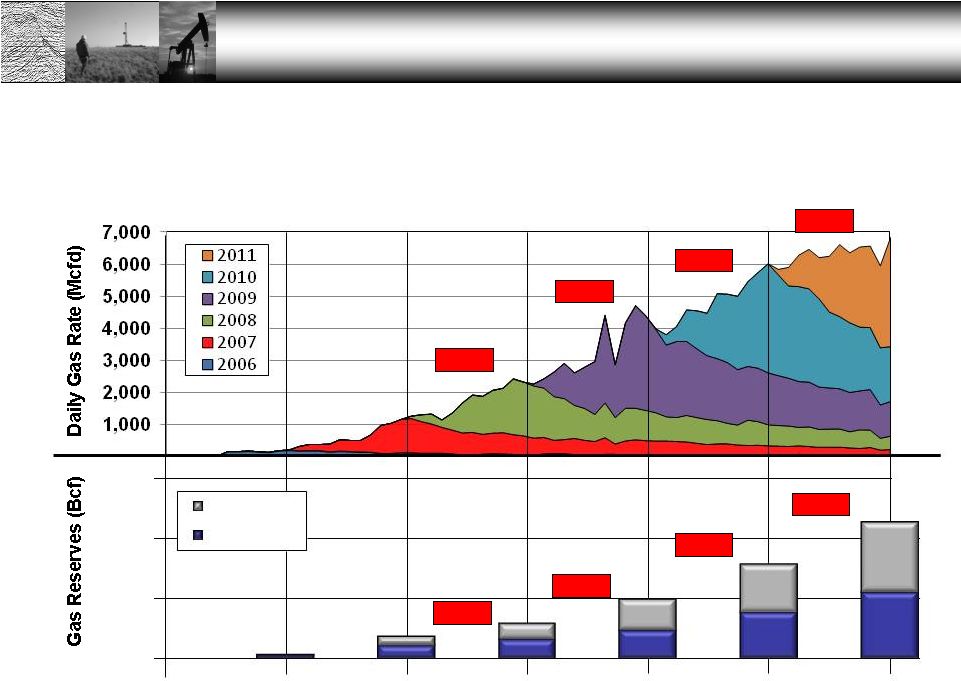
21
Net Profits Interests Overview
•
Minerals NPI Performance
–
Production and reserves have grown steadily since inception
–
337 wells/units producing in Q4 2011 (301 in pay status)
–
5.5 Bcfe in production receipts through year-end 2011
–
Total proved reserves of 7.5 Bcfe at year-end 2011, a 40% increase over 2010
–
Minerals NPI production and reserves are now included in DMLP results
Note: Gas rate based on sales volumes
Proved Reserves (Bcfe)
Net Daily Gas Rate (Mcfd) |
 Dorchester Minerals
NASDAQ: DMLP
•
Minerals NPI Production
Net Profits Interests Overview
22
Daily Equivalent Rate (Mcfed)
–
New Areas: MT Bakken (2005), Fayetteville (2006), ND Bakken (2008), Permian
(2010) –
Additional participation opportunities in West Texas
|
 Dorchester Minerals
NASDAQ: DMLP
23
Net Profits Interests Overview
($MM)
•
Minerals NPI Cash Flow –
Inception through Q1 2012
Cumulative Revenue
$39.4 MM
Cumulative Expense (LOE, taxes, etc)
($7.4 MM)
Cumulative Operating Income
$32.0 MM
Cumulative Investment/Commitments
($30.0 MM)
Cumulative Surplus (Deficit)
$2.0 MM
Cumulative Operating
Income exceeded
Cumulative Investments in
Q3 2011 and the Minerals
NPI began contributing to
LP distributions
Note: Figures provide on a cash basis
($5.0)
($4.0)
($3.0)
($2.0)
($1.0)
$0.0
$1.0
$2.0
$3.0
2003
2004
2005
2006
2007
2008
2009
2010
2011
2012
Investment (including Budgeted Items)
Net Operating Income
Surplus (Deficit) |
 Dorchester Minerals
NASDAQ: DMLP
24
Property Highlights
Barnett Shale |
 Dorchester Minerals
NASDAQ: DMLP
•
Fort Worth Basin –
Tarrant County, Texas
25
–
NRIs range from 0.5% to 20% in 1,824 net mineral acres
–
Current Development Activity (CHK Operated)
•
42 producing wells (5 currently S/I)
•
1 well waiting on completion or pipeline
•
1 permitted location
–
Upside potential in undeveloped acreage, downspacing and improved
stimulation Barnett Shale (Royalty)
Gross Daily Gas Rate (Mcfepd)
Well Count
44 wells/permits
16 new wells brought
on production since
property was acquired
in June 2009
(Average NRI = 18.0%)
DMLP
0
10
20
30
40
50
60
1,000
10,000
100,000
2005
2006
2007
2008
2009
2010
2011 |
 Dorchester Minerals
NASDAQ: DMLP
26
Property Highlights
Hugoton Operated Properties |
 Dorchester Minerals
NASDAQ: DMLP
27
Hugoton Operated Properties (NPI)
•
Hugoton Field –
Oklahoma Panhandle & SW Kansas
–
2011 production within 4% of projection
–
Year-over-year production decline of 7.5% with a 11% decrease in net
reserves –
World-class asset but limited upside potential
–
Ongoing well optimization and cost-saving initiatives
Gas Rate (Mcfepd)
Well Count
Note: Gas rate based on sales volumes
0
50
100
150
200
1,000
10,000
100,000
2003
2004
2005
2006
2007
2008
2009
2010
2011
2012 |
 Dorchester Minerals
NASDAQ: DMLP
28
Property Highlights
Fayetteville
Shale |
 Dorchester Minerals
NASDAQ: DMLP
29
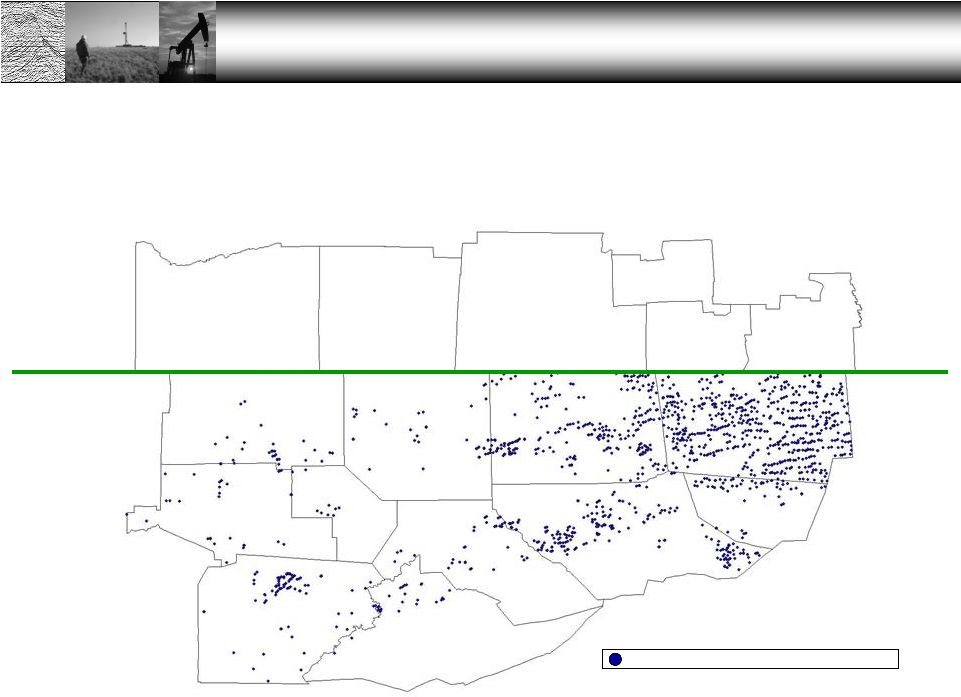
Fayetteville Shale (Royalty & NPI)
•
Eastern
Arkoma
Basin
–
Northern
Arkansas
–
Ownership Summary
–
23,336 gross/11,464 net acres in 196 sections
–
June 2006: Leased 9,800 net acres in 179 sections for 25% royalty with optional
participation in 111 sections (subject to Minerals NPI)
–
June 2011: Leases covering 5,300 net acres expired with remainder of acreage
HBP –
Current development activity on DMLP acreage
375 wells/permits
Dorchester Acreage
Wells with IP > 6 MMcfd
Productive
Fairway
3,757 Producing Wells
637 Active Permits
256 Locations
“Active Permit”
–
well spud but not completed
“Location”
–
well permitted but not spud
•
31 wells permitted and/or proposed by operator
•
7 wells in various stages of drilling, completion or WOPL
•
337 wells completed (276 in pay status) |
 Dorchester Minerals
NASDAQ: DMLP
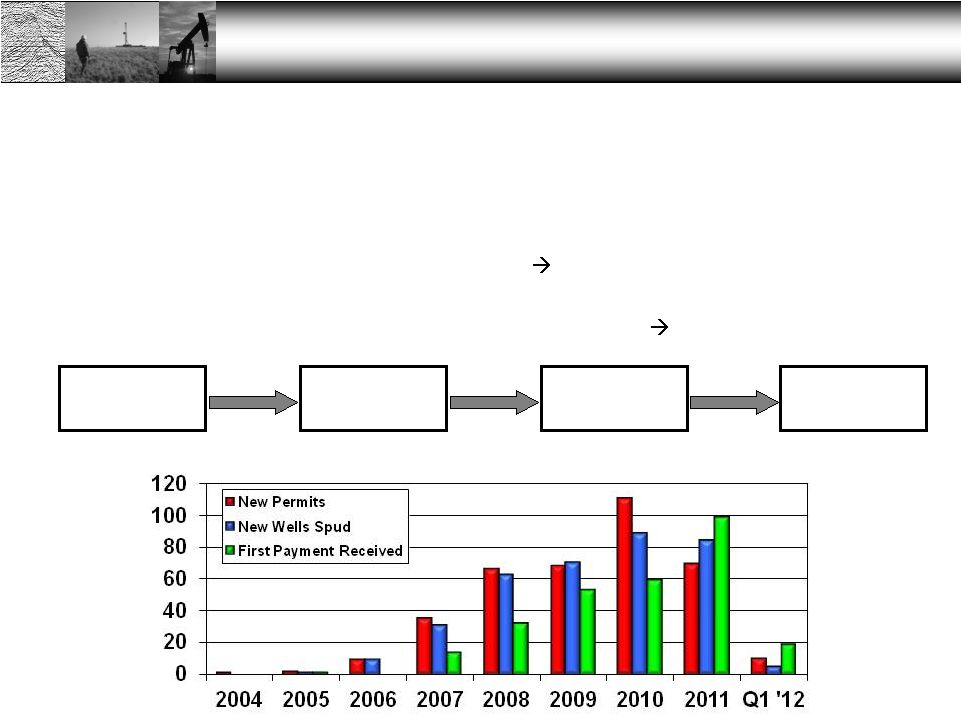
Fayetteville Shale (Royalty & NPI)
–
Development activity by major operators (SWN, BHP, XOM) has slowed
–
In
2011
well
spuds
outpaced
new
permits
drilling
up
permit
inventory
–
Operators have put many old wells into pay status in 2011
–
Substantial
time-lag
between
permit
and
first
payment
408
days
•
Permitting, Drilling and Payment History
First
Payment
First
Production
Well
Spud
Well
Permitted
62 days
132 days
215 days
Well Count
30 |
 Dorchester Minerals
NASDAQ: DMLP
31
•
Capital Expenditures
Fayetteville Shale (Royalty & NPI)
•
2011 Reserves
Proved Reserves (Bcf)
–
Year-end reserves of 11.3 Bcf (285 wells)
•
5.5 Bcf (WI)
•
5.8 Bcf (RI)
–
47% Year-over-year reserve increase
–
Only completed wells with test rates are
included in reserve estimates (no PUDs)
Capital Expenditures ($MM)
–
Total Fayetteville investments of
$21.6 MM through year-end 2011
–
All expenditures within Minerals NPI
–
Average $3.0 MM per well in 2011
–
Drilling and completion costs
increase with longer lateral lengths |
 Dorchester Minerals
NASDAQ: DMLP
32
•
Well Performance
•
Production Results
Fayetteville Shale (Royalty & NPI)
Net Daily Production (Mcfd)
–
301 wells producing at year-end 2011
•
3.3 MMcfd (WI)
•
3.5 MMcfd (RI)
–
31% Year-over-year rate increase
–
Produced 2.3 Bcf in 2011
–
51% of production from royalty interest
Normalized Production Rate (Mcfd)
Months on Production
–
Results indicate that average initial test
rates have reached a plateau
•
2008
2.4 MMcfd (Max 5.5 MMcfd)
•
2009
3.1 MMcfd (Max 5.9 MMcfd)
•
2010
3.0 MMcfd (Max 7.3 MMcfd)
•
2011
3.1 MMcfd (Max 5.5 MMcfd)
Note: Volumes from AOGC, 1 point
on
DMLP
normalize
curve
based
on
estimates
from
partial
month
data
6.8 MMcfd
0
1,000
2,000
3,000
4,000
5,000
6,000
7,000
8,000
2006
2007
2008
2009
2010
2011
Net RI Production
Net WI Production
100
1,000
10,000
0
5
10
15
20
25
30
35
2.0 Bcf (SEECO)
2.5 Bcf (SEECO)
3.0 Bcf (SEECO)
DMLP Average
st |
 Dorchester Minerals
NASDAQ: DMLP
Fayetteville Shale (Royalty & NPI)
33
•
Historical production and reserve additions
+69%
+47%
+60%
+61%
+79%
+76%
+47%
+17%
2010
2009
2008
2007
2006
2011
Royalty Int.
Working Int.
Note: Volumes from AOGC, not all wells in production graph are currently in pay
status 12.0
10.0
8.0
6.0
4.0
2.0
0.0 |
 Dorchester Minerals
NASDAQ: DMLP
34
Well
Number
Test
Date
Test Rate
(Mcfd)
#5-25H36
12/11/2011
3,237
#6-25H36
12/10/2011
3,356
#7-25H36
12/10/2011
3,457
#12-25H36
2/25/2012
3,236
#13-25H36
2/25/2012
3,442
#14-25H36
2/26/2012
3,881
#15-25H36
2/26/2012
3,345
#16-25H36
2/26/2012
4,228
•
Future
Development
Potential
-
Downspacing
–
Example: 25-9N-16W, Conway Co, AR (SWN)
400 ft offsets (50 ac spacing)
–
DMLP
(RI) Ownership:
1.563% NRI
–
DMOLP (WI) Ownership:
0.980% NRI
Deltic Timber 9-16 Unit
Fayetteville Shale (Royalty & NPI) |
 Dorchester Minerals
NASDAQ: DMLP
35
Property Highlights
Bakken/Three Forks |
 Dorchester Minerals
NASDAQ: DMLP
36
Bakken/Three Forks (Royalty & NPI)
•
Williston Basin –
Northwestern North Dakota
–
Diversified acreage position
•
70,390 gross acres/8,905 net acres
–
Operators: Continental, COP, EOG, Hess, Marathon
–
Elected non-consent option in 215 wells to date (125 in pay status)
•
Average royalty of all leases in unit (~16% royalty)
•
Back-in for 100% WI after payout + 50% penalty
•
Working interest subject to Minerals NPI
Well Count
Net Daily Production (boepd)
Initial Royalty Payment
WI Back-in APO |
 Dorchester Minerals
NASDAQ: DMLP
37
Bakken/Three Forks (Royalty & NPI)
•
Six County Core Area
–
Current development activity on DMLP acreage
•
161 wells completed as producers (13 reached payout status)
•
34 wells in various stages of drilling or completion (or confidential)
•
22 wells permitted and/or proposed by operator
–
Rig count has increased +570% since May 2009
–
Eight rigs currently drilling on DMLP acreage
Parshall,
Sanish &
Stanley fields
(426 nma)
EN-Selby
157-93-805H1
King
1-5H
Well Name (Operator)
Test Rate
(boepd)
BPO NRI
APO NRI
Clifford Bakke 26-35 2H (BEXP)
4,291
1.10%
4.94%
Clifford Bakke 26-35 3H (BEXP)
2,807
1.10%
4.94%
Kovaloff 14-9H (Marathon)
1,285
1.88%
11.76%
Behr 16-21H (Fidelity)
1,500
1.00%
4.64%
Intervale 31-35H (COP)
2,750
0.47%
2.91%
EN-Selby 157-93-805H1 (Hess)
591
1.86%
11.65%
Jaguar 1-22H (Zavanna)
1,475
0.75%
4.66%
King 1-5H (Continental Resources)
808
1.16%
7.28%
Jaguar
Clifford Bakke
26-35 2H & 3H
217 wells/permits
Intervale
31-35H
Kovaloff
14-9H
Behr
16-21H
1-22H |
 Dorchester Minerals
NASDAQ: DMLP
38
Property Highlights
Permian Basin |
 Dorchester Minerals
NASDAQ: DMLP
39
Permian Basin (NPI)
•
Bone Springs Play –
Eddy County, New Mexico
–
DMOLP owns a 6.25% working interest in 320 acres
•
Declined farm-out offer and elected to participate with full interest
(Minerals NPI) •
Active operators include Cimarex, COG, Devon and Yates
•
Drilled two horizontal wells testing 859 and 977 boepd in Q1 2012
Gross Daily Rate (boepd)
1 mile |
 Dorchester Minerals
NASDAQ: DMLP
40
Developing Plays |
 Dorchester Minerals
NASDAQ: DMLP
41
Developing Plays
•
Devonian Shale –
Appalachia
–
New York and Pennsylvania
–
Concentrated acreage position
•
32,395 gross acres
•
24,494 net acres
•
70% in Allegany and Steuben Counties, NY
–
Challenging political environment in New York
has limited activity relative to Pennsylvania
–
Potential targets
•
Upper Devonian oil (shallow)
•
Marcellus/Utica/Devonian shale gas (middle)
•
Trenton-Black River gas (deep)
–
Operators: Anadarko, Chesapeake, EOG,
EQT, EXCO, Range, Seneca, Shell, Talisman
–
No reserves booked in 2011
NY
PA
Allegany & Steuben
Counties |
 Dorchester Minerals
NASDAQ: DMLP
•
Southern Tier NY & Northern Tier PA
42
Developing Plays
Allegany
13,216 nma
Steuben
4,714 nma
Chemung
308 nma
Schuyler
459 nma
Tioga
163 nma
Bradford
Potter
846 nma
McKean
1,158 nma
Cattaraugus
Tioga
41 nma
NY
PA
NY
PA
Horizontal Marcellus Well/Permit
Elk
28 nma
Cameron
56 nma
Clinton
256 nma
Lycoming
468 nma
Sullivan
Centre
196 nma
Clearfield
579 nma |
 Dorchester Minerals
NASDAQ: DMLP
43
Dorchester Minerals, LP
Annual Meeting
May 16, 2012 |
 Dorchester Minerals
NASDAQ: DMLP
44
Appendix |
 Dorchester Minerals
NASDAQ: DMLP
45
•
What is the Minerals NPI and How Does it Work?
Appendix
–
Upon its formation, Dorchester Minerals, LP (DMLP, the public partnership and owner
of the mineral interests) provided for future development opportunities on its
undeveloped mineral interests by the creation of the Minerals Net Profits
Interest (Minerals NPI). –
DMLP has negotiated and may continue to negotiate the right but not the obligation to
participate in development activity in addition to retaining a royalty
interest. –
This right may take the form of an optional heads-up (unpromoted) working
interest, carried working interest or reversionary (back-in) working
interest. In some instances, an unleased mineral interest may be treated as a
working interest subject to statutory non-consent provisions.
–
DMLP assigns this right to Dorchester Minerals Operating LP (the
operating partnership or DMOLP)
subject to the terms of the Minerals NPI.
–
DMOLP is an indirect wholly owned affiliate of DMLP’s General Partner.
–
DMOLP funds all costs associated with this right, including drilling and completion
costs. –
DMLP and its partners are not liable for any costs or expenses.
–
DMOLP pays to DMLP 96.97% of the monthly “Net Proceeds”
attributable to the properties subject to the
Minerals NPI.
–
Net Proceeds is defined as total revenues less total expenses plus an amount
equivalent to interest at a prevailing rate on any prior period deficit
balance. In other words, DMOLP pays 100% of all costs, receives 100% of all
revenues plus interest, and thereafter (sometimes called “Payout”) pays 96.97% of
net cashflow to DMLP.
–
LP distributions reflect 96% of royalty net cashflow and 99% of NPI net cashflow
99% x 96.97% = 96%.
–
The Minerals NPI achieved payout status in September 2011 and contributed to our Q4
2011 distribution. |
 Dorchester Minerals
NASDAQ: DMLP
46
Appendix
DMLP
Lease to third party for
royalty and optional
participation right
Participation right
assigned to DMOLP
NPI payment
(96.97% of cash flow)
Distributable Cash
DMOLP pays 100% of costs and
receives 100% of revenue
plus interest equivalent on
total NPI basis
Royalty
(100% of cash flow)
General
Partner
4% of
royalties
1% of NPI’s
4% of Expenses
Limited
Partners
96% of
royalties
99% of NPI’s
96% of Expenses
•
What is the Minerals NPI and How Does it Work? |
 Dorchester Minerals
NASDAQ: DMLP
47
Appendix
•
Distribution Determinations
4% of Net Cash Receipts from Royalty Properties
$ --------
$1,682
96% of Net Cash Receipts from Royalty Properties
$40,365
$ --------
1% of Net Profits Interests Paid to our Partnership
$ --------
$ 104
Total Distributions
$50,719
$1,786
99% of Net Profits Interests Paid to our Partnership
$10,354
$ --------
Operating Partnership Share (3.03% of Net Proceeds)
$ --------
$ 327
Total General Partner Share
$2,113
% Total
96%
4%
Limited
Partners
General
Partner
–
Period from October 2010 through September 2011
($ thousands) |
 Dorchester Minerals
NASDAQ: DMLP
48
Appendix
2011 Cash
Distributions
$52.5 MM
Mgmt GP
Mgmt LP*
Other LP
$1.8 MM
$6.0 MM
$44.7 MM
Mgmt LP is 3.3
times Mgmt GP
•
Alignment of GP and LP interests
–
GP
has
no
incentive
distribution
rights
–
fixed
sharing
ratio
–
Management’s LP interest exceeds its GP interest
–
Not incentivized to make dilutive transactions
85.2 %
11.4 %
3.4 %
* Management LP interest includes
LP units owned by officers, directors
and their immediate families. |
 Dorchester Minerals
NASDAQ: DMLP
49
•
Operating Leverage –
Royalty Interest vs. NPI
Appendix
Net Profits Interest
Royalty Interest
1,000 Mcf
$4.00/Mcf
$4,000
($0)
$4,000
25% Royalty
$1,000
1,000 Mcf
$5.00/Mcf
$5,000
($0)
$5,000
25% Royalty
$1,250
1,000 Mcf
$4.00/Mcf
$4,000
($1,000)
$3,000
25% NPI
$750
1,000 Mcf
$5.00/Mcf
$5,000
($1,000)
$4,000
25% NPI
$1,000
25% Increase in
Royalty Cash Flow
33% Increase in
NPI Cash Flow
25% Increase in Gas Price
Production Volume
Gas Price
Revenue
Fixed Production Costs
Operating Income
Net Interest
Net Cash Flow
Production Volume
Gas Price
Revenue
Fixed Production Costs
Operating Income
Net Interest
Net Cash Flow |
 Dorchester Minerals
NASDAQ: DMLP
50
Appendix
Oil and Gas
Produced
Cash
receipts
begin
1st Quarter
Distribution
declared
Dist. Paid
(Feb-Mar cash)
2nd Quarter
Distribution
declared
Dist. Paid
(Apr-Jun cash)
LP distribution of all cash attributable to January production
may occur as late as August, a 7-month time lag
•
Royalty Cash Receipts
–
Long delay between production and cash distribution
–
Cash receipts extend over multiple months due to adjustments, releases, etc.
–
Prices
can
change
dramatically
between
production
and
payment
of
distribution
–
Example of a typical cash receipt cycle :
Jan-11
Feb-11
Mar-11
Apr-11
May-11
Jun-11
Jul-11
Aug-11 |
 Dorchester Minerals
NASDAQ: DMLP
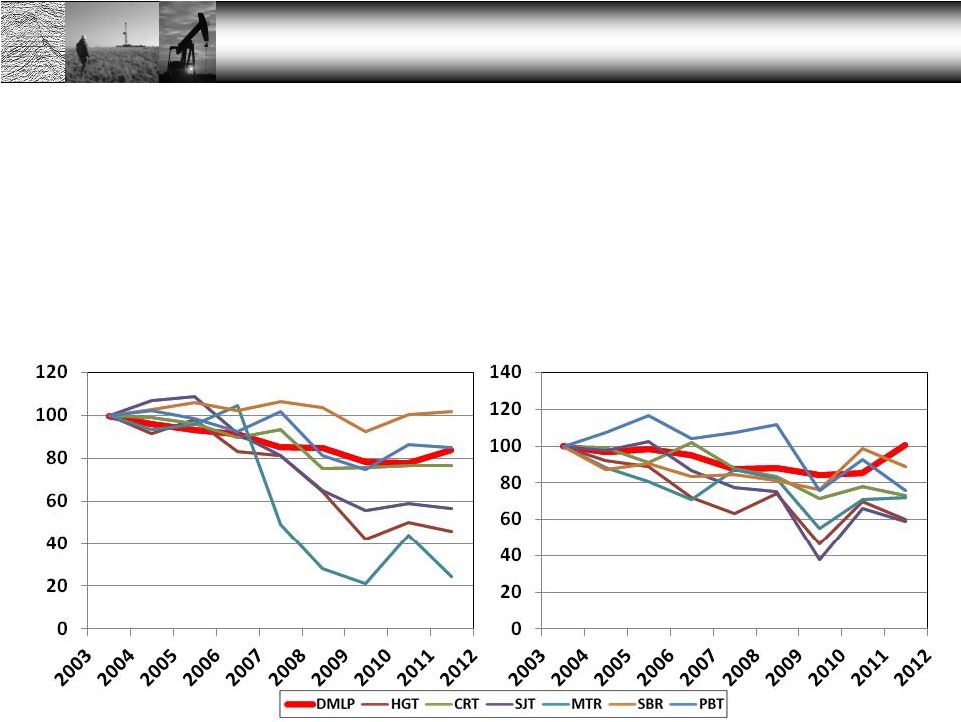
51
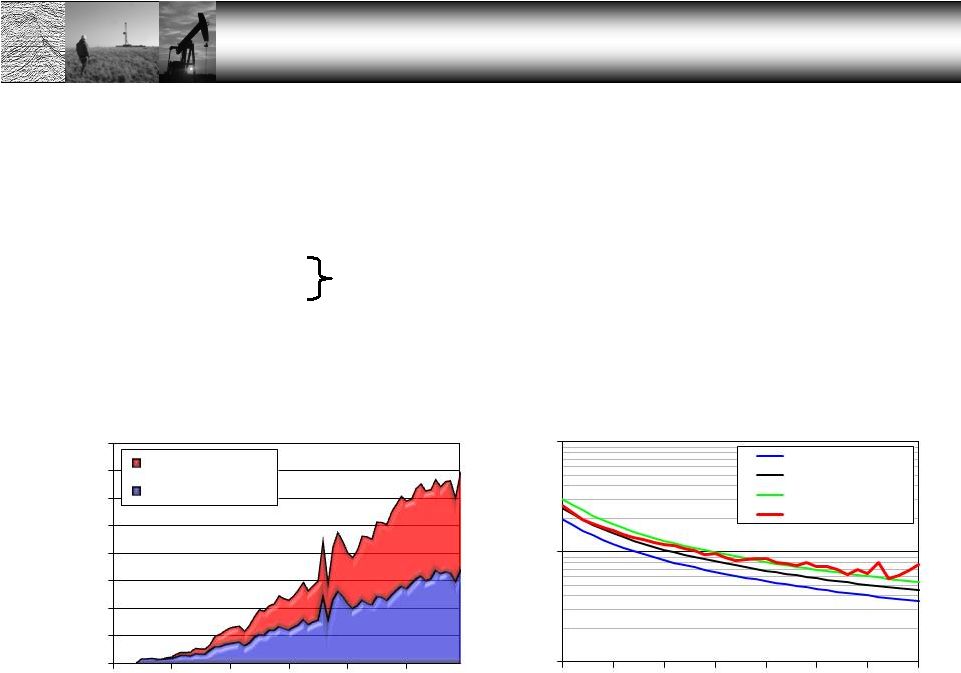
Peer Group Comparison
YTD 2012 Normalized Returns (reinvested)
2003-2011 Normalized Returns (reinvested)
•
Market Performance
–
Pure
royalties
lack
operating
leverage
inherent
in
net
profits
interests
Less
volatility
•
Underperforming in high price environment (mid-2008)
•
Outperforming in low price environment (mid-2009) due to lower fixed cost
structure Note: Dist. reinvested on last day of quarter
|
 Dorchester Minerals
NASDAQ: DMLP
52
Peer Group Comparison
•
Reserves and Production Performance
–
DMLP is a cross between a royalty trust with 100% net profits interests (SJT) and
one with 100% royalties (SBR), plus the upside of a large non-producing
mineral portfolio with potential for future drilling and development
–
DMLP has the ability to expand its portfolio of assets through acquisitions
DMLP adjusted for issuance of additional units
Normalized Production (Indexed to 2003)
Normalized Reserves (Indexed to 2003) |