Attached files
| file | filename |
|---|---|
| 8-K - KANSAS CITY POWER & LIGHT CO | f8kirdeck5-14.htm |

Great Plains Energy
Investor Presentation
May 2012
May 2012 Investor Presentation

Statements made in this presentation that are not based on historical facts are forward-looking, may involve risks and
uncertainties, and are intended to be as of the date when made. Forward-looking statements include, but are not limited to,
the outcome of regulatory proceedings, cost estimates of capital projects and other matters affecting future operations. In
connection with the safe harbor provisions of the Private Securities Litigation Reform Act of 1995, Great Plains Energy and
KCP&L are providing a number of important factors that could cause actual results to differ materially from the provided
forward-looking information. These important factors include: future economic conditions in regional, national and
international markets and their effects on sales, prices and costs, including but not limited to possible further deterioration in
economic conditions and the timing and extent of economic recovery; prices and availability of electricity in regional and
national wholesale markets; market perception of the energy industry, Great Plains Energy and KCP&L; changes in business
strategy, operations or development plans; effects of current or proposed state and federal legislative and regulatory actions
or developments, including, but not limited to, deregulation, re-regulation and restructuring of the electric utility industry;
decisions of regulators regarding rates the companies can charge for electricity; adverse changes in applicable laws,
regulations, rules, principles or practices governing tax, accounting and environmental matters including, but not limited to,
air and water quality; financial market conditions and performance including, but not limited to, changes in interest rates and
credit spreads and in availability and cost of capital and the effects on nuclear decommissioning trust and pension plan assets
and costs; impairments of long-lived assets or goodwill; credit ratings; inflation rates; effectiveness of risk management
policies and procedures and the ability of counterparties to satisfy their contractual commitments; impact of terrorist acts,
including but not limited to cyber terrorism; ability to carry out marketing and sales plans; weather conditions including, but
not limited to, weather-related damage and their effects on sales, prices and costs; cost, availability, quality and deliverability
of fuel; the inherent uncertainties in estimating the effects of weather, economic conditions and other factors on customer
consumption and financial results; ability to achieve generation goals and the occurrence and duration of planned and
unplanned generation outages; delays in the anticipated in-service dates and cost increases of additional generation,
transmission, distribution or other projects; the inherent risks associated with the ownership and operation of a nuclear facility
including, but not limited to, environmental, health, safety, regulatory and financial risks; workforce risks, including, but not
limited to, increased costs of retirement, health care and other benefits; and other risks and uncertainties.
This list of factors is not all-inclusive because it is not possible to predict all factors. Other risk factors are detailed from time
to time in Great Plains Energy’s and KCP&L’s quarterly reports on Form 10-Q and annual report on Form 10-K filed with the
Securities and Exchange Commission. Each forward-looking statement speaks only as of the date of the particular statement.
Great Plains Energy and KCP&L undertake no obligation to publicly update or revise any forward-looking statement, whether
as a result of new information, future events or otherwise.
Forward-Looking Statement
2
May 2012 Investor Presentation

Overview
3
May 2012 Investor Presentation
• Solid Midwest fully regulated electric utility operating under the
KCP&L brand
KCP&L brand
• Company attributes
– Regulated operations in Kansas and Missouri
– ~826,000 customers / 3,100 employees
– ~6,600 MW of primarily low-cost coal baseload generation
– ~3,600 circuit miles of transmission lines; ~ 22,200 circuit
miles of distribution lines
miles of distribution lines
– ~$9.1bn in assets at 2011YE
– ~$5.6bn in rate base at 2011YE
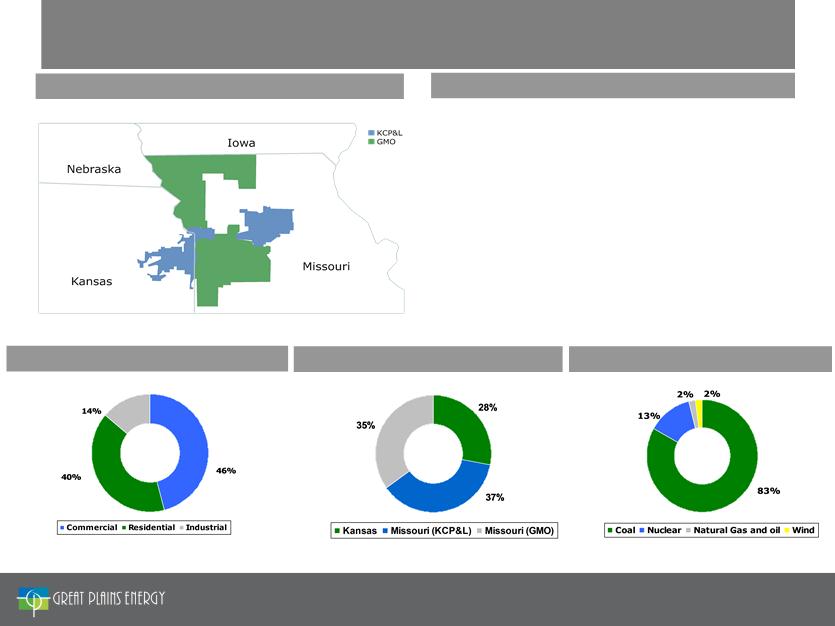
Service Territories: KCP&L and GMO
Business Highlights
2011 Retail MWh Sold by Customer Type
2011 Retail MWh Sales by Jurisdiction
2011 MWh Generated by Fuel Type
Total: ~ 23,404 MWhs*
Total: ~ 23,404 MWhs*
Total: ~ 25,952 MWhs*
Solid Vertically-Integrated Midwest Utility
* In thousands
4
May 2012 Investor Presentation
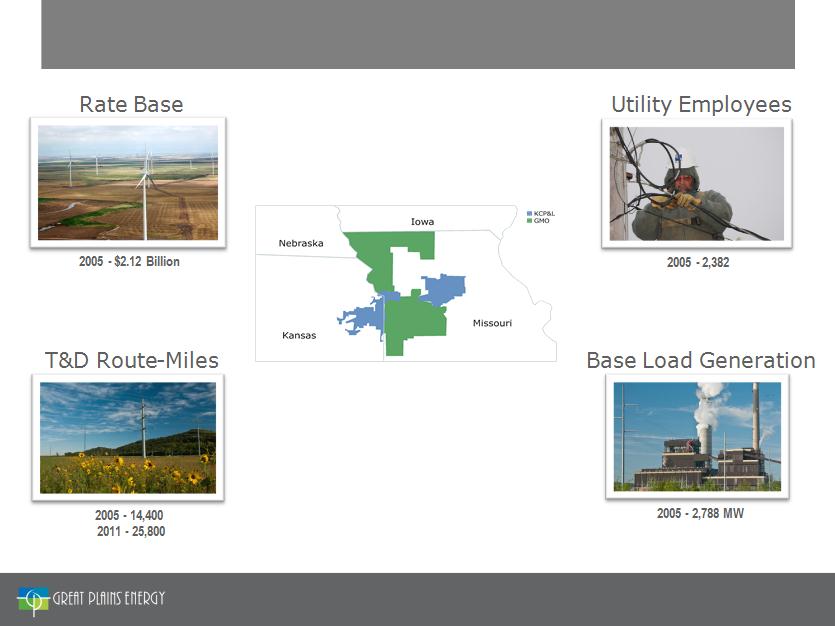
GXP’s Transformation: 2005 - 2011
2011 - 3,053
INCREASE = 28%
2005 - 500,000
2011 - 823,000
INCREASE = 65%
INCREASE = 79%
2011 - 4,349 MW
INCREASE = 56%
2011 - $5.59 Billion
INCREASE = 164%
Customers
5
May 2012 Investor Presentation

Focused on Delivering Value to Shareholders
Earnings Growth
Expected Through Reduced Regulatory Lag, Disciplined Cost
Management and Long-Term Rate Base Growth
Management and Long-Term Rate Base Growth
Competitive Dividend
Goal to Maintain Competitive Dividend While Strengthening Key Credit
Metrics; Objective to Grow Dividend In Line With Payout Ratio Targets
Metrics; Objective to Grow Dividend In Line With Payout Ratio Targets
Objective: Improved Total Shareholder Returns
6
May 2012 Investor Presentation

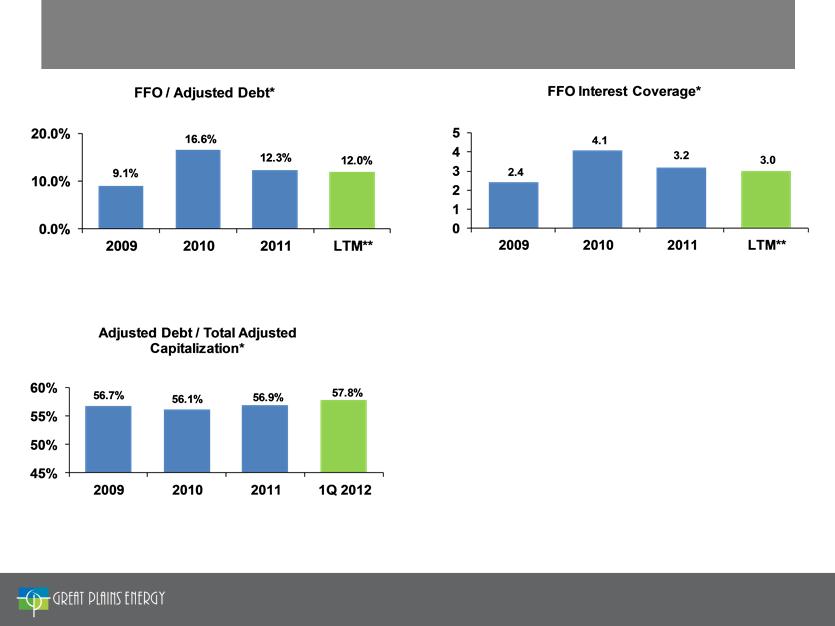
• Strong emphasis on improving credit metrics
– Objective is visibility to sustainable FFO / Adjusted Debt* of 16%+
• Dividend is reviewed quarterly in context of this objective as well as a
belief that a sustainable and increasing dividend is a key driver of TSR
and therefore a desirable goal
belief that a sustainable and increasing dividend is a key driver of TSR
and therefore a desirable goal
• Target payout ratio remains 50-70%
Commitment to Solid Dividend
Competitive Dividend
Goal to Maintain Competitive Dividend While Strengthening Key Credit
Metrics; Objective to Grow Dividend In Line With Payout Ratio Targets
Metrics; Objective to Grow Dividend In Line With Payout Ratio Targets
• Company’s objective is to create shareholder value through
– Increased earnings from reduced lag, disciplined cost management and long-
term asset growth
term asset growth
– A competitive dividend that complements this growth platform
*FFO / Adjusted Debt is a non-GAAP measure that is defined in the Appendix
7
May 2012 Investor Presentation

• Proven track record of constructive regulatory treatment
• Credibility with regulators in terms of planning and execution of large, complex projects
• Competitive retail rates on a regional and national level supportive of potential future
investment
investment
Diligent Regulatory
Approach
Approach
• Target significant reduction in regulatory lag
• Seek to deliver earnings growth and increasing and sustainable cash dividends as a key
component of TSR
component of TSR
• Improvement in / stability of key credit metrics is a priority
Focused on
Shareholder Value
Creation
Shareholder Value
Creation
Excellent Relationships
with Key Stakeholders
with Key Stakeholders
• Customers - focused on top tier customer satisfaction
• Suppliers - strategic supplier alliances focused on long-term supply chain value
• Employees - strong relations between management and labor (3 IBEW locals)
• Communities - leadership, volunteerism and high engagement in the areas we serve
• Environmental - additional ~$1 billion of “High Likelihood” capital projects planned to
comply with existing / proposed environmental rules
comply with existing / proposed environmental rules
• Transmission - formed Transource Energy, LLC joint venture to pursue competitive
transmission projects
transmission projects
• Renewables - driven by Collaboration Agreement and MO/KS RPS
• Other Growth Opportunities - selective future initiatives that will leverage our core
strengths
strengths
Attractive Platform for
Long-Term Growth
Long-Term Growth
GXP - Platform for Shareholder Value
8
May 2012 Investor Presentation

Operations and Regulatory Strategy
9
May 2012 Investor Presentation
Environmental
• Estimated cost of compliance with current
/ proposed legislation = approximately $1
billion:
/ proposed legislation = approximately $1
billion:
– La Cygne
• Unit 1 (368 MW*) - scrubber
and baghouse - 2015
and baghouse - 2015
• Unit 2 (343 MW*) - full Air
Quality Control System
(“AQCS”) - 2015
Quality Control System
(“AQCS”) - 2015
– Montrose 3 (176 MW) - full AQCS -
2020 (approximately)
2020 (approximately)
– Sibley 3 (364 MW) - scrubber and
baghouse - 2017 (approximately)
baghouse - 2017 (approximately)
• Other retrofits less likely and therefore not
included in estimated cost of compliance:
included in estimated cost of compliance:
– Montrose 1 (170 MW)
– Montrose 2 (164 MW**)
– Sibley 1 and 2 (total capacity 99
MW)
MW)
– Lake Road 4 and 6 (93 MW**)
Upon completion of La Cygne during the second quarter 2015, we expect that
72 percent of our coal fleet will have emission-reducing scrubbers installed.
72 percent of our coal fleet will have emission-reducing scrubbers installed.
Net book value of “Less
Likely” projects total
approximately $100 million
Likely” projects total
approximately $100 million
|
* KCP&L’s share of jointly-owned facility
|
|
** In connection with KCP&L’s and GMO’s Integrated Resource Plan (IRP) filings with the Missouri Public Service Commission in April 2012, these projects may
move from less likely to more likely but it is not expected to materially impact the overall $1 billion current estimate of capital expenditures. |
10
May 2012 Investor Presentation
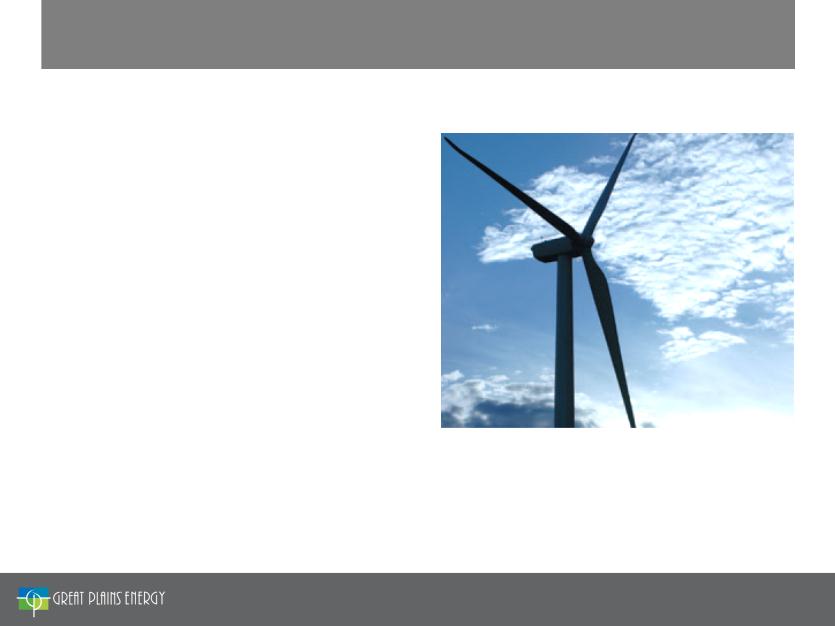
Renewable Energy and Energy Efficiency
• Company-owned assets and commitments
in place that will increase renewable
portfolio to approximately 600 MW of wind
and hydroelectric power
in place that will increase renewable
portfolio to approximately 600 MW of wind
and hydroelectric power
• Future renewable requirements driven by
the Renewable Portfolio Standards (“RPS”)
in Missouri and Kansas
the Renewable Portfolio Standards (“RPS”)
in Missouri and Kansas
• Flexibility regarding acquisition of future
renewable resources:
renewable resources:
– Through Purchased Power Agreements
(“PPAs”) and purchases of Renewable
Energy Credits (“RECs”); or
(“PPAs”) and purchases of Renewable
Energy Credits (“RECs”); or
– Adding to rate base if supported by
credit profile and available equity and
debt financing
credit profile and available equity and
debt financing
• Energy efficiency expected to be a key
component of future resource portfolio:
component of future resource portfolio:
– Aggressive pursuit planned with
appropriate regulatory recovery
appropriate regulatory recovery
The 99 turbines at our Spearville, Kan., Wind Energy Facility produce
enough environmentally friendly, emission-free electricity to supply
enough environmentally friendly, emission-free electricity to supply
nearly 49,000 homes annually.
11
May 2012 Investor Presentation
Transmission
• Formed Transource Energy, LLC, a
joint venture with American Electric
Power, to pursue competitive
transmission projects
joint venture with American Electric
Power, to pursue competitive
transmission projects
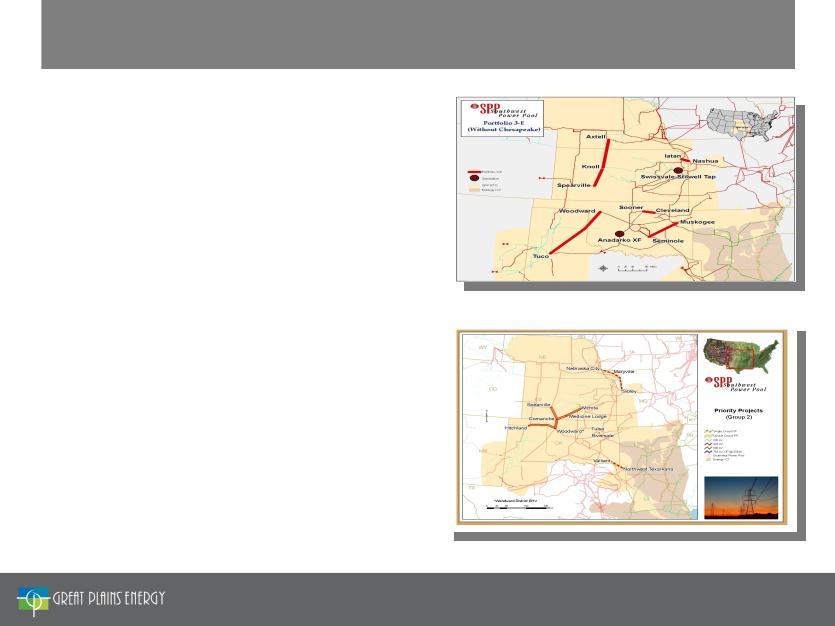
• GXP will seek regulatory approval to
novate two significant projects to
Transource:
novate two significant projects to
Transource:
– Iatan-Nashua 345kV line -
Projected $54M total cost and
2015 in-service date
Projected $54M total cost and
2015 in-service date
– Sibley-Maryville-Nebraska City
345kV line - Projected $380M
total cost and 2017 in-service
date
345kV line - Projected $380M
total cost and 2017 in-service
date
Iatan-Nashua 345kV, 30 miles, $54M
Expected in-service: 2015
Sibley-Maryville-Nebraska City 345kV, 170 miles,
projected cost ~$380M
projected cost ~$380M
12
May 2012 Investor Presentation

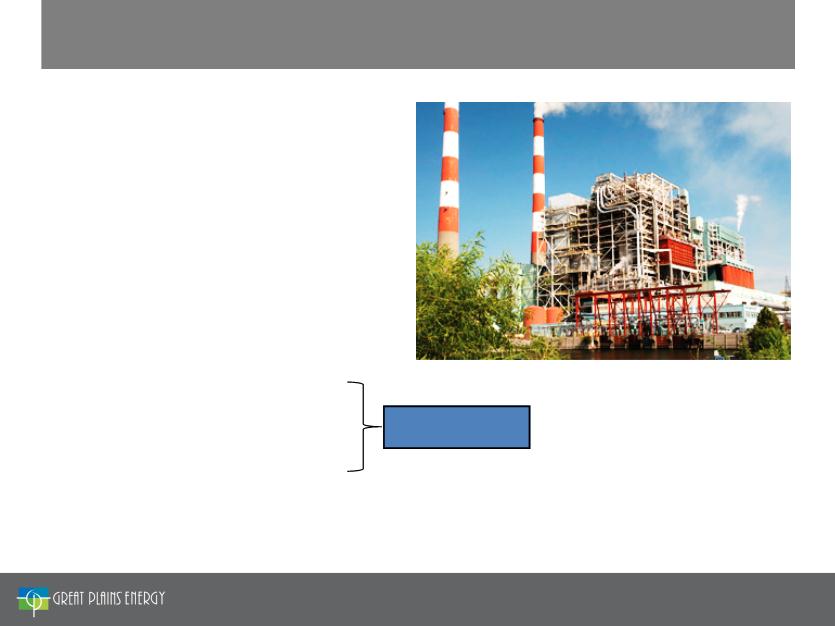
Plant Operations
• No additional baseload
generation expected for
several years
generation expected for
several years
• Targeting modest
improvements in existing fleet
performance in the coming
years
improvements in existing fleet
performance in the coming
years
• No changes currently planned
regarding nuclear’s role in the
portfolio
regarding nuclear’s role in the
portfolio
Iatan 2,850-megawatt coal-fired power plant recognized as
power plant of the year by Power Magazine
power plant of the year by Power Magazine
13
May 2012 Investor Presentation

Regulatory
• Our rates continue to compare well regionally and nationally
• During the Comprehensive Energy Plan, the Company received
fair and constructive rate treatment in both Kansas and
Missouri, allowing for recovery of substantially all of our capital
additions
fair and constructive rate treatment in both Kansas and
Missouri, allowing for recovery of substantially all of our capital
additions
• Aggressively pursuing strategies to improve our operating cost
structure and the best combination of rate cases and
riders/trackers to reduce regulatory lag while minimizing the
impact on customers
structure and the best combination of rate cases and
riders/trackers to reduce regulatory lag while minimizing the
impact on customers
14
May 2012 Investor Presentation

Regulatory, Transmission
and La Cygne Update
15
May 2012 Investor Presentation
Kansas Rate Case Summary
|
Jurisdiction
|
Case Number
|
Date Filed
|
Requested
Increase (in Millions)
|
Requested
Increase (Percent) |
Rate Base
(in Millions)
|
Requested
ROE |
Rate-
making Equity Ratio |
Anticipated
Effective Date of New Rates |
|
KCP&L - KS
|
12-KCPE-764-RTS
|
4/20/2012
|
$63.6
|
12.9%
|
$1,820.81
|
10.40%
|
51.8%
|
1/1/2013
|
Total
Increase
$63.6 M
Increase
$63.6 M
16
|
1 Projected rate base is approximately $40 million or 2% higher than at the conclusion of the last rate case
|
May 2012 Investor Presentation

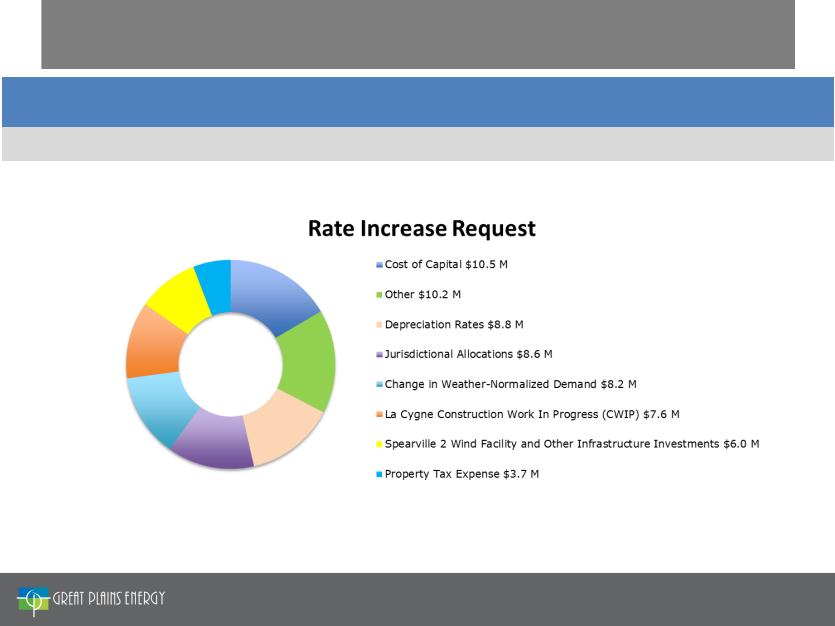
• Based on test year ending December 31, 2011
− Known and measurable changes projected through June 30, 2012
• Rate base increase includes
− La Cygne environmental CWIP - $66 million
− 48 MW Spearville 2 Wind Facility - $51 million
− Additional infrastructure investments
− Additions to rate base largely offset by increase in accumulated
deferred income tax primarily as a result of bonus depreciation
deferred income tax primarily as a result of bonus depreciation
• Requested authorization to file abbreviated rate case for additional
La Cygne environmental CWIP following the conclusion of this rate case
• Requested change to jurisdictional-allocation method of capital investment
in facilities
in facilities
• Requested change to depreciation rates to more accurately assign costs to
the customers who benefit from the use of those assets
the customers who benefit from the use of those assets
2012 Kansas Rate Case
17
May 2012 Investor Presentation
Missouri Rate Case Summary
|
Jurisdiction
|
Case Number
|
Date Filed
|
Requested
Increase (in Millions)
|
Requested
Increase (Percent) |
Rate Base
(in Millions)
|
Requested
ROE |
Rate-making
Equity Ratio |
Anticipated
Effective Date of New Rates |
|
KCP&L - MO
|
ER-2012-0174
|
2/27/2012
|
$105.7
|
15.1%
|
$2,129.9
|
10.40%
|
52.5%
|
Late January
2013 |
|
GMO - MPS
|
ER-2012-0175
|
2/27/2012
|
$58.3
|
10.9%
|
$1,411.9
|
10.40%
|
52.5%
|
Late January
2013 |
|
GMO - L&P
|
ER-2012-0175
|
2/27/2012
|
$25.2
|
14.6%
|
$479.5
|
10.40%
|
52.5%
|
Late January
2013 |
|
Total
|
$189.2
|
|
$4,021.31
|
|
|
|
||
|
1 Projected combined rate base is approximately $226 million or 6% higher than at the conclusion of the last rate cases for these jurisdictions
|
|
* Reflects revised wholesale margin cap request of $22.7 M
|
Total
Increase
$105.7 M
Increase
$105.7 M
Total
Increase
$83.5 M
Increase
$83.5 M
18
May 2012 Investor Presentation

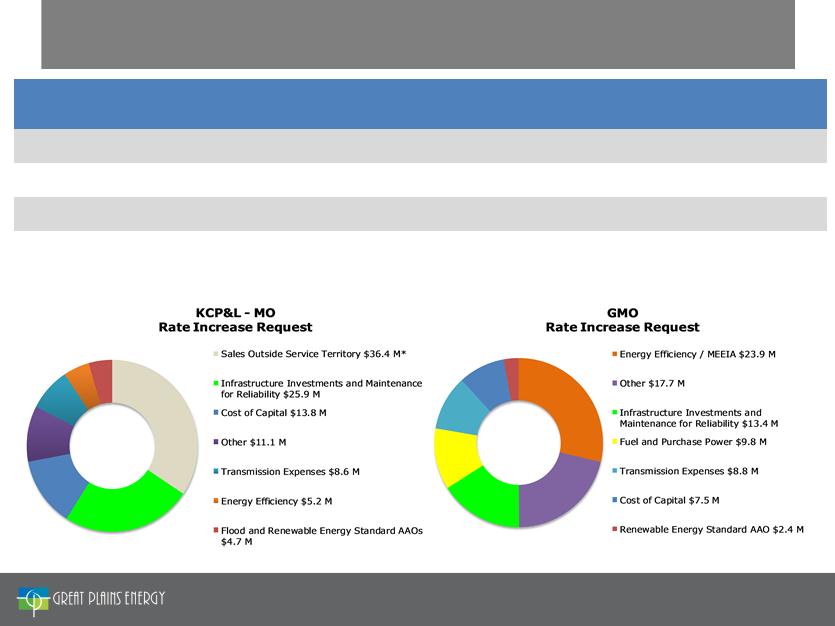
2012 KCP&L-MO Rate Case
• Based on test year ending September 30, 2011
− August 31, 2012 true-up date
• Revised wholesale margin cap requested
− Wholesale margin threshold of $22.7 million Missouri jurisdictional
share (40th percentile) compared to current cap of $45.9 million
(40th percentile)
share (40th percentile) compared to current cap of $45.9 million
(40th percentile)
• Additional infrastructure capital investment
• New trackers requested
− Property taxes
− Transmission
− Renewable energy standard (RES)
− Fuel interim energy charge (IEC) including wholesale margin offset
• Wholesale margin sharing mechanism proposed
• Other operating costs increases
19
May 2012 Investor Presentation

• Based on test year ending September 30, 2011
– August 31, 2012 true-up date
GMO-MPS
• Demand side management (DSM) / Energy Efficiency (EE) investment
recovery based on Missouri Energy Efficiency Investment Act (MEEIA)
filing
recovery based on Missouri Energy Efficiency Investment Act (MEEIA)
filing
• Additional infrastructure capital investment
• Fuel cost increases since previous rate case due to rebasing fuel
adjustment clause (FAC)
adjustment clause (FAC)
• New trackers requested
- Property taxes, transmission and RES
GMO-L&P
• DSM / EE investment recovery based on MEEIA filing
• Additional infrastructure capital investment
• Fuel cost increases since previous rate case due to rebasing FAC
• New trackers requested
- Property taxes, transmission and RES
2012 GMO Rate Case
20
May 2012 Investor Presentation

• Great Plains Energy (GXP) and American Electric Power (AEP) have formed a joint
venture, Transource Energy, LLC (Transource), to pursue competitive transmission
projects
venture, Transource Energy, LLC (Transource), to pursue competitive transmission
projects
– GXP owns 13.5% through a newly-formed subsidiary (GPE Transmission Holding Company, LLC)
– AEP owns 86.5% through its subsidiary (AEP Transmission Holding Company, LLC)
• GXP’s regulated subsidiaries, KCP&L and GMO, will seek regulatory approval to novate
two Southwest Power Pool (SPP) regional transmission projects they have committed to
build that are in the initial stages of development
two Southwest Power Pool (SPP) regional transmission projects they have committed to
build that are in the initial stages of development
– Sibley-Nebraska City an SPP Priority Project - 345kV, GMO’s share is approximately 170 miles (175
miles total project), estimated total costs of approximately $380 million, expected in service: 2017
miles total project), estimated total costs of approximately $380 million, expected in service: 2017
– Iatan-Nashua an SPP Balanced Portfolio Project - 345kV, approximately 30 miles, estimated total
costs of approximately $54 million, expected in-service: 2015
costs of approximately $54 million, expected in-service: 2015
– KCP&L and GMO to fund 100% of the costs of the two SPP projects until they are novated and will
be reimbursed by Transource
be reimbursed by Transource
• Estimated timeframe to obtain Missouri Public Service Commission (MPSC) and Federal
Energy Regulatory Commission (FERC) approvals to novate the projects is
approximately 18 months
Energy Regulatory Commission (FERC) approvals to novate the projects is
approximately 18 months
Transource Overview
21
May 2012 Investor Presentation

GPE Transmission Holding
Company, LLC
Company, LLC
AEP Transmission Holding
Company, LLC
Company, LLC
86.5%
13.5%
Transource Ownership Structure
Great Plains Energy Incorporated
American Electric Power
Company, Inc.
Company, Inc.
100%
100%
Transmission Projects
22
May 2012 Investor Presentation

Transource Overview
23
May 2012 Investor Presentation
• Exclusive vehicle for GXP and AEP to pursue future competitive transmission projects
throughout the continental United States that fall within the scope of FERC Order 1000
(regional and inter-regional transmission projects subject to regional cost allocation)
throughout the continental United States that fall within the scope of FERC Order 1000
(regional and inter-regional transmission projects subject to regional cost allocation)
– Initial focus on three regional transmission organizations (RTO) - SPP, Midwest Independent
Transmission System Operator (MISO) and PJM Interconnection (PJM). Pursuit of new transmission
in other regions as markets mature
Transmission System Operator (MISO) and PJM Interconnection (PJM). Pursuit of new transmission
in other regions as markets mature
– The venture excludes transmission projects in the Electric Reliability Council of Texas (ERCOT) and
AEP’s existing transmission project joint ventures
AEP’s existing transmission project joint ventures
• AEP will operate Transource and provide the majority of staff and services for the
venture through its service company
venture through its service company
– GXP will leverage AEP project execution strengths on the current SPP projects in completing the
Sibley-Nebraska City and Iatan-Nashua projects
Sibley-Nebraska City and Iatan-Nashua projects
• No earnings impact expected through 2015
– Consistent with GXP stand alone build of two current SPP projects
• Transource funding requirements will be consistent with ownership structure

• Long-term growth opportunity through creation of national transmission platform
− Provides opportunity for sustainable, long-term growth in competitive transmission market
− Ability to co-invest in transmission with AEP on a national scale
− First-class partner with largest US transmission system, strong balance sheet and demonstrated
commitment to transmission growth
commitment to transmission growth
− Project execution expertise creates greatest value for customers
− Provides geographic investment diversity
• Diversifies earnings
− Transmission investments help diversify long-term investments
− Enhances returns on future capital investments by way of FERC’s regulatory construct for
transmission
transmission
• Improves ability to earn authorized ROE
• Enhances financial flexibility
− Reduces medium-term capital expenditure requirements and external financing needs
− Smoothes capital requirements with near-term environmental investments and longer term
transmission opportunities
transmission opportunities
− Reduces regulatory lag due to FERC cost recovery mechanisms
GXP Benefits from Transource Joint Venture
24
May 2012 Investor Presentation
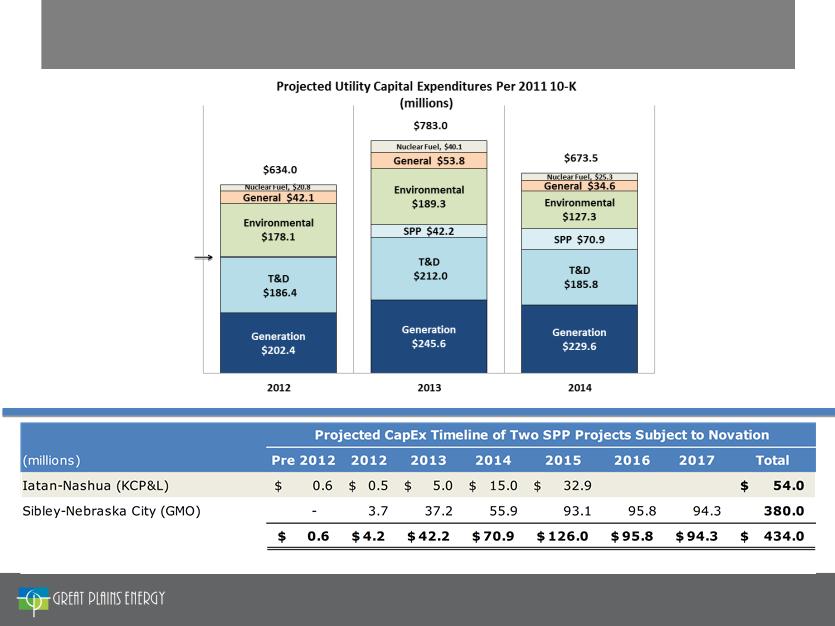
SPP $4.2
*Projected capital expenditure excludes Allowance for Funds Used During Construction (AFUDC)
25
May 2012 Investor Presentation
GXP Projected Capital Expenditures*
La Cygne Environmental Upgrade
Construction Update
|
Key Steps to Completion
|
|
|
• Site Prep; Major Equipment Purchase
|
Q3 2011 - Q3 2012
|
|
• New Chimney Shell Erected
|
Q3 2012
|
|
• Installation of Low Nox Burners for La Cygne 2
|
Q2 2013
|
|
• Major Construction
|
Q4 2012 - Q2 2014
|
|
• Startup Testing
|
Q3 2014
|
|
• Tie-in Outage Unit 2
|
Q4 2014
|
|
• Tie-in Outage Unit 1
|
Q1 2015
|
|
• In-service
|
Q2 2015
|
|
LaCygne Generation Station
|
|
• La Cygne Coal Unit 1 368 MW* - Wet scrubber, baghouse, activated carbon injection
|
|
• La Cygne Coal Unit 2 343 MW* - Selective catalytic reduction system, wet scrubber,
baghouse, activated carbon injection, over-fired air, low Nox burners |
|
• Project cost estimate, excluding AFUDC and property tax, $615 million*. Kansas
jurisdictional share is $281 million |
|
• 2011 predetermination order issued in Kansas deeming project as requested and cost
estimate to be reasonable |
|
• Project is on schedule and on budget
|
|
* KCP&L’s 50% share
|
26
May 2012 Investor Presentation

2011 Review and First Quarter
2012 Operations and Financial Update
27
May 2012 Investor Presentation
2011 Review
|
Financial
|
• Full-year earnings per share of $1.25
• Increased quarterly dividend to $0.2125
|
|
|
|
|
Operational
|
• Presented the ReliabilityOne award for the Plains Region for fifth consecutive
year • Rated Tier 1 in J.D. Power and Associates 2011 Electric Utility Residential
Satisfaction Study for third consecutive year • Introduced initiatives to streamline business and improve field communications
|
|
|
|
|
Strategic
|
• Contracted PPAs increasing renewable energy portfolio to approximately 600
MWs • Right-sized the Company with Organizational Realignment and Voluntary
Separation Program |
|
|
|
|
Regulatory
|
• Completed the Comprehensive Energy Plan
- Completed the Missouri rate cases - annual increase of $100 million
- Iatan 2 in rate base
• Kansas Corporation Commission approved predetermination for La Cygne
environmental upgrades |
28
May 2012 Investor Presentation

Plant Performance
29
May 2012 Investor Presentation

Retail MWh Sales
1 As of March 31
30
May 2012 Investor Presentation
1
2012 First Quarter EPS Reconciliation Versus 2011
|
|
2011 EPS
|
2012 EPS
|
Change in EPS
|
|
1Q
|
$ 0.01
|
($0.07)
|
($0.08)
|
Contributors to Change in 2012 EPS Compared to 2011
|
|
Weather
|
Wolf Creek
|
Interest
Expense
|
New Retail
Rates |
2011
Special Factors |
Total
|
|
1Q 2012
|
$ (0.11)
|
$ (0.07)
|
$ (0.10)
|
$ 0.13
|
$ 0.07
|
$ (0.08)
|
31
May 2012 Investor Presentation

|
|
Earnings (in Millions)
|
Earnings per Share
|
||
|
|
2012
|
2011
|
2012
|
2011
|
|
Electric Utility
|
$ 4.5
|
$ 7.0
|
$ 0.03
|
$ 0.05
|
|
Other
|
(13.8)
|
(4.7)
|
(0.10)
|
(0.04)
|
|
Net income (loss)
|
(9.3)
|
2.3
|
(0.07)
|
0.01
|
|
Less: Net loss attributable to noncontrolling interest
|
0.2
|
0.1
|
-
|
-
|
|
Net income (loss) attributable to Great Plains Energy
|
(9.1)
|
2.4
|
(0.07)
|
0.01
|
|
Preferred dividends
|
(0.4)
|
(0.4)
|
-
|
-
|
|
Earnings (loss) available for common shareholders
|
$ (9.5)
|
$ 2.0
|
$ (0.07)
|
$ 0.01
|
Great Plains Energy Consolidated Earnings
and Earnings Per Share - Three Months Ended March 31
and Earnings Per Share - Three Months Ended March 31
(Unaudited)
32
May 2012 Investor Presentation
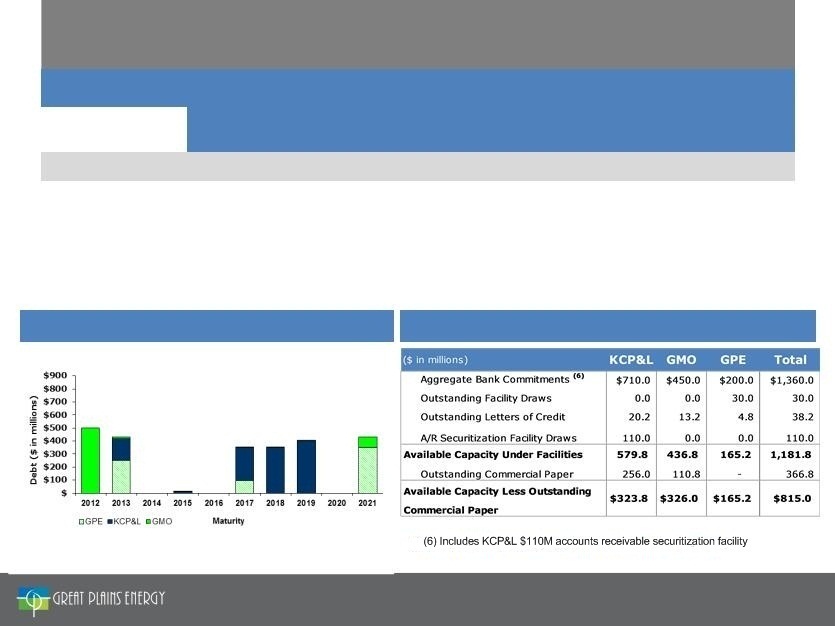
March 31, 2012 Debt Profile and Liquidity
|
Great Plains Energy Debt
|
||||||||
|
($ in Millions)
|
KCP&L
|
GMO (1)
|
GPE
|
Consolidated
|
||||
|
|
Amount
|
Rate (2)
|
Amount
|
Rate (2)
|
Amount
|
Rate (2)
|
Amount
|
Rate (2)
|
|
Short-term debt
|
$ 366.0
|
0.67%
|
$110.8
|
0.92%
|
$ 30.0
|
2.00%
|
$ 506.8
|
0.80%
|
|
Long-term debt (3)
|
1,902.3
|
6.02%
|
633.0
|
10.97%
|
993.4
|
4.65%
|
3,528.7
|
6.51%
|
|
Total
|
$2,268.3
|
5.16%
|
$743.8
|
9.45%
|
$1,023.4
|
4.57%
|
$4,035.5
|
6.44%
|
|
Secured debt = $750 (19%), Unsecured debt = $3,285 (81%)
(1) GPE guarantees substantially all of GMO’s debt
(2) Weighted Average Rates - excludes premium / discounts and fair market value adjustments
(3) Includes current maturities of long-term debt
|
||||||||
(4) Includes long-term debt maturities through December 31, 2021
(5) 2013 reflects mode maturity for $167.6 million of KCP&L tax-exempt
bonds subject to remarketing prior to final maturity date
|
Long-Term Debt Maturities(4)(5)
|
|
Liquidity
|
33
May 2012 Investor Presentation
Credit Profile for Great Plains Energy
|
Current Credit Ratings
|
||
|
|
Moody’s
|
Standard & Poor’s
|
|
Great Plains Energy
Outlook
Corporate Credit Rating
Preferred Stock
Senior Unsecured Debt
|
Stable
-
Ba2
Baa3
|
Stable
BBB
BB+
BBB-
|
|
KCP&L
Outlook
Senior Secured Debt
Senior Unsecured Debt
Commercial Paper
|
Stable
A3
Baa2
P-2
|
Stable
BBB+
BBB
A-2
|
|
GMO
Outlook
Senior Unsecured Debt
Commercial Paper
|
Stable
Baa3
P-3
|
Stable
BBB
A-2
|
* All ratios calculated using Standard and Poor’s methodology. Ratios are non-GAAP measures that are defined and reconciled to GAAP in Appendix
** Last twelve months (LTM) as of March 31, 2012
34
May 2012 Investor Presentation
*Based on Third Quarter 2011 Earnings Presentation
**2012 includes conversion to 17.1 million shares of GXP common stock in June
|
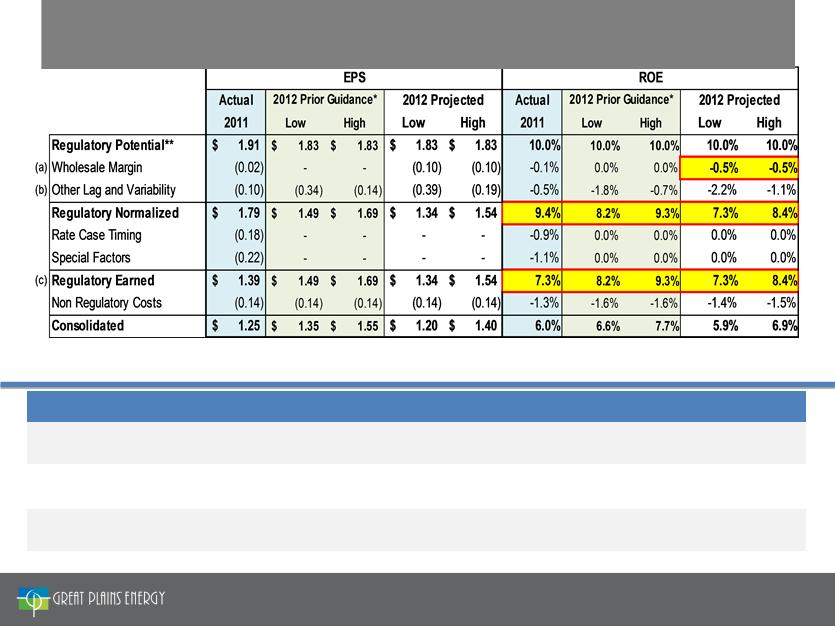
2012 Considerations
|
|
|
(a) Wholesale Margin
|
• Lower natural gas prices and related off-system sales impact due to KCP&L-MO wholesale margin cap
• Majority of 2011 lag allocated to Special Factors for flooding and Wolf Creek extended outage
|
|
b) Other Lag and Variability
|
• Lower projected weather-normalized load growth from 1% to 0.5%
• 2011 includes $0.12 EPS due to weather, 2012 assumes normal weather
|
|
(c) Regulatory Earned
|
• Regulatory earned ROE improving by 0 to 110 basis points over 2011
|
35
May 2012 Investor Presentation
2012 Earnings Guidance $1.20 - $1.40*
*Slide is from 2011 Fourth Quarter Earnings Webcast Presentation

• Affirming 2012 guidance of $1.20 - $1.40
− Assumes normal weather for the remainder of the year
− Assumes full-year weather-normalized demand growth
of 50 basis points
of 50 basis points
• Affirming 2013 target of 50 basis points of lag in
regulated operations
regulated operations
− Outcomes of 2012 rate cases and timing of effective
dates of new rates will be key drivers
dates of new rates will be key drivers
2012 EPS Guidance Range and 2013 Target
36
May 2012 Investor Presentation

Appendix
37
May 2012 Investor Presentation

Gross margin is a financial measure that is not calculated in accordance with generally accepted accounting
principles (GAAP). Gross margin, as used by Great Plains Energy, is defined as operating revenues less fuel,
purchased power and transmission of electricity by others. The Company’s expense for fuel, purchased
power and transmission of electricity by others, offset by wholesale sales margin, is subject to recovery
through cost adjustment mechanisms, except for KCP&L’s Missouri retail operations. As a result, operating
revenues increase or decrease in relation to a significant portion of these expenses. Management believes
that gross margin provides a more meaningful basis for evaluating the Electric Utility segment’s operations
across periods than operating revenues because gross margin excludes the revenue effect of fluctuations in
these expenses. Gross margin is used internally to measure performance against budget and in reports for
management and the Board of Directors. The Company’s definition of gross margin may differ from similar
terms used by other companies. A reconciliation to GAAP operating revenues is provided in the table above.
Great Plains Energy Reconciliation of
Gross Margin to Operating Revenues
(Unaudited)
Gross Margin to Operating Revenues
(Unaudited)
|
|
Three Months Ended March 31
(millions)
|
|
|
|
2012
|
2011
|
|
Operating revenues
|
$ 479.7
|
$ 492.9
|
|
Fuel
|
(119.3)
|
(104.9)
|
|
Purchased power
|
(24.7)
|
(54.9)
|
|
Transmission of electricity by others
|
(7.3)
|
(7.5)
|
|
Gross margin
|
$ 328.4
|
$ 325.6
|
38
May 2012 Investor Presentation
Credit Metric Reconciliation to GAAP
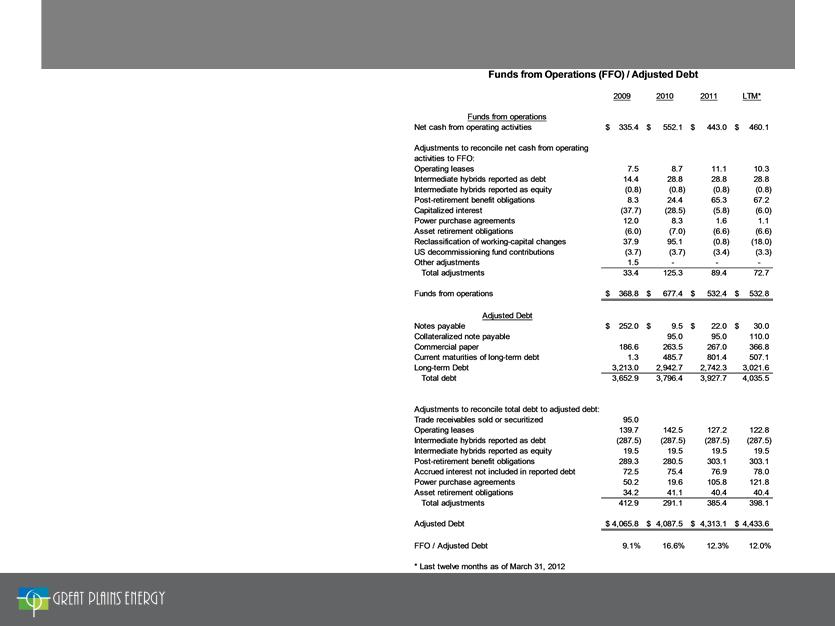
Funds from operations (FFO) to adjusted debt is a
financial measure that is not calculated in
accordance with generally accepted accounting
principles (GAAP). FFO to adjusted debt, as used by
Great Plains Energy, is defined in accordance with
Standard & Poor’s methodology used for calculating
FFO to debt. The numerator of the ratio is defined as
net cash from operating activities (GAAP) plus non-
GAAP adjustments related to operating leases,
hybrid securities, post-retirement benefit obligations,
capitalized interest, power purchase agreements,
asset retirement obligations, changes in working
capital and decommissioning fund contributions. The
denominator of the ratio is defined as the sum of
debt balances (GAAP) plus non-GAAP adjustments
related to some of the same items adjusted for in the
numerator and other adjustments related to
securitized receivables and accrued interest.
Management believes that FFO to adjusted debt
provides a meaningful way to better understand the
Company’s credit profile. FFO to adjusted debt is
used internally to help evaluate the possibility of a
change in the Company’s credit rating.
39
May 2012 Investor Presentation

Credit Metric Reconciliation to GAAP
Funds from operations (FFO) interest coverage
ratio is a financial measure that is not calculated in
accordance with generally accepted accounting
principles (GAAP). FFO interest coverage, as used
by Great Plains Energy, is defined in accordance
with Standard & Poor’s methodology used for
calculating FFO interest coverage. The numerator
of the ratio is defined as net cash from operating
activities (GAAP) plus non-GAAP adjustments
related to operating leases, hybrid securities, post-
retirement benefit obligations, capitalized interest,
power purchase agreements, asset retirement
obligations, changes in working capital and
decommissioning fund contributions plus adjusted
interest expense (non-GAAP). The denominator of
the ratio, adjusted interest expense, is defined as
interest charges (GAAP) plus non-GAAP
adjustments related to some of the same items
adjusted for in the numerator and other
adjustments needed to match Standard & Poor’s
calculation. Management believes that FFO
interest coverage provides a meaningful way to
better understand the Company’s credit profile.
FFO interest coverage is used internally to help
evaluate the possibility of a change in the
Company’s credit rating.
40
May 2012 Investor Presentation
Credit Metric Reconciliation to GAAP
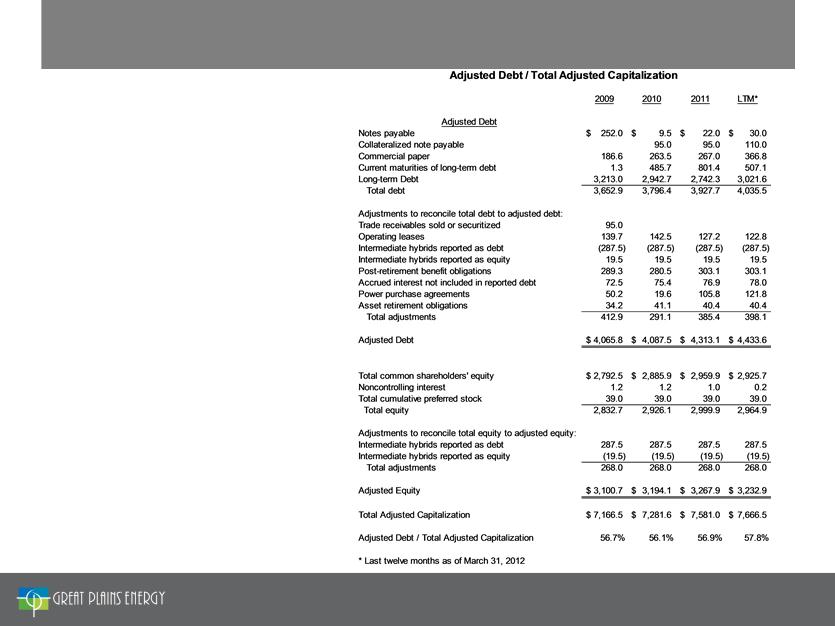
Adjusted debt to total adjusted capitalization is a
financial measure that is not calculated in
accordance with generally accepted accounting
principles (GAAP). Adjusted debt to total
adjusted capitalization, as used by Great Plains
Energy, is defined in accordance with Standard
& Poor’s methodology used for calculating the
ratio of debt to debt and equity. The numerator
of the ratio, adjusted debt, is defined as the sum
of debt balances (GAAP) plus non-GAAP
adjustments related to securitized receivables,
operating leases, hybrid securities, post-
retirement benefit obligations, accrued interest,
power purchase agreements and asset
retirement obligations. The denominator of the
ratio, total adjusted capitalization, is defined as
the sum of equity balances (GAAP) plus non-
GAAP adjustments related to hybrid securities
plus the non-GAAP adjusted debt as defined for
the numerator. Management believes that
adjusted debt to total adjusted capitalization
provides a meaningful way to better understand
the Company’s credit profile. Adjusted debt to
total adjusted capitalization is used internally to
help evaluate the possibility of a change in the
Company’s credit rating.
41
May 2012 Investor Presentation