Attached files
| file | filename |
|---|---|
| 8-K - FORM 8-K - CVR PARTNERS, LP | d351449d8k.htm |
 Investor Presentation
May, 2012
Exhibit 99.1 |
 2
Safe Harbor
The
following
information
contains
forward-looking
statements
based
on
management’s
current
expectations
and
beliefs,
as
well
as
a
number
of
assumptions
concerning
future
events.
These
statements
are
subject
to
risks,
uncertainties,
assumptions
and
other
important
factors.
You
are
cautioned
not
to
put
undue
reliance
on
such
forward-looking
statements
(including
forecasts
and
projections
regarding
our
future
performance)
because
actual
results
may
vary
materially
from
those
expressed
or
implied
as
a
result
of
various
factors,
including
those
noted
in
the
Company’s
filings
with
the
Securities
and
Exchange
Commission.
CVR
Partners,
LP
assumes
no
obligation
to,
and
expressly
disclaims
any
obligation
to,
update
or
revise
any
forward-looking
statements,
whether
as
a
result
of
new
information,
future
events or otherwise. |
 3
Key Strategic Drivers
•
Experienced management team
•
Fully utilized capacity
•
High run time rates
•
Strategically located assets
•
Solid market fundamentals supports
future growth
•
Growth
oriented
partnership
formed
by
CVR
Energy,
Inc.
in
June
2007,
with
IPO
in
April
2011
•
Manufacturing facility produces ammonia and Urea Ammonium Nitrate
(UAN) •
Facility
located
in
Coffeyville,
Kansas
and
produces
5%
of
total
UAN
demand
in
United
States |
 4
Experienced Management |
 5
Fully Utilized Capacity &
High Run Rates
(1) Adjusted for third-party outage.
|
 Strategically Located Assets
•
Located in corn belt
•
56% of corn planted in 2011
was within $40/UAN ton
freight rate of plant
•
$25/ton transportation
advantage to corn belt vs.
U.S. Gulf Coast
•
No intermediate transfer,
storage, barge freight or
pipeline freight charges
6 |
 7
Solid Market Fundamentals
Key Demand Drivers |
 8
Solid Market Fundamentals
Consistent Fertilizer Demand Growth
•
Nitrogen represents ~63%
of fertilizer consumption
(1)
•
Nitrogen based fertilizers
have most stable demand
because must be applied
annually
–
Primary determinant of crop yield
(1) Per the International Fertilizer Industry Association.
|
 9
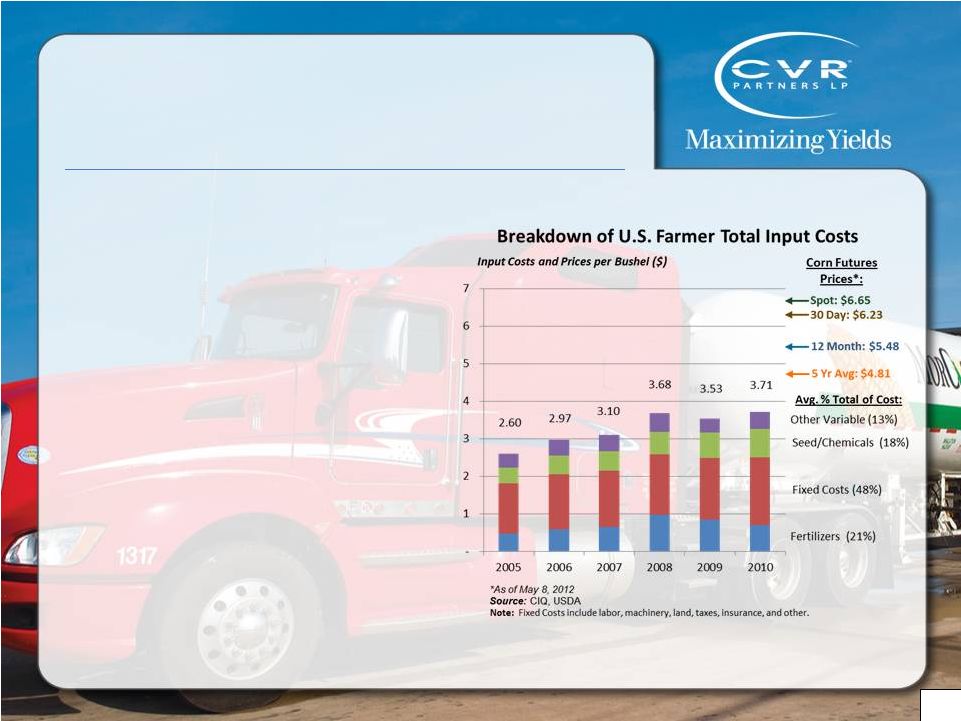
Solid Market Fundamentals
Farmer Profitability Supports Fertilizer Price
•
Corn consumes the largest
amount of nitrogen fertilizer
•
Farmers are expected to generate
substantial proceeds at currently
forecasted corn prices
•
Farmer incentivized to use
nitrogen at corn price much lower
than current spot
•
Nitrogen fertilizer represents
small portion of farmer’s total
input costs |
 10
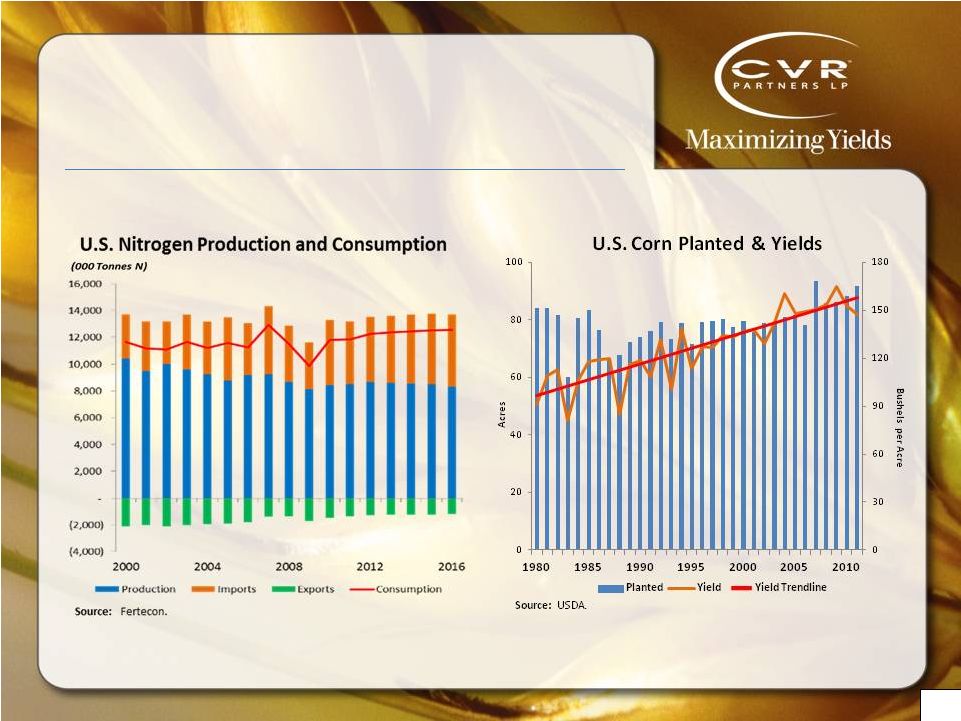
Market Fundamentals
Supply/Demand Supports Increased Planting
|
 11
Solid Market Fundamentals
UAN Demand & U.S.
Imports
UAN Demand/Supply
Country
2006
2007
2008
2009
2010
Trinidad & Tobago
0
0
0
0
705
Russia
731
679
865
597
679
Canada
513
621
442
387
396
Romania
232
428
168
26
230
Egypt
0
160
158
0
111
Lithuania
160
466
391
63
72
Ukraine
81
312
157
0
67
Poland
29
129
112
0
0
Estonia
0
0
12
28
106
Netherlands
16
16
26
0
40
Bulgaria
28
53
53
0
30
Germany
105
50
12
63
27
Belarus
86
87
0
0
0
Rest of world
23
35
2
3
1
Total
2,005
3,036
2,395
1,166
2,466
U.S. Imports of UAN |
   12
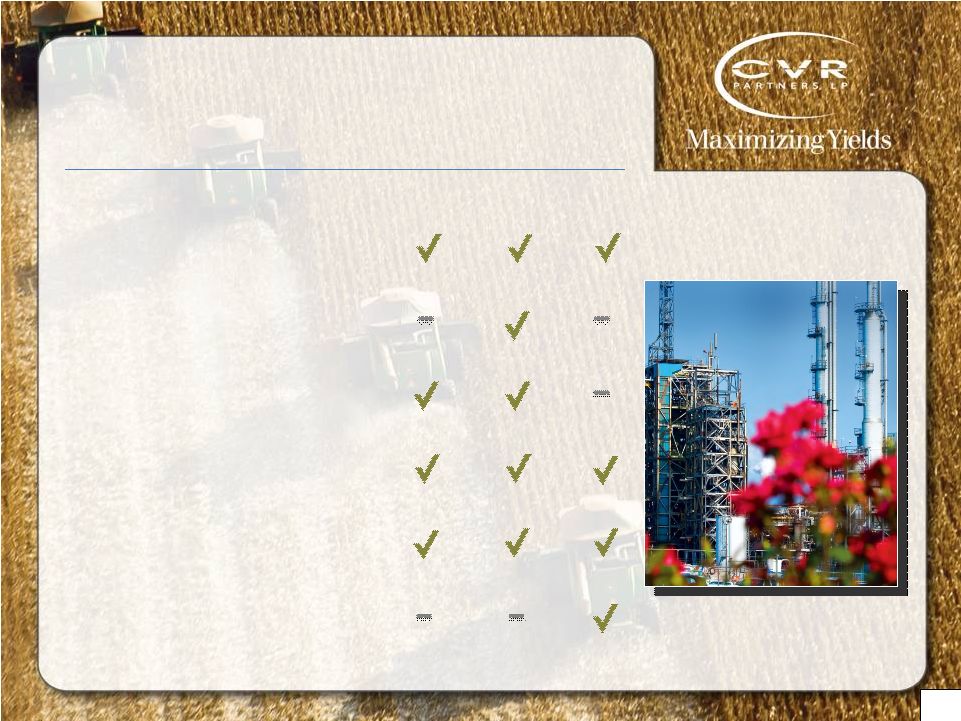
Growth Strategies
Current
12-24
Months
3-5
Years
•
Operational efficiency
•
Plant expansion
•
Specialty products
•
Distribution
•
Mergers and acquisitions
•
Plant development |
 13
UAN Expansion
•
Overview
–
Increase exposure to strong UAN market
dynamics
–
Expand UAN capacity by 330K tons
per year (~50%) to ~1MM tons/year
–
Upgrade 100% of ammonia to UAN
–
On-line in early 2013
•
Total cost of $125MM-$130MM
–
$63MM spent through 03/31/12
•
Annualized incremental impact
–
EBITDA: at least $20MM
–
Distributable cash flow: > $0.25 per unit
|
 14
Financial Statistics |
 15
Solid Start for 2012
2012 Q1
2011 Q1
Change
Sales
$78.3
$57.4
36.4%
EBITDA
(1)
$36.8
$21.3
72.8%
Operating
Income
$31.4
$16.8
86.9%
Distributable
Cash Flow
(2)
$38.2
n/a
n/a
DCF/Unit
(2)
$0.523
n/a
n/a
$US millions, except per unit data
(1)
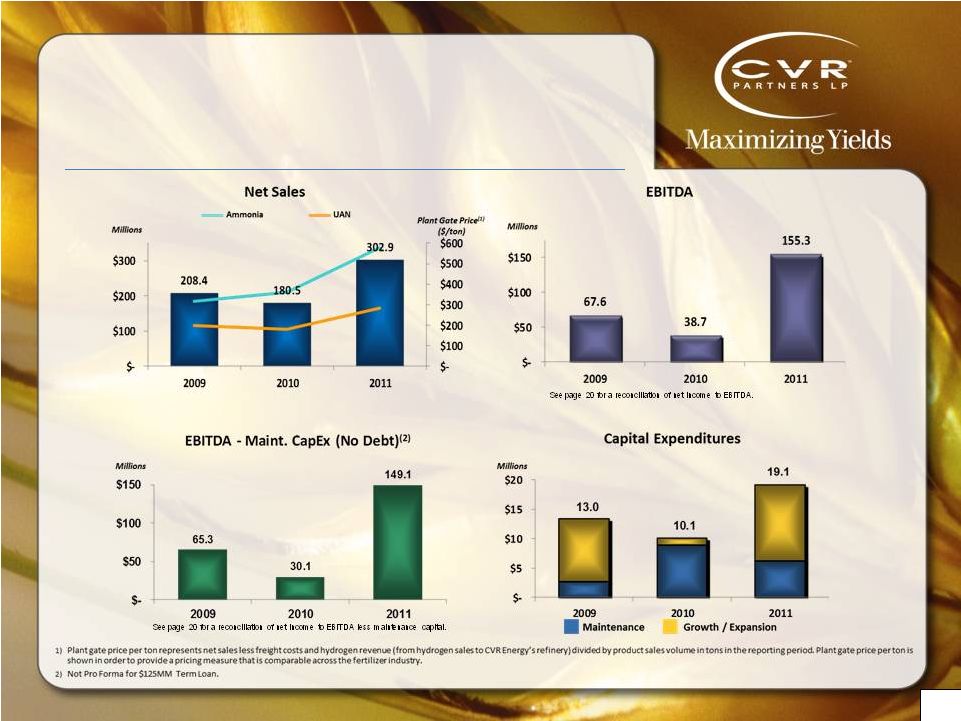
See page 20 for a reconciliation of net income to EBITDA.
(2)
IPO was in April 2012. |
 16
A Bright Outlook
•
Strong industry fundamentals
•
High-quality & strategically-located
assets
•
Premium product focus
•
Attractive growth opportunities
•
Pay out 100% of available cash
each quarter
•
No IDR’s
•
Experienced management team |
 Appendix |
 18
Fertilizer Plant Schematic |
 19
Non-GAAP Financial Measures
To
supplement
the
actual
results
in
accordance
with
U.S.
generally
accepted
accounting
principles
(GAAP),
for
the
applicable
periods,
the
Company
also
uses
certain
non-GAAP
financial
measures
as
discussed
below,
which
are
adjusted
for
GAAP-based
results.
The
use
of
non-GAAP
adjustments
are
not
in
accordance
with
or
an
alternative
for
GAAP.
The
adjustments
are
provided
to
enhance
the
overall
understanding
of
the
Company’s
financial
performance
for
the
applicable
periods
and
are
also
indicators
that
management
utilizes
for
planning
and
forecasting
future
periods.
The
non-GAAP
measures
utilized
by
the
Company
are
not
necessarily
comparable
to
similarly
titled
measures
of
other
companies.
The
Company
believes
that
the
presentation
of
non-GAAP
financial
measures
provides
useful
information
to
investors
regarding
the
Company’s
financial
condition
and
results
of
operations
because
these
measures,
when
used
in
conjunction
with
related
GAAP
financial
measures
(i)
together
provide
a
more
comprehensive
view
of
the
Company’s
core
operations
and
ability
to
generate
cash
flow,
(ii)
provide
investors
with
the
financial
analytical
framework
upon
which
management
bases
financial
and
operational
planning
decisions,
and
(iii)
presents
measurements
that
investors
and
rating
agencies
have
indicated
to
management
are
useful
to
them in assessing the Company and its results of operations.
|
 20
Non-GAAP Financial Measures
EBITDA:
EBITDA
represents
net
income
before
the
effect
of
interest
expense,
interest
income,
income
tax
expense
(benefit)
and
depreciation
and
amortization.
EBITDA
is
not
a
calculation
based
upon
GAAP;
however,
the
amounts
included
in
EBITDA
are
derived
from
amounts
included
in
the
consolidated
statement
of
operations
of
the
Company.
See below for reconciliation of net income to EBITDA
and EBITDA less maintenance capital
See below for reconciliation of net income to EBITDA
|