Attached files
| file | filename |
|---|---|
| 8-K - FORM 8-K - NEWTEK BUSINESS SERVICES, INC. | d350477d8k.htm |
 Newtek Business Services, Inc.
NASDAQ: NEWT
First Quarter 2012
Financial Results Conference Call
May 8, 2012 4:15 PM
Hosted By:
Barry Sloane, CEO and Chairman
Jennifer C. Eddelson, CAO
Investor Relations
Public Relations
Rubenstein Investor Relations, Inc.
Rubenstein Public Relations, Inc.
Timothy Clemensen
(212) 843-9337
tclemensen@rubensteinir.com
Jonathan Goldberg
(212) 843-9335
jgoldberg@rubensteinpr.com
William Swalm
(212) 843-8094
bswalm@rubensteinir.com
Jennifer Seley
(212) 843-8295
jseley@rubensteinpr.com
Exhibit 99.1 |
 Safe
Harbor Statement The
statements
in
this
slide
presentation
including
statements
regarding
anticipated
future
financial
performance,
Newtek's
beliefs,
expectations,
intentions
or
strategies
for
the
future,
may
be
"forward-looking
statements"
under
the
Private
Securities
Litigation
Reform
Act
of
1995.
All
forward-looking
statements
involve
a
number
of
risks
and
uncertainties
that
could
cause
actual
results
to
differ
materially
from
the
plans,
intentions
and
expectations
reflected
in
or
suggested
by
the
forward-looking
statements.
Such
risks
and
uncertainties
include,
among
others,
intensified
competition,
operating
problems
and
their
impact
on
revenues
and
profit
margins,
anticipated
future
business
strategies
and
financial
performance,
anticipated
future
number
of
customers,
business
prospects,
legislative
developments
and
similar
matters.
Risk
factors,
cautionary
statements
and
other
conditions
which
could
cause
Newtek’s
actual
results
to
differ
from
management's
current
expectations
are
contained
in
Newtek’s
filings
with
the
Securities
and
Exchange
Commission
and
available
through
http://www.sec.gov
Our
Capcos
operate
under
a
different
set
of
rules
in
each
of
the
7
jurisdictions
and
these
place
varying
requirements
on
the
structure
of
our
investments.
In
some
cases,
particularly
in
Louisiana
or
in
certain
situations
in
New
York,
we
do
not
control
the
equity
or
management
of
a
qualified
business,
but
that
cannot
always
be
presented
orally
or
in
written
presentations.
2 |
 First Quarter Key Performance Statistics
3 |
 First Quarter Key Performance Statistics
4 |
 First Quarter 2012 Conference Call Agenda
Q1 2012 Financial Performance, Cash Position, Balance Sheet
Commentary, Developments and Business Trends
Focus on Revenue Growth
New Financing Arrangement with Summit Partners
2012 Guidance
5 |
 First Quarter 2012 Financial Results
Q1 2012 vs. Q1 2011 core operating segment revenue:
Electronic
Payment
Processing:
$20.6
million
–
up
3%
from
Q1
2011
(revenue up 10% excluding impact of Durbin Amendment)
Managed Technology Solutions:
$4.7 million –
down 3% from Q1 2011
Small Business Finance:
$4.8 million –
up 36% after adjusting for fair
value accounting adjustment related to timing of recognition of premium
income included in prior quarter
Q1 2012 vs. Q1 2011 core operating segment pretax income:
Electronic
Payment
Processing:
$2.1
million
–
up
72%
from
Q1
2011
Managed Technology Solutions:
$1.1 million –
down 10% from Q1 2011
Small Business Finance:
$1.5 million -
up 15% from Q1 2011
6 |
 Cash
Position $22.6 million in cash and cash equivalents and restricted cash
at March 31, 2012, down from $25.4 million at December 31, 2011
Equates to $0.42 cash per share,
Equates to $0.63 cash per share when including restricted cash
7 |
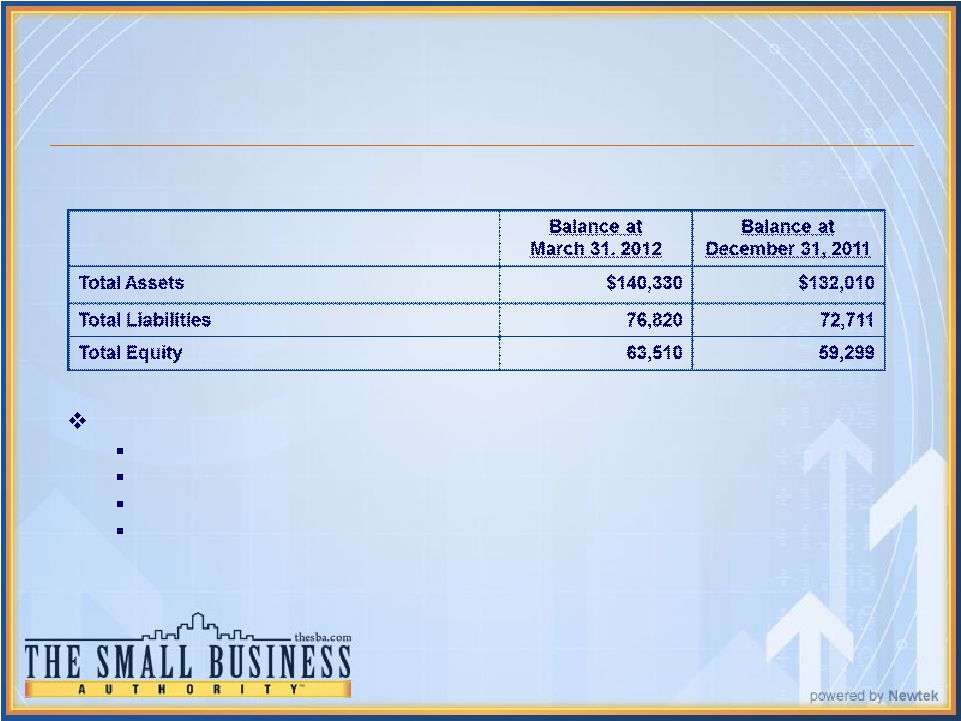 8
Selected Balance Sheet Items
In thousands of dollars
Major changes in Assets and Liabilities
Increase of $9.0 million in Broker receivable
Increase of $4.7 million in SBA loans held for investment
Increase of $8.0 million in Bank notes payable
Decrease
of
$2.5
million
in
Credits
and
Notes
Payable
in
credits
in
lieu
of
cash |
 Reduced Effect of Capco
on Consolidated Results
Balance sheet illusionary leverage
$14.5 million –
Credits in lieu of cash
$14.5 million –
Notes payable in credits in lieu of cash
Management time
Accounting cost
Other miscellaneous costs
9 |
 Future Year End Balance of Tax Credits
10
$ in millions |
 Developments in EPP
Q1 2012 EPP revenue up $530 thousand, or 3% compared with year
ago period; excluding impact of Durbin Amendment, revenue
increased by 10%
Q1 2012 EPP pretax income of $2.1 million, a 72% increase
compared with Q1 2011
Cash flow positive business
Significant operating leverage
EPP segment does not have any debt
eCommerce : Single most important corporate initiative and identifier
11 |
 Managed Technology Solutions Initiatives
Q1 2012 Web hosting and design revenue down 3% compared to
year ago quarter
Q1 2012 MTS pretax income decreased by 10% over prior year
Decrease in web hosting due to decline in monthly plans
Increase in average revenue per plan resulting from increase in number of cloud
instances and higher-cost plans sold
Changeover in management in:
Presidency of MTS
Customer Service
Sales Department
All products cloud-solutions oriented
Improve our position in products in addition to Microsoft products
12 |
 Developments in Small Business Finance
Q1 2012 SBF revenue, after adjusting for fair value accounting
adjustment related to timing of recognition of premium income
included in prior quarter, increased 36% over year ago period
Q1 2012 SBF pretax income $1.5 million, a 15% increase compared
with prior year
This sector offers the best opportunity for Newtek stockholders
We have a very strong lending infrastructure (origination, underwriting, funding,
servicing, and collection); this infrastructure is valuable more so
today 110 to 114 pricing on governments
FDIC contract
We are an S&P-rated commercial servicer
Closed $10 -
$15 million in mezzanine loan in April 2012
This will increase our capability to increase our lending in $100 million
increments; every $100 million in additional originations results in
approximately $4 million in annual pretax dollars
13 |
 14
Small Business Finance
Servicing Portfolio (in thousands):
Q1 2012
Q1 2011
Increase
Servicing for our loans
$ 295,900
$ 231,400
$ 64,500
Servicing for others
$ 135,900
$ 76,200
$ 59,700
Total servicing portfolio
$ 431,800
$ 307,600
$124,200
From March 31, 2011 to March 31, 2012, our servicing portfolio increased by
40%
We added an additional $125 million in external servicing in April 2012
We anticipate our portfolio increasing to $650 million by December 31, 2012
|
 Newtek Payroll Services
Payroll management, payment and reporting service
Competitively priced and ideal for small and medium sized
businesses
Currently servicing customers in 33 states
Compliments existing Newtek Products
Insurance
WC Pay-go
“Payroll in the Cloud”
15 |
 Growth Strategy
The
Small
Business
Authority
brand
through
www.thesba.com
Emphasize cross-selling and cross-marketing into the customer base
Continue to grow alliance channels as outsourcing of our services is
attractive to banks, credit unions and other affinity groups
Outbound campaign with direct focus on small businesses through television
and radio
Grow our presence as a business service provider with all of our
business
applications hosted in the cloud
16 |
 Our
Strategy & Mission We are a thought leader and destination for
independent owner operators of small businesses. The Small Business
Authority provides products, services, and data to small and medium size
businesses across the United States to grow their sales, reduce
their expenses, reduce their risk and offer state of the art efficient
business strategies, structures, and content to run their businesses.
17 |
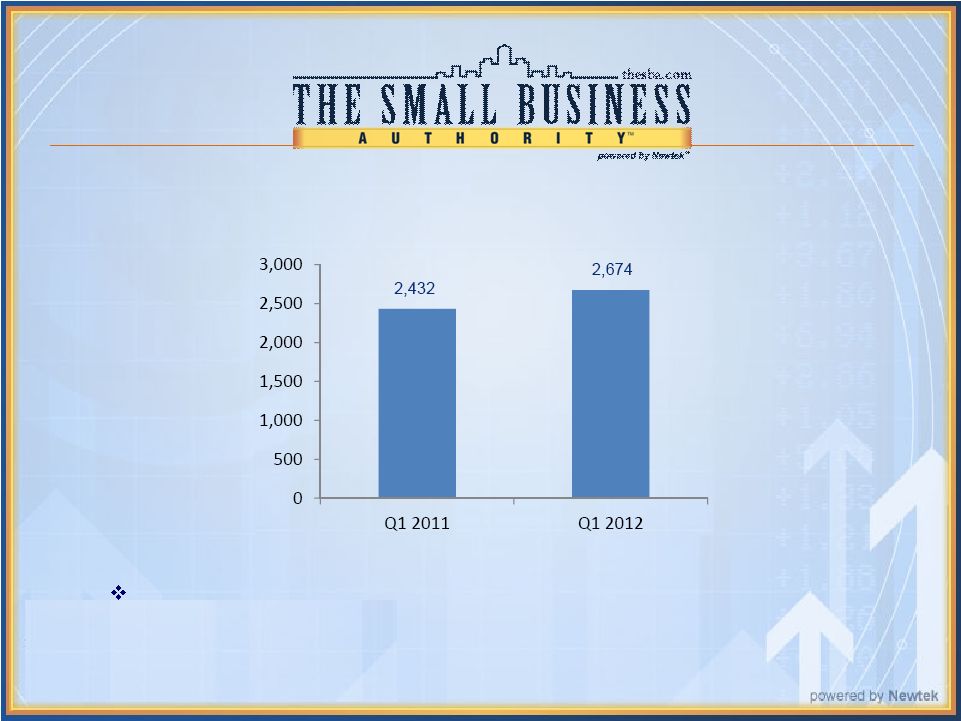
 18
Total Referrals
Total
referrals
received
increased
over
20%
as
compared
with
the
year
ago
quarter as a result of our new initiatives |
 19
63%
of
visitors
are
unique
to
www.thesba.com
compared
to
repeat
visitors |
 20
54% increase in total unique visitors for Q1 2012 compared to Q1
2011 |
 Current General Statistics
Our Alexa traffic ranking is 74,036 with 688 sites linking in
63% Bounce Rate; average time on site is 2 minutes: 23
seconds An average of approximately 1,100 unique visitors per
day 21 |
 Small Business Authority
Branding Achievements
Forbes
publishes
The
Small
Business
Authority
Blog
daily
which
can be viewed at
http://blogs.forbes.com/thesba/ Our
introductory post which explains what our blog will do can be viewed at
http://blogs.forbes.com/thesba/2011/06/15/your-authority-on-small-
business/
The
Small
Business
Authority
Index
is
published
by
Bloomberg
Newswire monthly
The
Small
Business
Authority
Market
Sentiment
Survey
is
publis
hed on CNBC, NYDailyNews, Small Business Trends etc.
22 |
 Current Marketing Strategy -
77 WABC Radio
“Reporting Live from The Small Business Authority Studios”
over 400 mentions per month
Over 250 sixty second radio commercials per month. Hear
our spots on www.thesba.com
click on community, then click on radio spots to hear our
personalities, like Imus, Hannity, Levin, Kudlow, Batchelor and McIntyre
broadcast our spots
The Small Business Authority Hour
The first Saturday of every month on 77 WABC and WABCradio.com
(click listen live)
Our show for independent business owners and operators
Go
to
our
website
www.thesba.com,
click
on
community
and
then
radio
spots
to listen to the podcasts
23 |
 WABC
Radio Overview “The Imus in the Morning Show”
–
broadcast Monday through
Friday, 6am EST to 9:20am EST on 77 WABC and Fox
Business News
SBAS –
Small Business Authority Studios
See Warner Wolf broadcast sports from the SBAS several times
each morning
Backdrop
Microphone flags
See
Bernard
McGirk
broadcast
his
“Bernie
Briefing”
from
the
SB
AS several times each morning
Backdrop
Microphone flags
Testing for future growth for Thesba brand and direct-to-market
distribution
24 |
 SB
Authority Index Financial barometer for small business economy
Made up of eight primary business and economic
components of the small business economy
SB Authority Index released at beginning of every month
Available in our newsletter with approximately 60,000 in
distribution
Available
on
our
website
now
at
www.thesba.com
25 |
 July
2012 Advertising & Media Plan National versus regional
Television, digital, and other media added to regional radio
Increased budget by 50%
26 |
 SB
Authority Market Sentiment Survey On a monthly basis, delivers the pulse of
the small business economy by polling our client base on topical issues
like health care, the lending environment and other important
issues affecting small businesses
Usually poll in excess of 1,200 respondents
Released once per month
Results are available in our newsletter with approximately
60,000 in distribution
Available to all to participate and view results on our website
at www.thesba.com
27 |
 Marketing Focus |
 Strategic Alliance Partner Channel
Hired new SVP of National Sales, Hyonwoo Shin
Mr. Shin’s expertise includes Investment Banking, Management of
Distressed Private Finance, and Raising Capital
He is also a graduate of the US Military Academy, West Point, served in the
US
Army
as
1
st
Lieutenant,
and
received
numerous
accolades
during
his
service
Driven by Newtracker®
our proprietary referral and tracking
system
Referral volume continues to grow on a consolidated basis
CUNA
Microsoft
Pershing
Morgan Stanley Smith Barney
Chartis
New York Community Bank
Humana Insurance Company
General Motors Minority Dealers
Association
29 |
 30
With the launch of our new website and The Small Business Authority brand,
direct channel referrals produced 13.9% of our total referrals in Q1 2012
compared with 7.1% in the year ago quarter
Percent of Referrals from Direct Channel |
 31
For the quarter ended March 31, 2012, cross sell referrals increased by
10% over the year ago quarter
Cross Sell Referrals |
 Small Business Authority Channel
Grow internet web based direct business
through search
through branding on TV, radio, print and public relations
Grow as the destination spot for independent owner/operator
businesses
Increase recognition as being “The Authority”
in business issues
for small businesses, and in each of the following areas:
Lending
Electronic payment processing
Insurance brokerage
Outsourced technology managed services
Business information
Payroll
Data storage
Health insurance
32 |
 In Conclusion
33 |
 Annual Pretax Income Trend
34
Pretax income (loss), in millions
-$18
-$12
-$6
$0
$6
$12
2007
Actual
2008
Actual
2009
Actual
2010
Actual
2011
Actual
2012
Forecast
Midpoint
$(17.5)
$(13.1)
$(4.0)
$0.9
$2.3
$7.5 |
 2012
Revised Segment Guidance 35
*Note: totals may not add due to rounding
In millions of dollars
Electronic
Managed
Small
Total
Payment
Technology
Business
All
Corporate
Business
CAPCO
Intercompany
Processing
Solutions
Finance
Other
Activities
Segments
Segment
Eliminations
Total
Low
High
Low
High
Low
High
Low
High
Low
High
Low
High
Low
High
Low
High
2012 Full Year
Revenue
84.3
85.7
18.8
19.2
24.2
25.2
1.7
2.0
0.8
0.8
129.8
132.9
0.8
0.8
(1.5)
129.1
132.2
Pretax Income (Loss)
8.2
8.6
4.3
4.5
5.5
6.7
(1.0)
(0.9)
(8.5)
(8.4)
8.5
10.5
(2.0)
(2.0)
-
6.5
8.5
Income from tax credits
-
-
-
-
-
-
-
-
-
-
-
-
(0.8)
(0.8)
-
(0.8)
(0.8)
Net change in fair value of
credits in lieu of cash and
notes payable in credits in
lieu of cash
-
-
-
-
-
-
-
-
-
-
-
-
0.1
0.1
-
0.1
0.1
Deferred compensation
expense
-
-
-
-
-
-
-
-
0.4
0.4
0.4
0.4
-
-
-
0.4
0.4
Lease loss amortization
-
-
-
-
-
-
-
-
(0.2)
(0.2)
(0.2)
(0.2)
-
-
-
(0.2)
(0.2)
Interest Expense
-
-
0.1
0.1
3.8
3.8
-
-
-
-
3.9
3.9
0.7
0.7
-
4.6
4.6
Depreciation and
Amortization
0.8
0.8
1.2
1.2
1.5
1.5
-
-
0.2
0.2
3.7
3.7
-
-
-
3.7
3.7
Modified EBITDA
9.0
9.4
5.6
5.8
10.8
12.0
(1.0)
(0.9)
(8.1)
(8.0)
16.3
18.3
(2.0)
(2.0)
-
14.3
16.3 |
 Financial Review
Jennifer C. Eddelson –
CAO |
 Non-GAAP Financial Measures
In evaluating its business, Newtek considers and uses modified EBITDA as a
supplemental measure of its operating performance. The Company defines
modified EBITDA as earnings excluding income from
tax
credits,
net
change
in
fair
value
of
credits
in
lieu
of
cash
and
notes
payable
in
credits
in
lieu
of
cash, interest expense, deferred compensation expense, lease loss expense, taxes,
depreciation and amortization. Newtek uses modified EBITDA as a
supplemental measure to review and assess its operating performance.
The Company also presents modified EBITDA because it believes it is
frequently used by securities analysts, investors and other interested parties as a
measure of financial performance.
The term modified EBITDA is not defined under U.S. generally accepted accounting
principles, or U.S. GAAP, and is not a measure of operating income(loss),
operating performance or liquidity presented in accordance
with
U.S.
GAAP.
Modified
EBITDA
has
limitations
as
a
analytical
tool
and,
when
assessing the Company’s operating performance, investors should not consider
modified EBITDA in isolation, or as a substitute for net income (loss) or
other consolidated income statement data prepared in accordance with U.S.
GAAP. Among other things, modified EBITDA does not reflect the
Company’s
actual
cash
expenditures.
Other
companies
may
calculate
similar
measures
differently
than Newtek, limiting their usefulness as comparative tools. Newtek
compensates for these limitations by relying primarily on its GAAP results
and using modified EBITDA only supplementally. 37
|
 Q1
2012 Actual vs. Q1 2011 Actual 38
In millions of dollars
Revenue For
The Quarter
Ended
March 31, 2012
Actual
Revenue For
The Quarter
Ended
March 31, 2011
Actual
Pretax Income
(Loss) For The
Quarter Ended
March 31, 2012
Actual
Pretax Income
(Loss) For The
Quarter Ended
March 31, 2011
Actual
MODIFIED
EBITDA For The
Quarter Ended
March 31, 2012
Actual
MODIFIED
EBITDA For The
Quarter Ended
March 31, 2011
Actual
Electronic
Payment
Processing
20.618
20.089
2.066
1.204
2.316
1.588
Managed
Technology
Solutions
4.693
4.829
1.102
1.231
1.430
1.635
Small
Business
Finance
4.839
5.053
1.466
1.271
2.273
2.097
All Other
0.546
0.354
(0.234)
(0.296)
(0.212)
(0.271)
Corporate
Activities
0.250
0.335
(1.800)
(1.965)
(1.739)
(1.871)
CAPCO
0.200
0.340
(0.495)
(0.611)
(0.483)
(0.600)
Interco
Eliminations
(0.417)
(0.477)
–
–
–
–
Total
30.729
30.523
2.105
0.834
3.585
2.578
*Note: totals may not add due to rounding |
 2012
Revised Segment Guidance 39
*Note: totals may not add due to rounding
In millions of dollars
Electronic
Managed
Small
Total
Payment
Technology
Business
All
Corporate
Business
CAPCO
Intercompany
Processing
Solutions
Finance
Other
Activities
Segments
Segment
Eliminations
Total
Low
High
Low
High
Low
High
Low
High
Low
High
Low
High
Low
High
Low
High
2012 Full Year
Revenue
84.3
85.7
18.8
19.2
24.2
25.2
1.7
2.0
0.8
0.8
129.8
132.9
0.8
0.8
(1.5)
129.1
132.2
Pretax Income (Loss)
8.2
8.6
4.3
4.5
5.5
6.7
(1.0)
(0.9)
(8.5)
(8.4)
8.5
10.5
(2.0)
(2.0)
-
6.5
8.5
Income from tax credits
-
-
-
-
-
-
-
-
-
-
-
-
(0.8)
(0.8)
-
(0.8)
(0.8)
Net change in fair value of
credits in lieu of cash and
notes payable in credits in
lieu of cash
-
-
-
-
-
-
-
-
-
-
-
-
0.1
0.1
-
0.1
0.1
Deferred compensation
expense
-
-
-
-
-
-
-
-
0.4
0.4
0.4
0.4
-
-
-
0.4
0.4
Lease loss amortization
-
-
-
-
-
-
-
-
(0.2)
(0.2)
(0.2)
(0.2)
-
-
-
(0.2)
(0.2)
Interest Expense
-
-
0.1
0.1
3.8
3.8
-
-
-
-
3.9
3.9
0.7
0.7
-
4.6
4.6
Depreciation and
Amortization
0.8
0.8
1.2
1.2
1.5
1.5
-
-
0.2
0.2
3.7
3.7
-
-
-
3.7
3.7
Modified EBITDA
9.0
9.4
5.6
5.8
10.8
12.0
(1.0)
(0.9)
(8.1)
(8.0)
16.3
18.3
(2.0)
(2.0)
-
14.3
16.3 |
 2012
Previous Segment Guidance 40
*Note: totals may not add due to rounding
In millions of dollars
Electronic
Managed
Small
Total
Payment
Technology
Business
All
Corporate
Business
CAPCO
Intercompany
Processing
Solutions
Finance
Other
Activities
Segments
Segment
Eliminations
Total
Low
High
Low
High
Low
High
Low
High
Low
High
Low
High
Low
High
Low
High
2012 Full Year
Revenue
84.0
85.4
18.9
19.3
25.1
26.1
1.5
1.8
0.8
0.8
130.3
133.4
0.8
0.8
(1.4)
129.7
132.8
Pretax Income (Loss)
7.7
8.1
4.3
4.5
4.6
5.8
(1.0)
(0.9)
(8.7)
(8.6)
6.9
8.9
(1.9)
(1.9)
-
5.0
7.0
Income from tax credits
-
-
-
-
-
-
-
-
-
-
-
-
(0.8)
(0.8)
-
(0.8)
(0.8)
Net change in fair value of
credits in lieu of cash and
notes payable in credits in
lieu of cash
-
-
-
-
-
-
-
-
-
-
-
-
0.1
0.1
-
0.1
0.1
Deferred compensation
expense
-
-
-
-
-
-
-
-
0.4
0.4
0.4
0.4
-
-
-
0.4
0.4
Lease loss amortization
-
-
-
-
-
-
-
-
(0.3)
(0.3)
(0.3)
(0.3)
-
-
-
(0.3)
(0.3)
Interest Expense
-
-
0.1
0.1
1.7
1.7
-
-
-
-
1.8
1.8
0.7
0.7
-
2.5
2.5
Depreciation and
Amortization
0.8
0.8
1.2
1.2
1.8
1.8
-
-
0.2
0.2
4.0
4.0
-
-
-
4.0
4.0
Modified EBITDA
8.5
8.9
5.6
5.8
8.1
9.3
(1.0)
(0.9)
(8.4)
(8.3)
12.9
14.9
(1.9)
(1.9)
-
11.0
13.0 |
 Going Forward: 2012
Barry Sloane -
CEO |
 Questions & Answers |
 Addendum |
 44
Pretax
Income
(Loss)
Income
from Tax
Credits
Net Change
in Fair
Value of
Credits in
Lieu of
Cash and
Notes
Payable in
Credits in
Lieu of
Cash
Deferred
Comp
Expense
Lease
restructuring
charges
Interest
Expense
Depreciation
and
amortization
Q1 2012
Modified
EBITDA
Electronic Payment
Processing
2.066
-
-
0.009
-
-
0.241
2.316
Managed Technology
Solutions
1.102
-
-
0.008
-
0.022
0.298
1.430
Small Business Finance
1.466
-
-
0.011
-
0.577
0.219
2.273
All Other
(0.234)
-
-
0.008
-
-
0.014
(0.212)
Corporate Activities
(1.800)
-
-
0.106
(0.073)
0.001
0.027
(1.739)
CAPCO
(0.495)
(0.191)
(0.036)
-
-
0.237
0.002
(0.483)
Total
2.105
(0.191)
(0.036)
0.142
(0.073)
0.837
0.801
3.585
Modified EBITDA Reconciliation
Modified EBITDA Reconciliation from Pretax Income (Loss)
For the quarter ended March 31, 2012
In millions of dollars
*Note: totals may not add due to rounding |
 45
Pretax
Income
(Loss)
Income from
Tax Credits
Net Change
in Fair Value
of Credits in
Lieu of Cash
and Notes
Payable in
Credits in
Lieu of Cash
Deferred
Comp
Expense
Interest
Expense
Depreciation
and
amortization
Q1 2011
Modified
EBITDA
Electronic Payment Processing
1.204
-
-
0.003
-
0.381
1.588
Managed Technology Solutions
1.231
-
-
0.002
0.028
0.375
1.635
Small Business Finance
1.271
-
-
0.004
0.630
0.192
2.097
All Other
(0.296)
-
-
0.003
-
0.021
(0.271)
Corporate Activities
(1.965)
-
-
0.037
-
0.058
(1.871)
CAPCO
(0.611)
(0.313)
(0.075)
-
0.397
0.003
(0.600)
Total
0.834
(0.313)
(0.075)
0.049
1.055
1.030
2.578
Modified EBITDA Reconciliation
Modified EBITDA Reconciliation from Pretax Income (Loss)
For the quarter ended March 31, 2011
In millions of dollars
*Note: totals may not add due to rounding |