Attached files
| file | filename |
|---|---|
| 8-K - Eagle Bulk Shipping Inc. | d1290599_8-k.htm |
| EX-99.1 - Eagle Bulk Shipping Inc. | d1290587_ex99-1.htm |
Exhibit 99.2
EAGLE BULK SHIPPING INC.
1Q 2012 Results Presentation
10 May 2012

EAGLE BULK SHIPPING INC.
2
Forward Looking Statements
This presentation contains certain statements that may be deemed to be “forward-looking statements”
within the meaning of the Securities Acts. Forward-looking statements reflect management’s current
views with respect to future events and financial performance and may include statements concerning
plans, objectives, goals, strategies, future events or performance, and underlying assumptions and
other statements, which are other than statements of historical facts. The forward-looking statements
in this presentation are based upon various assumptions, many of which are based, in turn, upon
further assumptions, including without limitation, management's examination of historical operating
trends, data contained in our records and other data available from third parties. Although Eagle Bulk
Shipping Inc. believes that these assumptions were reasonable when made, because these
assumptions are inherently subject to significant uncertainties and contingencies which are difficult or
impossible to predict and are beyond our control, Eagle Bulk Shipping Inc. cannot assure you that it
will achieve or accomplish these expectations, beliefs or projections. Important factors that, in our
view, could cause actual results to differ materially from those discussed in the forward-looking
statements include the strength of world economies and currencies, general market conditions,
including changes in charter hire rates and vessel values, changes in demand that may affect
attitudes of time charterers to scheduled and unscheduled drydocking, changes in our vessel
operating expenses, including dry-docking and insurance costs, or actions taken by regulatory
authorities, ability of our counterparties to perform their obligations under sales agreements, charter
contracts, and other agreements on a timely basis, potential liability from future litigation, domestic
and international political conditions, potential disruption of shipping routes due to accidents and
political events or acts by terrorists. Risks and uncertainties are further described in reports filed by
Eagle Bulk Shipping Inc. with the US Securities and Exchange Commission.

EAGLE BULK SHIPPING INC.
3
§ Results and Highlights
§ Industry
§ Financials
§ Q&A
§ Appendix
§ Fleet
§ Charters
Agenda

Results and Highlights

EAGLE BULK SHIPPING INC.
First Quarter 2012 Results
5
5
§ Net reported loss of $17.4 million, or $0.28 per share.
§ Net revenues of $52.6 million.
§ EBITDA* of $13.8 million.
§ Fleet utilization rate of 98.7%.
Generating positive operating cash flow in a challenging market
*EBITDA, as defined in our Credit Agreement
EAGLE BULK SHIPPING INC.
6
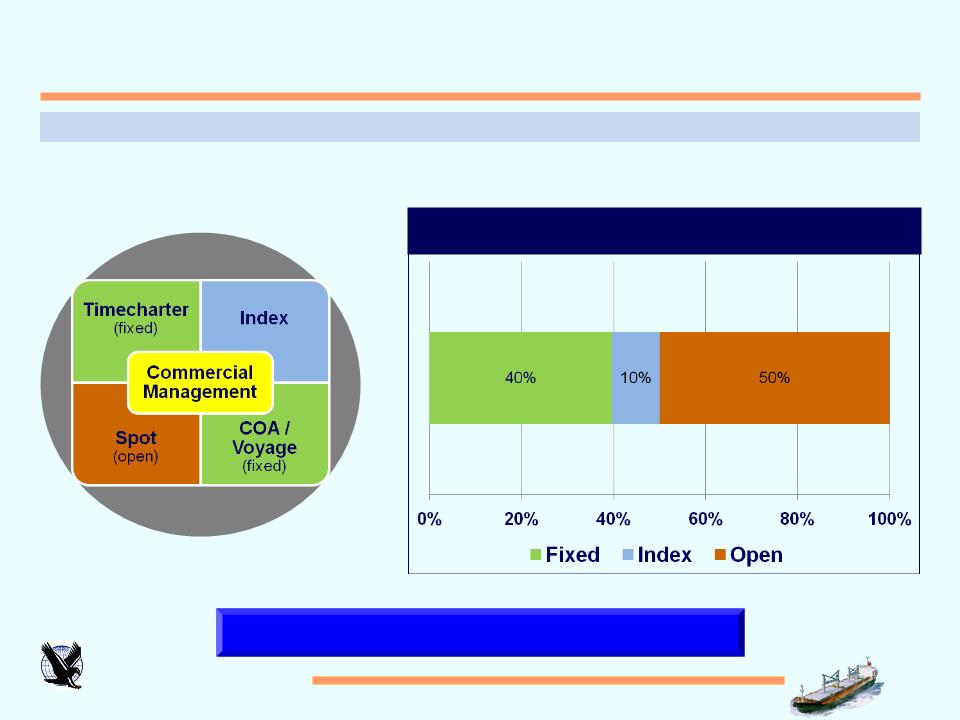
Dynamic Approach to Chartering
Focus on trading fleet short-term until market recovers
2012 Chartering Position
(as of March 31, 2012)
(as of March 31, 2012)
|
Fleet Statistics
|
|||||
|
Vessel Count
|
45
|
DWT
|
2,451,259
|
Average Age*
|
5.0 yrs
|
* Average age calculated on a DWT-basis

EAGLE BULK SHIPPING INC.
7
5.1m Tons Carried in 1Q 2012, +29% Y/Y
Diversified Cargo Mix
|
Cargo
|
Type
|
MT
|
as a % of Total
|
|
|
1
|
Coal
|
1,000,831
|
19.6%
|
|
|
2
|
Grains / Agricultural
|
507,088
|
9.9%
|
|
|
3
|
Iron Ore
|
408,439
|
8.0%
|
|
|
4
|
Sand
|
1,360,603
|
26.6%
|
|
|
5
|
Alumina/Bauxite
|
326,498
|
6.4%
|
|
|
6
|
Other Ores
|
Minor
|
322,770
|
6.3%
|
|
7
|
Potash / Fertilizer
|
Minor
|
311,643
|
6.1%
|
|
8
|
Steels / Pig Iron / Scrap
|
Minor
|
218,974
|
4.3%
|
|
9
|
Coke
|
Minor
|
130,978
|
2.6%
|
|
10
|
Cement
|
Minor
|
119,200
|
2.3%
|
|
11
|
Sugar
|
Minor
|
96,500
|
1.9%
|
|
12
|
Copper
|
Minor
|
95,975
|
1.9%
|
|
13
|
Miscellaneous
|
Minor
|
49,700
|
1.0%
|
|
14
|
Forest Products
|
Minor
|
45,638
|
0.9%
|
|
15
|
Limestone
|
Minor
|
44,028
|
0.9%
|
|
16
|
Salt
|
Minor
|
41,600
|
0.8%
|
|
17
|
Metals
|
Minor
|
35,725
|
0.7%
|
|
TOTAL
|
5,116,190
|
100.0%
|
||

Industry

EAGLE BULK SHIPPING INC.
9
Source(s): Bloomberg, Clarksons, Commodore
§ Normalization in supply growth momentum.
§ April newbuilding deliveries totaled 7m
DWT, -44% since January.
DWT, -44% since January.
§ Increased Chinese coal imports.
§ Stockpiles off 21% since February.
§ Price advantage on foreign-sourced
product versus domestic supplies.
product versus domestic supplies.
§ Increased grain exports out of Russia/FSU.
§ Increased nickel ore exports out of Indonesia.
§ Improved balance of global fleet dispersion.
Severe Weakness Experienced in 1Q 2012 Abated
Spot Rates since February 2012 Low
|
Average Spot Rates
|
|||
|
|
Supramax
|
Panamax
|
Capesize
|
|
1Q 2012
|
$8,730
|
$8,072
|
$7,322
|
|
2Q 2012
(quarter-to-date) |
$10,697
|
$10,858
|
$6,656
|
Demand/Supply fundamentals will continue to favor the “geared” vessels

EAGLE BULK SHIPPING INC.
10
Source(s): Clarksons
Short-term Fundamentals Remain Weak
Newbuilding deliveries declining
Drybulk Projected Newbuilding Deliveries
(a % of the fleet)
(a % of the fleet)
Drybulk Newbuilding Deliveries
(in m DWT)
(in m DWT)
§ New orders in April down 78% Y/Y.
§ Depressed earnings environment.
§ Lack of financing availability.
§ Second-hand prices more attractive.
§ Orderbook (as a % of fleet) currently
stands at 29% and is decreasing rapidly.
stands at 29% and is decreasing rapidly.
§ Shipyards facing increased margin
pressure, leading to bankruptcies.
pressure, leading to bankruptcies.

EAGLE BULK SHIPPING INC.
11
Source(s): Clarksons
2012 scrapping on pace to reach a record 33m DWT
Scrapping Continues to Alleviate Supply Growth
Drybulk Scrapping
(annual, in m DWT)
(annual, in m DWT)
Drybulk Fleet Over 25 years of Age
(over 1500 vessels)
(over 1500 vessels)
39 vessels
196 vessels
1264 vessels
§ Sub-Panamax segment represents 84% of
all vessels over the age of 25 years of age.
all vessels over the age of 25 years of age.
§ Scrapping at historical record levels.
§ With scrap rates in the $450-500 per LWT range,
demolition should remain elevated.
demolition should remain elevated.

EAGLE BULK SHIPPING INC.
12
Source(s): Clarksons, IGC, Macquarie, and USDA
§ Total global grain trade expected to remain flat
in 2011/2012 to total 349m MT.
in 2011/2012 to total 349m MT.
§ Middle East grain imports to reach 42m
MT, +21% Y/Y.
MT, +21% Y/Y.
§ Chinese soybean imports to reach 56m
MT, +6% Y/Y.
MT, +6% Y/Y.
§ Global trade in minor bulks is projected to
reach 1.2 billion MT in 2012.
reach 1.2 billion MT in 2012.
§ Nickel ore is the strongest growth segment
increasing by 8% to reach 60m MT.
increasing by 8% to reach 60m MT.
§ Chinese minor bulk demand growth
remains robust.
remains robust.
§ Imports totaled 253m MT in 2011,
+31% Y/Y.
+31% Y/Y.
Agricultural and Minor Bulk Trades Remain Firm
Minor bulks represents 1/3 of total drybulk trade
Top Ten Importers of U.S. Grain Products

EAGLE BULK SHIPPING INC.
13
Source(s): Clarksons, Macquarie, Peabody
§ Urbanization driving increased steel
production and electricity generation.
production and electricity generation.
§ Global annual steel production to increase 40%
by 2020 to reach 2 billion tons.
by 2020 to reach 2 billion tons.
§ Will lead to strong demand growth for
iron ore and metallurgical coal.
iron ore and metallurgical coal.
§ African-sourced iron ore to gain
market share in global imports and
increase overall ton-mile demand.
market share in global imports and
increase overall ton-mile demand.
§ Over 370 GW of new coal-fueled power
capacity coming online by 2016.
capacity coming online by 2016.
§ This equates to 1.2 billion tons in
incremental thermal coal demand, majority
of which to be sourced from Indonesia and
Australia.
incremental thermal coal demand, majority
of which to be sourced from Indonesia and
Australia.
Strong L/T Demand Fundaments for Coal / Iron Ore
Indian and Chinese Coal Imports
(in m MT)
(in m MT)
Urbanization Rates

Financials

EAGLE BULK SHIPPING INC.
15
Earnings (in thousands, except per share data)
*EBITDA, as defined in our Credit Agreement

EAGLE BULK SHIPPING INC.
16
Balance Sheet (in thousands)

EAGLE BULK SHIPPING INC.
17
2012 Estimated Daily Cash Expense Breakeven
|
Expense breakdown*
|
|
|
Vessel Opex
|
$5,103
|
|
Technical Management
|
319
|
|
G&A
|
1,214
|
|
Interest
|
2,728
|
|
Drydocking
|
100
|
|
Total
|
$9,464
|
*ASSUMPTIONS:
§ Vessel expenses are comprised of the following: crew wages and related, insurance, repair and maintenance, stores, spares and related
inventory, and tonnage taxes.
inventory, and tonnage taxes.
§ Interest expense takes into consideration Eagle Bulk’s view and projection of LIBOR rates.
§ Drydocking expense is based on estimated costs for anticipated vessel drydockings in the next four quarters.

Q&A


Appendix

EAGLE BULK SHIPPING INC.
21
Fleet
|
|
Vessel
|
DWT
|
Year
Built |
|
Vessel
|
DWT
|
Year
Built |
|
Vessel
|
DWT
|
Year
Built |
|
1
|
Sandpiper Bulker
|
57,809
|
2011
|
16
|
Avocet
|
53,462
|
2010
|
31
|
Kestrel I
|
50,326
|
2004
|
|
2
|
Roadrunner Bulker
|
57,809
|
2011
|
17
|
Thrasher
|
53,360
|
2010
|
32
|
Skua
|
53,350
|
2003
|
|
3
|
Puffin Bulker
|
57,809
|
2011
|
18
|
Golden Eagle
|
55,989
|
2010
|
33
|
Shrike
|
53,343
|
2003
|
|
4
|
Petrel Bulker
|
57,809
|
2011
|
19
|
Egret Bulker
|
57,809
|
2010
|
34
|
Tern
|
50,200
|
2003
|
|
5
|
Owl
|
57,809
|
2011
|
20
|
Crane
|
57,809
|
2010
|
35
|
Kittiwake
|
53,146
|
2002
|
|
6
|
Oriole
|
57,809
|
2011
|
21
|
Canary
|
57,809
|
2009
|
36
|
Goldeneye
|
52,421
|
2002
|
|
7
|
Nighthawk
|
57,809
|
2011
|
22
|
Bittern
|
57,809
|
2009
|
37
|
Osprey I
|
50,206
|
2002
|
|
8
|
Thrush
|
53,297
|
2011
|
23
|
Stellar Eagle
|
55,989
|
2009
|
38
|
Falcon
|
50,296
|
2001
|
|
9
|
Martin
|
57,809
|
2010
|
24
|
Crested Eagle
|
55,989
|
2009
|
39
|
Peregrine
|
50,913
|
2001
|
|
10
|
Kingfisher
|
57,776
|
2010
|
25
|
Crowned Eagle
|
55,940
|
2008
|
40
|
Condor
|
50,296
|
2001
|
|
11
|
Jay
|
57,802
|
2010
|
26
|
Woodstar
|
53,390
|
2008
|
41
|
Harrier
|
50,296
|
2001
|
|
12
|
Ibis Bulker
|
57,775
|
2010
|
27
|
Wren
|
53,349
|
2008
|
42
|
Hawk I
|
50,296
|
2001
|
|
13
|
Grebe Bulker
|
57,809
|
2010
|
28
|
Redwing
|
53,411
|
2007
|
43
|
Merlin
|
50,296
|
2001
|
|
14
|
Gannet Bulker
|
57,809
|
2010
|
29
|
Cardinal
|
55,362
|
2004
|
44
|
Sparrow
|
48,225
|
2000
|
|
15
|
Imperial Eagle
|
55,989
|
2010
|
30
|
Jaeger
|
52,248
|
2004
|
45
|
Kite
|
47,195
|
1997
|
* Average age calculated on a DWT-basis
|
VESSEL COUNT
|
45
|
DWT
|
2,451,259
|
AVERAGE AGE*
|
5.0 yrs
|

EAGLE BULK SHIPPING INC.
22
Charters (as of March 31, 2012)
|
|
Vessel
|
Charter Expiry
|
Charter
Base Rate |
|
Vessel
|
Charter Expiry
|
Charter
Base Rate |
|
Vessel
|
Charter Expiry
|
Charter
Base Rate |
|||
|
Earliest
|
Latest
|
Earliest
|
Latest
|
Earliest
|
Latest
|
|||||||||
|
1
|
Sandpiper Bulker
|
8/2014
|
12/2014
|
$17,650
|
16
|
Avocet
|
6/2012
|
6/2012
|
voyage
|
31
|
Kestrel I
|
8/2012
|
10/2012
|
BSI*
|
|
2
|
Roadrunner Bulker
|
8/2014
|
12/2014
|
$17,650
|
17
|
Thrasher
|
6/2012
|
8/2012
|
$10,000
|
32
|
Skua
|
5/2012
|
9/2012
|
$10,500
|
|
3
|
Puffin Bulker
|
5/2014
|
9/2014
|
$17,650
|
18
|
Golden Eagle
|
4/2012
|
4/2012
|
$15,750
|
33
|
Shrike
|
12/2012
|
3/2013
|
$11,300
|
|
4
|
Petrel Bulker
|
5/2014
|
9/2014
|
$17,650
|
19
|
Egret Bulker
|
10/2012
|
2/2013
|
$17,650
|
34
|
Tern
|
7/2012
|
10/2012
|
$10,000
|
|
5
|
Owl
|
6/2012
|
6/2012
|
voyage
|
20
|
Crane
|
4/2012
|
4/2012
|
voyage
|
35
|
Kittiwake
|
3/2012
|
3/2012
|
spot
|
|
6
|
Oriole
|
6/2012
|
6/2012
|
voyage
|
21
|
Canary
|
4/2012
|
4/2012
|
$7,750
|
36
|
Goldeneye
|
10/2012
|
1/2013
|
BSI*
|
|
7
|
Nighthawk
|
5/2012
|
5/2012
|
$11,250
|
22
|
Bittern
|
6/2012
|
9/2012
|
$11,990
|
37
|
Osprey I
|
7/2012
|
10/2012
|
$10,000
|
|
8
|
Thrush
|
3/2012
|
3/2012
|
spot
|
23
|
Stellar Eagle
|
4/2012
|
4/2012
|
$8,300
|
38
|
Falcon
|
3/2012
|
3/2012
|
spot
|
|
9
|
Martin
|
6/2012
|
9/2012
|
$10,500
|
24
|
Crested Eagle
|
4/2012
|
4/2012
|
$7,250
|
39
|
Peregrine
|
4/2012
|
4/2012
|
$13,000
|
|
10
|
Kingfisher
|
4/2012
|
4/2012
|
$10,000
|
25
|
Crowned Eagle
|
8/2012
|
10/2012
|
$14,000
|
40
|
Condor
|
5/2012
|
5/2012
|
$9,750
|
|
11
|
Jay
|
3/2012
|
3/2012
|
spot
|
26
|
Woodstar
|
4/2012
|
4/2012
|
$6,000
|
41
|
Harrier
|
5/2012
|
5/2012
|
$10,500
|
|
12
|
Ibis Bulker
|
3/2013
|
7/2013
|
$17,650
|
27
|
Wren
|
5/2012
|
5/2012
|
$7,800
|
42
|
Hawk I
|
4/2012
|
4/2012
|
$15,250
|
|
13
|
Grebe Bulker
|
2/2013
|
6/2013
|
$17,650
|
28
|
Redwing
|
4/2012
|
4/2012
|
$10,000
|
43
|
Merlin
|
3/2012
|
3/2012
|
spot
|
|
14
|
Gannet Bulker
|
1/2013
|
5/2013
|
$17,650
|
29
|
Cardinal
|
12/2012
|
2/2013
|
BSI*
|
44
|
Sparrow
|
5/2012
|
8/2012
|
$10,000
|
|
15
|
Imperial Eagle
|
11/2012
|
2/2013
|
BSI*
|
30
|
Jaeger
|
11/2012
|
1/2013
|
BSI*
|
45
|
Kite
|
4/2012
|
4/2012
|
$10,000
|
*BSI= Baltic Supramax Index