Attached files
| file | filename |
|---|---|
| 8-K - FORM 8-K - ACI WORLDWIDE, INC. | d352091d8k.htm |

ACI Worldwide Investor Conferences
Spring 2012
Private Securities Litigation Reform Act of 1995 Safe Harbor for Forward-Looking Statements
This presentation contains forward-looking statements based on current expectations that involve a number of risks and uncertainties. The forward-looking statements are made pursuant to safe harbor provisions of the Private Securities Litigation Reform Act of 1995. A discussion of these forward-looking statements and risk factors that may affect them is set forth at the end of this presentation. The Company assumes no obligation to update any forward-looking statement in this presentation, except as required by law.
| 2 |
|
Business overview
| 3 |
|
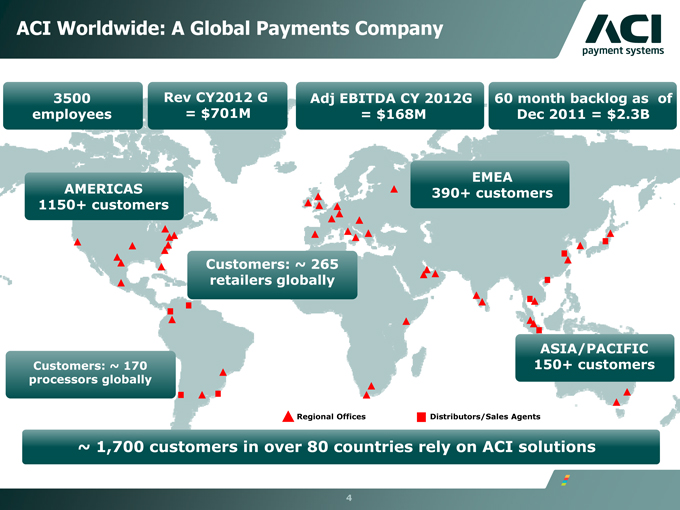
ACI Worldwide: A Global Payments Company
3500 Rev CY2012 G Adj EBITDA CY 2012G 60 month backlog as of
employees = $701M = $168M Dec 2011 = $2.3B
EMEA
AMERICAS 390+ customers
1150+ customers
Customers: ~ 265
retailers globally
ASIA/PACIFIC
Customers: ~ 170 150+ customers
processors globally
Regional Offices Distributors/Sales Agents
~ 1,700 customers in over 80 countries rely on ACI solutions
| 4 |
|
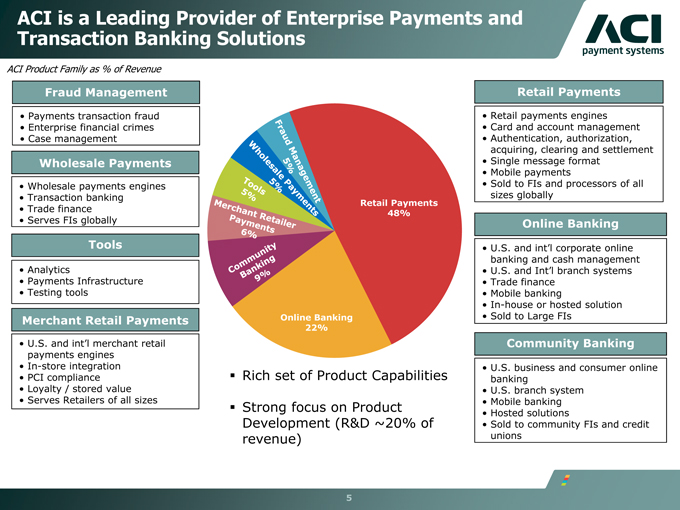
ACI is a Leading Provider of Enterprise Payments and Transaction Banking Solutions
ACI Product Family as % of Revenue
Fraud Management
Payments transaction fraud
Enterprise financial crimes
Case management
Wholesale Payments
Wholesale payments engines
Transaction banking
Trade finance
Serves FIs globally
Tools
Analytics
Payments Infrastructure
Testing tools
Merchant Retail Payments
U.S. and int’l merchant retail
payments engines
In-store integration
PCI compliance
Loyalty / stored value
Serves Retailers of all sizes
Retail Payments
48%
Online Banking
22%
Fraud Management 5% Wholesale Payments 5% Tools 5%
Merchant Retailer Payments 6% Community Banking 9%
Rich set of Product Capabilities
Strong focus on Product Development (R&D ~ 20% of revenue)
Retail Payments
Retail payments engines
Card and account management
Authentication, authorization, acquiring, clearing and settlement
Single message format
Mobile payments
Sold to FIs and processors of all sizes globally
Online Banking
U.S. and int’l corporate online banking and cash management
U.S. and Int’l branch systems
Trade finance
Mobile banking
In-house or hosted solution
Sold to Large FIs
Community Banking
U.S. business and consumer online banking
U.S. branch system
Mobile banking
Hosted solutions
Sold to community FIs and credit unions
5
Our Customers Are Top Global Banks, Processors and Retailers
jpmorgan chase & co.
the royal banu of scotland group
RBStm
first data
cibc
moneris solutions
equens payment services for europe
whole foods market
hdfc bank
itau alliance leicester a real plus
bank of america bank of opportunity
oman international bank b.a.o.g
citi group
sears life well spent
bank of china
citibank dbs
lioyds tsb for the journey
hbos plc
bnp paribas
wells fargo
kasikornbank
bangkok bank
bradesco
suntrust
sovereign bank
scotiabank
barclays
safeway ingredients for life
rbc royal bank
unicredit group
pnc
al rajhi bank
hsbc banknorth
the bank of new york mellon
commonwealthbank
bank danamon commerzbank
wal*mart
| 6 |
|
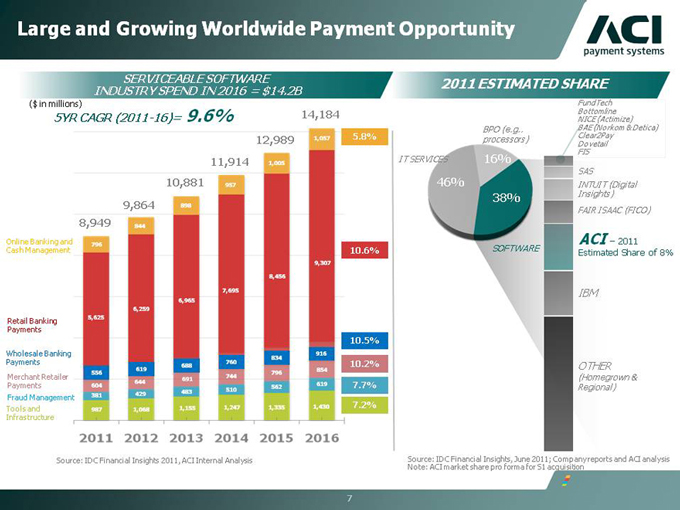
Large and Growing Worldwide Payment Opportunity
SERVICEABLE SOFTWARE
INDUSTRY SPEND IN 2016 = $14.2B
($ in millions)
5YR CAGR (2011-16)= 9.6% 14,184
12,989 1,057 5.8%
11,914 1,005
10,881 957
9,864 898
8,949 844
Online Banking and 796
Cash Management 10.6%
9,307
8,456
7,695
6,965
6,259
Retail Banking 5,625
Payments
10.5%
Wholesale Banking 916
834
Payments 688 760 10.2%
619 854
Merchant Retailer 556 744 796
691
Payments 604 644 510 562 619 7.7%
Fraud Management 381 429 483
Tools and 987 1,068 1,155 1,247 1,335 1,430 7.2%
Infrastructure
2011 2012 2013 2014 2015 2016
Source: IDC Financial Insights 2011, ACI Internal Analysis
2011 ESTIMATED SHARE
FundTech
Bottomline
NICE (Actimize)
BPO (e.g., BAE (Norkom & Detica)
processors) Clear2Pay
Dovetail
IT SERVICES 16% FIS
SAS
46% INTUIT (Digital
38% Insights)
FAIR ISAAC (FICO)
ACI – 2011
SOFTWARE Estimated Share of 8%
IBM
OTHER
(Homegrown &
Regional)
Source: IDC Financial Insights, June 2011; Company reports and ACI analysis
Note: ACI market share pro forma for S1 acquisition
| 7 |
|
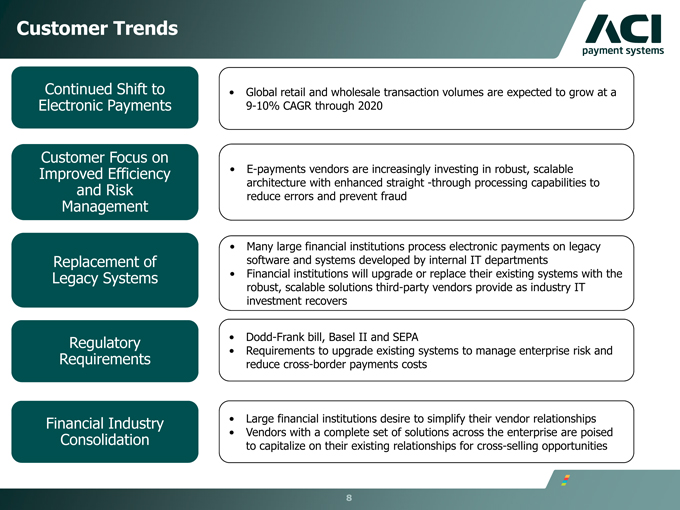
Customer Trends
Continued Shift to Electronic Payments
Customer Focus on Improved Efficiency and Risk Management
Replacement of Legacy Systems
Regulatory Requirements
Financial Industry Consolidation
Global retail and wholesale transaction volumes are expected to grow at a
9-10% CAGR through 2020
E-payments vendors are increasingly investing in robust, scalable architecture with enhanced straight -through processing capabilities to reduce errors and prevent fraud
Many large financial institutions process electronic payments on legacy software and systems developed by internal IT departments Financial institutions will upgrade or replace their existing systems with the robust, scalable solutions third-party vendors provide as industry IT investment recovers
Dodd-Frank bill, Basel II and SEPA
Requirements to upgrade existing systems to manage enterprise risk and reduce cross-border payments costs
Large financial institutions desire to simplify their vendor relationships Vendors with a complete set of solutions across the enterprise are poised to capitalize on their existing relationships for cross-selling opportunities
| 8 |
|
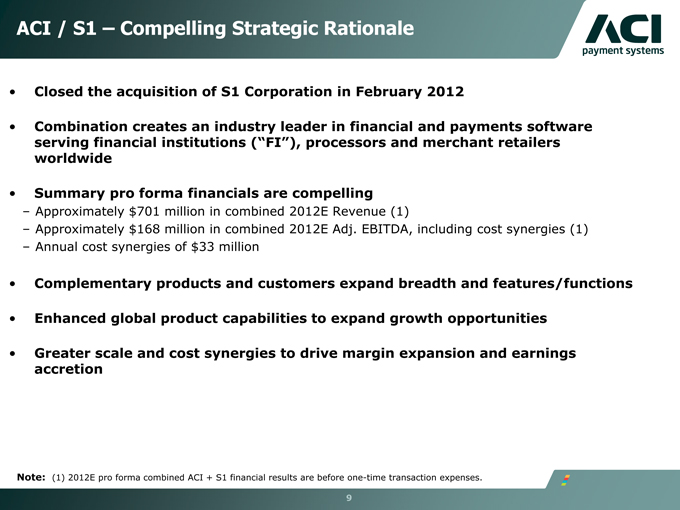
ACI / S1 – Compelling Strategic Rationale
Closed the acquisition of S1 Corporation in February 2012
Combination creates an industry leader in financial and payments software serving financial institutions (“FI”), processors and merchant retailers worldwide
Summary pro forma financials are compelling
– Approximately $701 million in combined 2012E Revenue (1)
– Approximately $168 million in combined 2012E Adj. EBITDA, including cost synergies (1)
– Annual cost synergies of $33 million
Complementary products and customers expand breadth and features/functions
Enhanced global product capabilities to expand growth opportunities
Greater scale and cost synergies to drive margin expansion and earnings accretion
Note: (1) 2012E pro forma combined ACI + S1 financial results are before one-time transaction expenses.
9

Financial overview
10
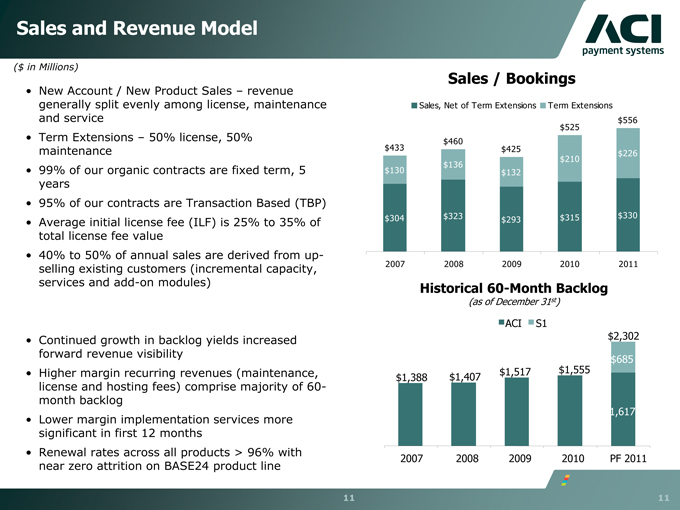
Sales and Revenue Model
($ in Millions)
New Account / New Product Sales – revenue generally split evenly among license, maintenance and service Term Extensions – 50% license, 50% maintenance 99% of our organic contracts are fixed term, 5 years 95% of our contracts are Transaction Based (TBP) Average initial license fee (ILF) is 25% to 35% of total license fee value 40% to 50% of annual sales are derived from up-selling existing customers (incremental capacity, services and add-on modules)
Continued growth in backlog yields increased forward revenue visibility Higher margin recurring revenues (maintenance, license and hosting fees) comprise majority of 60-month backlog Lower margin implementation services more significant in first 12 months Renewal rates across all products > 96% with near zero attrition on BASE24 product line
Sales / Bookings
Sales, Net of Term Extensions Term Extensions
$556
$525
$460
$433 $425 $226
$136 $210
$130 $132
$304 $323 $293 $315 $330
2007 2008 2009 2010 2011
Historical 60-Month Backlog
(as of December 31st)
ACI S1
$2,302
$685
$1,388 $1,407 $1,517 $1,555
$1,617
2007 2008 2009 2010 PF 2011
11
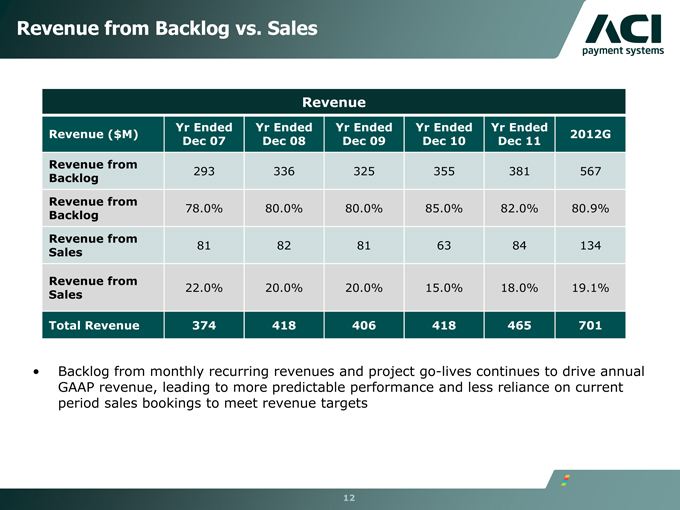
Revenue from Backlog vs. Sales
Revenue
Yr Ended Yr Ended Yr Ended Yr Ended Yr Ended
Revenue ($M) 2012G
Dec 07 Dec 08 Dec 09 Dec 10 Dec 11
Revenue from 293 336 325 355 381 567
Backlog
Revenue from
Backlog 78.0% 80.0% 80.0% 85.0% 82.0% 80.9%
Revenue from 81 82 81 63 84 134
Sales
Revenue from
Sales 22.0% 20.0% 20.0% 15.0% 18.0% 19.1%
Total Revenue 374 418 406 418 465 701
Backlog from monthly recurring revenues and project go-lives continues to drive annual GAAP revenue, leading to more predictable performance and less reliance on current period sales bookings to meet revenue targets
12
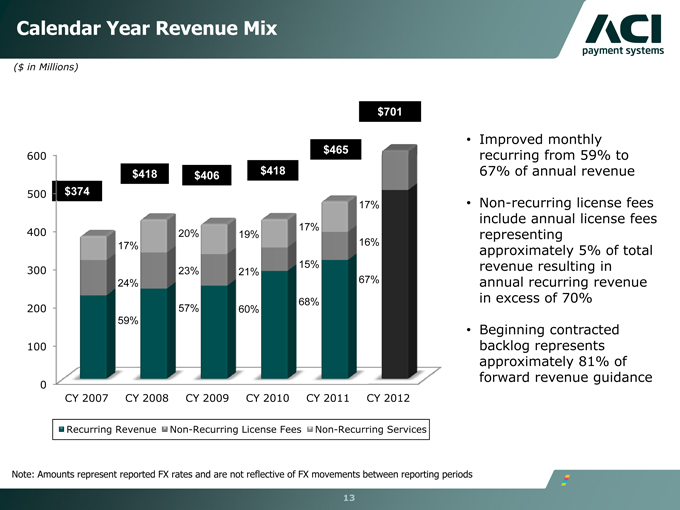
Calendar Year Revenue Mix
($ in Millions)
$701
600 $465
$418 $406 $418
500 $374
17%
400 20% 19% 17%
17% 16%
300 23% 21% 15%
24% 67%
200 57% 60% 68%
59%
100
0
CY 2007 CY 2008 CY 2009 CY 2010 CY 2011 CY 2012
Recurring Revenue Non-Recurring License Fees Non-Recurring Services
Improved monthly recurring from 59% to 67% of annual revenue
Non-recurring license fees include annual license fees representing approximately 5% of total revenue resulting in annual recurring revenue in excess of 70%
Beginning contracted backlog represents approximately 81% of forward revenue guidance
Note: Amounts represent reported FX rates and are not reflective of FX movements between reporting periods
13
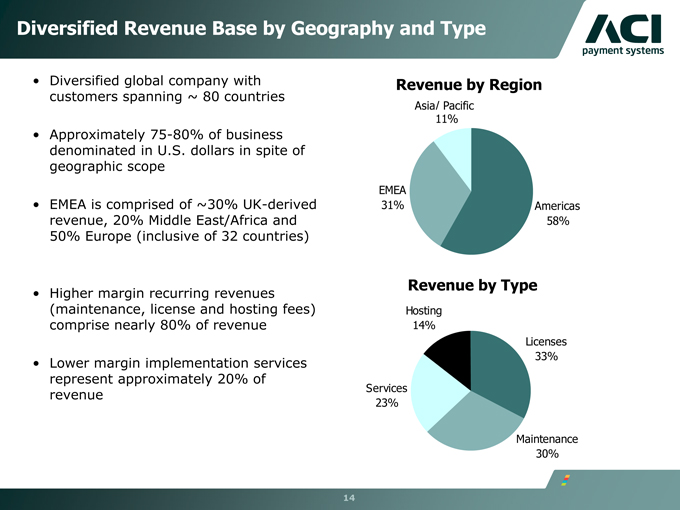
Diversified Revenue Base by Geography and Type
Diversified global company with customers spanning ~ 80 countries
Approximately 75-80% of business denominated in U.S. dollars in spite of geographic scope
EMEA is comprised of ~30% UK-derived revenue, 20% Middle East/Africa and
50% Europe (inclusive of 32 countries)
Higher margin recurring revenues
(maintenance, license and hosting fees) comprise nearly 80% of revenue
Lower margin implementation services represent approximately 20% of revenue
Revenue by Region
Asia/ Pacific
11%
EMEA
31% Americas
58%
Revenue by Type
Hosting
14%
Licenses
33%
Services
23%
Maintenance
30%
14
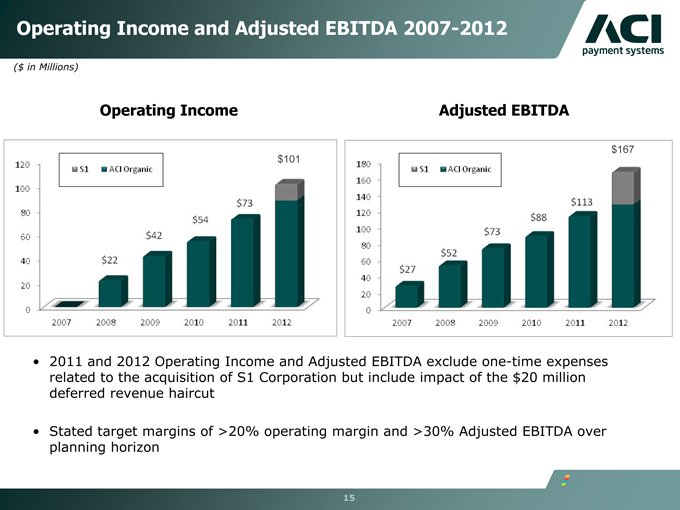
Operating Income and Adjusted EBITDA 2007-2012
($ in Millions)
Operating Income
Adjusted EBITDA
2011 and 2012 Operating Income and Adjusted EBITDA exclude one-time expenses related to the acquisition of S1 Corporation but include impact of the $20 million deferred revenue haircut
Stated target margins of >20% operating margin and >30% Adjusted EBITDA over planning horizon
15
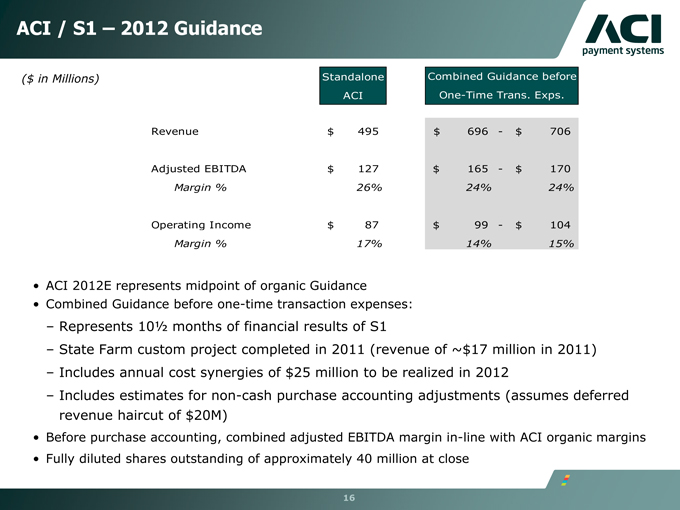
ACI / S1 – 2012 Guidance
($ in Millions) Standalone Combined Guidance before
ACI One-Time Trans. Exps.
Revenue $ 495 $ 696 — $ 706
Adjusted EBITDA $ 127 $ 165 — $ 170
Margin % 26% 24% 24%
Operating Income $ 87 $ 99 — $ 104
Margin % 17% 14% 15%
ACI 2012E represents midpoint of organic Guidance Combined Guidance before one-time transaction expenses:
– Represents 10 1/2 months of financial results of S1
– State Farm custom project completed in 2011 (revenue of ~$17 million in 2011)
– Includes annual cost synergies of $25 million to be realized in 2012
– Includes estimates for non-cash purchase accounting adjustments (assumes deferred revenue haircut of $20M)
Before purchase accounting, combined adjusted EBITDA margin in-line with ACI organic margins Fully diluted shares outstanding of approximately 40 million at close
16
Non-GAAP Financial Measures
ACI includes backlog estimates which are all software license fees, maintenance fees and services specified in executed contracts, as well as revenues from assumed contract renewals to the extent that we believe recognition of the related revenue will occur within the corresponding backlog period. We have historically included assumed renewals in backlog estimates based upon automatic renewal provisions in the executed contract and our historic experience with customer renewal rates.
Backlog is considered a non-GAAP financial measure as defined by SEC Regulation G. Our 60-month backlog estimate represents expected revenues from existing customers using the following key assumptions:
Maintenance fees are assumed to exist for the duration of the license term for those contracts in which the committed maintenance term is less than the committed license term.
License and facilities management arrangements are assumed to renew at the end of their committed term at a rate consistent with our historical experiences.
Non-recurring license arrangements are assumed to renew as recurring revenue streams.
Foreign currency exchange rates are assumed to remain constant over the 60-month backlog period for those contracts stated in currencies other than the U.S. dollar.
Our pricing policies and practices are assumed to remain constant over the 60-month backlog period.
Estimates of future financial results are inherently unreliable. Our backlog estimates require substantial judgment and are based on a number of assumptions as described above. These assumptions may turn out to be inaccurate or wrong, including for reasons outside of management’s control.
17
Non-GAAP Financial Measures
For example, our customers may attempt to renegotiate or terminate their contracts for a number of reasons, including mergers, changes in their financial condition, or general changes in economic conditions in the customer’s industry or geographic location, or we may experience delays in the development or delivery of products or services specified in customer contracts which may cause the actual renewal rates and amounts to differ from historical experiences.
Changes in foreign currency exchange rates may also impact the amount of revenue actually recognized in future periods. Accordingly, there can be no assurance that contracts included in backlog estimates will actually generate the specified revenues or that the actual revenues will be generated within the corresponding 60-month period. Backlog should be considered in addition to, rather than as a substitute for, reported revenue and deferred revenue.
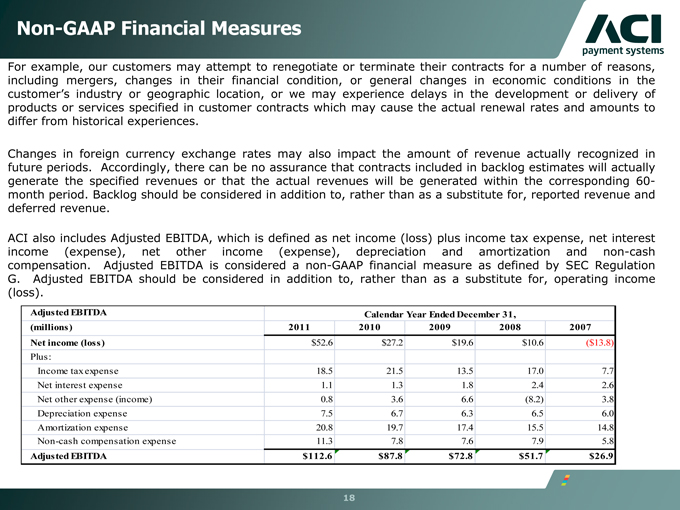
ACI also includes Adjusted EBITDA, which is defined as net income (loss) plus income tax expense, net interest income (expense), net other income (expense), depreciation and amortization and non-cash compensation. Adjusted EBITDA is considered a non-GAAP financial measure as defined by SEC Regulation G. Adjusted EBITDA should be considered in addition to, rather than as a substitute for, operating income (loss).
Adjusted EBITDA Calendar Year Ended December 31,
(millions) 2011 2010 2009 2008 2007
Net income (loss) $52.6 $27.2 $19.6 $10.6 ($13.8)
Plus:
Income tax expense 18.5 21.5 13.5 17.0 7.7
Net interest expense 1.1 1.3 1.8 2.4 2.6
Net other expense (income) 0.8 3.6 6.6 (8.2) 3.8
Depreciation expense 7.5 6.7 6.3 6.5 6.0
Amortization expense 20.8 19.7 17.4 15.5 14.8
Non-cash compensation expense 11.3 7.8 7.6 7.9 5.8
Adjusted EBITDA $112.6 $87.8 $72.8 $51.7 $26.9
18
Forward-Looking Statements
This presentation contains forward-looking statements based on current expectations that involve a number of risks and uncertainties. Generally, forward-looking statements do not relate strictly to historical or current facts and may include words or phrases such as “believes,” “ will,” “expects,” “anticipates,” “intends,” and words and phrases of similar impact. The forward-looking statements are made pursuant to safe harbor provisions of the Private Securities Litigation Reform Act of 1995.
Forward-looking statements in this presentation include, but are not limited to, statements regarding:
Expectations and assumptions regarding the recent acquisition of S1 relating to (i) creating a worldwide industry leader in financial and payments software serving FIs, processors and merchant retailers, (ii) creating compelling pro forma financials, (iii) complementary products and customers expand breadth and features/ functions, (iv) enhanced global product capabilities to expand growth opportunities and (v) greater scale and cost synergies to drive margin expansion and earnings accretion; Expectations related to 2012 customer trends including expectations and assumptions regarding (i) growth in global retail and wholesale transaction volumes, (ii) investment in robust, scalable architecture with enhanced straight-through processing capabilities to reduce errors and prevent fraud, (iii) replacement of existing systems with robust, scalable third-party vendors, (iv) upgrade existing systems to manage risk and reduce cross-border payments costs, (v) simplification of vendor relationships and (vi) vendors poised to capitalize on existing customer relationships leading to cross-selling opportunities; The company’s 12-month and 60-month backlog estimates and assumptions, including our belief that backlog from monthly recurring revenues and project go-lives will continue to drive current quarter GAAP revenue and lead to predictable performance; and Expectations and assumptions regarding (i) ACI/S1 combined 2012 financial guidance related to revenue, operating income and adjusted EBITDA and (ii) expectations and assumptions regarding other factors impacting our 2012 financial guidance.
19
Forward-Looking Statements
All of the foregoing forward-looking statements are expressly qualified by the risk factors discussed in our filings with the Securities and Exchange Commission. Such factors include but are not limited to, risks related to the global financial crisis and the continuing decline in the global economy; volatility and disruption of the capital and credit markets and adverse changes in the global economy; consolidations and failures in the financial services industry; increased competition; restrictions and other financial covenants in our credit facility; the restatement of our financial statements; the accuracy of management’s backlog estimates; impairment of our goodwill or intangible assets; exposure to unknown tax liabilities; risks from operating internationally; our offshore software development activities; customer reluctance to switch to a new vendor; the performance of our strategic product, BASE24-eps; our strategy to migrate customers to our next generation products; ratable or deferred recognition of certain revenue associated with customer migrations and the maturity of certain of our products; demand for our products; failure to obtain renewals of customer contracts or to obtain such renewals on favorable terms; delay or cancellation of customer projects or inaccurate project completion estimates; business interruptions or failure of our information technology and communication systems; our alliance with International Business Machines Corporation (“IBM”); the complexity of our products and services and the risk that they may contain hidden defects or be subjected to security breaches or viruses; compliance of our products with applicable legislation, governmental regulations and industry standards; our compliance with privacy regulations; the protection of our intellectual property in intellectual property litigation; future acquisitions, strategic partnerships and investments and litigation; the risk that expected synergies, operational efficiencies and cost savings from our recent acquisition of S1 Corporation (“S1”) may not be fully realized or realized within the expected timeframe; the cyclical nature of our revenue and earnings and the accuracy of forecasts due to the concentration of revenue generating activity during the final weeks of each quarter; and volatility in our stock price. For a detailed discussion of these risk factors, parties that are relying on the forward-looking statements should review our filings with the Securities and Exchange Commission, including our most recently filed Annual Report on Form 10-K and subsequent reports on Forms 10-Q and 8-K.
20
ACI’s software underpins electronic payments throughout retail and wholesale banking, and commerce all the time, without fail.
www.aciworldwide.com