Attached files
| file | filename |
|---|---|
| 8-K - Q3 2012 EARNINGS RELEASE - Silicon Graphics International Corp | q32012earningsrelease8-k.htm |
| EX-99.1 - Q3 EARNINGS RELEASE - Silicon Graphics International Corp | q3earningsreleaseexhibit991.htm |
Earning Slides for Q3 FY12 NASDAQ: SGI May 9, 2012
©2012 SGI Legal Notice Cautionary Statement Regarding Forward Looking Statements This presentation contains forward-looking statements, including statements regarding management’s expectations about the markets, business, products, operating plans and financial performance of Silicon Graphics International Corp. (“SGI”) as of May 9, 2012. Statements containing words such as “will,” “expect,” “believe,” and “intend,” and other statements in the future tense, are forward-looking statements. Any statements contained in this presentation that are not statements of historical fact may be deemed forward-looking statements. Actual outcomes and results may differ materially from the expectations expressed or implied in these statements due to a number of risks and uncertainties, including, but not limited to, changes in demand for SGI’s products; economic conditions impacting the purchasing decisions of SGI’s customers; the highly competitive market in which SGI operates that may cause pricing pressure on SGI’s solutions; customer concentration risks; SGI’s international operations; market acceptance of new products; lengthy acceptance cycles of products by certain customers; liquidity pressures due to lengthy cash collection cycles on product sales to certain customers; changes in mix of products sold due to differences in profitability among products; changes in the anticipated amounts and timing of restructuring charges to be incurred and cost savings expected to be realized from our restructuring actions in Europe; SGI’s inability to control the supply, timing of delivery and pricing of essential product components; substantial sales to U.S. government entities which is subject to the government’s budgetary constraints; and significant excess or obsolete inventory that SGI may be required to write off in the future. Detailed information about these and other risks and uncertainties that could affect SGI’s business, financial condition and results of operations is set forth in SGI’s Annual Report on Form 10-K under the caption "Risk Factors," which was filed with the Securities and Exchange Commission (“SEC”) on August 29, 2011, as updated by SGI’s subsequent quarterly reports on Form 10-Q and other filings with the SEC, all of which are available at the SEC's web site at http://www.sec.gov. Accordingly, you are cautioned not to place undue reliance on forward-looking statements, which speak only as of the date of this announcement. SGI undertakes no obligation to update the information in this presentation, whether as a result of new information, future events or otherwise, unless otherwise required by law. The SGI logos and SGI product names used or referenced herein are either registered trademarks or trademarks of Silicon Graphics International Corp. or one of its subsidiaries. All other trademarks, trade names, service marks and logos referenced herein belong to their respective holders. Any and all copyright or other proprietary notices that appear herein, together with this Legal Notice, must be retained on this presentation. Non-GAAP Reconciliation All non-GAAP financial measures contained in this presentation are reconciled to GAAP on slide 18 of this presentation. 2
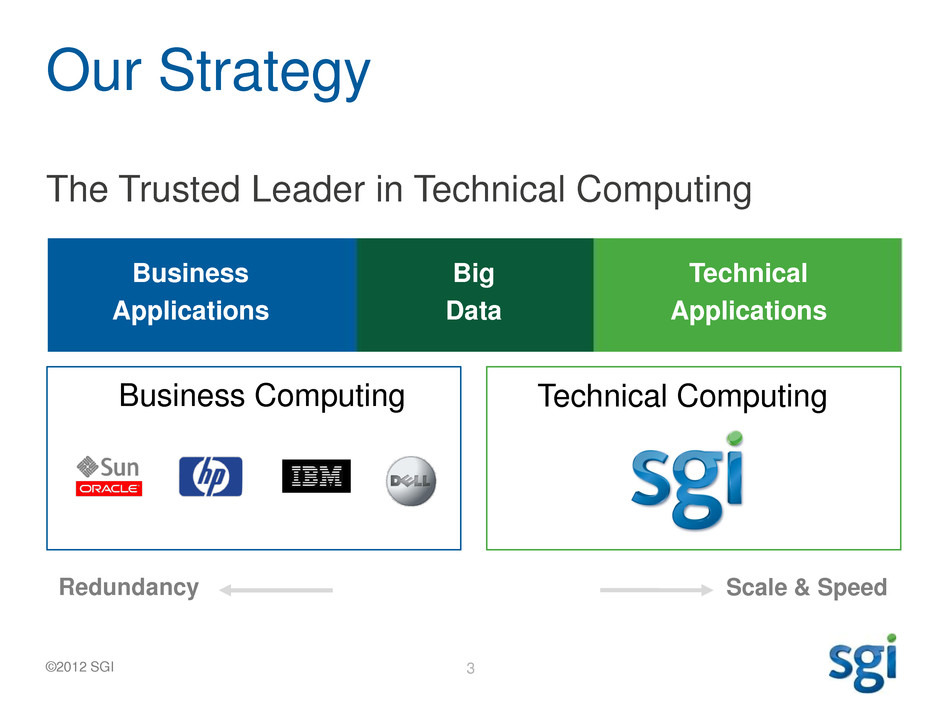
©2012 SGI Our Strategy The Trusted Leader in Technical Computing Business Computing Business Applications Technical Computing Workload Optimized Big Data Technical Applications Redundancy Scale & Speed 3
©2012 SGI Q3 FY12 Business Summary • Right markets and right products – Continued strong momentum in public sector, life sciences, manufacturing – New addition to storage portfolio, next generation of SGI UV on track • Refocusing on profitable growth – Implementing more rigorous deal review process – Reducing cost – A number of low margin deals remain to be recognized in Q4 and through the first half of FY13 • Building multi-year strategic plan – Focusing on adding clarity to product segments and product optimization – Identifying growth and margin opportunity and focus 4
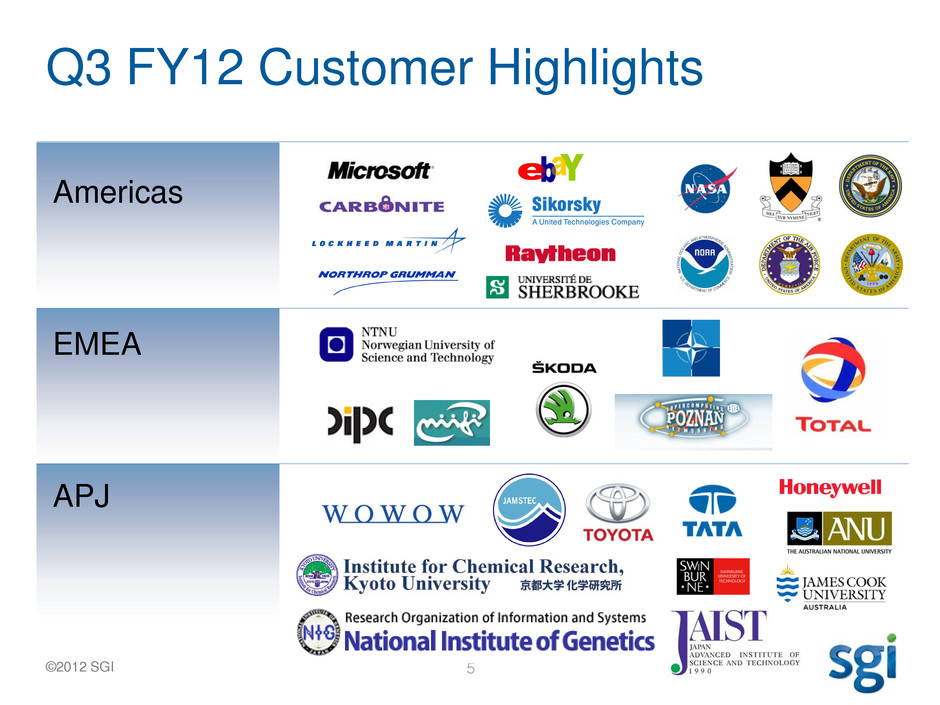
©2012 SGI Q3 FY12 Customer Highlights Americas EMEA APJ 5
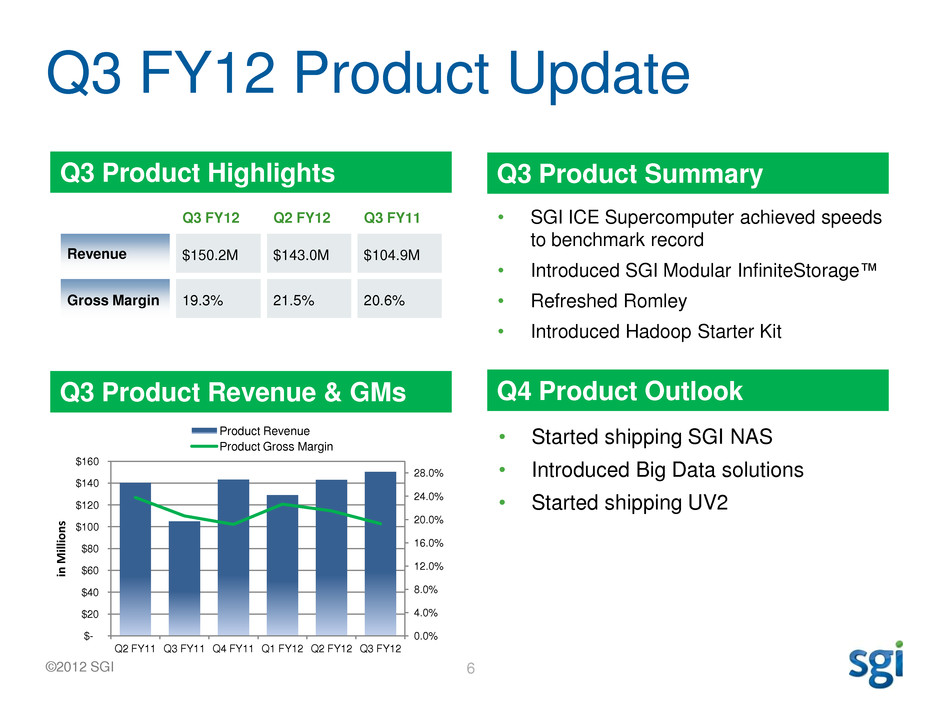
©2012 SGI Q3 FY12 Product Update Q3 Product Highlights Q3 Product Revenue & GMs • SGI ICE Supercomputer achieved speeds to benchmark record • Introduced SGI Modular InfiniteStorage™ • Refreshed Romley • Introduced Hadoop Starter Kit • Started shipping SGI NAS • Introduced Big Data solutions • Started shipping UV2 Q3 Product Summary Q4 Product Outlook 6 Q3 FY12 Q2 FY12 Q3 FY11 Revenue $150.2M $143.0M $104.9M Gross Margin 19.3% 21.5% 20.6% 0.0% 4.0% 8.0% 12.0% 16.0% 20.0% 24.0% 28.0% $- $20 $40 $60 $80 $100 $120 $140 $160 Q2 FY11 Q3 FY11 Q4 FY11 Q1 FY12 Q2 FY12 Q3 FY12 in M ill io n s Product Revenue Product Gross Margin
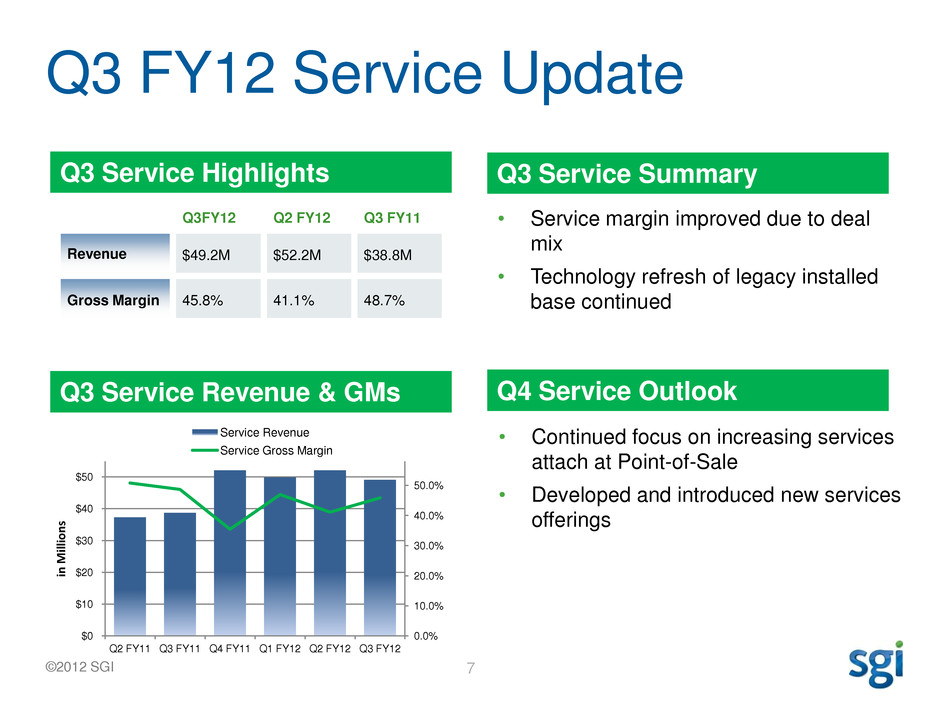
©2012 SGI Q3 FY12 Service Update Q3 Service Highlights Q3 Service Revenue & GMs • Service margin improved due to deal mix • Technology refresh of legacy installed base continued • Continued focus on increasing services attach at Point-of-Sale • Developed and introduced new services offerings Q3 Service Summary Q4 Service Outlook 7 Q3FY12 Q2 FY12 Q3 FY11 Revenue $49.2M $52.2M $38.8M Gross Margin 45.8% 41.1% 48.7% 0.0% 10.0% 20.0% 30.0% 40.0% 50.0% $0 $10 $20 $30 $40 $50 Q2 FY11 Q3 FY11 Q4 FY11 Q1 FY12 Q2 FY12 Q3 FY12 in M ill io n s Service Revenue Service Gross Margin
Financial Update Q3 FY12 8
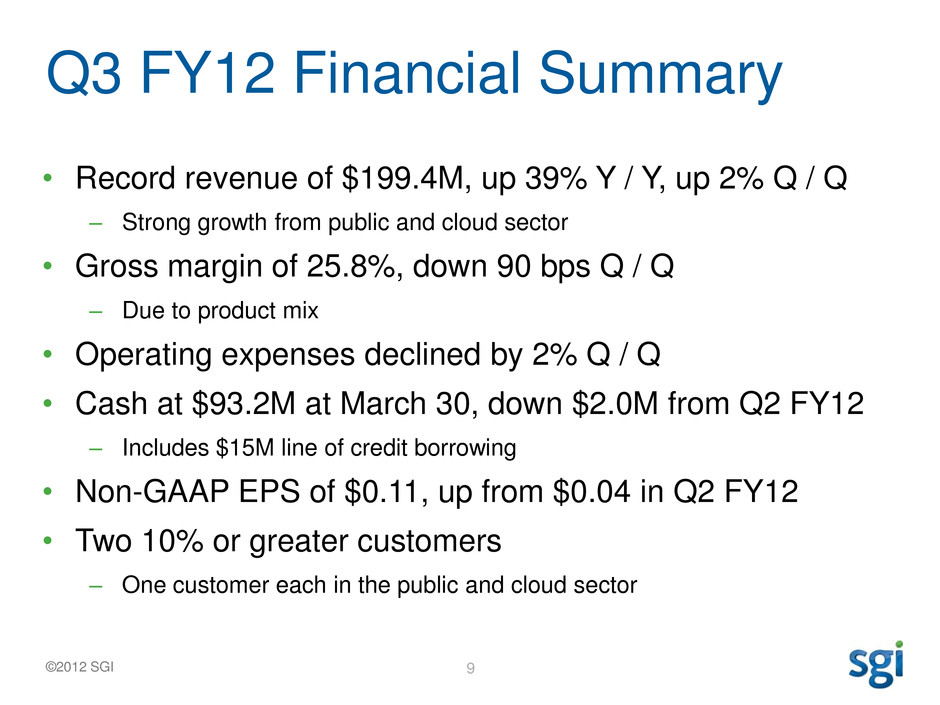
©2012 SGI Q3 FY12 Financial Summary • Record revenue of $199.4M, up 39% Y / Y, up 2% Q / Q – Strong growth from public and cloud sector • Gross margin of 25.8%, down 90 bps Q / Q – Due to product mix • Operating expenses declined by 2% Q / Q • Cash at $93.2M at March 30, down $2.0M from Q2 FY12 – Includes $15M line of credit borrowing • Non-GAAP EPS of $0.11, up from $0.04 in Q2 FY12 • Two 10% or greater customers – One customer each in the public and cloud sector 9
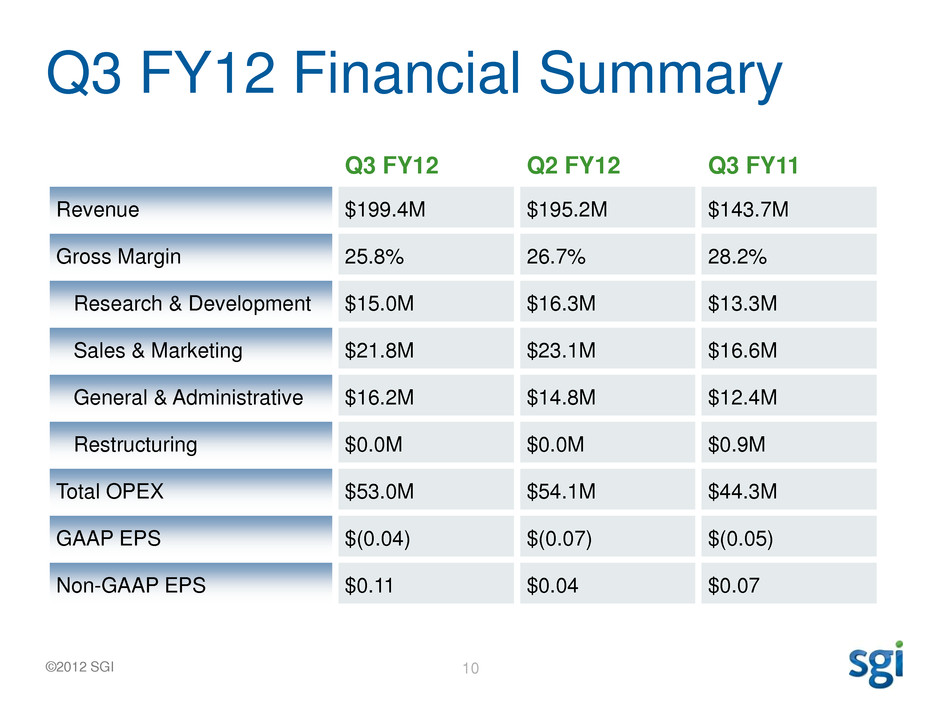
©2012 SGI Q3 FY12 Financial Summary Q3 FY12 Q2 FY12 Q3 FY11 Revenue $199.4M $195.2M $143.7M Gross Margin 25.8% 26.7% 28.2% Research & Development $15.0M $16.3M $13.3M Sales & Marketing $21.8M $23.1M $16.6M General & Administrative $16.2M $14.8M $12.4M Restructuring $0.0M $0.0M $0.9M Total OPEX $53.0M $54.1M $44.3M GAAP EPS $(0.04) $(0.07) $(0.05) Non-GAAP EPS $0.11 $0.04 $0.07 10
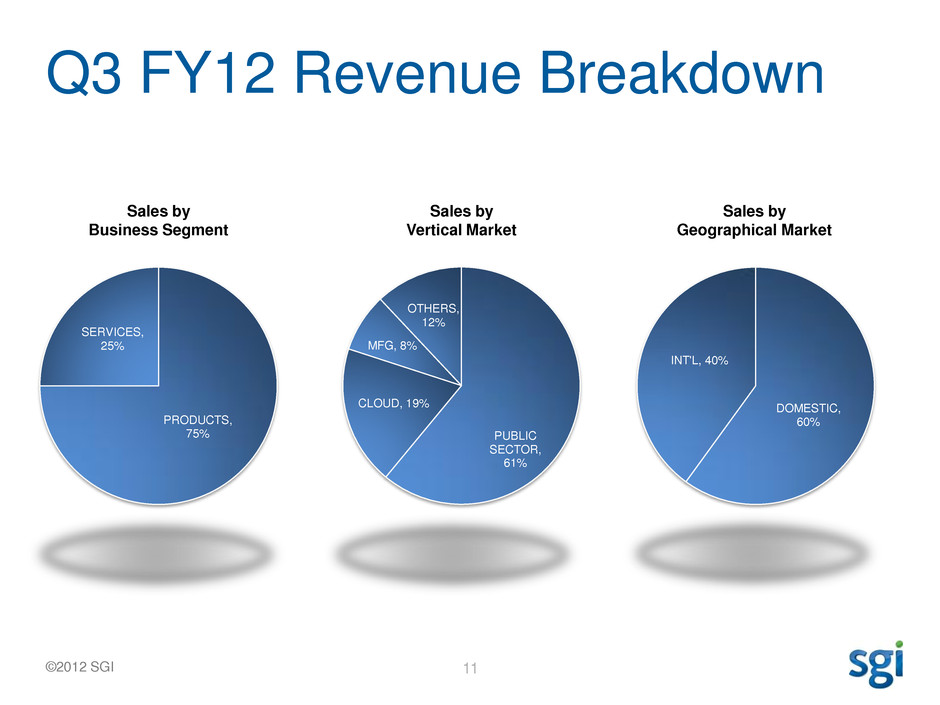
©2012 SGI Q3 FY12 Revenue Breakdown 11 PUBLIC SECTOR, 61% CLOUD, 19% MFG, 8% OTHERS, 12% , 0 Sales by Vertical Market Sales by Geographical Market Sales by Business Segment DOMESTIC, 60% INT'L, 40% PRODUCTS, 75% SERVICES, 25% , 0
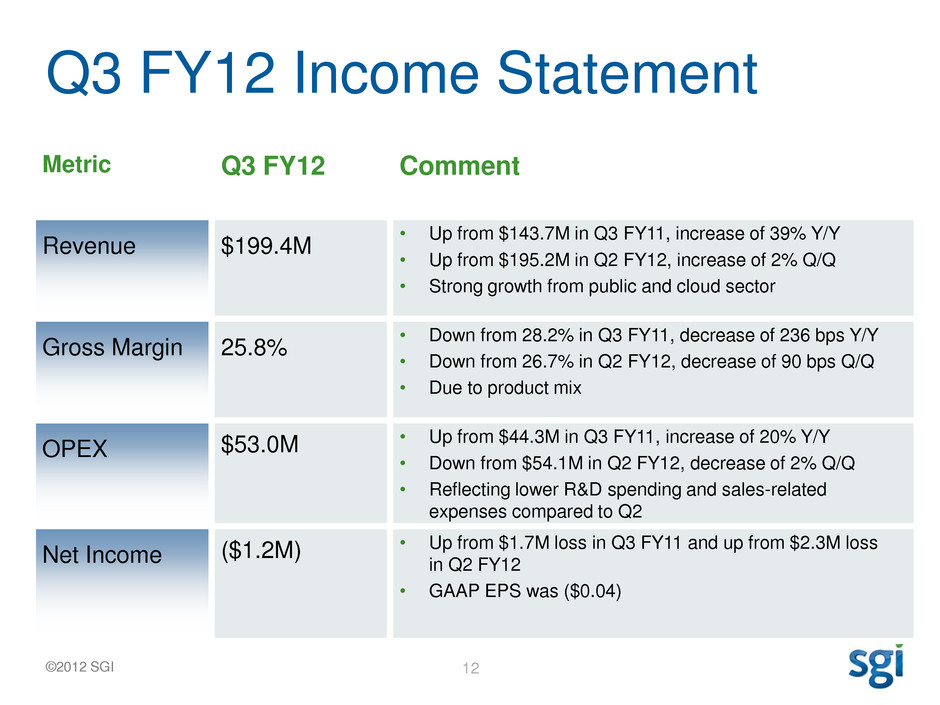
©2012 SGI Q3 FY12 Income Statement 12 Metric Q3 FY12 Comment Revenue $199.4M • Up from $143.7M in Q3 FY11, increase of 39% Y/Y • Up from $195.2M in Q2 FY12, increase of 2% Q/Q • Strong growth from public and cloud sector Gross Margin 25.8% • Down from 28.2% in Q3 FY11, decrease of 236 bps Y/Y • Down from 26.7% in Q2 FY12, decrease of 90 bps Q/Q • Due to product mix OPEX $53.0M • Up from $44.3M in Q3 FY11, increase of 20% Y/Y • Down from $54.1M in Q2 FY12, decrease of 2% Q/Q • Reflecting lower R&D spending and sales-related expenses compared to Q2 Net Income ($1.2M) • Up from $1.7M loss in Q3 FY11 and up from $2.3M loss in Q2 FY12 • GAAP EPS was ($0.04)
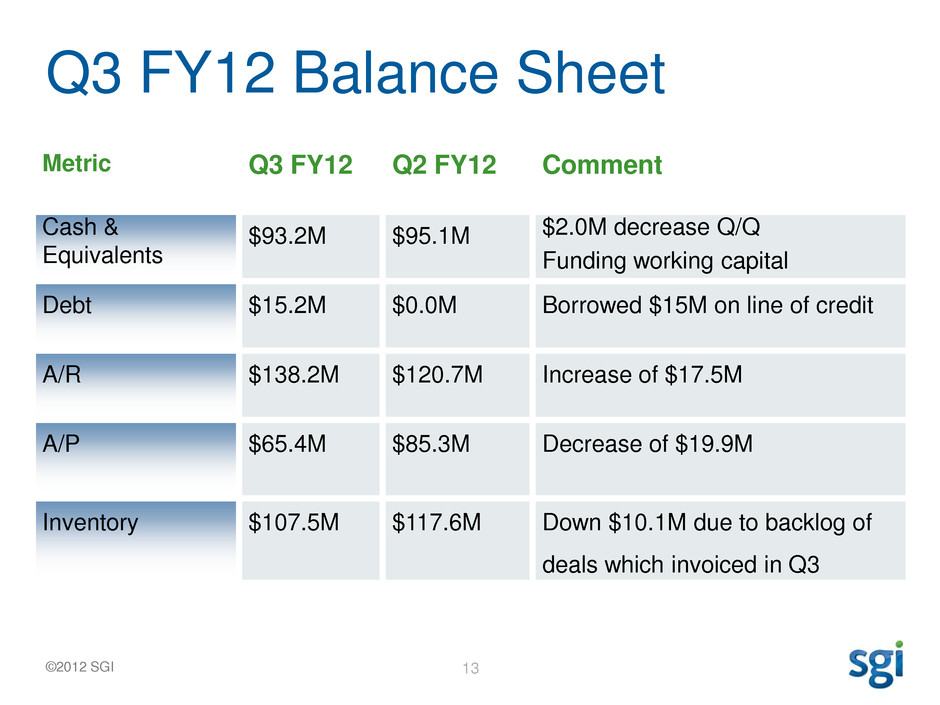
©2012 SGI Q3 FY12 Balance Sheet 13 Metric Q3 FY12 Q2 FY12 Comment Cash & Equivalents $93.2M $95.1M $2.0M decrease Q/Q Funding working capital Debt $15.2M $0.0M Borrowed $15M on line of credit A/R $138.2M $120.7M Increase of $17.5M A/P $65.4M $85.3M Decrease of $19.9M Inventory $107.5M $117.6M Down $10.1M due to backlog of deals which invoiced in Q3
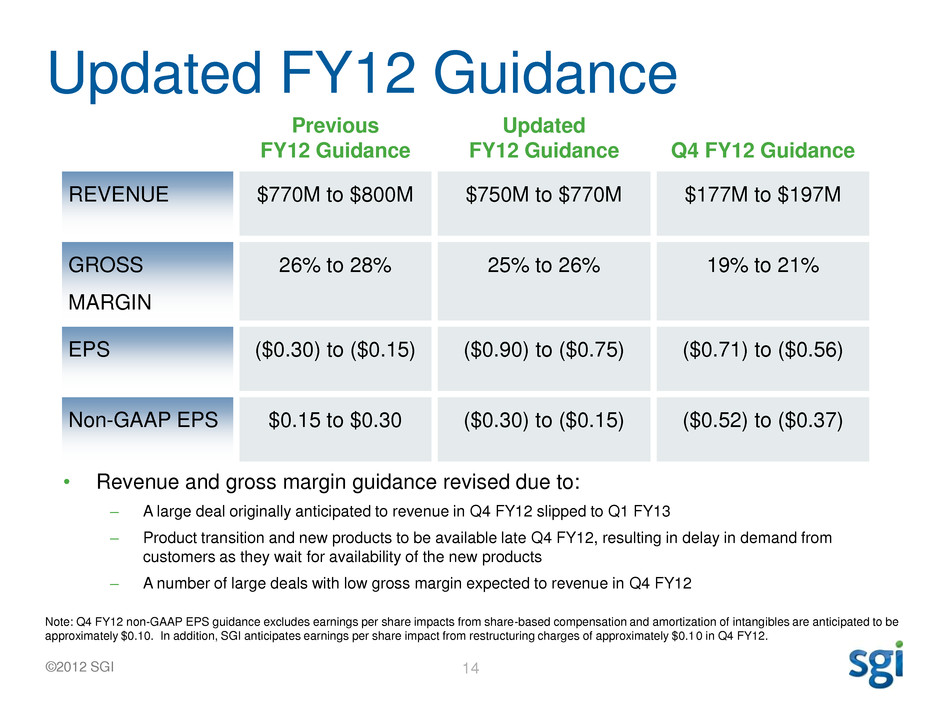
©2012 SGI Updated FY12 Guidance 14 Previous FY12 Guidance Updated FY12 Guidance Q4 FY12 Guidance REVENUE $770M to $800M $750M to $770M $177M to $197M GROSS MARGIN 26% to 28% 25% to 26% 19% to 21% EPS ($0.30) to ($0.15) ($0.90) to ($0.75) ($0.71) to ($0.56) Non-GAAP EPS $0.15 to $0.30 ($0.30) to ($0.15) ($0.52) to ($0.37) • Revenue and gross margin guidance revised due to: – A large deal originally anticipated to revenue in Q4 FY12 slipped to Q1 FY13 – Product transition and new products to be available late Q4 FY12, resulting in delay in demand from customers as they wait for availability of the new products – A number of large deals with low gross margin expected to revenue in Q4 FY12 Note: Q4 FY12 non-GAAP EPS guidance excludes earnings per share impacts from share-based compensation and amortization of intangibles are anticipated to be approximately $0.10. In addition, SGI anticipates earnings per share impact from restructuring charges of approximately $0.10 in Q4 FY12.
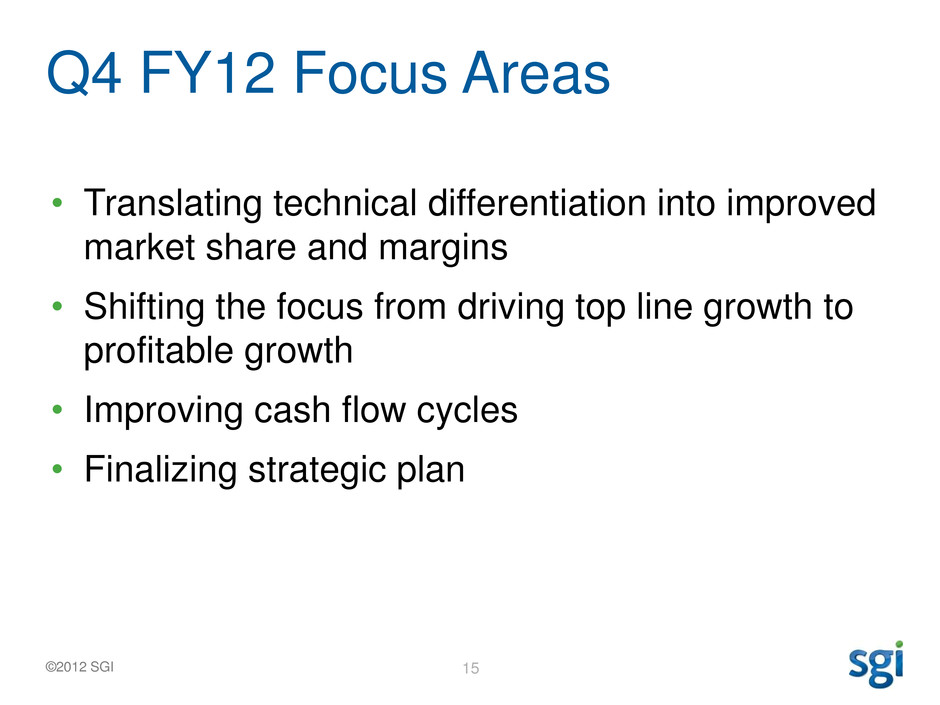
©2012 SGI Q4 FY12 Focus Areas • Translating technical differentiation into improved market share and margins • Shifting the focus from driving top line growth to profitable growth • Improving cash flow cycles • Finalizing strategic plan 15
Appendix 16
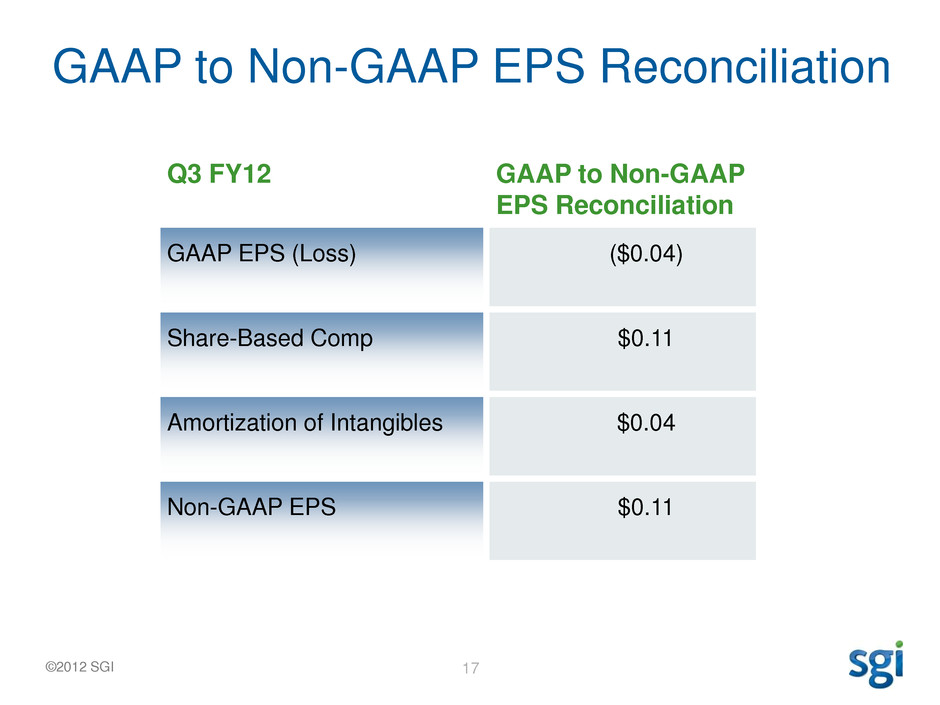
©2012 SGI GAAP to Non-GAAP EPS Reconciliation 17 Q3 FY12 GAAP to Non-GAAP EPS Reconciliation GAAP EPS (Loss) ($0.04) Share-Based Comp $0.11 Amortization of Intangibles $0.04 Non-GAAP EPS $0.11
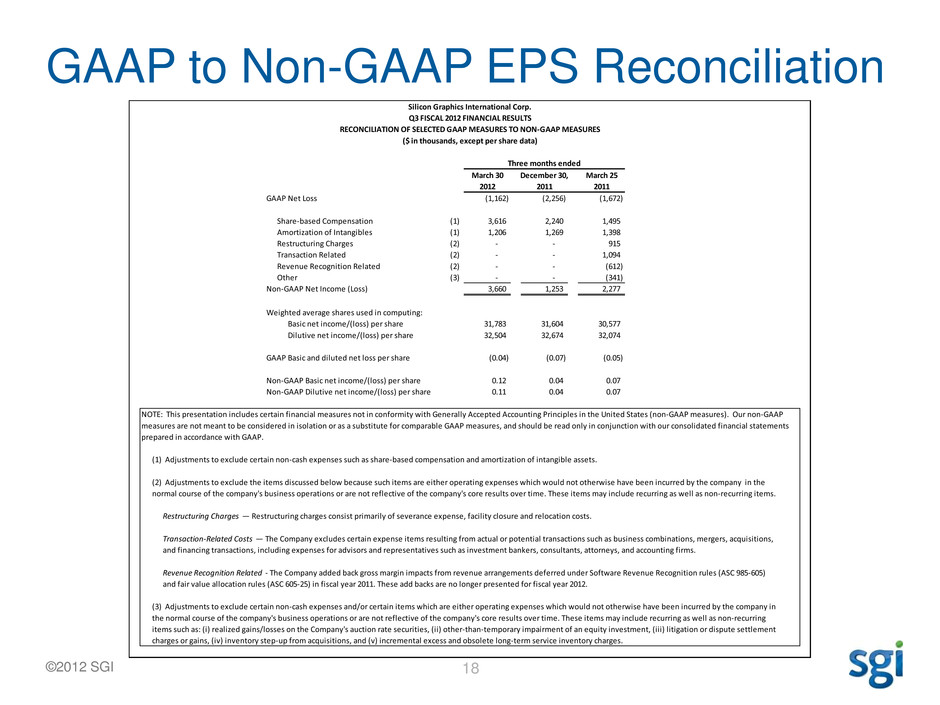
©2012 SGI GAAP to Non-GAAP EPS Reconciliation 18 March 30 December 30, March 25 2012 2011 2011 GAAP Net Loss (1,162) (2,256) (1,672) Share-based Compensation (1) 3,616 2,240 1,495 Amortization of Intangibles (1) 1,206 1,269 1,398 Restructuring Charges (2) - - 915 Transaction Related (2) - - 1,094 Revenue Recognition Related (2) - - (612) Other (3) - - (341) Non-GAAP Net Income (Loss) 3,660 1,253 2,277 Weighted average shares used in computing: Basic net income/(loss) per share 31,783 31,604 30,577 Dilutive net income/(loss) per share 32,504 32,674 32,074 GAAP Basic and diluted net loss per share (0.04) (0.07) (0.05) Non-GAAP Basic net income/(loss) per share 0.12 0.04 0.07 Non-GAAP Dilutive net income/(loss) per share 0.11 0.04 0.07 (1) Adjustments to exclude certain non-cash expenses such as share-based compensation and amortization of intangible assets. Restructuring Charges — Restructuring charges consist primarily of severance expense, facility closure and relocation costs. (3) Adjustments to exclude certain non-cash expenses and/or certain items which are either operating expenses which would not otherwise have been incurred by the company in the normal course of the company's business operations or are not reflective of the company's core results over time. These items may include recurring as well as non-recurring items such as: (i) realized gains/losses on the Company's auction rate securities, (ii) other-than-temporary impairment of an equity investment, (iii) litigation or dispute settlement charges or gains, (iv) inventory step-up from acquisitions, and (v) incremental excess and obsolete long-term service inventory charges. NOTE: This presentation includes certain financial measures not in conformity with Generally Accepted Accounting Principles in the United States (non-GAAP measures). Our non-GAAP measures are not meant to be considered in isolation or as a substitute for comparable GAAP measures, and should be read only in conjunction with our consolidated financial statements prepared in accordance with GAAP. (2) Adjustments to exclude the items discussed below because such items are either operating expenses which would not otherwise have been incurred by the company in the normal course of the company's business operations or are not reflective of the company's core results over time. These items may include recurring as well as non-recurring items. Transaction-Related Costs — The Company excludes certain expense items resulting from actual or potential transactions such as business combinations, mergers, acquisitions, and financing transactions, including expenses for advisors and representatives such as investment bankers, consultants, attorneys, and accounting firms. Revenue Recognition Related - The Company added back gross margin impacts from revenue arrangements deferred under Software Revenue Recognition rules (ASC 985-605) and fair value allocation rules (ASC 605-25) in fiscal year 2011. These add backs are no longer presented for fiscal year 2012. Silicon Graphics International Corp. Q3 FISCAL 2012 FINANCIAL RESULTS RECONCILIATION OF SELECTED GAAP MEASURES TO NON-GAAP MEASURES ($ in thousands, except per share data) Three months ended
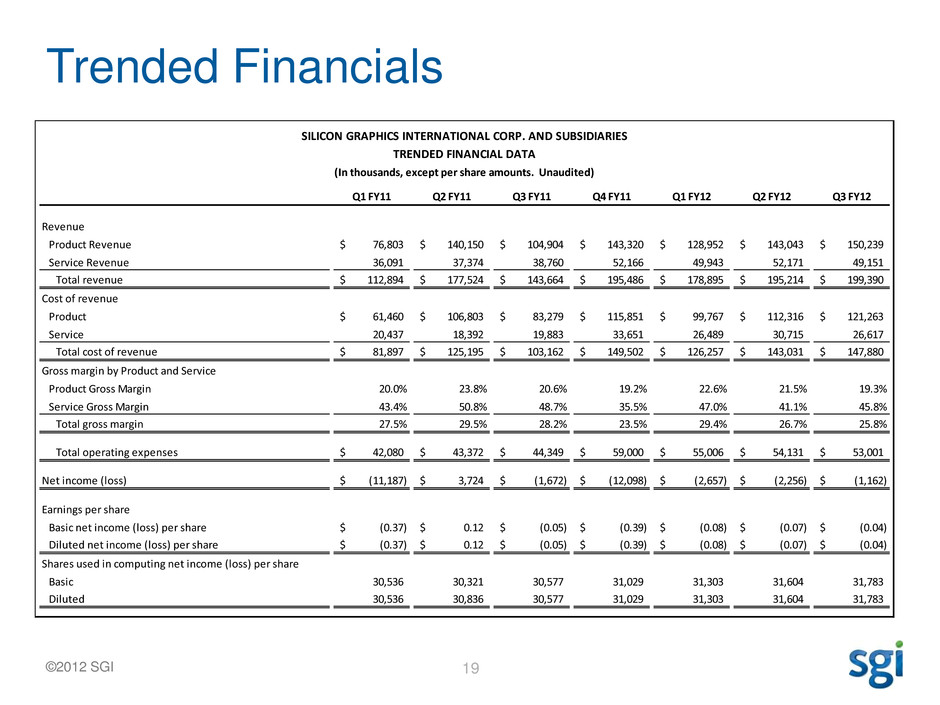
©2012 SGI Trended Financials 19 SILICON GRAPHICS INTERNATIONAL CORP. AND SUBSIDIARIES TRENDED FINANCIAL DATA (In thousands, except per share amounts. Unaudited) Q1 FY11 Q2 FY11 Q3 FY11 Q4 FY11 Q1 FY12 Q2 FY12 Q3 FY12 Revenue Product Revenue 76,803$ 140,150$ 104,904$ 143,320$ 128,952$ 143,043$ 150,239$ Service Revenue 36,091 37,374 38,760 52,166 49,943 52,171 49,151 Total revenue 112,894$ 177,524$ 143,664$ 195,486$ 178,895$ 195,214$ 199,390$ Cost of revenue Product 61,460$ 106,803$ 83,279$ 115,851$ 99,767$ 112,316$ 121,263$ Service 20,437 18,392 19,883 33,651 26,489 30,715 26,617 Total cost of revenue 81,897$ 125,195$ 103,162$ 149,502$ 126,257$ 143,031$ 147,880$ Gross margin by Product and Service Product Gross Margin 20.0% 23.8% 20.6% 19.2% 22.6% 21.5% 19.3% Service Gross Margin 43.4% 50.8% 48.7% 35.5% 47.0% 41.1% 45.8% Total gross margin 27.5% 29.5% 28.2% 23.5% 29.4% 26.7% 25.8% Total operating expenses 42,080$ 43,372$ 44,349$ 59,000$ 55,006$ 54,131$ 53,001$ Net income (loss) (11,187)$ 3,724$ (1,672)$ (12,098)$ (2,657)$ (2,256)$ (1,162)$ Earnings per share Basic net income (loss) per share (0.37)$ 0.12$ (0.05)$ (0.39)$ (0.08)$ (0.07)$ (0.04)$ Diluted net income (loss) per share (0.37)$ 0.12$ (0.05)$ (0.39)$ (0.08)$ (0.07)$ (0.04)$ Shares used in computing net income (loss) per share Basic 30,536 30,321 30,577 31,029 31,303 31,604 31,783 Diluted 30,536 30,836 30,577 31,029 31,303 31,604 31,783
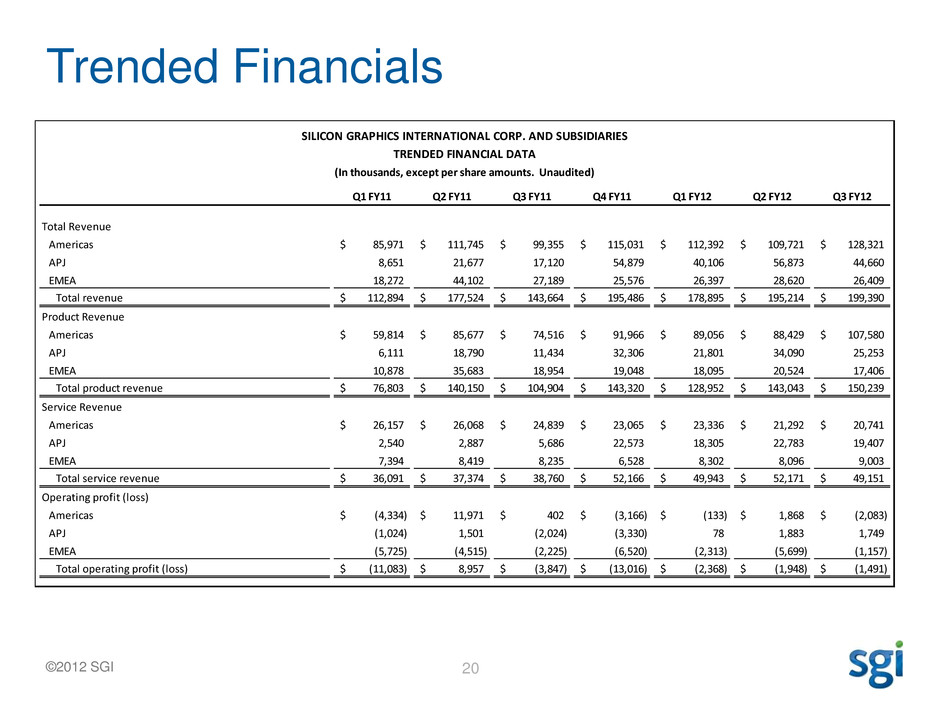
©2012 SGI Trended Financials 20 SILICON GRAPHICS INTERNATIONAL CORP. AND SUBSIDIARIES TRENDED FINANCIAL DATA (In thousands, except per share amounts. Unaudited) Q1 FY11 Q2 FY11 Q3 FY11 Q4 FY11 Q1 FY12 Q2 FY12 Q3 FY12 Total Revenue Americas 85,971$ 111,745$ 99,355$ 115,031$ 112,392$ 109,721$ 128,321$ APJ 8,651 21,677 17,120 54,879 40,106 56,873 44,660 EMEA 18,272 44,102 27,189 25,576 26,397 28,620 26,409 Total revenue 112,894$ 177,524$ 143,664$ 195,486$ 178,895$ 195,214$ 199,390$ Product Revenue Americas 59,814$ 85,677$ 74,516$ 91,966$ 89,056$ 88,429$ 107,580$ APJ 6,111 18,790 11,434 32,306 21,801 34,090 25,253 EMEA 10,878 35,683 18,954 19,048 18,095 20,524 17,406 Total product revenue 76,803$ 140,150$ 104,904$ 143,320$ 128,952$ 143,043$ 150,239$ Service Revenue Americas 26,157$ 26,068$ 24,839$ 23,065$ 23,336$ 21,292$ 20,741$ APJ 2,540 2,887 5,686 22,573 18,305 22,783 19,407 EMEA 7,394 8,419 8,235 6,528 8,302 8,096 9,003 Total service revenue 36,091$ 37,374$ 38,760$ 52,166$ 49,943$ 52,171$ 49,151$ Operating profit (loss) Americas (4,334)$ 11,971$ 402$ (3,166)$ (133)$ 1,868$ (2,083)$ APJ (1,024) 1,501 (2,024) (3,330) 78 1,883 1,749 EMEA (5,725) (4,515) (2,225) (6,520) (2,313) (5,699) (1,157) Total operating profit (loss) (11,083)$ 8,957$ (3,847)$ (13,016)$ (2,368)$ (1,948)$ (1,491)$
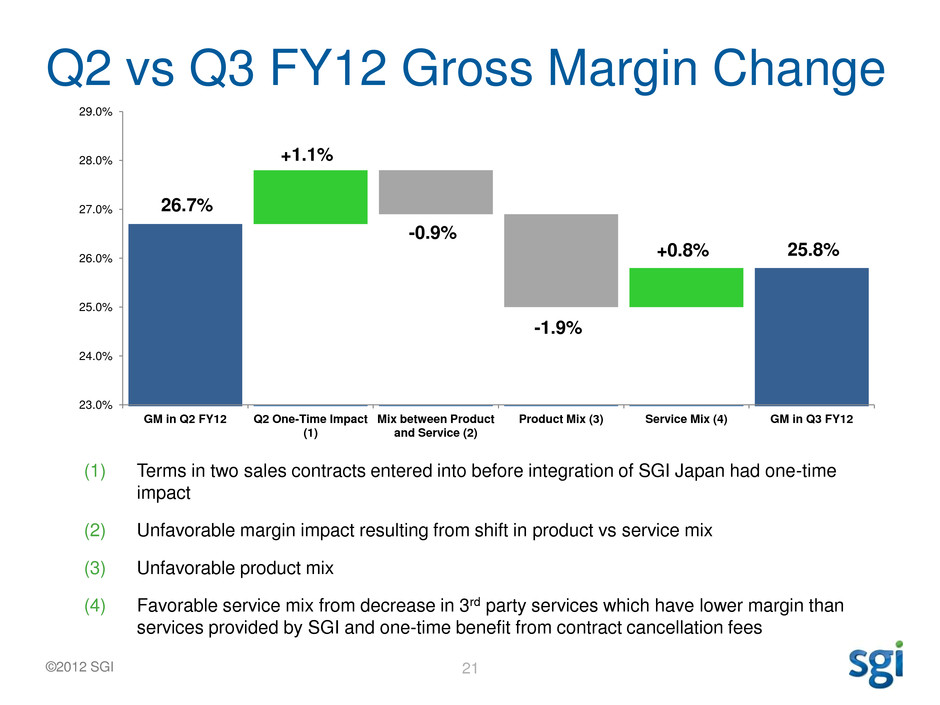
©2012 SGI Q2 vs Q3 FY12 Gross Margin Change 21 26.7% +1.1% -0.9% -1.9% +0.8% 25.8% 23.0% 24.0% 25.0% 26.0% 27.0% 28.0% 29.0% GM in Q2 FY12 Q2 One-Time Impact (1) Mix between Product and Service (2) Product Mix (3) Service Mix (4) GM in Q3 FY12 (1) Terms in two sales contracts entered into before integration of SGI Japan had one-time impact (2) Unfavorable margin impact resulting from shift in product vs service mix (3) Unfavorable product mix (4) Favorable service mix from decrease in 3rd party services which have lower margin than services provided by SGI and one-time benefit from contract cancellation fees
©2012 SGI 22
