Attached files
| file | filename |
|---|---|
| 8-K - FORM 8-K - HomeStreet, Inc. | d352063d8k.htm |
 D.A. Davidson & Co. Conference
Seattle, WA -
May 10, 2012
Exhibit 99.1 |
 2
2
Important Disclosures
Forward-Looking Statements
We may make forward-looking statements during today's presentation that are
subject to many risks and uncertainties. These forward-looking
statements are based on the Company’s current expectations, beliefs, projections, future plans and
strategies,
anticipated
events
or
trends
and
similar
expressions
concerning
matters
that
are
not
historical
facts,
as
well
as
a
number
of
assumptions
concerning
future
events.
These
statements
are
subject
to
risks,
uncertainties,
assumptions
and
other important factors set forth in our SEC filings, including but not limited to
our 2011 annual report on form 10-K, our proxy statement and the form
8-K containing our earnings release, many of which are outside of the Company’s control. Such
factors
could
cause
actual
results
to
differ
materially
from
the
results
discussed
or
implied
in
the
forward-looking
statements.
Actual results may differ materially from those expressed or implied and there can
be no assurance that estimated returns or projections will be realized or
that actual returns will not be materially different than estimated herein. Accordingly you are
cautioned not to place undue reliance on such forward-looking statements. All
forward looking statements are based on information available to the Company
as of the date hereof and the Company assumes no obligation to, and expressly
disclaims any obligation to, update or revise any forward looking statements, for
any reason. Basis of Presentation of Financial Data
Unless noted otherwise in this presentation, all reported financial data is being
presented as of the period ending March 31, 2012.
Non-GAAP Financial Measures
Information on any non-GAAP financial measures referenced in today’s
presentation, including a reconciliation of those measures to GAAP measures,
may also be found in our SEC filings and in the earnings release available on our web site. |
 3
3
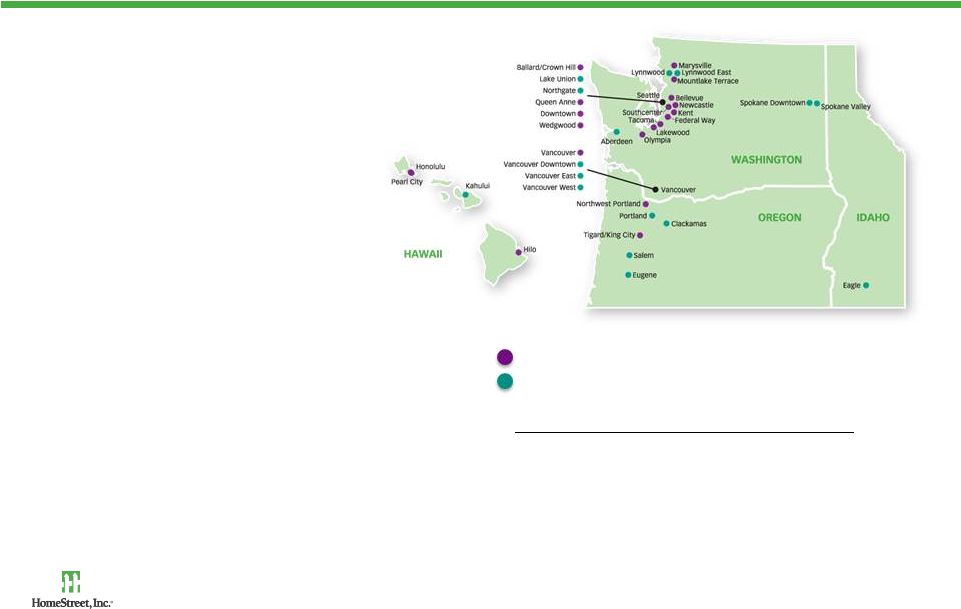
Established Pacific Northwest Franchise
•
90-year-old diversified
financial services company
headquartered in Seattle
•
$2.37 billion institution with
20 retail branches and 18
lending centers
•
Large high-quality
mortgage banking
operation
•
Over $2 billion in deposits
•
Attractive PNW
demographics
•
Largest community bank
headquartered in Seattle
State
# of Branches
Washington
26
Oregon
6
Hawaii
5
Idaho
1
HomeStreet retail branches (20)
HomeStreet lending centers (18) |
 4
4
4
Diversified Lines of Business
Community Banking
•
Deposit products
•
Investment product
•
Cash management services
•
Consumer and business loans
•
Insurance products
Single Family Mortgage Lending
•
Originate and sell loans into secondary
market directly and through WMS
•
Originate and service portfolio loans
•
Includes home equity loans and lines
•
Oldest continuous relationship of all
FM seller servicers in nation
Income Property Lending
Residential Construction Lending
•
Focus on multifamily
•
One of 25 Fannie Mae DUS
®
lenders;
only one based in PNW
•
Originate and service commercial
construction, bridge and permanent
loans for portfolio and sale
•
Originate residential construction
portfolio loans
•
Generally short duration
•
Primarily home building
•
Limited land exposure |
 5
5
Recent Developments
•
Initial Public Offering completed in February 2012
–
4,361,816 shares issued, raising $88.7 million of net proceeds
–
$65 million of net proceeds subsequently contributed to HomeStreet Bank
•
Termination of Bank regulatory order in March 2012
–
Replaced
with
informal
agreement
–
9%
Tier
1
minimum
•
Increased Single Family mortgage origination personnel by 50%
-
Hired
170
originators
and
support
personnel
–
previously
with
MetLife
Home
Loans
-
New personnel contributed $207 million of Single Family rate lock volume in Q1
-
Opening 13 new mortgage lending centers in Washington, Oregon and Idaho |
 6
6
Q1 2012 Results
Q1 2012
Q4 2011
Net Income
$19.1 million
$7.0 million
Diluted EPS
$3.55
$2.42
ROAA
3.3%
1.2%
ROAE
54.1%
33.4%
Net Interest Margin
2.53%
2.50%
Operating Efficiency
(1)
62%
75%
Tier 1 Leverage Ratio
9.3%
6.0%
Total Risk-Based Capital
15.5%
11.2%
(1)
See Appendix for reconciliation of non-GAAP financial measures.
|
 7
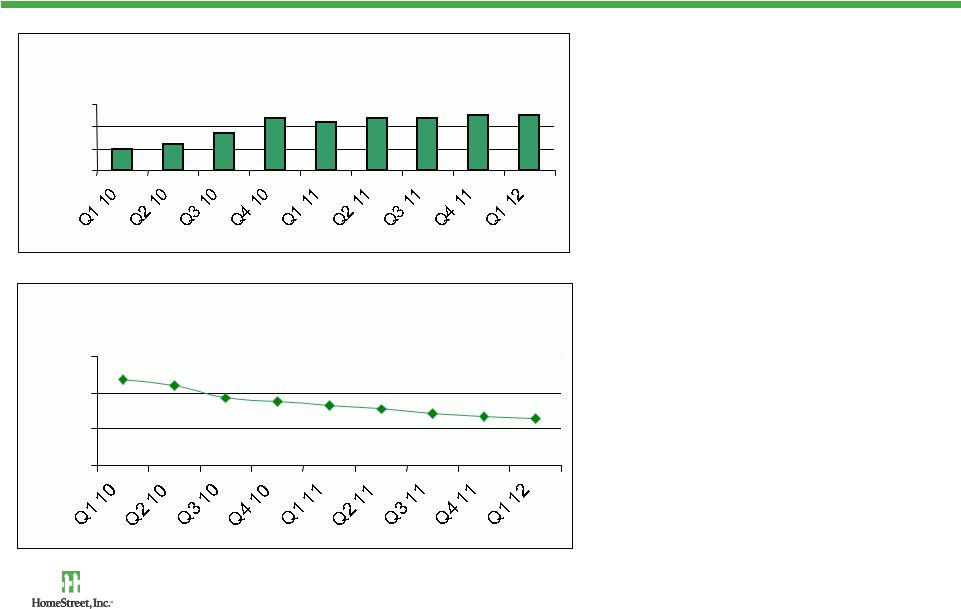
Retail Deposit Funding Base
•
NIM increased to 2.53% in Q1
•
Cost of funding declined to
1.27% in Q1
–
Repricing, roll off or
conversion of CDs
–
Reduction in borrowings and
brokered deposits
–
Acquisition of new core
customers
Net Income Margin (%)
0.96%
1.16%
1.68%
2.34%
2.17%
2.35%
2.38%
2.50%
2.53%
0.00%
1.00%
2.00%
3.00%
Average Cost of Funds
2.35%
2.20%
1.87%
1.74%
1.65%
1.56%
1.43%
1.34%
1.27%
0.00%
1.00%
2.00%
3.00% |
 8
8
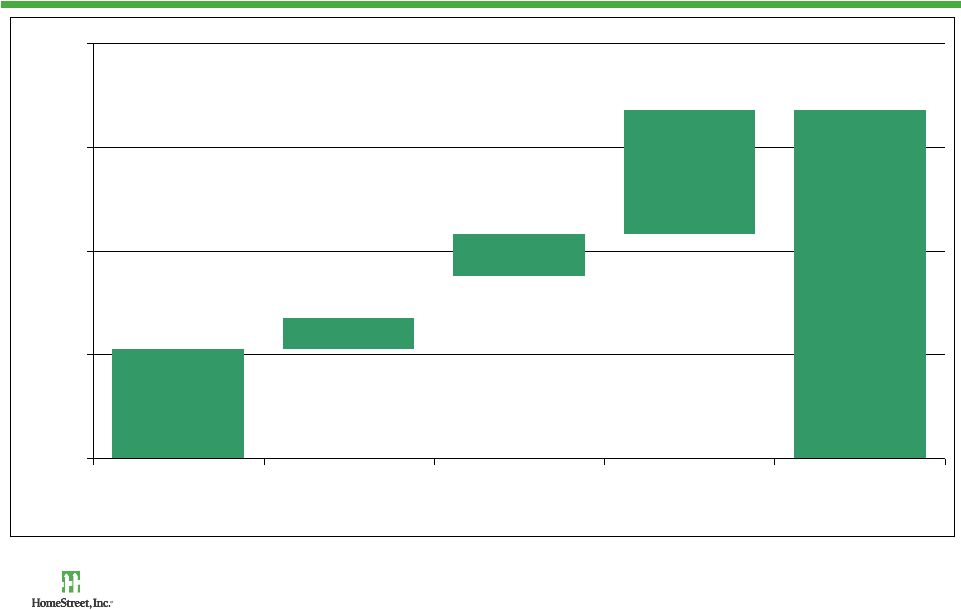
Net Interest Margin Expansion Opportunity
2.00%
2.50%
3.00%
3.50%
4.00%
03/31/12 NIM
Invested Net IPO
Proceeds
Increase Yields &
Reduction in NPLs
Change Balance
Sheet Mix
Q4 2013 Target
2.53%
.10% - 20%
.15% - .25%
.50% - .60%
3.50% -
3.75% |
 9
9
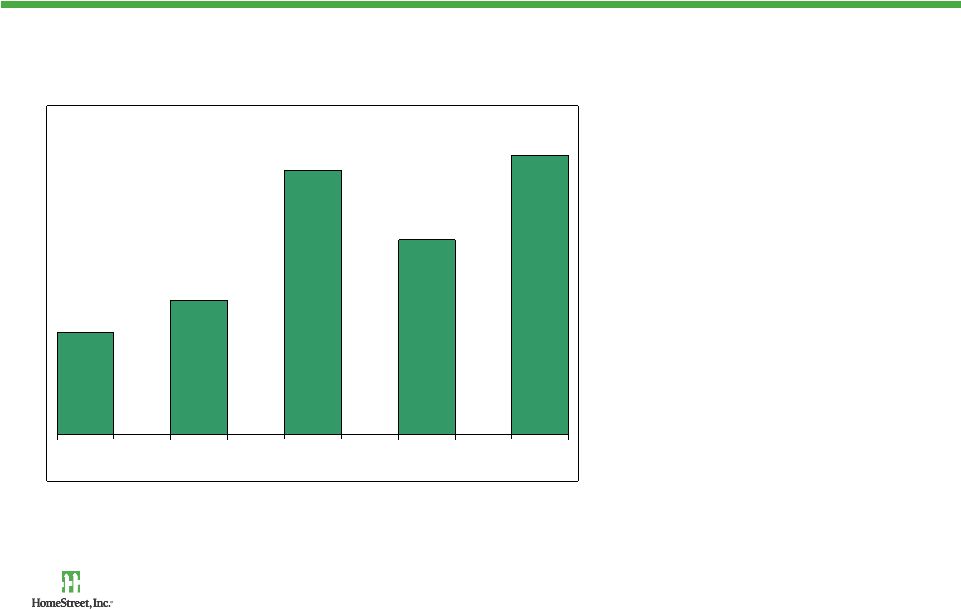
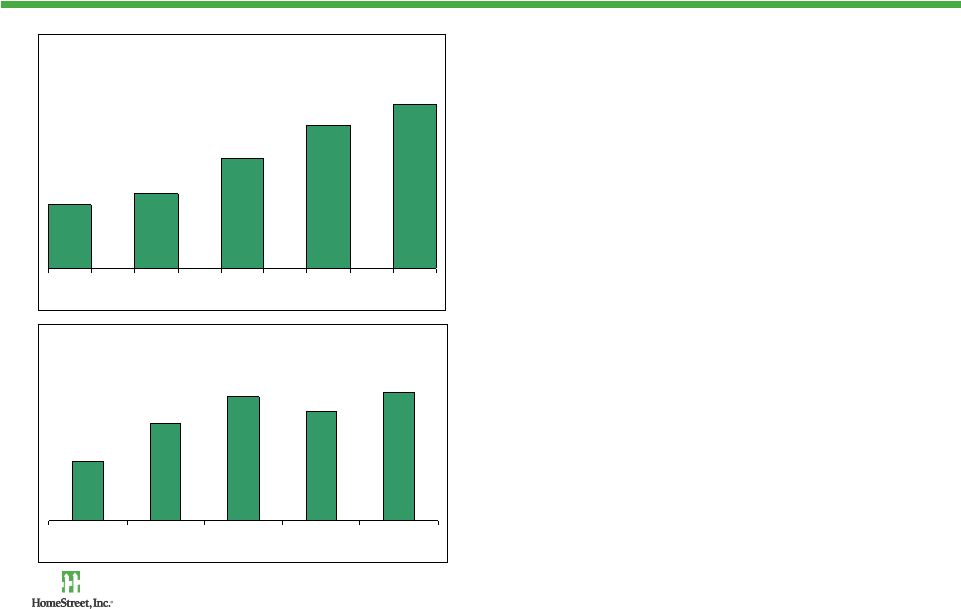
Noninterest Income
($ in thousands)
•
Up 173% over Q1 2011 and
44% over Q4 2011
•
Driven by mortgage loan
origination and servicing
revenue
•
Q1 Noninterest Income/
Total Assets of 6.83%
(annualized)
$14,456
$18,916
$37,268
$27,473
$39,501
Q1 11
Q2 11
Q3 11
Q4 11
Q1 12 |
 10
10
Highly Profitable Mortgage Origination Franchise
•
Volume driven by low interest rates,
industry consolidation, increasing
capacity and HARP 2.0
•
High concentration of government and
purchase money mortgages
•
Joint venture with Windermere Real
Estate, largest real estate brokerage
in PNW
•
230 retail loan originators, including
WMS mortgage consultants
•
All retail –
direct origination
•
350 basis points on Q1 production
•
Nominal repurchase claims and losses
Single Family Mortgage Originations
$275,568
$323,906
$478,025
$624,111
$712,302
Q1 11
Q2 11
Q3 11
Q4 11
Q1 12
Total Revenue (bps)
160
268
338
296
350
Q1 11
Q2 11
Q3 11
Q4 11
Q1 12
($ in thousands) |
 11
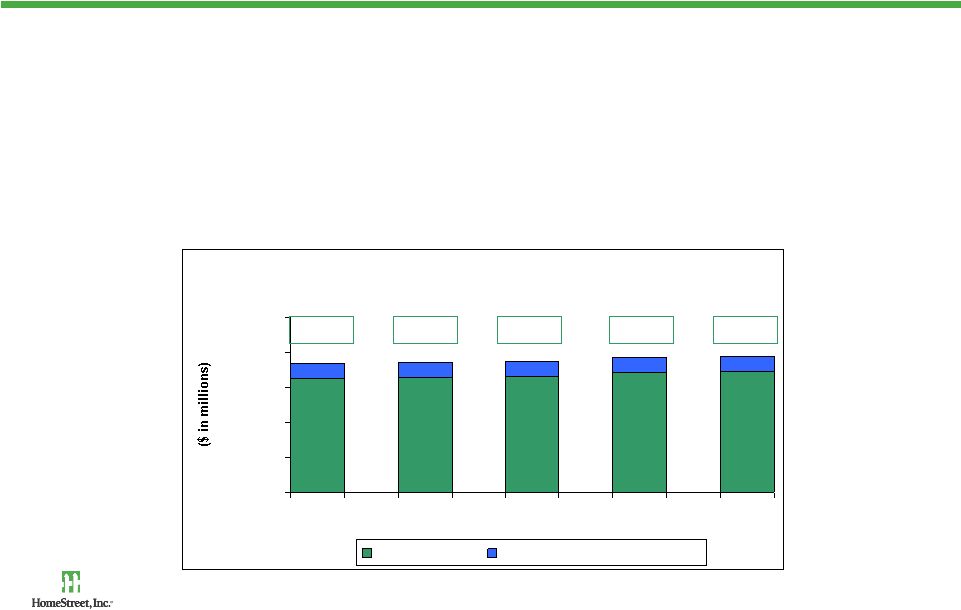
Growth in Mortgage Servicing Portfolio
•
Weighted average servicing fee of 34.8 bps
•
Single Family MSRs
1.14% of end UPB –
3.3x average fee
•
Composition 23% government, 77% conventional
•
Total delinquency of 1.96%
•
Weighted average note rate of 4.83%
•
80
+
% recapture of portfolio refinances
Mortgage Servicing Portfolio
$6,521
$6,603
$6,650
$6,885
$6,947
$843
$857
$828
$815
$826
$0
$2,000
$4,000
$6,000
$8,000
$10,000
Q1 11
Q2 11
Q3 11
Q4 11
Q1 12
SF Residential
Commercial (Primarily DUS)
$7,364
$7,460
$7,478
$7,700
$7,773 |
 12
12
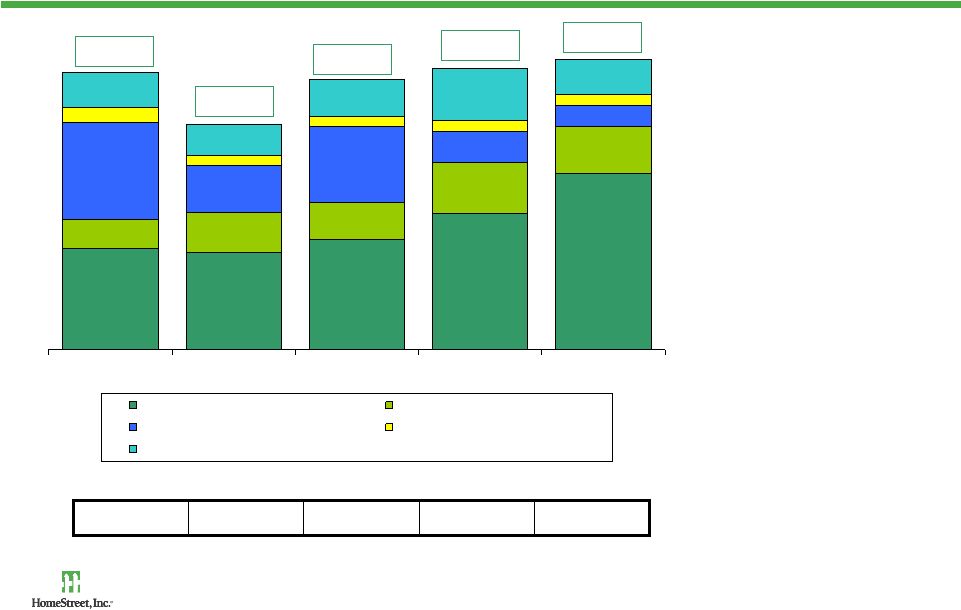
Noninterest Expense
($ in thousands)
•
Q1 operating efficiency
ratio of 62%
(1)
•
Near-term expense
reductions
–
FDIC assessments
–
Legal & collections
–
OREO expenses
•
Noninterest expense
will continue to vary
based on headcount
and mortgage
origination activity
(1)
See Appendix for reconciliation of non-GAAP financial measures.
821
613
598
577
566
Headcount at quarter-end
$12,139
$11,700
$13,217
$16,462
$21,351
$3,601
$4,859
$4,599
$6,194
$5,663
$11,754
$5,666
$9,113
$3,748
$2,520
$1,749
$1,265
$1,264
$1,256
$1,240
$4,218
$3,773
$4,425
$6,255
$4,303
Q1 11
Q2 11
Q3 11
Q4 11
Q1 12
Salaries and related costs
General and administrative
OREO
FDIC assessments
Legal, Consulting, Occupancy, IT
$33,461
$27,263
$32,618
$33,915
$35,077 |
 13
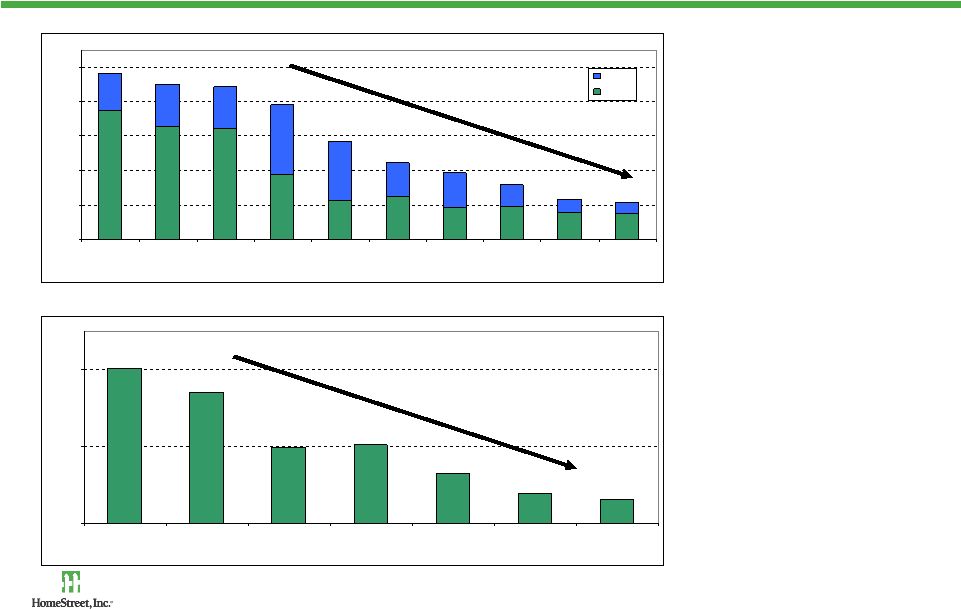
Significant Improvement in Asset Quality
Non-Performing Assets ($ in millions)
•
NPAs
down 78%
from 2009 peak
•
NPAs
as a percent of
total assets down to
4.6%
•OREO declined 84%
from 2010 peak
•
As of 5/10, 65% of
Q1 2012 OREO sold or
contracted for sale
OREO ($ millions)
$107
$115
$160
$194
$223
$284
$391
$442
$450
$482
$0
$100
$200
$300
$400
$500
4Q09
PEAK
1Q10
2Q10
3Q10
4Q10
1Q11
2Q11
3Q11
4Q11
1Q12
OREO
NPL
(78%)
$32
$39
$64
$103
$99
$170
$202
$0
$100
$200
3Q10
PEAK
4Q10
1Q11
2Q11
3Q11
4Q11
1Q12
(84%) |
 14
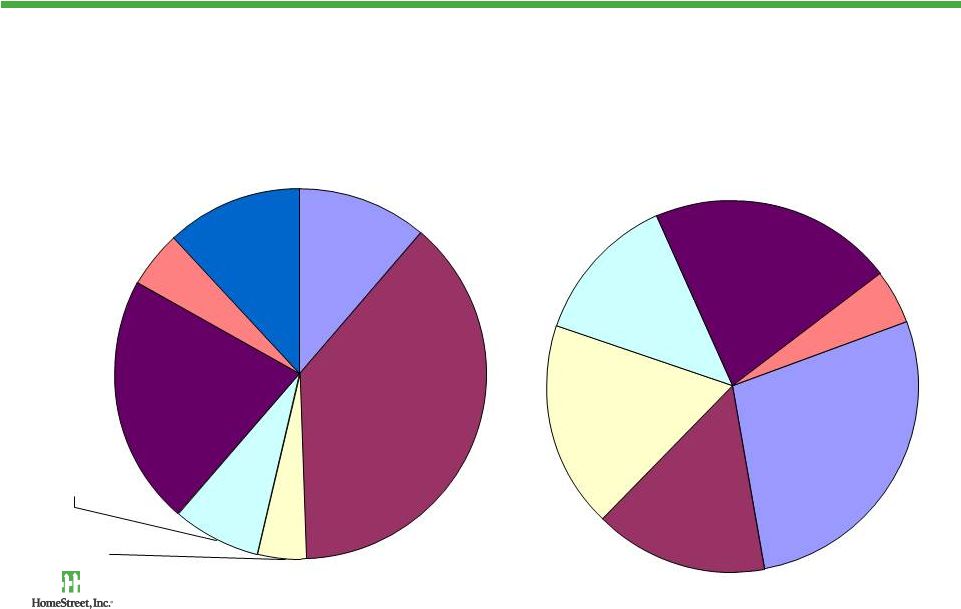
Loan Portfolio Characteristics
•
Focus on reducing exposure to high-risk property types
•
Restarting
traditional
lending
lines
–
business
banking,
commercial
real
estate
construction lending
Loan Composition
(1)
CRE by Property Type
(1)
(1)
As of March 31, 2012
Other $21
5%
Retail $125
28%
Industrial/
Warehouse
$67 15%
Mixed Use
$80 18%
Multifamily
$59 13%
Office $96
21%
C&I $69 5%
Multifamily
$56 4%
CRE -
Owner
Occupied
$103 8%
Construction
$159 12%
CRE -
Non-
Owner
Occupied
$289 22%
1-4 Family
$506 38%
Consumer
$153 11
($ in millions) |
 15
Single Family 49%
CRE 26%
C&I 13%
(1)
Construction 12%
March 31, 2012
Target
30-40%
20-30%
15-20%
30-40%
Near-Term Goals –
Portfolio Mix
(1)
CRE includes owner-occupied properties |
 16
16
Composition of Deposits
•
Total deposits of $2.0
billion at 3/31/12
•
No material change in
total deposit balance
over past 5 quarters
•
Transaction accounts
increased by $134
million in Q1 to 55%
of total deposits
•
Time deposits
decreased by
$143 million
•
New retail branches
planned to increase
density
62%
59%
53%
51%
45%
38%
41%
47%
49%
55%
0%
25%
50%
75%
100%
Q1 11
Q2 11
Q3 11
Q4 11
Q1 12
Time Deposits
Transaction Accounts |
 17
17
Long-Term Growth Strategies
•
Organic growth opportunities driven by attractive market demographics
–
Job growth and housing recovery is expected to outpace the overall economy
–
Well educated workforce, high incomes and strong population trends
•
Expand commercial and consumer banking activities
–
Commercial: lending, cash management, insurance
–
Consumer: mortgage loans, deposits, investments, insurance
•
Expand single family mortgage banking activities
•
Expand multifamily mortgage banking through the Fannie Mae DUS program
•
Restart and grow traditional portfolio lending –
Business Banking, Commercial Real
Estate and Construction |
 18
Appendix |
 19
19
Non-GAAP Reconciliation
Three Months Ended
($ in millions)
3/31/2012
12/31/2011
9/30/2011
6/30/2011
3/31/2011
Noninterest expense
$35.1
$33.9
$32.6
$27.3
$33.5
Less: OREO expense
2.5
3.7
9.1
5.7
11.8
Adjusted noninterest expense
$30.6
$27.8
$23.5
$21.6
$21.7
Net interest income before provisions
12.9
12.9
12.0
11.9
11.6
Noninterest income
39.5
27.5
37.3
18.9
14.5
Adjusted operating revenue
$52.4
$40.3
$49.2
$30.8
$26.0
Operating efficiency ratio
62.1%
74.8%
47.7%
70.1%
83.3%
Efficiency ratio
66.9%
84.1%
66.3%
88.4%
128.4% |