Attached files
| file | filename |
|---|---|
| 8-K - 8-K - HARDINGE INC | a12-7852_38k.htm |
Exhibit 99.1
|
|
First Quarter 2012 Financial Results Conference Call May 9, 2012 NASDAQ: HDNG www.hardinge.com Edward J. Gaio Vice President and Chief Financial Officer Richard L. Simons Chairman, President and Chief Executive Officer |
|
|
Safe Harbor Statement This presentation may contain forward-looking statements (within the meaning of Section 27A of the Securities Act of 1933, as amended and Section 21E of the Securities Exchange Act of 1934, as amended). Any such statements are based upon management’s current expectations that involve risks and uncertainties. Any statements that are not statements of historical fact or that are about future events may be deemed to be forward-looking statements. For example, words such as “may”, “will”, “should”, “estimates”, “predicts”, “potential”, “continue”, “strategy”, “believes”, “anticipates”, “plans”, “expects”, “intends” and similar expressions are intended to identify forward-looking statements. The Company’s actual results or outcomes and the timing of certain events may differ significantly from those discussed in any forward-looking statements. The following factors are among those that could cause actual results to differ materially from the forward-looking statements, which involve risks and uncertainties, and that should be considered in evaluating any such statement: fluctuations in the machine tool business cycles, changes in general economic conditions in the U.S. or internationally, the mix of products sold and the profit margins thereon, the relative success of the Company’s entry into new product and geographic markets, the Company’s ability to manage its operating costs, actions taken by customers such as order cancellations or reduced bookings by customers or distributors, competitor’s actions such as price discounting or new product introductions, governmental regulations and environmental matters, changes in the availability of cost of materials and supplies, the implementation of new technologies and currency fluctuations. The Company undertakes no obligation to publicly update any forward-looking statement, whether as a result of new information, future events, or otherwise. 2 |
|
|
Rebounding with Recovery 3 ($ in millions) $345 $214 $257 $342 $343 $75 $90 $91 $87 $73 Quarterly Net Sales Annual Net Sales |
|
|
Improved Operating Leverage 4 Quarterly Sales and Gross Margin Annual Sales and Gross Margin Net Sales (in millions) Strong Q1 2012 gross margin Favorable product and pricing mix Stronger margin business, more selective with orders Sales ($ in millions) * Gross Profit and Gross Margin for 2008 and 2009 were adjusted to exclude unusual items. See supplemental slides for Adjusted Gross Profit and Gross Margin reconciliation and other important disclaimers regarding Adjusted Gross Profit and Gross Margin |
|
|
Operating Margin Expands 5 Quarterly Sales & Operating Margin Annual Sales & Operating Margin Net Sales (in millions) Q1 2012 SG&A was $18 mm, or 23.6% of sales, compared with $17 mm, or 22.7% of sales, in prior year period and $19 mm, or 20.9% of sales, in Q4 2011 Expected SG&A run rate of ~ $19 - $20 mm per quarter Sales ($ in millions) * Operating Income and Operating Margin for 2008, 2009 and 2010 were adjusted to exclude unusual items. See supplemental slides for Adjusted Operating Income and Operating Margin reconciliation and other important disclaimers regarding Adjusted Operating Income and Operating Margin |
|
|
Quarterly Net Income Annual Net Income Solid Earnings 6 ($ in millions) * Net income for 2008, 2009 and 2010 were adjusted to exclude unusual items. See supplemental slides for Adjusted Net Income reconciliation and other important disclaimers regarding Adjusted Net Income |
|
|
Emphasis on Productivity and Cash Sales per Employee ($ in thousands) Inventory Turns (Avg) Managed Working Capital* as a Percent of Sales Receivable Days Outstanding (Avg) 7 * Managed Working Capital is defined as : Receivables + Inventory - Payables - Customer Deposits |
|
|
8 Driving Cash Generation Quarterly EBITDA & Margin 5.7% 7.3% 9.2% 6.0% 6.9% ($ in millions) 4.3% (5.0)% 2.4% 7.1% 7.4% Annual EBITDA & Margin * EBITDA and EBITDA Margin for 2008, 2009 and 2010 were adjusted to exclude unusual items. See supplemental slides for Adjusted EBITDA and EBITDA Margin reconciliation and other important disclaimers regarding Adjusted EBITDA and EBITDA Margin |
|
|
9 Financial Strength Debt 3/31/12 Current $21.4 Long-term 6.6 Total $28.0 Total Debt ($ in millions) * Reflects expansion capital investments in China and Switzerland Cash & Cash Equivalents Capital Expenditures ** 2012 Capital expenditure guidance of $7-$9 million as of May 9, 2012 |
|
|
10 Geographic Diversity Creates Larger Addressable Market ($ in millions) Annual Orders $340 $372 $297 $175 $341 Quarterly Orders $81 $69 $81 $108 $114 |
|
|
Oxford Economics Machine Tool Forecast Source: Oxford Economics Spring 2012 Global Machine Tool Outlook Report 11 Emerging Economies Drive Demand Growth Machine Tool Consumption (in US$ billions) Drivers of Machine Tool Consumption: Replacement of technologically obsolete older machines Shrinking supply of skilled machinists Growing middle class in emerging economies Advancing productivity for global competitiveness China: 73% of Asian demand Previous world peak surpassed in 2011 In 2015, Asian requirements approach previous world peak |
|
|
12 Moving Forward Capitalize on global expansion of machine tool consumption China presents some near term uncertainty, but has positive long-term potential Leverage the strength of our brands to capture a larger share of our addressable market Support our channels to market through trade shows, training and supporting marketing efforts Emphasizing growth in developing economies Continue to improve cash generation potential |
|
|
13 Long-term Goals Operating margins of between 8% and 9% Approximately 100 bps to 200 bps higher than historical result EBITDA margin of 11% to 12% Managed working capital* target of 35% to 40% of sales Target return on expansion capital of 12% to 15% Manage maintenance capital spending to between $3 million to $5 million These goals assume the current business model, and performance is subject to market conditions (up-cycle) and mix * Managed Working Capital is defined as : Receivables + Inventory - Payables - Customer Deposits |
|
|
First Quarter 2012 Earnings Conference Call May 9, 2012 NASDAQ: HDNG www.hardinge.com Edward J. Gaio Vice President and Chief Financial Officer Richard L. Simons Chairman, President and Chief Executive Officer |
|
|
NASDAQ: HDNG SUPPLEMENTAL SLIDES www.hardinge.com |
|
|
Annual Adjusted Gross Profit Reconciliation 16 ($ in millions) Gross Profit for 2008 and 2009 was adjusted to exclude unusual items. Hardinge believes that when used in conjunction with GAAP measures, Adjusted Gross Profit, which is a non-GAAP measure, assists in the understanding of Hardinge’s operating performance. 2008 2009 2010 2011 Q1 2012 TTM Sales $345.0 $214.1 $257.0 $341.6 $342.7 Cost of sales 252.7 173.3 195.7 250.5 249.5 Gross profit 92.3 40.8 61.3 91.1 93.2 Inventory impairment 7.8 5.0 - - - Adjusted gross profit 100.1 45.8 61.3 91.1 93.2 Adjusted gross margin 29.0% 21.4% 23.9% 26.7% 27.2% |
|
|
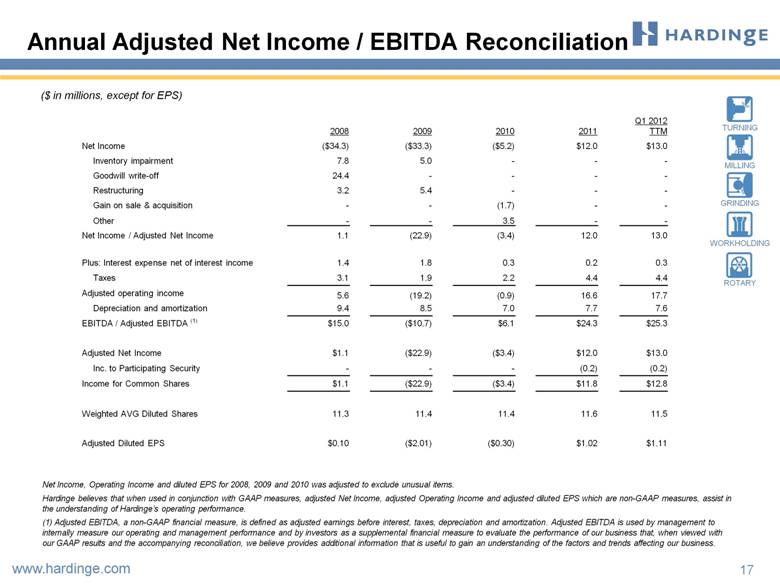
Annual Adjusted Net Income / EBITDA Reconciliation 17 ($ in millions, except for EPS) Net Income, Operating Income and diluted EPS for 2008, 2009 and 2010 was adjusted to exclude unusual items. Hardinge believes that when used in conjunction with GAAP measures, adjusted Net Income, adjusted Operating Income and adjusted diluted EPS which are non-GAAP measures, assist in the understanding of Hardinge’s operating performance. (1) Adjusted EBITDA, a non-GAAP financial measure, is defined as adjusted earnings before interest, taxes, depreciation and amortization. Adjusted EBITDA is used by management to internally measure our operating and management performance and by investors as a supplemental financial measure to evaluate the performance of our business that, when viewed with our GAAP results and the accompanying reconciliation, we believe provides additional information that is useful to gain an understanding of the factors and trends affecting our business. 2008 2009 2010 2011 Q1 2012 TTM Net Income ($34.3) ($33.3) ($5.2) $12.0 $13.0 Inventory impairment 7.8 5.0 - - - Goodwill write-off 24.4 - - - - Restructuring 3.2 5.4 - - - Gain on sale & acquisition - - (1.7) - - Other - - 3.5 - - Net Income / Adjusted Net Income 1.1 (22.9) (3.4) 12.0 13.0 Plus: Interest expense net of interest income 1.4 1.8 0.3 0.2 0.3 Taxes 3.1 1.9 2.2 4.4 4.4 Adjusted operating income 5.6 (19.2) (0.9) 16.6 17.7 Depreciation and amortization 9.4 8.5 7.0 7.7 7.6 EBITDA / Adjusted EBITDA (1) $15.0 ($10.7) $6.1 $24.3 $25.3 Adjusted Net Income $1.1 ($22.9) ($3.4) $12.0 $13.0 Inc. to Participating Security - - - (0.2) (0.2) Income for Common Shares $1.1 ($22.9) ($3.4) $11.8 $12.8 Weighted AVG Diluted Shares 11.3 11.4 11.4 11.6 11.5 Adjusted Diluted EPS $0.10 ($2.01) ($0.30) $1.02 $1.11 |
|
|
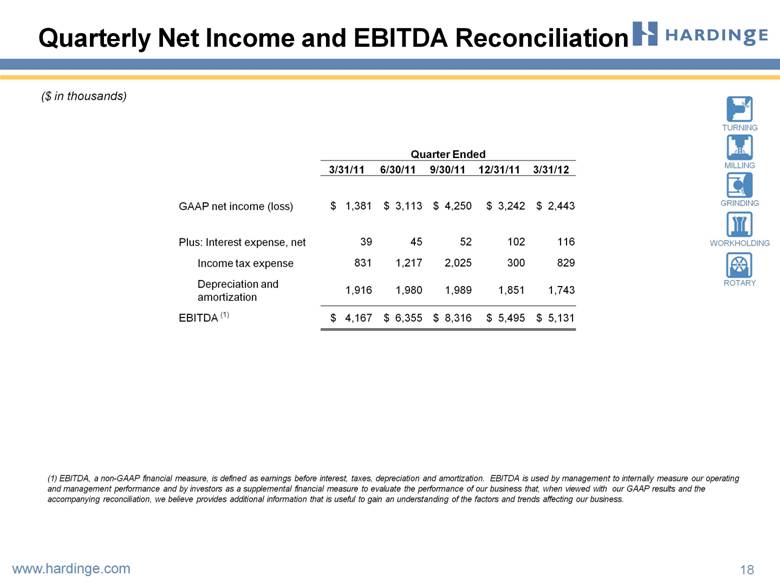
Quarterly Net Income and EBITDA Reconciliation ($ in thousands) 18 Quarter Ended 3/31/11 6/30/11 9/30/11 12/31/11 3/31/12 GAAP net income (loss) $ 1,381 $ 3,113 $ 4,250 $ 3,242 $ 2,443 Plus: Interest expense, net 39 45 52 102 116 Income tax expense 831 1,217 2,025 300 829 Depreciation and amortization 1,916 1,980 1,989 1,851 1,743 EBITDA (1) $ 4,167 $ 6,355 $ 8,316 $ 5,495 $ 5,131 (1) EBITDA, a non-GAAP financial measure, is defined as earnings before interest, taxes, depreciation and amortization. EBITDA is used by management to internally measure our operating and management performance and by investors as a supplemental financial measure to evaluate the performance of our business that, when viewed with our GAAP results and the accompanying reconciliation, we believe provides additional information that is useful to gain an understanding of the factors and trends affecting our business. |