Attached files
| file | filename |
|---|---|
| 8-K - 8-K - BROOKLINE BANCORP INC | a12-11713_18k.htm |
Exhibit 99.1
|
|
[LOGO] |
|
|
FORWARD-LOOKING STATEMENTS This presentation contains certain statements that may be considered “forward-looking statements” within the meaning of Section 27A of the Securities Act of 1933, as amended, and Section 21E of the Securities Exchange Act of 1934, as amended. Forward-looking statements involve risks and uncertainties and are based on the current assumptions and beliefs of management and are only expectations of future results. Actual results of Brookline Bancorp, Inc. (the “Company”) may differ materially from those discussed in these forward-looking statements, as a result of, among other factors, the factors described under the caption “Risk Factors” in Item 1A of the Company’s Annual Report on Form 10-K for the fiscal year ended December 31, 2011, as filed with the Securities and Exchange Commission and updated by the Company’s Quarterly Reports on Form 10-Q. Forward-looking statements speak only as of the date on which they were made. The Company does not undertake any obligation to update any forward-looking statement to reflect circumstances or events that occur after the date the forward-looking statements are made. |
|
|
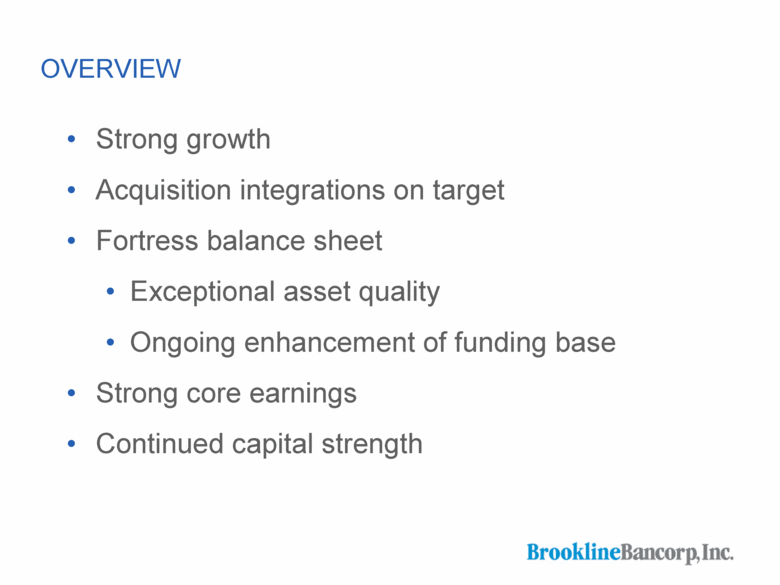
OVERVIEW Strong growth Acquisition integrations on target Fortress balance sheet Exceptional asset quality Ongoing enhancement of funding base Strong core earnings Continued capital strength |
|
|
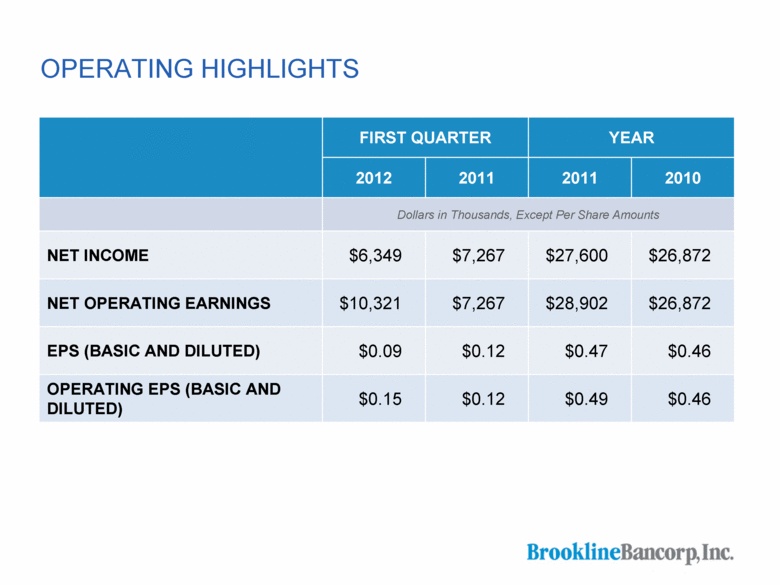
OPERATING HIGHLIGHTS FIRST QUARTER YEAR 2012 2011 2011 2010 Dollars in Thousands, Except Per Share Amounts NET INCOME $6,349 $7,267 $27,600 $26,872 NET OPERATING EARNINGS $10,321 $7,267 $28,902 $26,872 EPS (BASIC AND DILUTED) $0.09 $0.12 $0.47 $0.46 OPERATING EPS (BASIC AND DILUTED) $0.15 $0.12 $0.49 $0.46 |
|
|
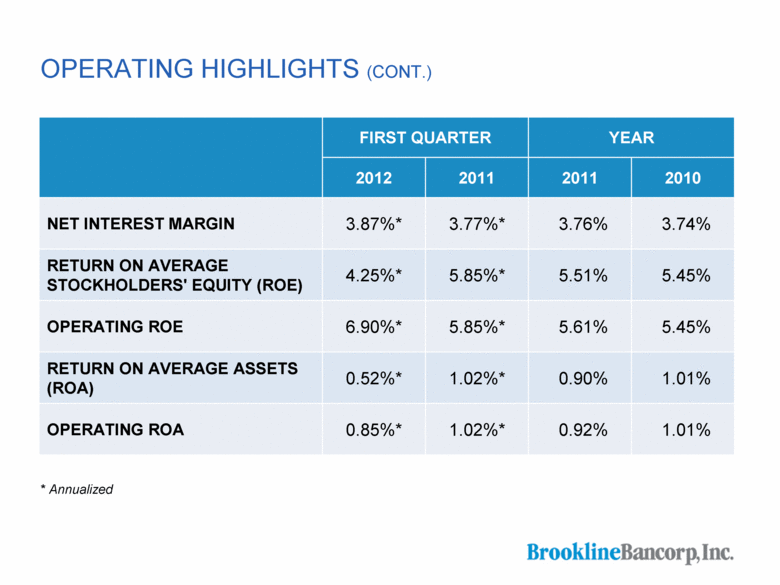
OPERATING HIGHLIGHTS (CONT.) FIRST QUARTER YEAR 2012 2011 2011 2010 NET INTEREST MARGIN 3.87%* 3.77%* 3.76% 3.74% RETURN ON AVERAGE STOCKHOLDERS' EQUITY (ROE) 4.25%* 5.85%* 5.51% 5.45% OPERATING ROE 6.90%* 5.85%* 5.61% 5.45% RETURN ON AVERAGE ASSETS (ROA) 0.50%* 1.02%* 0.90% 1.01% OPERATING ROA 0.85%* 1.02%* 0.92% 1.01% * Annualized |
|
|
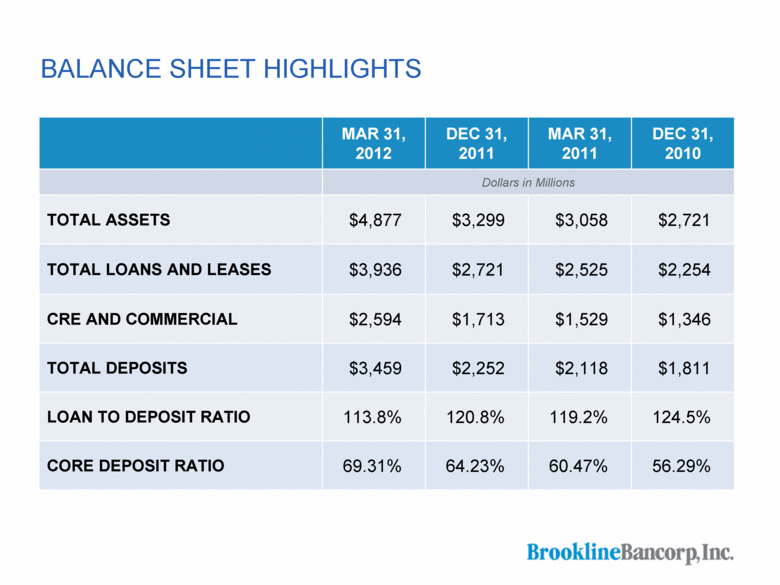
BALANCE SHEET HIGHLIGHTS MAR 31, 2012 DEC 31, 2011 MAR 31, 2011 DEC 31, 2010 Dollars in Millions TOTAL ASSETS $4,877 $3,299 $3,058 $2,721 TOTAL LOANS AND LEASES $3,936 $2,721 $2,525 $2,254 CRE AND COMMERCIAL $2,594 $1,713 $1,529 $1,346 TOTAL DEPOSITS $3,459 $2,252 $2,118 $1,811 LOAN TO DEPOSIT RATIO 113.8% 120.8% 119.2% 124.5% CORE DEPOSIT RATIO 69.31% 64.23% 60.47% 56.29% |
|
|
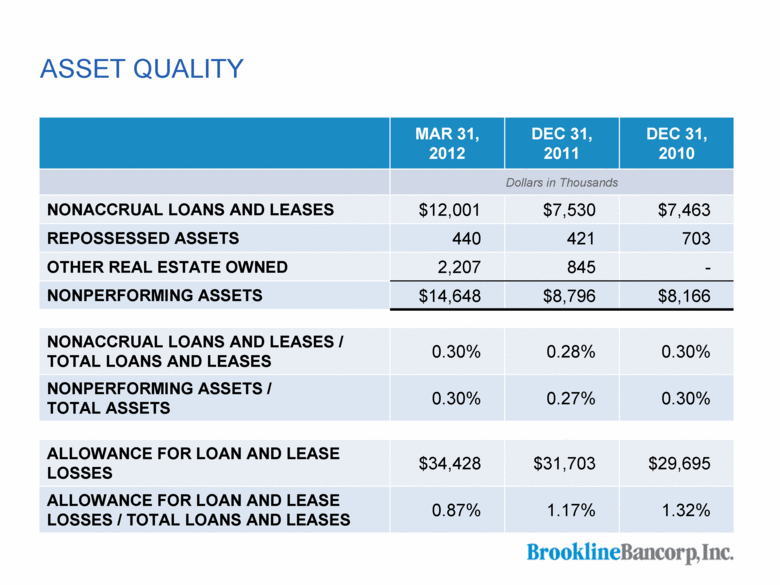
ASSET QUALITY MAR 31, 2012 DEC 31, 2011 DEC 31, 2010 Dollars in Thousands NONACCRUAL LOANS AND LEASES $12,001 $7,530 $7,463 REPOSSESSED ASSETS 440 421 703 OTHER REAL ESTATE OWNED 2,207 845 - NONPERFORMING ASSETS $14,648 $8,796 $8,166 NONACCRUAL LOANS AND LEASES / TOTAL LOANS AND LEASES 0.30% 0.28% 0.30% NONPERFORMING ASSETS / TOTAL ASSETS 0.30% 0.27% 0.30% ALLOWANCE FOR LOAN AND LEASE LOSSES $34,428 $31,703 $29,695 ALLOWANCE FOR LOAN AND LEASE LOSSES / TOTAL LOANS AND LEASES 0.87% 1.17% 1.32% |
|
|
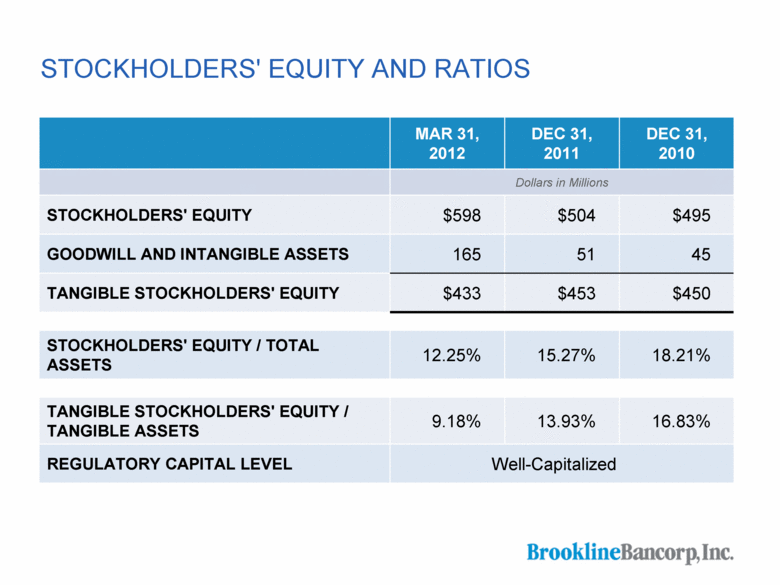
STOCKHOLDERS' EQUITY AND RATIOS MAR 31, 2012 DEC 31, 2011 DEC 31, 2010 Dollars in Millions STOCKHOLDERS' EQUITY $598 $504 $495 GOODWILL AND INTANGIBLE ASSETS 165 51 45 TANGIBLE STOCKHOLDERS' EQUITY $433 $453 $450 STOCKHOLDERS' EQUITY / TOTAL ASSETS 12.25% 15.27% 18.21% TANGIBLE STOCKHOLDERS' EQUITY / TANGIBLE ASSETS 9.18% 13.93% 16.83% REGULATORY CAPITAL LEVEL Well-Capitalized |

