Attached files
| file | filename |
|---|---|
| 8-K - FORM 8-K - Roadrunner Transportation Systems, Inc. | d349673d8k.htm |
Exhibit 99.1
| Investor Presentation |

| 2 Forward Looking Statements The following information contains forward-looking statements. These forward-looking statements are based on RRTS' management's current expectations and beliefs, as well as a number of assumptions concerning future events. These statements are subject to risks, uncertainties, assumptions and other important factors, many of which are outside RRTS' control, that could cause actual results to differ materially from the results discussed in the forward-looking statements. You are cautioned not to place undue reliance on such forward-looking statements because actual results may vary materially from those expressed or implied. All forward-looking statements are based on information available as of the date of this presentation, and RRTS or the presenter of this information assumes no obligation to, and expressly disclaims any obligation to, update or revise any forward-looking statements, whether as a result of new information, future events or otherwise. See "Risk Factors" in RRTS' prospectus for factors you should consider before buying shares of RRTS' common stock. |

| Introduction to Roadrunner Transportation Systems 3 Comprehensive service capabilities with scalable, asset- light, non-union structure Direct access to flexible capacity unmatched by most full-service providers 2011 revenues of $844 million and EBITDA of $51 million, representing YOY growth of 34% and 55%, respectively Focused on underserved landscape of small to mid-size shippers No single customer represents more than 3% of revenues No industry sector represents more than 18% of revenues Direct access to flexible capacity is unmatched by most full service providers minimizing fixed cost base and eliminating requirement of asset repositioning Over 9,000 reliable third-party carriers Over 2,500 dedicated Independent Contractors (ICs) Robust IT systems utilized to monitor key metrics and drive service and profitability enhancements Customized Full-Service Offering _____________________ Note: LTL = less-than-truckload; TL = truckload; 3PL = third-party logistics; and TMS = transportation management solutions. . Diverse Customer Base Variable Cost Model "One-stop" solution or "a la carte" services to meet each customer's needs on a comprehensive basis 2011: 39% Consensus 2012: 40% LTL TL & Logistics TMS Comprehensive LTL capabilities delivering to all domestic zip codes Customized and expedited LTL solutions Full and partial TL Services Freight consolidation and inventory management Intermodal solutions Comprehensive 3PL and TMS solutions TMS "light" offering for customers looking to optimize freight spend Unique model with full service capabilities provides for significant revenue growth with high free cash flow and return on capital employed |

| 24 years industry experience President, Less-than- Truckload (LTL) Previously VP of Corporate Sales for Yellow Transportation and responsible for a $1.5bn revenue customer base 4 Experienced and Motivated Leadership Team Entrepreneurial culture and team with track record of growth Proven ability to identify and assimilate strategic acquisitions Supported by an extensive team of business unit managers with similar skill sets 32 years industry experience President and CEO Previously managed a $1.2bn revenue division of FedEx Ground 21 years industry experience Chief Financial Officer since December 2005 Previously a Senior Manager at Ernst & Young 21 years industry experience President, Truckload (TL) Previously VP of Operations Previously Regional Managing Director at FedEx Ground Mark DiBlasi President & CEO Peter Armbruster Chief Financial Officer Paul Kithcart President, Transportation Management (TMS) Brian van Helden President, Truckload (TL) Scott Dobak President, Less-Than-Truckload (LTL) 28 years industry experience President of Transportation Management Solutions TMS group Previously Managing Director at FedEx Global Logistics |
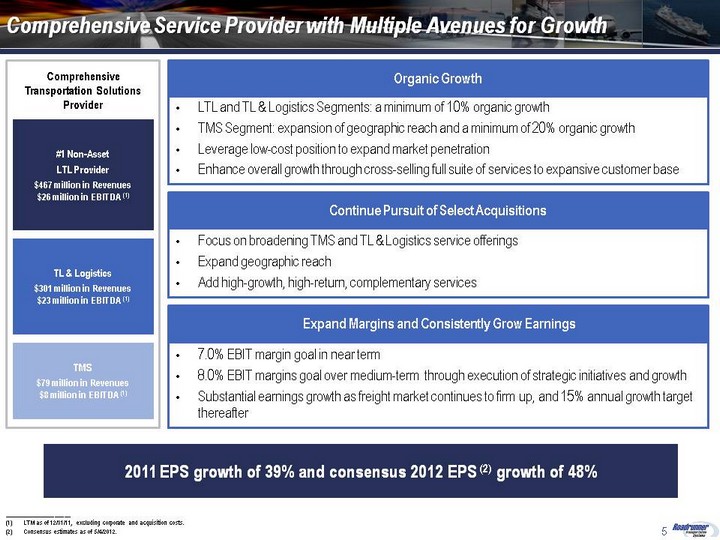
| Comprehensive Service Provider with Multiple Avenues for Growth #1 Non-Asset LTL Provider $467 million in Revenues $26 million in EBITDA (1) TL & Logistics $301 million in Revenues $23 million in EBITDA (1) TMS $79 million in Revenues $8 million in EBITDA (1) Comprehensive Transportation Solutions Provider Organic Growth LTL and TL & Logistics Segments: a minimum of 10% organic growth TMS Segment: expansion of geographic reach and a minimum of 20% organic growth Leverage low-cost position to expand market penetration Enhance overall growth through cross-selling full suite of services to expansive customer base Continue Pursuit of Select Acquisitions Focus on broadening TMS and TL & Logistics service offerings Expand geographic reach Add high-growth, high-return, complementary services Expand Margins and Consistently Grow Earnings 7.0% EBIT margin goal in near term 8.0% EBIT margins goal over medium-term through execution of strategic initiatives and growth Substantial earnings growth as freight market continues to firm up, and 15% annual growth target thereafter _____________________ LTM as of 12/31/11, excluding corporate and acquisition costs. Consensus estimates as of 5/4/2012. 5 2011 EPS growth of 39% and consensus 2012 EPS (2) growth of 48% |

| RRTS is Well Positioned to Execute on Long-Term Growth Strategy From 2005 to date, RRTS has grown from a $150 million, single- service provider to an $844 million, full- service transportation provider Over the next 5 years, our goal is to grow the company into a multi- billion transportation company providing industry leading service with a highly attractive financial profile 6 Further penetrate our existing platforms to provide capabilities to customers looking to efficiently outsource complete transportation needs Evaluate strategic acquisitions within fragmented market to expand geographic reach Continue to expand technology capabilities to provide maximum value to our customers Expand geographic reach within highly fragmented TL services and Intermodal Drayage markets with limited integration risk Enhance value proposition for companies in Freight Consolidation / Inventory Management through partnership with RRTS and access to TMS and LTL capabilities Add complementary services to enhance value offering to expansive customer base 2011 Further extend market share through low-cost / high service position Expand into new markets- unique model allows for geographic expansion without traditional inefficiencies Continued focus on strategic selling and operating initiatives to enhance growth and expand margins Non-Asset LTL TL & Logistics TMS Comprehensive Transportation Systems Provider with a Clear Strategy for Continued Growth Multi-Billion Transportation Services Provider with Full-Scope of Services and Dedicated Capacity Integrated Across the Platform 2016 Multi-Billion Transportation Services Provider with Full-Scope of Services and Dedicated Capacity Integrated Across the Platform 2016 |

| Strategic Business Segments Overview |
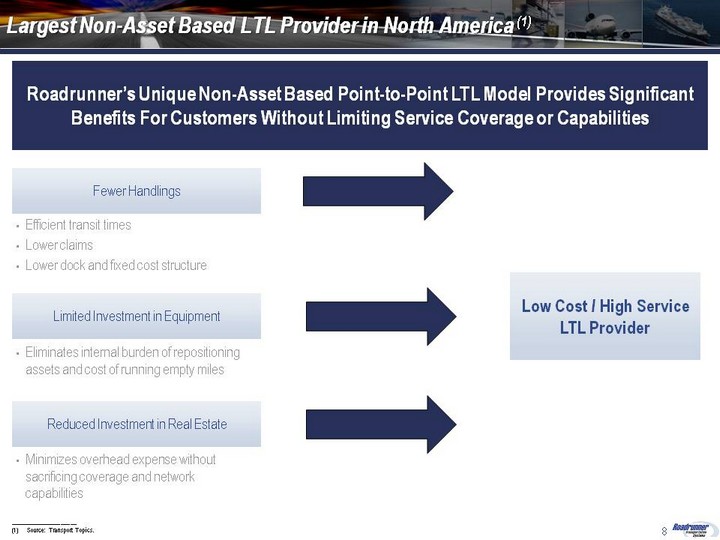
| 8 Largest Non-Asset Based LTL Provider in North America (1) _____________________ Source: Transport Topics. Roadrunner's Unique Non-Asset Based Point-to-Point LTL Model Provides Significant Benefits For Customers Without Limiting Service Coverage or Capabilities Fewer Handlings Efficient transit times Lower claims Lower dock and fixed cost structure Low Cost / High Service LTL Provider Limited Investment in Equipment Eliminates internal burden of repositioning assets and cost of running empty miles Reduced Investment in Real Estate Minimizes overhead expense without sacrificing coverage and network capabilities |
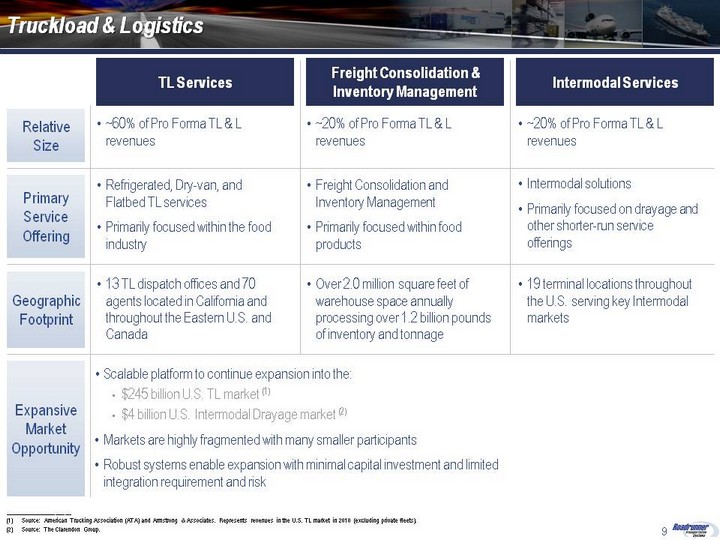
| Truckload & Logistics Geographic Footprint Relative Size Primary Service Offering 9 ~60% of Pro Forma TL & L revenues TL Services ~20% of Pro Forma TL & L revenues ~20% of Pro Forma TL & L revenues Refrigerated, Dry-van, and Flatbed TL services Primarily focused within the food industry Freight Consolidation and Inventory Management Primarily focused within food products Intermodal solutions Primarily focused on drayage and other shorter-run service offerings 13 TL dispatch offices and 70 agents located in California and throughout the Eastern U.S. and Canada Freight Consolidation & Inventory Management Intermodal Services Key initiatives across our TL & Logistics division will drive continued growth and increased market penetration within each business segment Over 2.0 million square feet of warehouse space annually processing over 1.2 billion pounds of inventory and tonnage 19 terminal locations throughout the U.S. serving key Intermodal markets Expansive Market Opportunity _____________________ Source: American Trucking Association (ATA) and Armstrong & Associates. Represents revenues in the U.S. TL market in 2010 (excluding private fleets). Source: The Clarendon Group. Scalable platform to continue expansion into the: $245 billion U.S. TL market (1) $4 billion U.S. Intermodal Drayage market (2) Markets are highly fragmented with many smaller participants Robust systems enable expansion with minimal capital investment and limited integration requirement and risk |
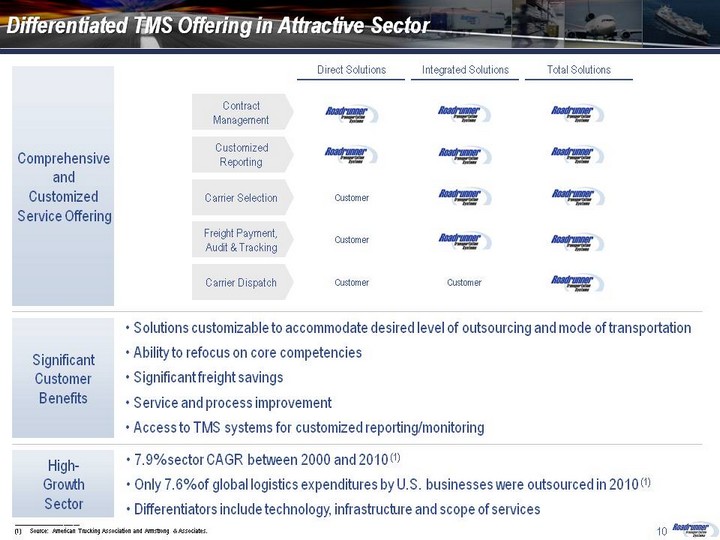
| 10 Differentiated TMS Offering in Attractive Sector Significant Customer Benefits Solutions customizable to accommodate desired level of outsourcing and mode of transportation Ability to refocus on core competencies Significant freight savings Service and process improvement Access to TMS systems for customized reporting/monitoring High- Growth Sector Total Solutions Integrated Solutions Direct Solutions Contract Management Customer Freight Payment, Audit & Tracking Customer Customer Carrier Dispatch Carrier Selection Customer Comprehensive and Customized Service Offering Customized Reporting _____________________ Source: American Trucking Association and Armstrong & Associates. 7.9% sector CAGR between 2000 and 2010 (1) Only 7.6% of global logistics expenditures by U.S. businesses were outsourced in 2010 (1) Differentiators include technology, infrastructure and scope of services |

| Significant investment in a large sales force that is equipped to cross-sell capabilities across the platform allows RRTS to provide each customer with access to its entire service offering RRTS' ability to maximize capacity utilization across the platform provides enhanced cost savings for customers for each of its service offerings Integration of business segments provides enhanced customer penetration Over 35,000 customers and growing Strategic Significance of Business Segments - Beyond "One-Stop" Solution 11 Integration of business segments provides enhanced customer penetration Over 100 LTL sales personnel Over 100 TL agents and dispatchers Over 30 TMS sales personnel RRTS can provide multiple services for customers on a more cost efficient basis, leading to profitable growth |
| Growth Opportunities |

| Well-Positioned for Accelerated Earnings Growth 13 Highly scalable business model Positioned to capitalize on capacity constraints in economic recovery through direct access to dedicated IC and carrier network Organic Growth Operating Improvements Selective Strategic Acquisitions Economic Recovery Strategic sales initiatives to enhance profitability Utilize low cost position to capture further market share: 34%, 24%, and 26% customer growth in 2010, 2011, 2012 YTD respectively Cross-sell services across the platform for further customer penetration Streamlined cost structure enhances earnings growth Continuously implementing operating initiatives to enhance operational productivity Focused interaction between sales and operational teams to leverage network efficiencies and improve productivity Large, fragmented markets Acquisitions will continue to enhance service capabilities and expand geographic reach while adding strong management teams complementary to our culture Increased volume and pricing will lead to margin expansion and accelerated earnings growth RRTS is well positioned to capitalize on continued capacity constraints through dedicated IC network |

| Strategic Acquisitions: RRTS' Focused Strategy 14 Prime brings freight consolidation and inventory management services to RRTS as well as a substantial opportunity to further expand revenues with access to RRTS' LTL and TMS capabilities Morgan Southern brings high-quality intermodal solutions with cross-selling and geographic expansion opportunities Immediately Accretive ? ? ? ? Cross-Selling Opportunities Across Platform ? ? Cultural Fit with Management ? ? Expand Capacity to Enhance Operational Efficiencies Across Network ? ? Complementary Expansion of Service Offerings TL Inventory Management / Freight Consolidation Intermodal TMS LTL |

| Financial Overview |
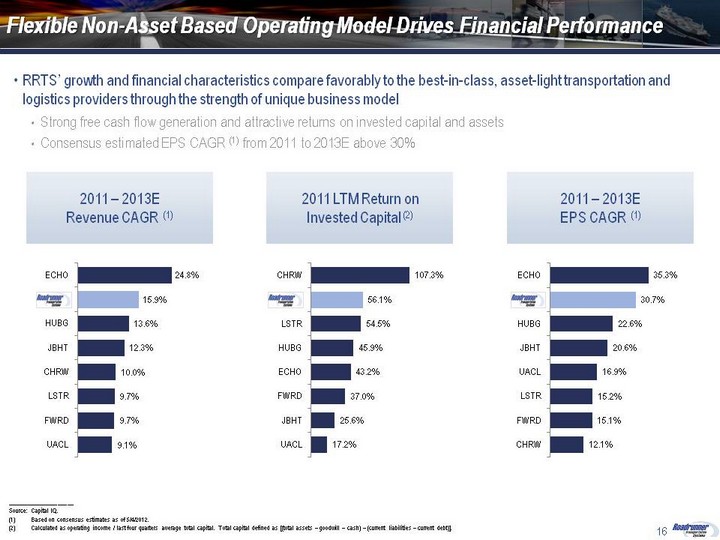
| Flexible Non-Asset Based Operating Model Drives Financial Performance RRTS' growth and financial characteristics compare favorably to the best-in-class, asset-light transportation and logistics providers through the strength of unique business model Strong free cash flow generation and attractive returns on invested capital and assets Consensus estimated EPS CAGR (1) from 2011 to 2013E above 30% 16 2011 LTM Return on Invested Capital (2) _____________________ Source: Capital IQ. Based on consensus estimates as of 5/4/2012. Calculated as operating income / last four quarters average total capital. Total capital defined as [(total assets - goodwill - cash) - (current liabilities - current debt)]. 2011 - 2013E EPS CAGR (1) 2011 - 2013E Revenue CAGR (1) 2011 - 2013E EBI(1) |
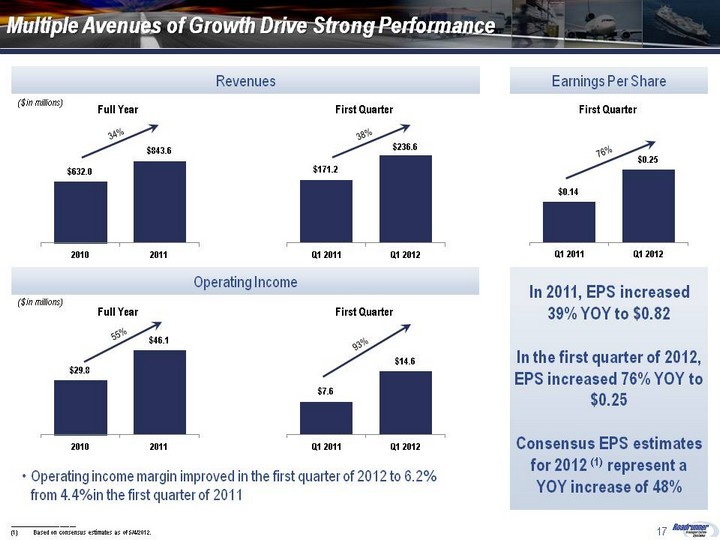
| Multiple Avenues of Growth Drive Strong Performance 17 Revenues ($ in millions) Operating Income ($ in millions) 38% RRTS is positioned to continue its YOY growth in operating income throughout 2012 and beyond 93% 34% 55% Earnings Per Share _____________________ (1) Based on consensus estimates as of 5/4/2012. In 2011, EPS increased 39% YOY to $0.82 In the first quarter of 2012, EPS increased 76% YOY to $0.25 Consensus EPS estimates for 2012 (1) represent a YOY increase of 48% Operating income margin improved in the first quarter of 2012 to 6.2% from 4.4% in the first quarter of 2011 Full Year First Quarter First Quarter Full Year 76% First Quarter Operating income margin improved in the first quarter of 2012 to 6.2% from 4.4% in the first quarter of 2011 |
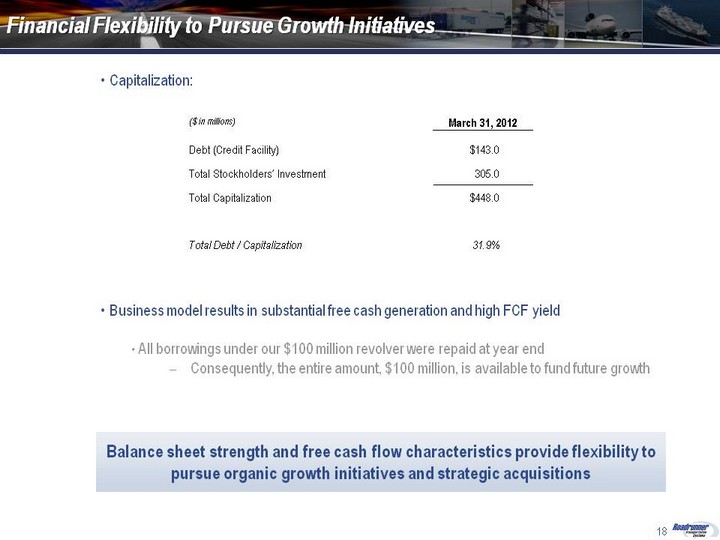
| Capitalization: Business model results in substantial free cash generation and high FCF yield All borrowings under our $100 million revolver were repaid at year end Consequently, the entire amount, $100 million, is available to fund future growth Financial Flexibility to Pursue Growth Initiatives 18 Balance sheet strength and free cash flow provide flexibility to pursue organic growth initiatives and strategic acquisitions Balance sheet strength and free cash flow characteristics provide flexibility to pursue organic growth initiatives and strategic acquisitions |

| 19 Key Investment Highlights Competitive strengths result in substantial growth opportunities Increasing momentum in an attractive sector ahead of market recovery Robust IT platforms with scalable systems Unique Non-Asset Based Model Compelling Organic Growth Drivers Strategic Acquisition Opportunities Experienced and Motivated Management Team Highly scalable model Comprehensive service offering Variable cost structure resulting in strong returns on invested capital Underserved customer landscape Significant customer base expansion Substantial cross-selling opportunities Large, fragmented industry Ability to expand geographic reach and service offerings Improved capital position and access to acquisition currency Proven ability to expand business and improve operating efficiency Proven ability to identify and assimilate strategic acquisitions Well Positioned to Capitalize on Market Recovery & Industry Dynamics Sustained pricing growth expected in 2012 and through the medium-term Poised to capitalize on capacity constraints through direct access to dedicated IC network |
