Attached files
| file | filename |
|---|---|
| 8-K - FORM 8-K - Dealertrack Technologies, Inc | v312376_8k.htm |
Investor Presentation May 8, 2012
Safe Harbor for Forward - looking Statements Statements in this presentation regarding the expected 2012 performance of DealerTrack Holdings, Inc. (“DealerTrack ”), the long - term outlook for its business, and all other statements in this release other than the recitation of historical facts are forward - loo king statements (as defined in the Private Securities Litigation Reform Act of 1995). These statements involve a number of risks, uncertainties and other factors that could cause actual results, performance or achievements of DealerTrack to be materially different from any future results, performance or achievements expressed or implied by these forward - looking statements. Factors that might cause such a difference include: economic trends that affect the automotive retail industry or the indirec t a utomotive financing industry including the number of new and used cars sold; reductions in auto dealerships; increased competitive pres sur e from other industry participants, including Open Dealer Exchange, RouteOne , CUDL, Finance Express and AppOne ; the impact of some vendors of software products for automotive dealers making it more difficult for DealerTrack’s customers to use DealerTrack’s solutions and services; security breaches, interruptions, failures and/or other errors involving DealerTrack’s systems or networks; the failure or inability to execute any element of DealerTrack’s business strategy, including selling additional products and services to existing and new customers; DealerTrack’s success in implementing an ERP system; the volatility of DealerTrack’s stock price; new regulations or changes to existing regulations; the integration of recent acquisitions and the expected benefits, as well as the integration and expected benefits of any future acquisitions that DealerTrack may pursue; DealerTrack’s success in expanding its customer base and product and service offerings, the impact of recent economic trends, and difficulties and increased costs associated with raising additional capital; the impairment of intangible assets, such as trademarks and goodwill; and other r isk s listed in DealerTrack’s reports filed with the Securities and Exchange Commission (SEC), including its most recent Annual Report on Form 10 - K. These filings can be found on DealerTrack’s website at www.dealertrack.com and the SEC’s website at www.sec.gov . Forward - looking statements included herein speak only as of May 8, 2012 and DealerTrack disclaims any obligation to revise or update suc h statements to reflect events or circumstances after the date hereof or to reflect the occurrence of unanticipated events or circumstances, except as required by law. 2
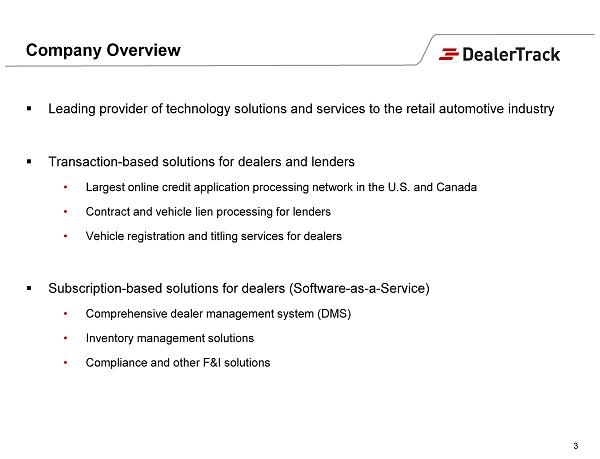
Company Overview ▪ Leading provider of technology solutions and services to the retail automotive industry ▪ Transaction - based solutions for dealers and lenders • Largest online credit application processing network in the U.S. and Canada • Contract and vehicle lien processing for lenders • Vehicle registration and titling services for dealers ▪ Subscription - based solutions for dealers (Software - as - a - Service) • Comprehensive dealer management system (DMS) • Inventory management solutions • Compliance and other F&I solutions 3
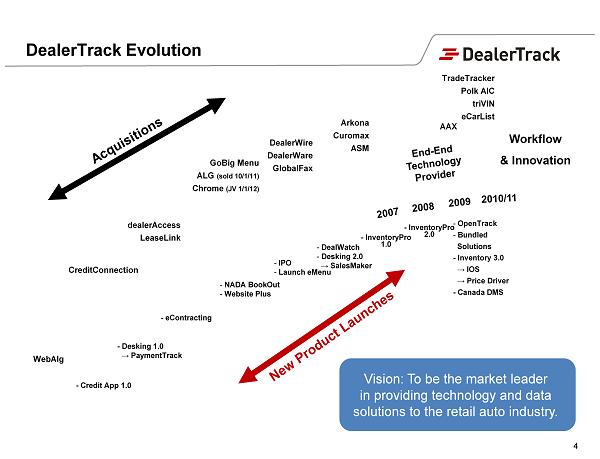
DealerTrack Evolution - Credit App 1.0 - Desking 1.0 → PaymentTrack - eContracting - NADA BookOut - Website Plus - IPO - Launch eMenu - DealWatch - Desking 2.0 → SalesMaker - InventoryPro 1.0 - InventoryPro 2.0 WebAlg CreditConnection dealerAccess LeaseLink GoBig Menu ALG (sold 10/1/11 ) Chrome (JV 1/1/12) DealerWire DealerWare GlobalFax Arkona Curomax ASM AAX Workflow & Innovation - OpenTrack - Bundled Solutions - Inventory 3.0 → IOS → Price Driver - Canada DMS TradeTracker Polk AIC triVIN eCarList 4 Vision: To be the market leader in providing technology and data solutions to the retail auto industry.
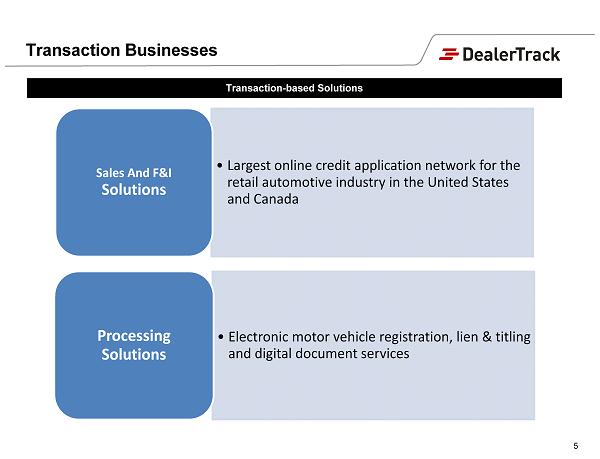
• Largest online credit application network for the retail automotive industry in the United States and Canada Sales And F&I Solutions • Electronic motor vehicle registration, lien & titling and digital document services Processing Solutions 5 Transaction - based Solutions Transaction Businesses
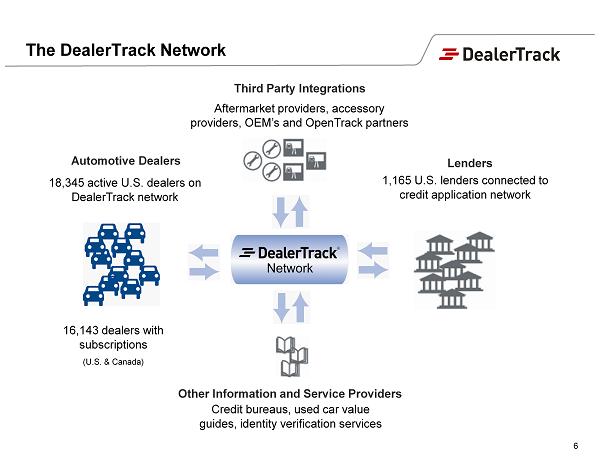
The DealerTrack Network Aftermarket providers, accessory providers, OEM’s and OpenTrack partners Third Party Integrations Automotive Dealers Lenders Other Information and Service Providers 1,165 U.S. lenders connected to credit application network Credit bureaus, used car value guides, identity verification services 18,345 active U.S. dealers on DealerTrack network 16,143 dealers with subscriptions (U.S. & Canada) 6
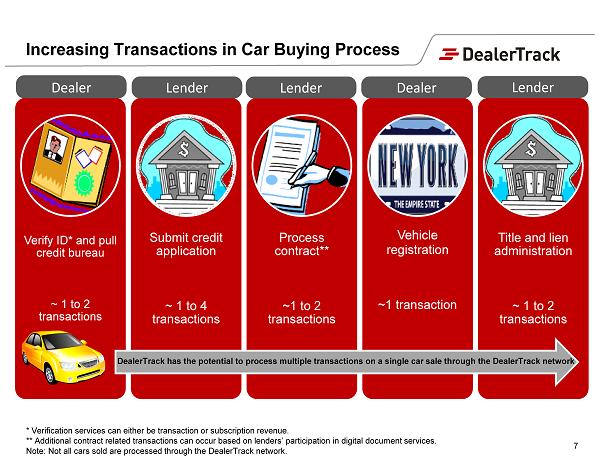
Increasing Transactions in Car Buying Process Verify ID* and pull credit bureau ~ 1 to 2 transactions Submit credit application ~ 1 to 4 transactions Process contract** ~ 1 to 2 transactions Vehicle registration ~1 transaction Title and lien administration ~ 1 to 2 transactions DealerTrack has the potential to process multiple transactions on a single car sale through the DealerTrack network * Verification services can either be transaction or subscription revenue. ** Additional contract related transactions can occur based on lenders’ participation in digital document services. Note: Not all cars sold are processed through the DealerTrack network. 7 Dealer Dealer Dealer Lender Lender Lender
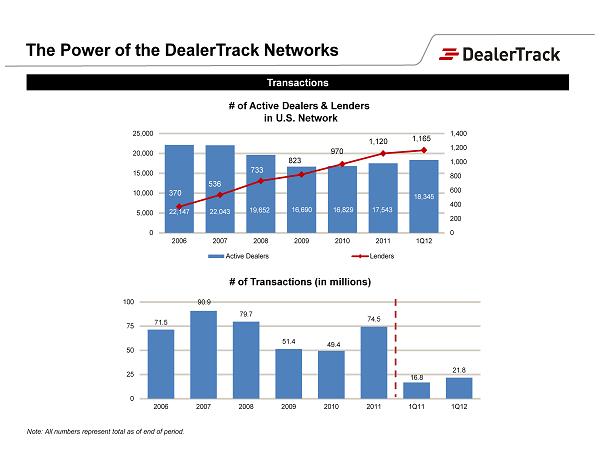
# of Active Dealers & Lenders in U.S. Network Note: All numbers represent total as of end of period. Transactions The Power of the DealerTrack Networks 22,147 22,043 19,652 16,690 16,829 17,543 18,345 370 536 733 823 970 1,120 1,165 0 200 400 600 800 1,000 1,200 1,400 0 5,000 10,000 15,000 20,000 25,000 2006 2007 2008 2009 2010 2011 1Q12 Active Dealers Lenders 71.5 90.9 79.7 51.4 49.4 74.5 16.8 21.8 0 25 50 75 100 2006 2007 2008 2009 2010 2011 1Q11 1Q12 # of Transactions (in millions)
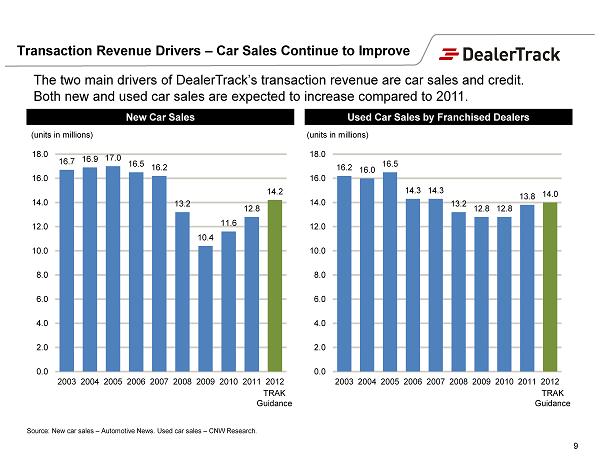
Transaction Revenue Drivers – Car Sales Continue to Improve The two main drivers of DealerTrack’s transaction revenue are car sales and credit. Both new and used car sales are expected to increase compared to 2011. Source: New car sales – Automotive News. Used car sales – CNW Research. New Car Sales Used Car Sales by Franchised Dealers 9 16.7 16.9 17.0 16.5 16.2 13.2 10.4 11.6 12.8 14.2 0.0 2.0 4.0 6.0 8.0 10.0 12.0 14.0 16.0 18.0 2003 2004 2005 2006 2007 2008 2009 2010 2011 2012 (units in millions ) TRAK Guidance 16.2 16.0 16.5 14.3 14.3 13.2 12.8 12.8 13.8 14.0 0.0 2.0 4.0 6.0 8.0 10.0 12.0 14.0 16.0 18.0 2003 2004 2005 2006 2007 2008 2009 2010 2011 2012 (units in millions ) TRAK Guidance
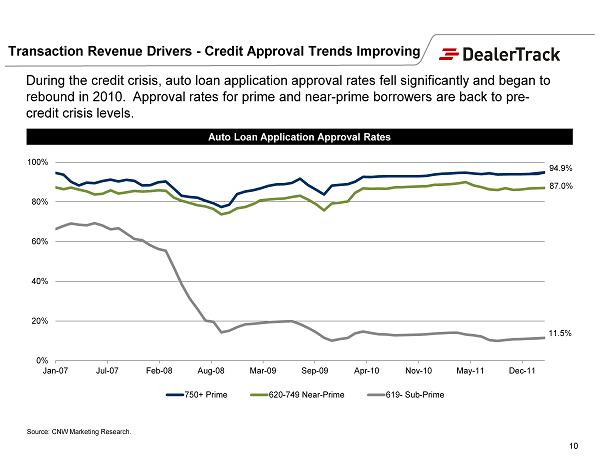
Source: CNW Marketing Research. During the credit crisis, auto loan application approval rates fell significantly and began to rebound in 2010. Approval rates for prime and near - prime borrowers are back to pre - credit crisis levels. Auto Loan Application Approval Rates 94.9% 87.0% 11.5% 10 0% 20% 40% 60% 80% 100% Jan-07 Jul-07 Feb-08 Aug-08 Mar-09 Sep-09 Apr-10 Nov-10 May-11 Dec-11 750+ Prime 620-749 Near-Prime 619- Sub-Prime Transaction Revenue Drivers - Credit Approval Trends Improving
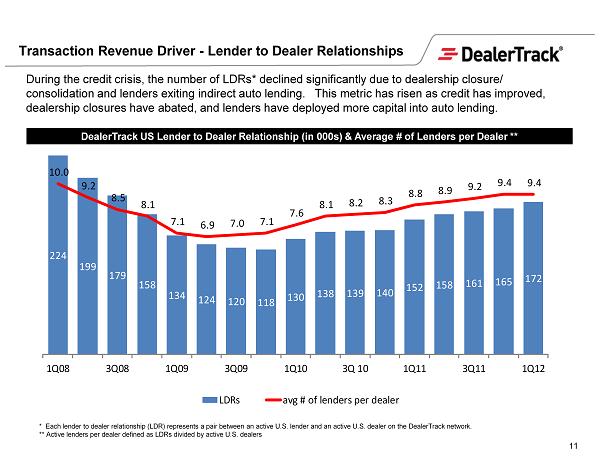
11 224 199 179 158 134 124 120 118 130 138 139 140 152 158 161 165 172 10.0 9.2 8.5 8.1 7.1 6.9 7.0 7.1 7.6 8.1 8.2 8.3 8.8 8.9 9.2 9.4 9.4 1Q08 3Q08 1Q09 3Q09 1Q10 3Q 10 1Q11 3Q11 1Q12 LDRs avg # of lenders per dealer During the credit crisis, the number of LDRs * declined significantly due to dealership closure/ consolidation and lenders exiting indirect auto lending. This metric has risen as credit has improved, dealership closures have abated, and lenders have deployed more capital into auto lending. * Each lender to dealer relationship (LDR) represents a pair between an active U.S. lender and an active U.S. dealer on the Dea lerTrack network. ** Active lenders per dealer defined as LDRs divided by active U.S. dealers Transaction Revenue Driver - Lender to Dealer Relationships DealerTrack US Lender to Dealer Relationship (in 000s) & Average # of Lenders per Dealer **
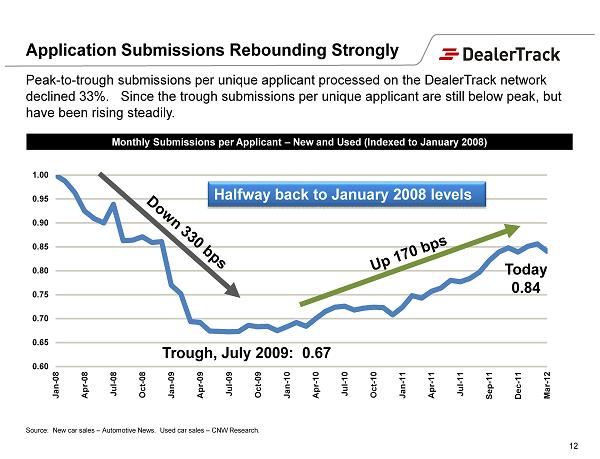
0.60 0.65 0.70 0.75 0.80 0.85 0.90 0.95 1.00 Jan-08 Apr-08 Jul-08 Oct-08 Jan-09 Apr-09 Jul-09 Oct-09 Jan-10 Apr-10 Jul-10 Oct-10 Jan-11 Apr-11 Jul-11 Sep-11 Dec-11 Mar-12 Application Submissions Rebounding Strongly Peak - to - trough submissions per unique applicant processed on the DealerTrack network declined 33%. Since the trough submissions per unique applicant are still below peak, but have been rising steadily. Source: New car sales – Automotive News. Used car sales – CNW Research. Monthly Submissions per Applicant – New and Used (Indexed to January 2008) Today 0.84 Trough, July 2009: 0.67 12 Halfway back to January 2008 levels
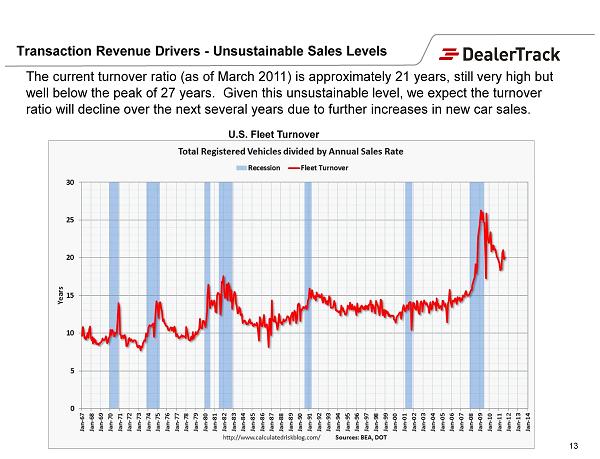
Transaction Revenue Drivers - Unsustainable Sales Levels U.S. Fleet Turnover Source: 13 The current turnover ratio (as of March 2011) is approximately 21 years, still very high but well below the peak of 27 years. Given this unsustainable level, we expect the turnover ratio will decline over the next several years due to further increases in new car sales.
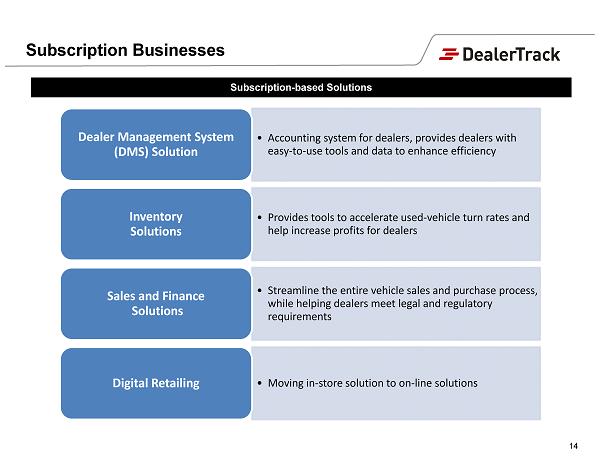
• Accounting system for dealers, provides dealers with easy - to - use tools and data to enhance efficiency Dealer Management System (DMS) Solution • Provides tools to accelerate used - vehicle turn rates and help increase profits for dealers Inventory Solutions • Streamline the entire vehicle sales and purchase process, while helping dealers meet legal and regulatory requirements Sales and Finance Solutions • Moving in - store solution to on - line solutions Digital Retailing 14 Subscription - based Solutions Subscription Businesses
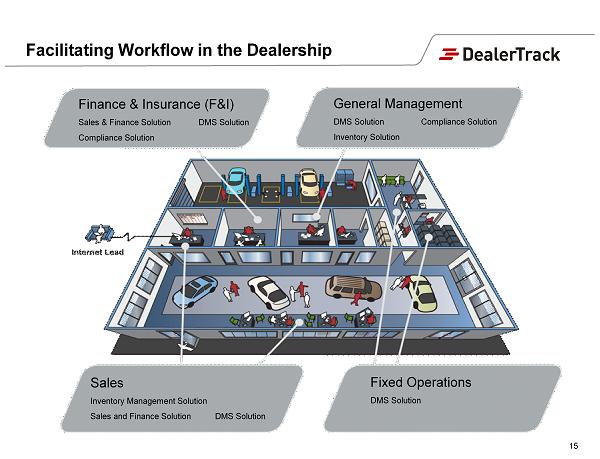
Facilitating Workflow in the Dealership Finance & Insurance (F&I) Sales & Finance Solution DMS Solution Compliance Solution General Management DMS Solution Compliance Solution Inventory Solution Sales Inventory Management Solution Sales and Finance Solution DMS Solution Fixed Operations DMS Solution 15
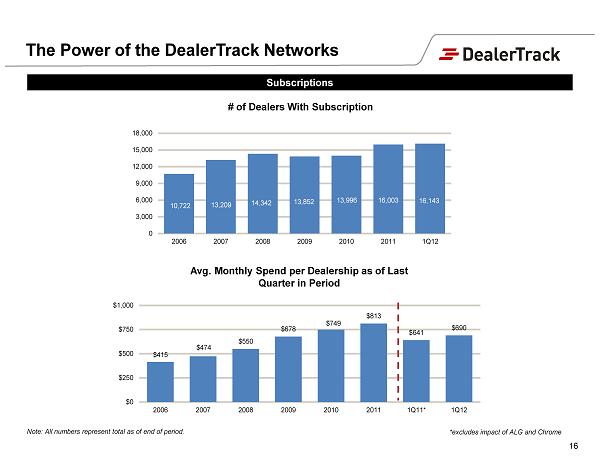
Note: All numbers represent total as of end of period. # of Dealers W ith Subscription 16 The Power of the DealerTrack Networks Subscriptions 10,722 13,209 14,342 13,852 13,996 16,003 16,143 0 3,000 6,000 9,000 12,000 15,000 18,000 2006 2007 2008 2009 2010 2011 1Q12 $415 $474 $550 $678 $749 $813 $641 $690 $0 $250 $500 $750 $1,000 2006 2007 2008 2009 2010 2011 1Q11* 1Q12 Avg. Monthly Spend per Dealership as of Last Quarter in Period *excludes impact of ALG and Chrome
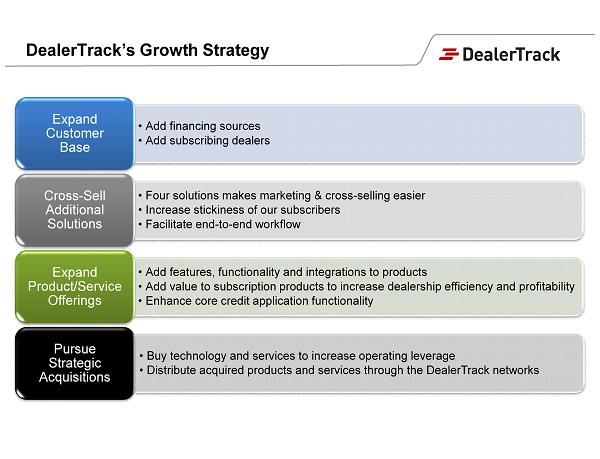
DealerTrack’s Growth Strategy • Add financing sources • Add subscribing dealers Expand Customer Base • Four solutions makes marketing & cross - selling easier • Increase stickiness of our subscribers • Facilitate end - to - end workflow Cross - Sell Additional Solutions • Add features, functionality and integrations to products • Add value to subscription products to increase dealership efficiency and profitability • Enhance core credit application functionality Expand Product/Service Offerings • Buy technology and services to increase operating leverage • Distribute acquired products and services through the DealerTrack networks Pursue Strategic Acquisitions
Financial Highlights • Eight consecutive quarters of year - over - year revenue growth • Recent transaction revenue growth 3x car sales growth • Significant component of highly visible subscription revenue • High subscription renewal rates • Increasing profitability while reinvesting in future growth opportunities • Operating leverage drives further margin potential • Proven acquisition strategy complements organic growth 18
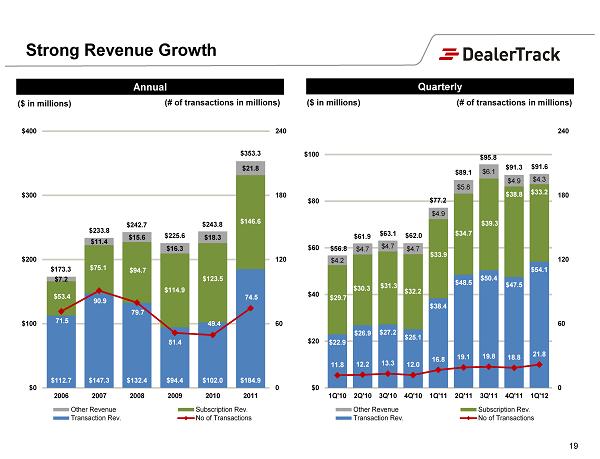
19 Strong Revenue Growth (# of transactions in millions) (# of transactions in millions) $112.7 $147.3 $132.4 $94.4 $102.0 $184.9 $53.4 $75.1 $94.7 $114.9 $123.5 $146.6 $7.2 $11.4 $15.6 $16.3 $18.3 $21.8 71.5 90.9 79.7 51.4 49.4 74.5 0 60 120 180 240 $0 $100 $200 $300 $400 2006 2007 2008 2009 2010 2011 Other Revenue Subscription Rev. Transaction Rev. No of Transactions Annual $173.3 $233.8 $242.7 $225.6 ($ in millions) $243.8 $353.3 $22.9 $26.9 $27.2 $25.1 $38.4 $48.5 $50.4 $47.5 $54.1 $29.7 $30.3 $31.3 $32.2 $33.9 $34.7 $39.3 $38.8 $33.2 $4.2 $4.7 $4.7 $4.7 $4.9 $5.8 $6.1 $4.9 $4.3 11.8 12.2 13.3 12.0 16.8 19.1 19.8 18.8 21.8 0 60 120 180 240 $0 $20 $40 $60 $80 $100 1Q'10 2Q'10 3Q'10 4Q'10 1Q'11 2Q'11 3Q'11 4Q'11 1Q'12 Other Revenue Subscription Rev. Transaction Rev. No of Transactions $56.8 Quarterly ($ in millions) $91.3 $95.8 $91.6 $77.2 $89.1 $62.0 $63.1 $61.9
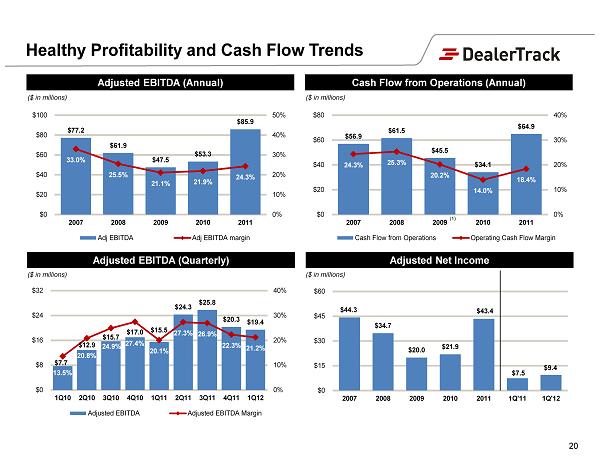
Adjusted EBITDA (Annual) 20 Healthy Profitability and Cash Flow Trends Cash Flow from Operations (Annual) $77.2 $61.9 $47.5 $53.3 $85.9 33.0% 25.5% 21.1% 21.9% 24.3% 0% 10% 20% 30% 40% 50% $0 $20 $40 $60 $80 $100 2007 2008 2009 2010 2011 Adj EBITDA Adj EBITDA margin Adjusted Net Income Adjusted EBITDA (Quarterly) $7.7 $12.9 $15.7 $17.0 $15.5 $24.3 $25.8 $20.3 $19.4 13.5% 20.8% 24.9% 27.4% 20.1% 27.3% 26.9% 22.3% 21.2% 0% 10% 20% 30% 40% $0 $8 $16 $24 $32 1Q10 2Q10 3Q10 4Q10 1Q11 2Q11 3Q11 4Q11 1Q12 Adjusted EBITDA Adjusted EBITDA Margin $56.9 $61.5 $45.5 $34.1 $64.9 24.3% 25.3% 20.2% 14.0% 18.4% 0% 10% 20% 30% 40% $0 $20 $40 $60 $80 2007 2008 2009 2010 2011 Cash Flow from Operations Operating Cash Flow Margin (1) ($ in millions) $44.3 $34.7 $20.0 $21.9 $43.4 $7.5 $9.4 $0 $15 $30 $45 $60 2007 2008 2009 2010 2011 1Q'11 1Q'12 ($ in millions) ($ in millions) ($ in millions)

Investment Highlights 21 ▪ Leading provider of on - demand software, network and data solutions for the automotive retail industry ▪ Attractive market opportunity ▪ Consistent track record of growth and profitability ▪ Predictable business model ▪ Significant future growth opportunities ▪ Strong management team with extensive industry experience

Appendix
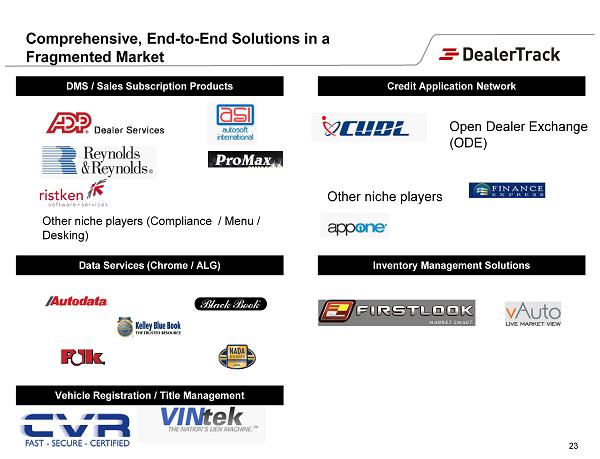
Comprehensive, End - to - End Solutions in a Fragmented Market Open Dealer Exchange (ODE) Other niche players (Compliance / Menu / Desking) Other niche players 23 DMS / Sales Subscription Products Data Services (Chrome / ALG) Vehicle Registration / Title Management Credit Application Network Inventory Management Solutions
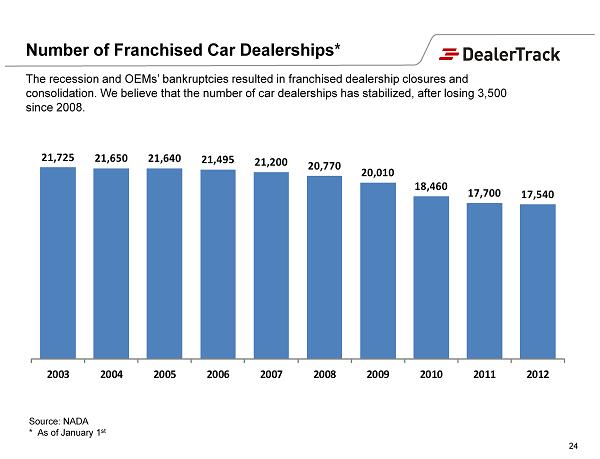
Number of Franchised Car Dealerships* 24 The recession and OEMs’ bankruptcies resulted in franchised dealership closures and consolidation. We believe that the number of car dealerships has stabilized, after losing 3,500 since 2008. 21,725 21,650 21,640 21,495 21,200 20,770 20,010 18,460 17,700 17,540 2003 2004 2005 2006 2007 2008 2009 2010 2011 2012 Source: NADA * As of January 1 st
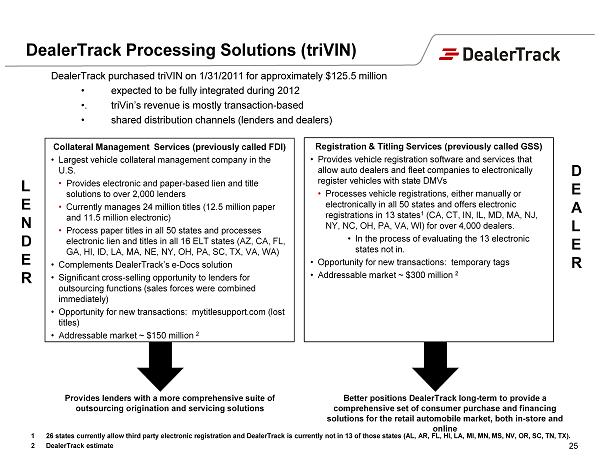
DealerTrack Processing Solutions (triVIN) Collateral Management Services (previously called FDI) • Largest vehicle collateral management company in the U.S. • Provides electronic and paper - based lien and title solutions to over 2,000 lenders • Currently manages 24 million titles (12.5 million paper and 11.5 million electronic) • Process paper titles in all 50 states and processes electronic lien and titles in all 16 ELT states (AZ, CA, FL, GA, HI, ID, LA, MA, NE, NY, OH, PA, SC, TX, VA, WA) • Complements DealerTrack’s e - Docs solution • Significant cross - selling opportunity to lenders for outsourcing functions (sales forces were combined immediately) • Opportunity for new transactions: mytitlesupport.com (lost titles) • Addressable market ~ $150 million 2 25 Provides lenders with a more comprehensive suite of outsourcing origination and servicing solutions Registration & Titling Services (previously called GSS) • Provides vehicle registration software and services that allow auto dealers and fleet companies to electronically register vehicles with state DMVs • Processes vehicle registrations, either manually or electronically in all 50 states and offers electronic registrations in 13 states 1 (CA, CT, IN, IL, MD, MA, NJ, NY, NC, OH, PA, VA, WI) for over 4,000 dealers. • In the process of evaluating the 13 electronic states not in. • Opportunity for new transactions: temporary tags • Addressable market ~ $300 million 2 Better positions DealerTrack long - term to provide a comprehensive set of consumer purchase and financing solutions for the retail automobile market, both in - store and online DealerTrack purchased triVIN on 1/31/2011 for approximately $125.5 million • expected to be fully integrated during 2012 • . triVin’s revenue is mostly transaction - based • shared distribution channels (lenders and dealers) 1 26 states currently allow third party electronic registration and DealerTrack is currently not in 13 of those states (AL, AR, FL, HI, LA, MI, MN, MS, NV, OR, SC, TN, TX ). 2 DealerTrack estimate
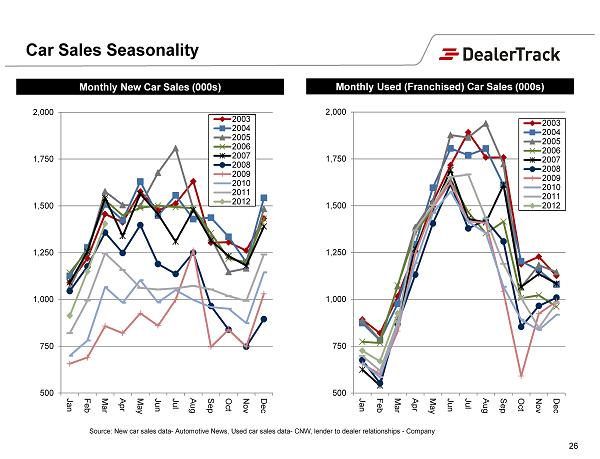
Source: New car sales data - Automotive News, Used car sales data - CNW, lender to dealer relationships - Company 26 500 750 1,000 1,250 1,500 1,750 2,000 Jan Feb Mar Apr May Jun Jul Aug Sep Oct Nov Dec 2003 2004 2005 2006 2007 2008 2009 2010 2011 2012 500 750 1,000 1,250 1,500 1,750 2,000 Jan Feb Mar Apr May Jun Jul Aug Sep Oct Nov Dec 2003 2004 2005 2006 2007 2008 2009 2010 2011 2012 Car Sales Seasonality Monthly New Car Sales (000s) Monthly Used (Franchised) Car Sales (000s)
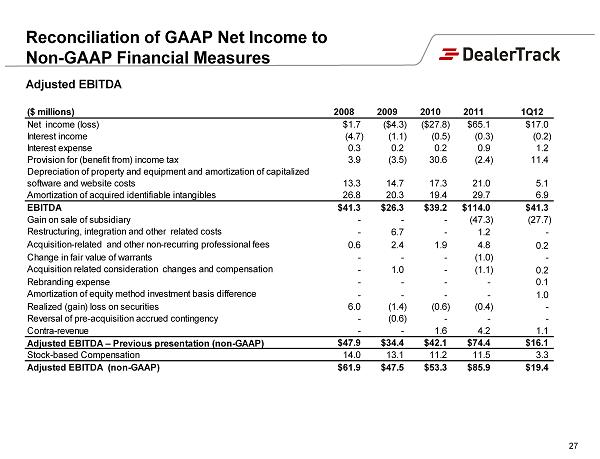
Adjusted EBITDA 27 ($ millions) 2008 2009 2010 2011 1Q12 Net income (loss) $1.7 ($4.3) ($27.8) $65.1 $17.0 Interest income (4.7) (1.1) (0.5) (0.3) (0.2) Interest expense 0.3 0.2 0.2 0.9 1.2 Provision for (benefit from) income tax 3.9 (3.5) 30.6 (2.4) 11.4 Depreciation of property and equipment and amortization of capitalized software and website costs 13.3 14.7 17.3 21.0 5.1 Amortization of acquired identifiable intangibles 26.8 20.3 19.4 29.7 6.9 EBITDA $41.3 $26.3 $39.2 $114.0 $41.3 Gain on sale of subsidiary - - - (47.3) (27.7) Restructuring, integration and other related costs - 6.7 - 1.2 - Acquisition-related and other non-recurring professional fees 0.6 2.4 1.9 4.8 0.2 Change in fair value of warrants - - - (1.0) - Acquisition related consideration changes and compensation - 1.0 - (1.1) 0.2 Rebranding expense - - - - 0.1 Amortization of equity method investment basis difference - - - - 1.0 Realized (gain) loss on securities 6.0 (1.4) (0.6) (0.4) - Reversal of pre-acquisition accrued contingency - (0.6) - - - Contra-revenue - - 1.6 4.2 1.1 Adjusted EBITDA – Previous presentation (non-GAAP) $47.9 $34.4 $42.1 $74.4 $16.1 Stock-based Compensation 14.0 13.1 11.2 11.5 3.3 Adjusted EBITDA (non-GAAP) $61.9 $47.5 $53.3 $85.9 $19.4 Reconciliation of GAAP Net Income to Non - GAAP Financial Measures
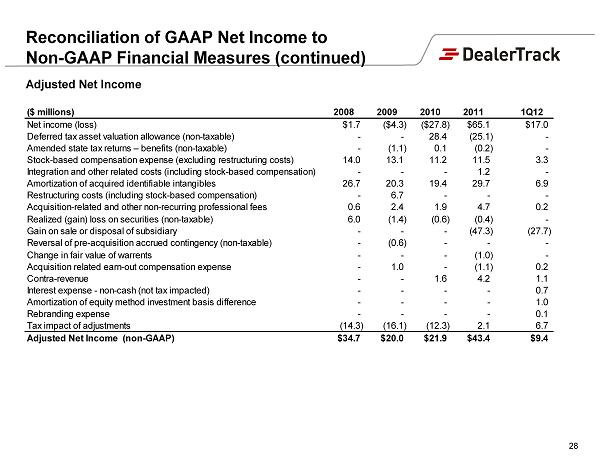
28 ($ millions) 2008 2009 2010 2011 1Q12 Net income (loss) $1.7 ($4.3) ($27.8) $65.1 $17.0 Deferred tax asset valuation allowance (non-taxable) - - 28.4 (25.1) - Amended state tax returns – benefits (non-taxable) - (1.1) 0.1 (0.2) - Stock-based compensation expense (excluding restructuring costs) 14.0 13.1 11.2 11.5 3.3 Integration and other related costs (including stock-based compensation) - - - 1.2 - Amortization of acquired identifiable intangibles 26.7 20.3 19.4 29.7 6.9 Restructuring costs (including stock-based compensation) - 6.7 - - - Acquisition-related and other non-recurring professional fees 0.6 2.4 1.9 4.7 0.2 Realized (gain) loss on securities (non-taxable) 6.0 (1.4) (0.6) (0.4) - Gain on sale or disposal of subsidiary - - - (47.3) (27.7) Reversal of pre-acquisition accrued contingency (non-taxable) - (0.6) - - - Change in fair value of warrents - - - (1.0) - Acquisition related earn-out compensation expense - 1.0 - (1.1) 0.2 Contra-revenue - - 1.6 4.2 1.1 Interest expense - non-cash (not tax impacted) - - - - 0.7 Amortization of equity method investment basis difference - - - - 1.0 Rebranding expense - - - - 0.1 Tax impact of adjustments (14.3) (16.1) (12.3) 2.1 6.7 Adjusted Net Income (non-GAAP) $34.7 $20.0 $21.9 $43.4 $9.4 Adjusted Net Income Reconciliation of GAAP Net Income to Non - GAAP Financial Measures (continued)
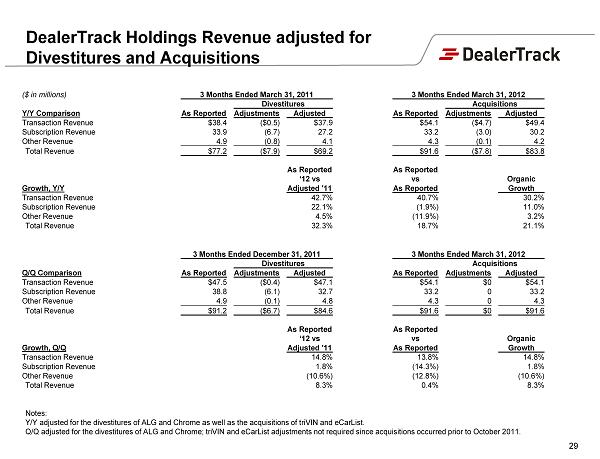
DealerTrack Holdings Revenue adjusted for Divestitures and Acquisitions 29 ($ in millions) 3 Months Ended March 31, 2011 3 Months Ended March 31, 2012 Divestitures Acquisitions Y/Y Comparison As Reported Adjustments Adjusted As Reported Adjustments Adjusted Transaction Revenue $ 38.4 ($0.5) $ 37.9 $ 54.1 ($ 4.7) $ 49.4 Subscription Revenue 33.9 ( 6.7) 27.2 33.2 ( 3.0) 30.2 Other Revenue 4.9 (0.8) 4.1 4.3 (0.1) 4.2 Total Revenue $ 77.2 ($ 7.9) $ 69.2 $ 91.6 ($ 7.8) $ 83.8 As Reported ‘12 vs As Reported vs Organic Growth, Y/Y Adjusted '11 As Reported Growth Transaction Revenue 42.7% 40.7% 30.2% Subscription Revenue 22.1% (1.9%) 11.0% Other Revenue 4.5% (11.9%) 3.2% Total Revenue 32.3% 18.7% 21.1% 3 Months Ended December 31, 2011 3 Months Ended March 31, 2012 Divestitures Acquisitions Q/Q Comparison As Reported Adjustments Adjusted As Reported Adjustments Adjusted Transaction Revenue $ 47.5 ($0.4) $ 47.1 $ 54.1 $0 $ 54.1 Subscription Revenue 38.8 ( 6.1) 32.7 33.2 0 33.2 Other Revenue 4.9 (0.1) 4.8 4.3 0 4.3 Total Revenue $ 91.2 ($ 6.7) $ 84.6 $ 91.6 $0 $ 91.6 As Reported ‘12 vs As Reported vs Organic Growth, Q/Q Adjusted '11 As Reported Growth Transaction Revenue 14.8% 13.8% 14.8% Subscription Revenue 1.8% (14.3%) 1.8% Other Revenue (10.6%) (12.8%) (10.6%) Total Revenue 8.3% 0.4% 8.3% Notes: Y/Y adjusted for the divestitures of ALG and Chrome as well as the acquisitions of triVIN and eCarList. Q/Q adjusted for the divestitures of ALG and Chrome; triVIN and eCarList adjustments not required since acquisitions occurred pr ior to October 2011.
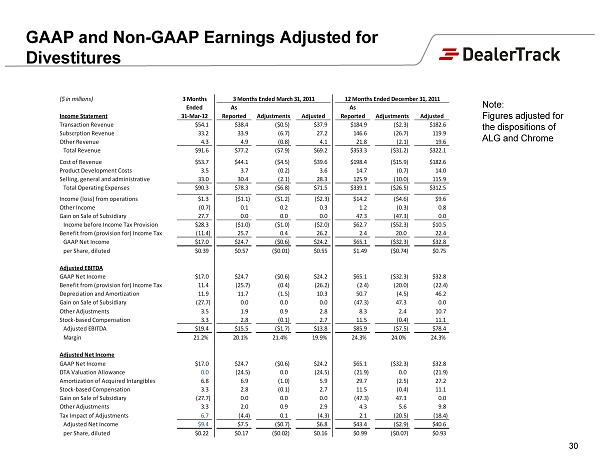
GAAP and Non - GAAP Earnings Adjusted for Divestitures 30 ($ in millions) 3 Months 3 Months Ended March 31, 2011 12 Months Ended December 31, 2011 Ended As As Income Statement 31-Mar-12 Reported Adjustments Adjusted Reported Adjustments Adjusted Transaction Revenue $54.1 $38.4 ($0.5) $37.9 $184.9 ($2.3) $182.6 Subscrption Revenue 33.2 33.9 (6.7) 27.2 146.6 (26.7) 119.9 Other Revenue 4.3 4.9 (0.8) 4.1 21.8 (2.1) 19.6 Total Revenue $91.6 $77.2 ($7.9) $69.2 $353.3 ($31.2) $322.1 Cost of Revenue $53.7 $44.1 ($4.5) $39.6 $198.4 ($15.9) $182.6 Product Development Costs 3.5 3.7 (0.2) 3.6 14.7 (0.7) 14.0 Selling, general and administrative 33.0 30.4 (2.1) 28.3 125.9 (10.0) 115.9 Total Operating Expenses $90.3 $78.3 ($6.8) $71.5 $339.1 ($26.5) $312.5 Income (loss) from operations $1.3 ($1.1) ($1.2) ($2.3) $14.2 ($4.6) $9.6 Other Income (0.7) 0.1 0.2 0.3 1.2 (0.3) 0.8 Gain on Sale of Subsidiary 27.7 0.0 0.0 0.0 47.3 (47.3) 0.0 Income before Income Tax Provision $28.3 ($1.0) ($1.0) ($2.0) $62.7 ($52.3) $10.5 Benefit from (provision for) Income Tax (11.4) 25.7 0.4 26.2 2.4 20.0 22.4 GAAP Net Income $17.0 $24.7 ($0.6) $24.2 $65.1 ($32.3) $32.8 per Share, diluted $0.39 $0.57 ($0.01) $0.55 $1.49 ($0.74) $0.75 Adjusted EBITDA GAAP Net Income $17.0 $24.7 ($0.6) $24.2 $65.1 ($32.3) $32.8 Benefit from (provision for) Income Tax 11.4 (25.7) (0.4) (26.2) (2.4) (20.0) (22.4) Depreciation and Amortization 11.9 11.7 (1.5) 10.3 50.7 (4.5) 46.2 Gain on Sale of Subsidiary (27.7) 0.0 0.0 0.0 (47.3) 47.3 0.0 Other Adjustments 3.5 1.9 0.9 2.8 8.3 2.4 10.7 Stock-based Compensation 3.3 2.8 (0.1) 2.7 11.5 (0.4) 11.1 Adjusted EBITDA $19.4 $15.5 ($1.7) $13.8 $85.9 ($7.5) $78.4 Margin 21.2% 20.1% 21.4% 19.9% 24.3% 24.0% 24.3% Adjusted Net Income GAAP Net Income $17.0 $24.7 ($0.6) $24.2 $65.1 ($32.3) $32.8 DTA Valuation Allowance 0.0 (24.5) 0.0 (24.5) (21.9) 0.0 (21.9) Amortization of Acquired Intangibles 6.8 6.9 (1.0) 5.9 29.7 (2.5) 27.2 Stock-based Compensation 3.3 2.8 (0.1) 2.7 11.5 (0.4) 11.1 Gain on Sale of Subsidiary (27.7) 0.0 0.0 0.0 (47.3) 47.3 0.0 Other Adjustments 3.3 2.0 0.9 2.9 4.3 5.6 9.8 Tax Impact of Adjustments 6.7 (4.4) 0.1 (4.3) 2.1 (20.5) (18.4) Adjusted Net Income $9.4 $7.5 ($0.7) $6.8 $43.4 ($2.9) $40.6 per Share, diluted $0.22 $0.17 ($0.02) $0.16 $0.99 ($0.07) $0.93 Note: Figures adjusted for the dispositions of ALG and Chrome
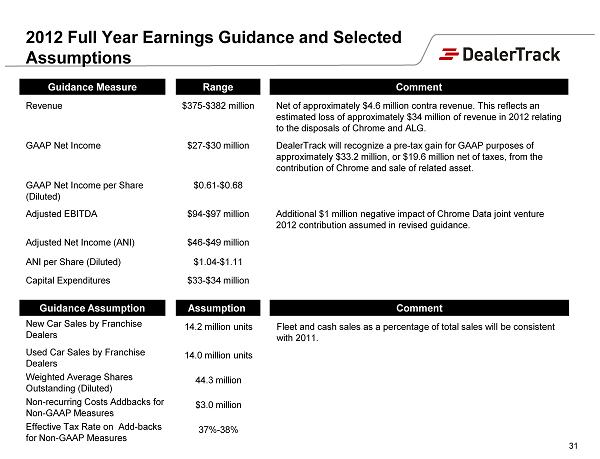
Revenue $375 - $382 million Net of approximately $4.6 million contra revenue. This reflects an estimated loss of approximately $34 million of revenue in 2012 relating to the disposals of Chrome and ALG. GAAP Net Income $27 - $30 million DealerTrack will recognize a pre - tax gain for GAAP purposes of approximately $33.2 million, or $19.6 million net of taxes, from the contribution of Chrome and sale of related asset . GAAP Net Income per Share (Diluted) $0.61 - $0.68 Adjusted EBITDA $94 - $97 million Additional $1 million negative impact of Chrome Data joint venture 2012 contribution assumed in revised guidance. Adjusted Net Income (ANI) $46 - $49 million ANI per Share (Diluted) $1.04 - $1.11 Capital Expenditures $33 - $34 million 31 2012 Full Year Earnings Guidance and Selected Assumptions Guidance Measure Range Comment New Car Sales by Franchise Dealers 14.2 million units Fleet and cash sales as a percentage of total sales will be consistent with 2011. Used Car Sales by Franchise Dealers 14.0 million units Weighted Average Shares Outstanding (Diluted) 44.3 million Non - recurring Costs Addbacks for Non - GAAP Measures $3.0 million Effective Tax Rate on Add - backs for Non - GAAP Measures 37% - 38% Guidance Assumption Assumption Comment
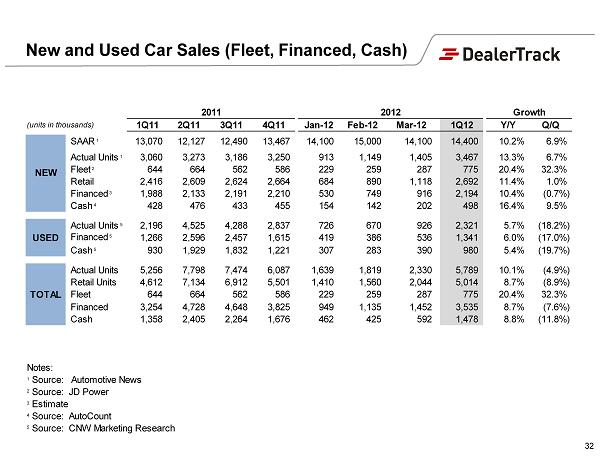
2011 2012 Growth (units in thousands) 1Q11 2Q11 3Q11 4Q11 Jan-12 Feb-12 Mar-12 1Q12 Y/Y Q/Q SAAR 1 13,070 12,127 12,490 13,467 14,100 15,000 14,100 14,400 10.2% 6.9% Actual Units 1 3,060 3,273 3,186 3,250 913 1,149 1,405 3,467 13.3% 6.7% Fleet 2 644 664 562 586 229 259 287 775 20.4% 32.3% Retail 2,416 2,609 2,624 2,664 684 890 1,118 2,692 11.4% 1.0% Financed 3 1,988 2,133 2,191 2,210 530 749 916 2,194 10.4% (0.7%) Cash 4 428 476 433 455 154 142 202 498 16.4% 9.5% Actual Units 5 2,196 4,525 4,288 2,837 726 670 926 2,321 5.7% (18.2%) USED Financed 5 1,266 2,596 2,457 1,615 419 386 536 1,341 6.0% (17.0%) Cash 5 930 1,929 1,832 1,221 307 283 390 980 5.4% (19.7%) Actual Units 5,256 7,798 7,474 6,087 1,639 1,819 2,330 5,789 10.1% (4.9%) Retail Units 4,612 7,134 6,912 5,501 1,410 1,560 2,044 5,014 8.7% (8.9%) TOTAL Fleet 644 664 562 586 229 259 287 775 20.4% 32.3% Financed 3,254 4,728 4,648 3,825 949 1,135 1,452 3,535 8.7% (7.6%) Cash 1,358 2,405 2,264 1,676 462 425 592 1,478 8.8% (11.8%) Notes: 1 Source: Automotive News 2 Source: JD Power 3 Estimate 4 Source: AutoCount 5 Source: CNW Marketing Research NEW 32 New and Used Car Sales (Fleet, Financed, Cash)