Attached files
| file | filename |
|---|---|
| EX-99.1 - EXHIBIT 99.1 - Colfax CORP | v312218_ex99-1.htm |
| 8-K - FORM 8-K - Colfax CORP | v312218_8k.htm |

First Quarter 2012 Earnings Conference Call May 8, 2012
2 The following information contains forward - looking statements, including forward - looking statements within the meaning of the Private Securities Litigation Reform Act of 1995. Such forward - looking statements include, but are not limited to, statements concerning Colfax's plans, objectives, expectations and intentions and other statements that are not historical or current facts. Forward - looking statements are based on Colfax's current expectations and involve risks and uncertainties that could cause actual results to differ materially from those expressed or implied in such forward - looking statements. Factors that could cause Colfax's results to differ materially from current expectations include, but are not limited to, factors detailed in Colfax's reports filed with the U.S. Securities and Exchange Commission including its 2011 Annual Report on Form 10 - K under the caption “Risk Factors”. In addition, these statements are based on a number of assumptions that are subject to change. This presentation speaks only as of this date. Colfax disclaims any duty to update the information herein. Forward - Looking Statements

3 3 Q1 2012 Results

4 Q1 2012 Highlights • Adjusted net income of $25.5 million ($0.23 per share) compared to $9.2 million ($0.21 per share) in Q1 2011 • Net sales of $886.4 million, an increase of 11.3% from first quarter 2011 proforma net sales of $796.5 million • Adjusted operating income of $63.4 million compared to $15.4 million in Q1 2011 • First quarter gas - and fluid - handling orders of $497.5 million compared to proforma orders of $451.9 million in Q1 2011, an increase of 10.1% • Gas - and fluid - handling backlog of $1.4 billion at period end 4
5 5 Gas - and Fluid - Handling
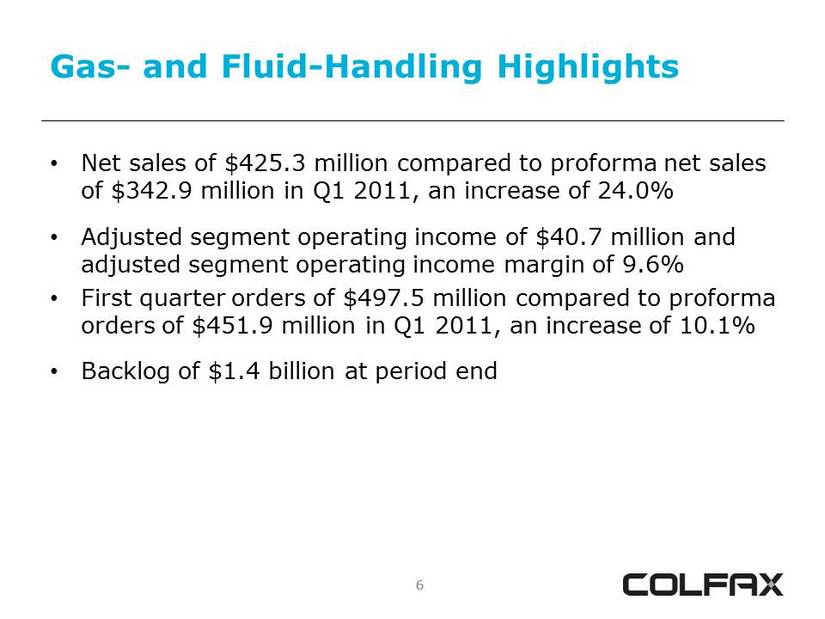
6 Gas - and Fluid - Handling Highlights • Net sales of $425.3 million compared to proforma net sales of $342.9 million in Q1 2011, an increase of 24.0% • Adjusted segment operating income of $40.7 million and adjusted segment operating income margin of 9.6% • First quarter orders of $497.5 million compared to proforma orders of $451.9 million in Q1 2011, an increase of 10.1% • Backlog of $1.4 billion at period end 6
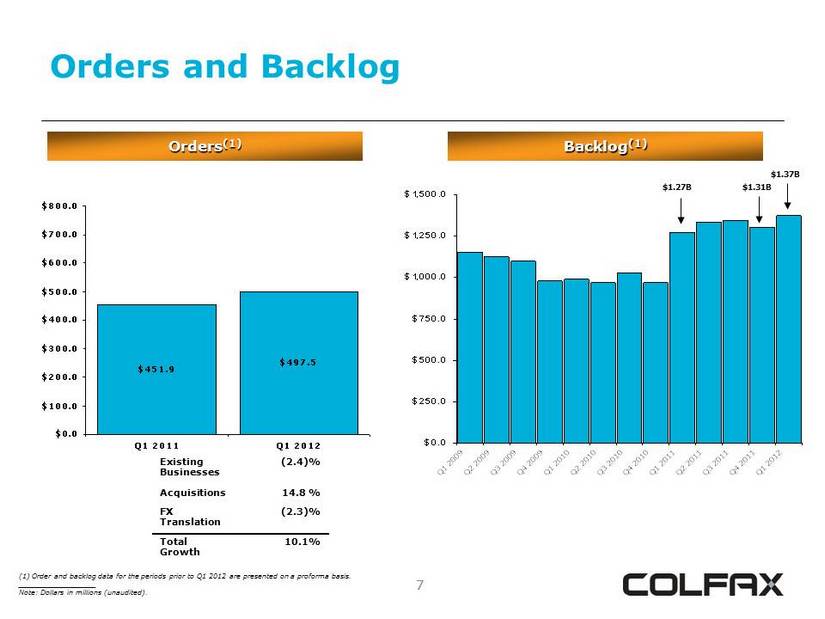
7 Orders and Backlog 7 Orders (1) $451.9 $497.5 $0.0 $100.0 $200.0 $300.0 $400.0 $500.0 $600.0 $700.0 $800.0 Q1 2011 Q1 2012 Backlog (1) $0.0 $250.0 $500.0 $750.0 $1,000.0 $1,250.0 $1,500.0 Q1 2009Q2 2009Q3 2009Q4 2009Q1 2010Q2 2010Q3 2010Q4 2010Q1 2011Q2 2011Q3 2011Q4 2011Q1 2012 (1) Order and backlog data for the periods prior to Q1 2012 are presented on a proforma basis. __________________ Note: Dollars in millions (unaudited). Existing Businesses (2.4)% Acquisitions 14.8 % FX Translation (2.3)% Total Growth 10.1% $1.27B $1.31B $1.37B
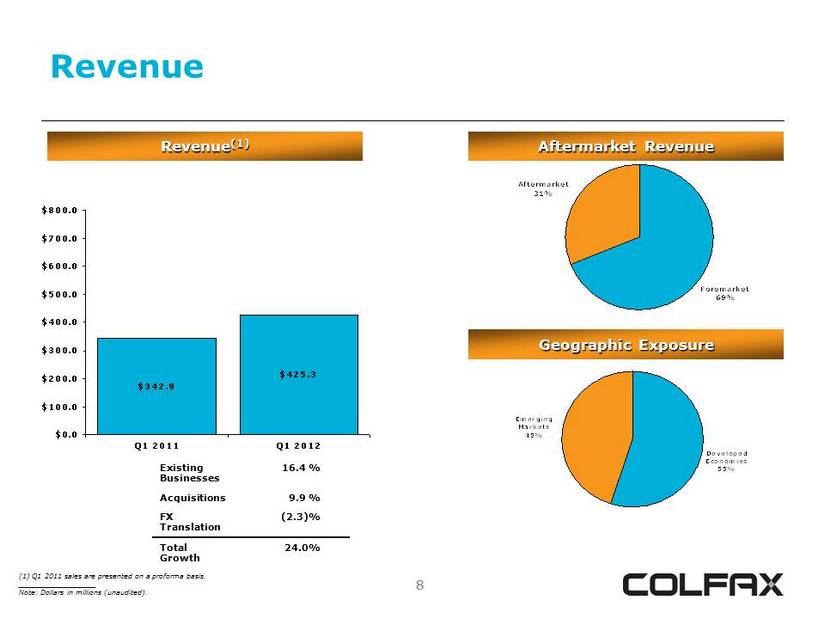
8 Revenue 8 Revenue (1) $342.9 $425.3 $0.0 $100.0 $200.0 $300.0 $400.0 $500.0 $600.0 $700.0 $800.0 Q1 2011 Q1 2012 (1) Q1 2011 sales are presented on a proforma basis. __________________ Note: Dollars in millions (unaudited). Aftermarket Revenue Foremarket 69% Aftermarket 31% Geographic Exposure Developed Economies 55% Emerging Markets 45% Existing Businesses 16.4 % Acquisitions 9.9 % FX Translation (2.3)% Total Growth 24.0%

9 Q1 2012 Sales and Orders by End Market 9 Sales: $425.3 million Orders: $497.5 million General Industrial and Other 25% Power Generation 31% Oil, Gas & Petro- chemical 25% Mining 6% Marine 13% Total (Decline) Growth Organic (Decline) Growth Power Generation 30.0 % 30.4 % Oil, Gas & Petrochemical 68.7 % 23.2% Marine (3.1)% (1.1)% Mining 6.9% 10.1% General Industrial & Other 8.5 % 9.1 % Total 24.0 % 16.4% Power Generation 33% General Industrial and Other 23% Oil, Gas & Petro- chemical 25% Mining 8% Marine 11% Total (Decline) Growth Organic (Decline) Growth Power Generation 0.9 % 1.8 % Oil, Gas & Petrochemical 54.7 % (17.6)% Marine (5.6)% (3.5)% Mining 21.5% 26.0% General Industrial & Other (4.1) % (5.5) % Total 10.1 % (2.4)% __________________ Note: Dollars in millions (unaudited). Total and organic growth (decline) is calculated on a proforma basis.
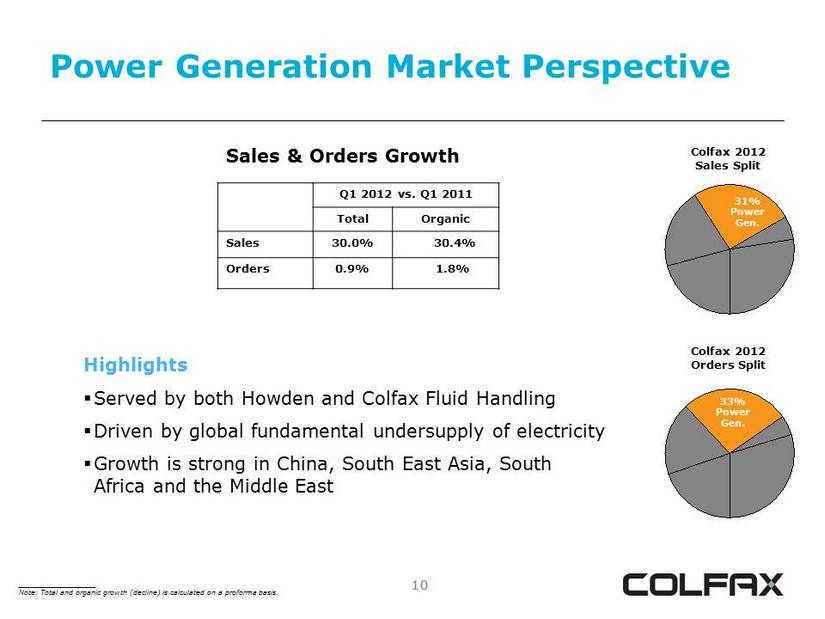
10 Power Generation Market Perspective 10 Sales & Orders Growth Q1 2012 vs. Q1 2011 Total Organic Sales 30.0% 30.4% Orders 0.9% 1.8% Colfax 2012 Sales Split 31% Power Gen. Colfax 2012 Orders Split Highlights ▪ Served by both Howden and Colfax Fluid Handling ▪ Driven by global fundamental undersupply of electricity ▪ Growth is strong in China, South East Asia, South Africa and the Middle East 33% Power Gen. __________________ Note: Total and organic growth (decline) is calculated on a proforma basis.
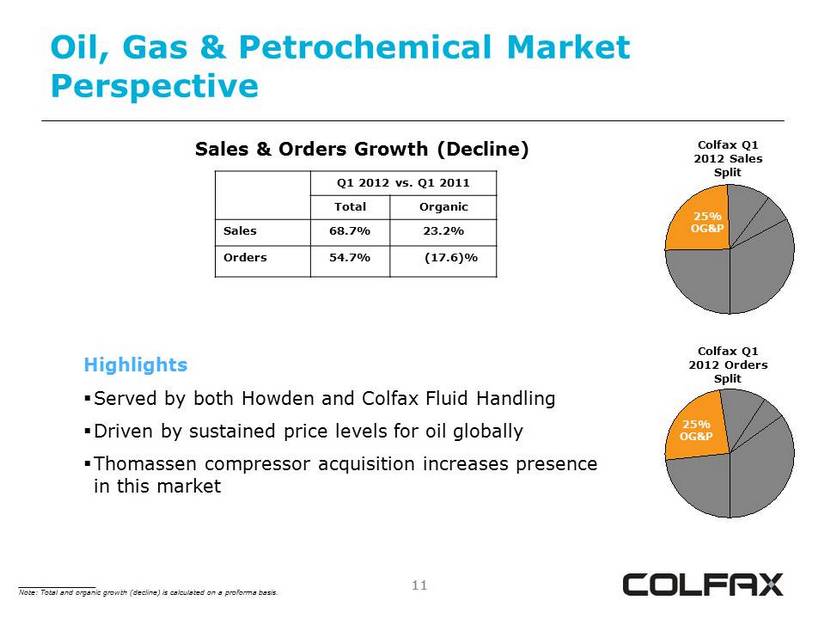
11 Oil, Gas & Petrochemical Market Perspective 11 Sales & Orders Growth (Decline) Q1 2012 vs. Q1 2011 Total Organic Sales 68.7% 23.2% Orders 54.7% (17.6)% Colfax Q1 2012 Sales Split 25% OG&P Colfax Q1 2012 Orders Split 25% OG&P Highlights ▪ Served by both Howden and Colfax Fluid Handling ▪ Driven by sustained price levels for oil globally ▪ Thomassen compressor acquisition increases presence in this market __________________ Note: Total and organic growth (decline) is calculated on a proforma basis.
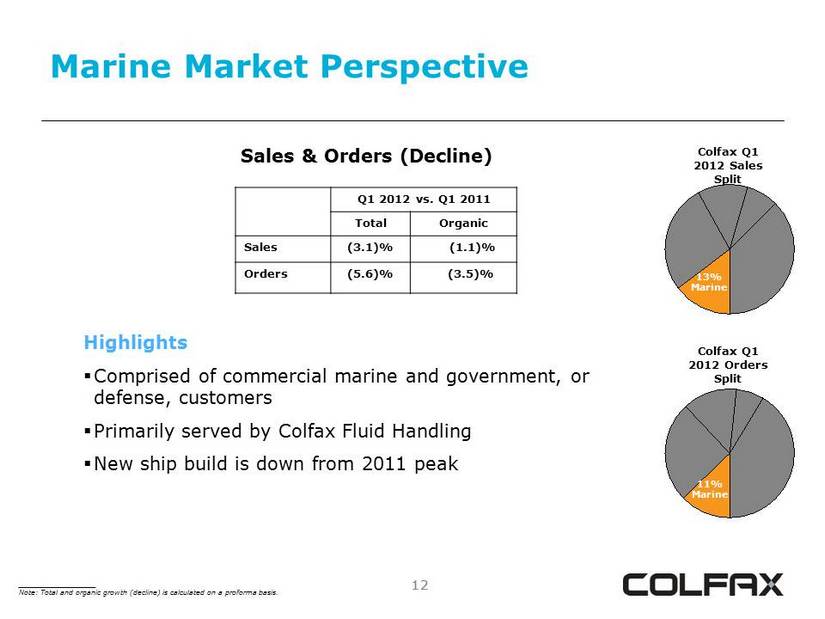
12 Marine Market Perspective 12 Sales & Orders (Decline) Q1 2012 vs. Q1 2011 Total Organic Sales (3.1)% (1.1)% Orders (5.6)% (3.5)% Colfax Q1 2012 Sales Split 13% Marine Colfax Q1 2012 Orders Split Highlights ▪ Comprised of commercial marine and government, or defense, customers ▪ Primarily served by Colfax Fluid Handling ▪ New ship build is down from 2011 peak 11% Marine __________________ Note: Total and organic growth (decline) is calculated on a proforma basis.
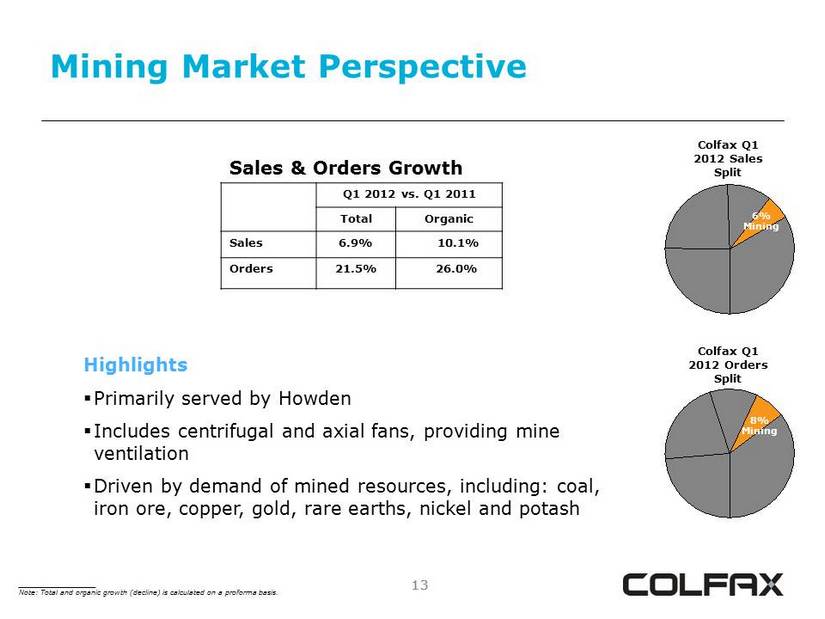
13 Mining Market Perspective 13 Sales & Orders Growth Q1 2012 vs. Q1 2011 Total Organic Sales 6.9% 10.1% Orders 21.5% 26.0% Colfax Q1 2012 Sales Split 6% Mining Colfax Q1 2012 Orders Split Highlights ▪ Primarily served by Howden ▪ Includes centrifugal and axial fans, providing mine ventilation ▪ Driven by demand of mined resources, including: coal, iron ore, copper, gold, rare earths, nickel and potash 8% Mining __________________ Note: Total and organic growth (decline) is calculated on a proforma basis.
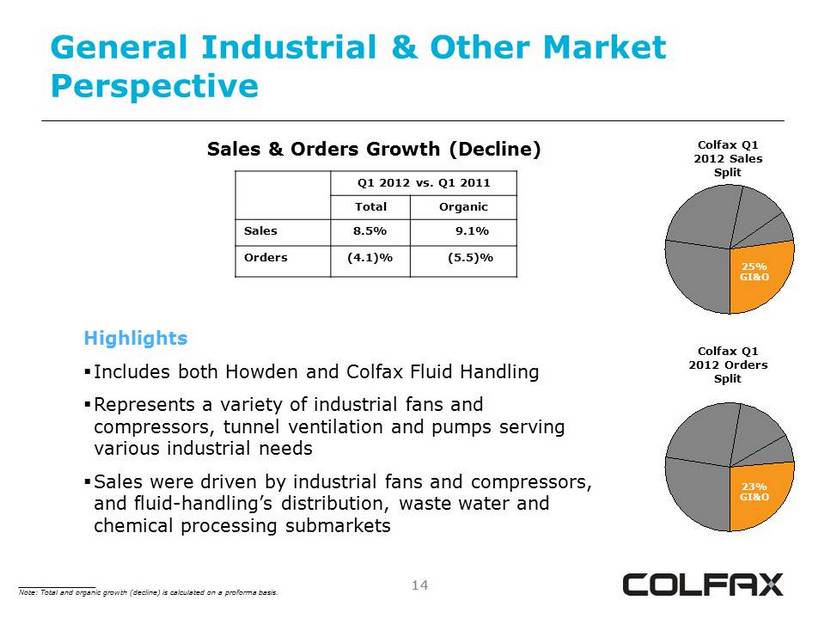
14 General Industrial & Other Market Perspective 14 Sales & Orders Growth (Decline) Q1 2012 vs. Q1 2011 Total Organic Sales 8.5% 9.1% Orders (4.1)% (5.5)% Colfax Q1 2012 Sales Split 25% GI&O Colfax Q1 2012 Orders Split Highlights ▪ Includes both Howden and Colfax Fluid Handling ▪ Represents a variety of industrial fans and compressors, tunnel ventilation and pumps serving various industrial needs ▪ Sales were driven by industrial fans and compressors, and fluid - handling’s distribution, waste water and chemical processing submarkets 23% GI&O __________________ Note: Total and organic growth (decline) is calculated on a proforma basis.
15 15 Fabrication Technology
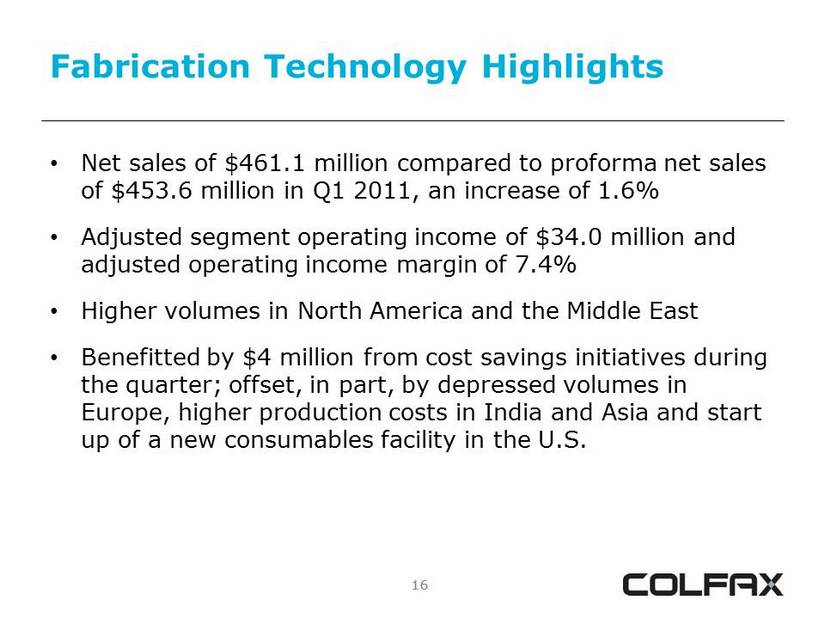
16 Fabrication Technology Highlights • Net sales of $461.1 million compared to proforma net sales of $453.6 million in Q1 2011, an increase of 1.6% • Adjusted segment operating income of $34.0 million and adjusted operating income margin of 7.4% • Higher volumes in North America and the Middle East • Benefitted by $4 million from cost savings initiatives during the quarter; offset, in part, by depressed volumes in Europe, higher production costs in India and Asia and start up of a new consumables facility in the U.S. 16
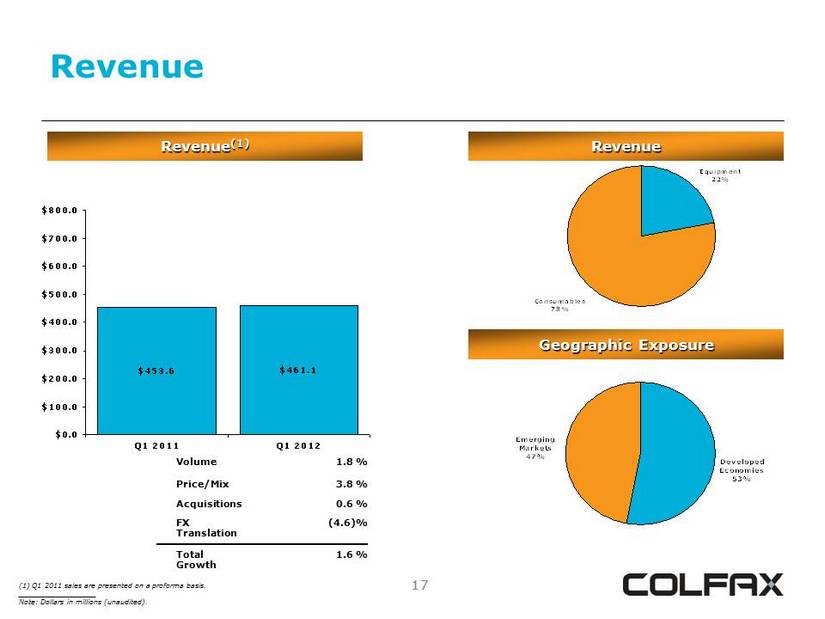
17 Revenue 17 Revenue (1) $453.6 $461.1 $0.0 $100.0 $200.0 $300.0 $400.0 $500.0 $600.0 $700.0 $800.0 Q1 2011 Q1 2012 (1) Q1 2011 sales are presented on a proforma basis. __________________ Note: Dollars in millions (unaudited). Revenue Equipment 22% Consumables 78% Geographic Exposure Developed Economies 53% Emerging Markets 47% Volume 1.8 % Price/Mix 3.8 % Acquisitions 0.6 % FX Translation (4.6)% Total Growth 1.6 %
18 18 Results of Operations
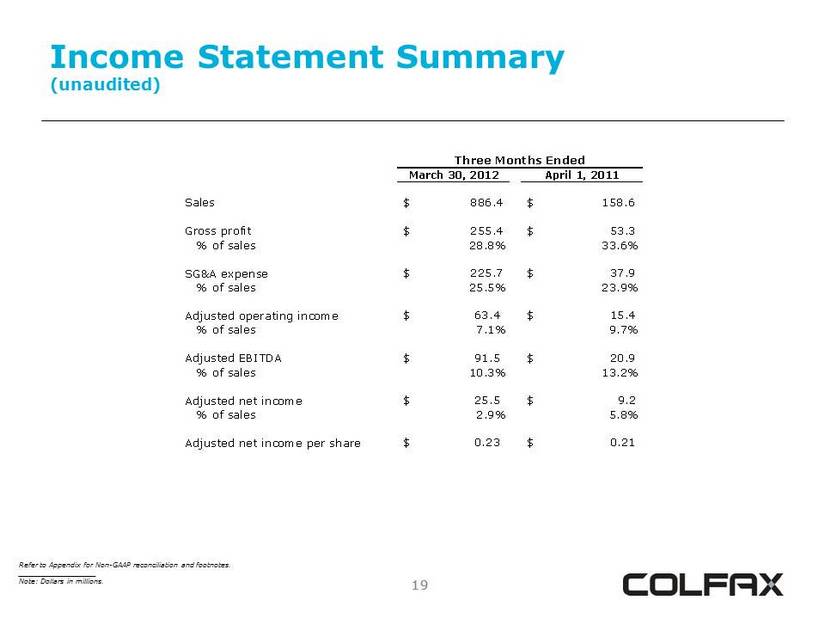
19 Income Statement Summary (unaudited) 19 Refer to Appendix for Non - GAAP reconciliation and footnotes. __________________ Note: Dollars in millions. Three Months Ended Change March 30, 2012 April 1, 2011 Sales $ 886.4 $ 158.6 Gross profit $ 255.4 $ 53.3 % of sales 28.8% 33.6% SG&A expense $ 225.7 $ 37.9 % of sales 25.5% 23.9% Adjusted operating income $ 63.4 $ 15.4 % of sales 7.1% 9.7% Adjusted EBITDA $ 91.5 $ 20.9 % of sales 10.3% 13.2% Adjusted net income $ 25.5 $ 9.2 % of sales 2.9% 5.8% Adjusted net income per share $ 0.23 $ 0.21
20 20 Appendix
21 Disclaimer 21 Colfax has provided financial information that has not been prepared in accordance with GAAP. These non - GAAP financial measures are adjusted net income, adjusted net income per share, adjusted operating income, earnings before interest, taxes and depreciation (EBITDA), adjusted EBITDA, organic sales growth and organic order growth. Adjusted net income, adjusted net income per share, adjusted EBITDA and adjusted operating income excludes asbestos coverage litigation expense, expenses related to major restructuring programs or any additional structural changes announced in the future, expenses related to the Charter acquisition and significant year - one fair value adjustment amortization expense. The effective tax rates used to calculate adjusted net income, adjusted net income per share and projected adjusted net income per share are 31% for Q1 2012 in comparison to 32% for Q1 2011. Organic sales growth (decline) and organic order growth (decline) exclude the impact of bolt - on acquisitions and foreign exchange rate fluctuations and are presented on a proforma basis (the proforma comparison includes the 2011 sales and orders for Howden and ESAB, excluding the first 12 days of each reporting period). These non - GAAP financial measures assist Colfax in comparing its operating performance on a consistent basis because, among other things, they remove the impact of asbestos insurance coverage issues, costs related to the Charter acquisition, major restructuring programs and items outside the control of its operating management. Sales and order information by end market are estimates. We periodically update our customer groupings order to refine these estimates.

22 Non - GAAP Reconciliation (unaudited) ____________________ Note: Dollars in thousands. March 30, 2012 April 1, 2011 EBITDA Net (loss) income (100,461)$ 6,555$ Interest expense 18,982 1,827 Provision for income taxes 57,348 2,950 Depreciation and amortization 61,804 5,527 EBITDA 37,673$ 16,859$ EBITDA margin 4.3% 10.6% Adjusted EBITDA Net (loss) income (100,461)$ 6,555$ Interest expense 18,982 1,827 Provision for income taxes 57,348 2,950 Depreciation and amortization 61,804 5,527 Restructuring and other related charges 8,643 1,977 Charter acquisition-related expense 42,851 - Asbestos coverage litigation expense 2,287 2,066 Adjusted EBITDA 91,454$ 20,902$ Adjusted EBITDA margin 10.3% 13.2% Three Months Ended

23 Non - GAAP Reconciliation (unaudited) ____________________ Note: Dollars in thousands. (1) The effective tax rates used to calculate adjusted net income and adjusted net income per share are 31% and 32% for the first qu arter of 2012 and 2011, respectively. (2) Adjusted net income per share was calculated consistent with the two - class method in accordance with GAAP as the Series A prefer red stock are considered participating securities. Losses are not allocated to the preferred stock. March 30, 2012 April 1, 2011 Adjusted Net Income and Adjusted Earnings Per Share Net (loss) income attributable to Colfax Corporation (105,598)$ 6,555$ Restructuring and other related charges 8,643 1,977 Charter acquisition-related expense 42,851 - Fair value adjustments - ESAB/Howden backlog and inventory amortization expense 33,705 - Asbestos coverage litigation expense 2,287 2,066 Tax adjustment (1) 43,592 (1,385) Adjusted net income 25,480 9,213 Adjusted net income margin 2.9% 5.8% Dividends on preferred stock 3,734 - Adjusted net income available to Colfax Corporation common shareholders 21,746 9,213 Less: net income attributable to participating securities (2) 2,757 - 18,989$ 9,213$ Weighted-average shares outstanding - diluted 82,851,827 44,105,120 Adjusted net income per share 0.23$ 0.21$ Net (loss) income per share— basic and diluted (in accordance with GAAP) (1.33)$ 0.15$ Three Months Ended
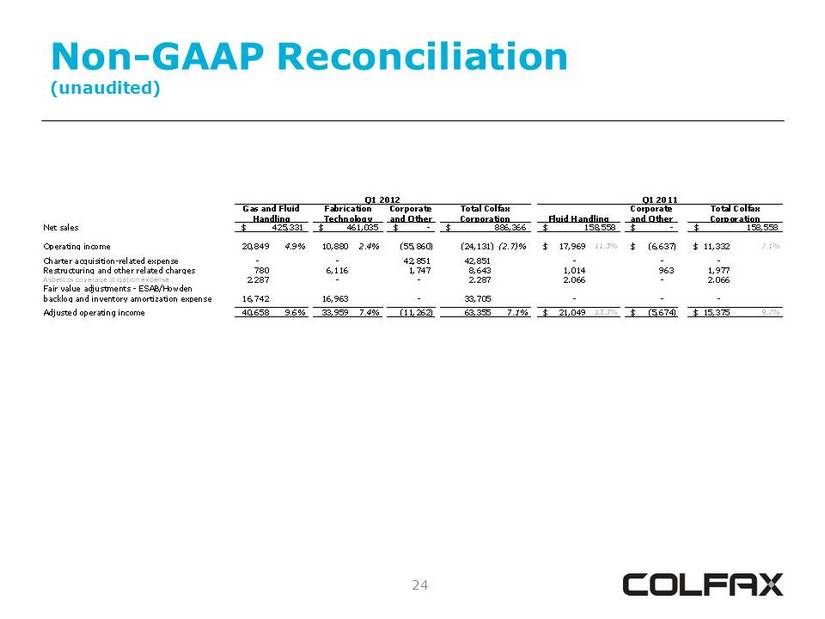
24 Non - GAAP Reconciliation (unaudited) Net sales -$ -$ Operating income 20,849 4.9% 10,880 2.4% (55,860) (24,131) (2.7)% 17,969$ 11.3% (6,637)$ 11,332$ 7.1% Charter acquisition-related expense - - 42,851 42,851 - - - Restructuring and other related charges 780 6,116 1,747 8,643 1,014 963 1,977 Asbestos coverage litigation expense 2,287 - - 2,287 2,066 - 2,066 Fair value adjustments - ESAB/Howden backlog and inventory amortization expense 16,742 16,963 - 33,705 - - - Adjusted operating income 40,658 9.6% 33,959 7.4% (11,262) 63,355 7.1% 21,049$ 13.3% (5,674)$ 15,375$ 9.7% Fluid Handling Q1 2011 Total Colfax Corporation 425,331$ 461,035$ 886,366$ Corporate and Other 158,558$ 158,558$ Gas and Fluid Handling Fabrication Technology Corporate and Other Q1 2012 Total Colfax Corporation
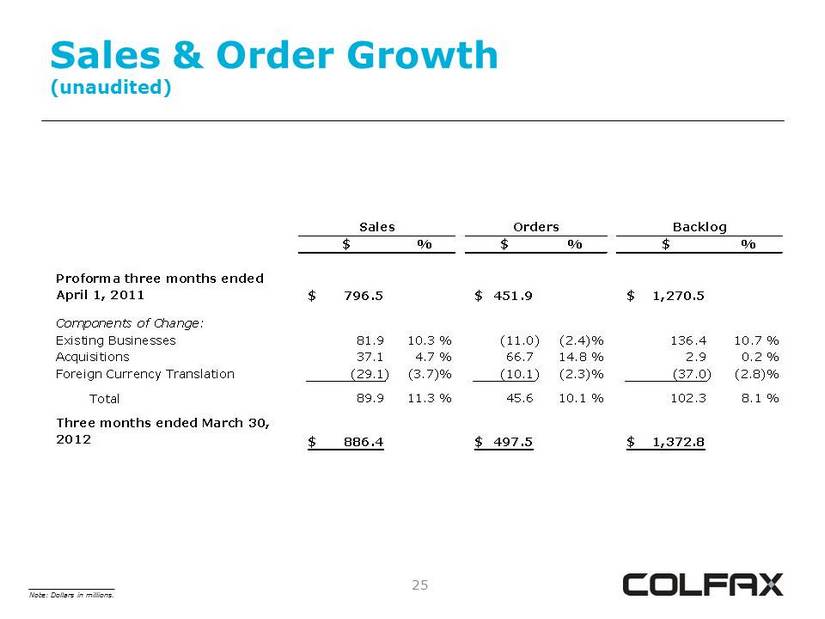
25 Sales & Order Growth (unaudited) ____________________ Note: Dollars in millions. $ % $ % $ % Proforma three months ended April 1, 2011 796.5$ 451.9$ 1,270.5$ Components of Change: Existing Businesses 81.9 10.3 % (11.0) (2.4)% 136.4 10.7 % Acquisitions 37.1 4.7 % 66.7 14.8 % 2.9 0.2 % Foreign Currency Translation (29.1) (3.7)% (10.1) (2.3)% (37.0) (2.8)% Total 89.9 11.3 % 45.6 10.1 % 102.3 8.1 % Three months ended March 30, 2012 886.4$ 497.5$ 1,372.8$ Sales BacklogOrders
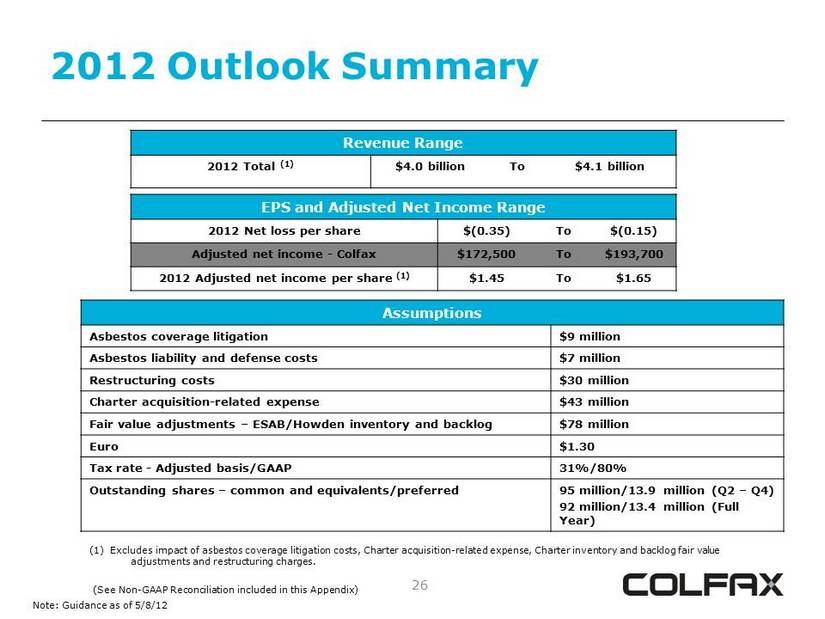
26 2012 Outlook Summary Revenue Range 2012 Total (1) $4.0 billion To $4.1 billion EPS and Adjusted Net Income Range 2012 Net loss per share $(0.35) To $(0.15) Adjusted net income $172,500 To $193,700 2012 Adjusted net income per share (1) $1.45 To $1.65 Assumptions Asbestos coverage litigation $9 million Asbestos liability and defense costs $7 million Restructuring costs $30 million Charter acquisition - related expense $43 million Fair value adjustments – ESAB/Howden inventory and backlog $78 million Euro $1.30 Tax rate - Adjusted basis/GAAP 31%/80% Outstanding shares – common and equivalents/preferred 95 million/13.9 million (Q2 – Q4) 92 million/13.4 million (Full Year) (1) Excludes impact of asbestos coverage litigation costs, Charter acquisition - related expense, Charter inventory and backlog f air value adjustments and restructuring charges. (See Non - GAAP Reconciliation included in this Appendix) Note: Guidance as of 5/8/12
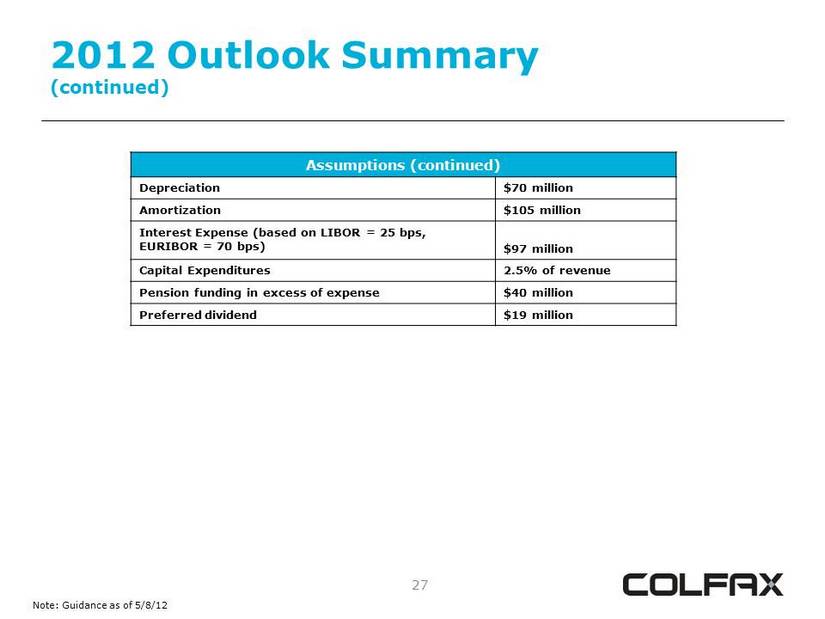
27 2012 Outlook Summary (continued) Assumptions (continued) Depreciation $70 million Amortization $105 million Interest Expense (based on LIBOR = 25 bps, EURIBOR = 70 bps) $97 million Capital Expenditures 2.5% of revenue Pension funding in excess of expense $40 million Preferred dividend $19 million Note: Guidance as of 5/8/12
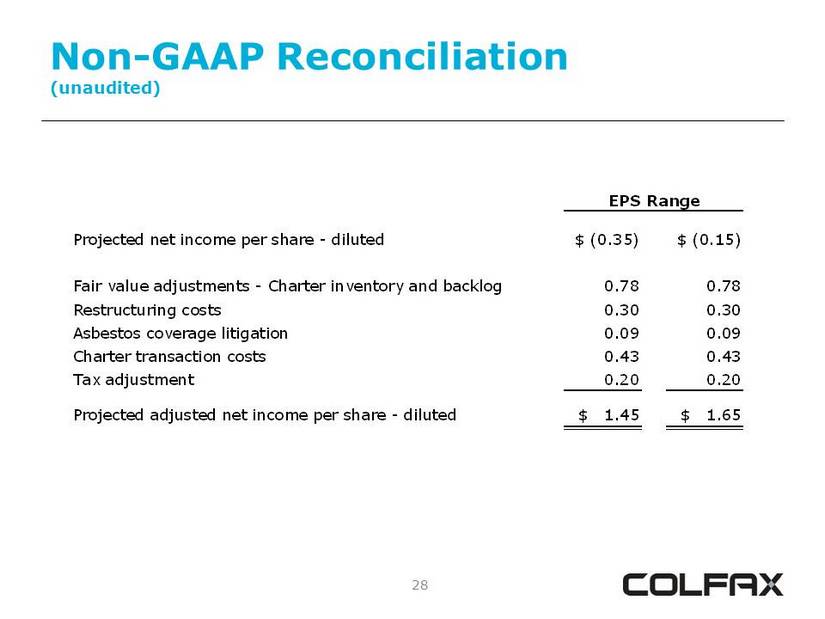
28 Non - GAAP Reconciliation (unaudited) Projected net income per share - diluted $ (0.35) $ (0.15) Fair value adjustments - Charter inventory and backlog 0.78 0.78 Restructuring costs 0.30 0.30 Asbestos coverage litigation 0.09 0.09 Charter transaction costs 0.43 0.43 Tax adjustment 0.20 0.20 Projected adjusted net income per share - diluted $ 1.45 $ 1.65 EPS Range