Attached files
| file | filename |
|---|---|
| 8-K - 8-K - ALLSCRIPTS HEALTHCARE SOLUTIONS, INC. | d348601d8k.htm |
 1
Allscripts Investor
Presentation
May 2012
Exhibit 99.1 |
 2
Forward-Looking Statement
This presentation contains forward-looking statements within the meaning of the
federal securities laws that involve risks and uncertainties. We develop
forward-looking statements by combining currently available information with our beliefs and assumptions.
These statements relate to future events, including our future performance, and
management’s expectations, beliefs, intentions, plans or projections relating
to the future and some of these statements can be identified by the use of forward-looking terminology such as
“believes,”
“expects,”
“anticipates,”
“estimates,”
“projects,”
“intends,”
“seeks,”
“future,”
“continue,”
“contemplate,”
“would,”
“will,”
“may,”
“should,”
and the negative or other variations of those terms or comparable terminology or by
discussion of strategy, plans, opportunities
or
intentions.
As
a
result,
actual
results,
performance
or
achievements
may
vary
materially
from
those
anticipated
by
the
forward-looking statements. Among the factors that could cause actual results,
performance or achievements to differ materially from those indicated by such
forward-looking statements are: the possibility that the expected synergies, efficiencies and cost savings of the
merger with Eclipsys Corporation (“Eclipsys”) will not be realized, or will not
be realized within the expected time period; potential difficulties or delays in
achieving platform and product integration and the connection and movement of data among hospitals,
physicians, patients and others; the risk that the Allscripts and Eclipsys businesses will
not be integrated successfully; competition within the industries in which we
operate, including the risk that existing clients will switch to products of competitors; failure to achieve
certification
under
the
Health
Information
Technology
for
Economic
and
Clinical
Health
Act
could
result
in
increased
development
costs,
a
breach of some customer obligations and could put us at a competitive disadvantage in the
marketplace; the volume and timing of systems sales and installations, the impact
of the reorganization of our sales and services organization; the length of sales cycles and the
installation process and the possibility that our products will not achieve or sustain
market acceptance; the timing, cost and success or failure of new product and
service introductions, development and product upgrade releases; competitive pressures including product
offerings, pricing and promotional activities; our ability to establish and maintain
strategic relationships; undetected errors or similar problems in our software
products or other product quality issues; the outcome of any legal proceeding that has been or may be
instituted against us; compliance with existing laws, regulations and industry initiatives
and future changes in laws or regulations in the healthcare
industry,
including
possible
regulation
of
our
software
by
the
U.S.
Food
and
Drug
Administration;
the
possibility
of
product-
related
liabilities;
our
ability
to
attract
and
retain
qualified
personnel;
the implementation and speed of acceptance of the electronic
record provisions of the American Recovery and Reinvestment Act of 2009; maintaining our
intellectual property rights and litigation involving intellectual property rights;
risks related to third-party suppliers and our ability to obtain, use or successfully integrate third-
party licensed technology; and breach of our security by third parties. See our
Report on Form 10-K for the year ended December 31, 2011 and our subsequent
filings with the SEC for a further discussion of these and other risks and uncertainties applicable to our
business. The statements herein speak only as of their date and we undertake no duty to
update any forward-looking statement whether as a result of new information,
future events or changes in expectations.
A
Connected
Community
of
Health
|
Copyright
©
2012
Allscripts
Healthcare
Solutions,
Inc. |
 A
Connected Community of Health
™
OUR VISION
Allscripts is a leading provider
of Electronic Health Record, practice
management and other clinical,
revenue cycle, connectivity and
information solutions for physicians,
hospitals & post-acute organizations
3
A
Connected
Community
of
Health
|
Copyright
©
2012
Allscripts
Healthcare
Solutions,
Inc. |
 OUR
CLIENTS •
180,000 Physicians
•
50,000 Physician Practices
•
1,500 Hospitals
•
10,000 Post-acute Facilities
•
27,000 Clinicians In Patients
Homes Every Day
OUR COMPANY
•
~$1.444BB 2011 Revenue
•
6,700 Employees
•
~$190MM 2012 R&D
1
Run Rate
•
Leader in Innovation
•
1 Complete Set of Solutions
Allscripts: Who We Are
4
1
Total research and development costs before software capitalization.
A
Connected
Community
of
Health
|
Copyright
©
2012
Allscripts
Healthcare
Solutions,
Inc. |
 5
Investment Highlights
MARKET LEADER
•
Diverse, industry-leading client base
COMPLETE PRODUCT
PORTFOLIO
•
Flexible, modern and complete solutions
•
Maximizes opportunities to expand market and wallet share
DYNAMIC GROWTH
MARKET
•
$30BB Federal stimulus program drives healthcare IT adoption
•
Low penetration of clinical solutions
•
Shift to value-based care drives strong long-term secular demand trends
OPERATING LEVERAGE
•
Proven and scalable platform for sales growth
•
Legacy of product innovation
•
Industry-leading brand awareness
HIGH QUALITY
FINANCIAL MODEL
•
Strong visibility with $2.9BB revenue backlog as of 3/31/12
•
~69% recurring revenue in Q1 2012
•
Strong free cash flow
A
Connected
Community
of
Health
|
Copyright
©
2012
Allscripts
Healthcare
Solutions,
Inc. |
 Agenda
6
MARKET
DIFFERENTIATION
GROWTH
A
Connected
Community
of
Health
|
Copyright
©
2012
Allscripts
Healthcare
Solutions,
Inc. |
 7
MARKET
DIFFERENTIATION
GROWTH
A
Connected
Community
of
Health
|
Copyright
©
2012
Allscripts
Healthcare
Solutions,
Inc. |
 A
National Problem
A Market
that is Ready
A Significant
Opportunity
•
Quality Issues
•
Medical Errors /
Safety Concerns
•
Rising Cost
•
Significant Waste
•
$43BB
1
Opportunity
•
$30BB in Stimulus
Funding
•
~35% Penetration
in Physician
Practices
•
Rise in Employed
Physicians
•
Hospitals Driving
Adoption
•
We are at the
beginning
of what
we expect will be
the single fastest
transformation of
any industry in US
history
8
Market: The Time is NOW
1. McKinsey & Company
A
Connected
Community
of
Health
|
Copyright
©
2012
Allscripts
Healthcare
Solutions,
Inc. |
 Market:
Unsustainable Trend Requiring Change 9
VOLUME
•Fragmented providers
and payments
•No uniform quality
•Fees for volume
•Demand increasing
VALUE
•Collaboration,
connectivity
•Clinical, financial data,
analysis
•Optimize outcomes
•Accountable care
Source: HFMA “Value in Healthcare: Current State & Future Directions June
2011” A
Connected
Community
of
Health
|
Copyright
©
2012
Allscripts
Healthcare
Solutions,
Inc. |
 Market:
MDRX Addresses the Entire Market Opportunity 10
Acute/Ambulatory EHR Opportunity 2010-2014 = ~$43BB
Source: McKinsey & Company
$45
$40
$35
$30
$25
$20
$15
$10
$5
$0
$16BB
$10BB
$17BB
•
Ambulatory
Stand-Alone
Opportunity
•
Acute
Stand-Alone
Opportunity
STAND-ALONE
MARKET
INTEGRATED
MARKET
•
Integrated/Complete
Solution Across
Hospitals and
Physician Practices
A
Connected
Community
of
Health
|
Copyright
©
2012
Allscripts
Healthcare
Solutions,
Inc. |
 11
Market: Significant Ambulatory Potential
PRACTICE SIZE
TOTAL # OF PRACTICES
EHR PENETRATION (July ‘11)
1-3 Physicians
~186,000
~30%
4-9 Physicians
~28,000
~50%
10-25 Physicians
~6,900
~70%
26+ Physicians
~1,750
~85%
Total
226,650
~35%
Source: SK&A Information Services
A
Connected
Community
of
Health
|
Copyright
©
2012
Allscripts
Healthcare
Solutions,
Inc. |
 Market:
Acute Care Growth Drivers 12
Source: HIMSS Analytics EMR Adoption Model, July 2011
LEGACY
REPLACEMENT
CYCLE
UNDER-
UTILIZATION
•
Obsolete mainframe systems
•
Integrate acute/ambulatory
systems
•
Care coordination
•
Only ~20%* of hospitals at
HIMSS Stage 4 adoption or higher
•
Only 1%* at HIMSS Stage 7
HOSPITALS/HEALTH SYSTEMS
A
Connected
Community
of
Health
|
Copyright
©
2012
Allscripts
Healthcare
Solutions,
Inc. |
 13
MARKET
DIFFERENTIATION
GROWTH
A
Connected
Community
of
Health
|
Copyright
©
2012
Allscripts
Healthcare
Solutions,
Inc. |
 Differentiation: Leading Footprint Across the Market
14
(48% Rev)
1 of 3
MDs
1 of 3
Hospitals
(43% Rev)
10,000
Post-acute
Care Providers
(9% Rev)
Source:
Percentages
determined
based
on
GAAP
revenues
included
in
Allscripts’
Annual
Report
on
Form
10-K
for
the
year
ended
December
31,
2011.
A
Connected
Community
of
Health
|
Copyright
©
2012
Allscripts
Healthcare
Solutions,
Inc. |
 Differentiation: Open and Connected Portfolio
15
A
Connected
Community
of
Health
|
Copyright
©
2012
Allscripts
Healthcare
Solutions,
Inc. |
 Differentiation: The Challenge to Deliver Meaningful Care
16
Stage
1:
Application
Stage
2:
Connection
Stage
3:
Information
Stage
4:
Insights
Stage
5:
Outcomes
TIME
LEVEL OF
IMPACT
(Quality, Cost)
A
Connected
Community
of
Health
|
Copyright
©
2012
Allscripts
Healthcare
Solutions,
Inc. |
 Differentiation: The New Architecture of Healthcare
17
Old World
(Monolithic/Closed
Mainframe)
New World
(Modern/Open Platform)
Connect Inside
Connect Inside and
Outside
A
Connected
Community
of
Health
|
Copyright
©
2012
Allscripts
Healthcare
Solutions,
Inc. |
 •
Key stakeholders across
the community (Allscripts
Referral Network,
Allscripts Community)
•
All points of care and
all applications within
their organization
18
Differentiation: Allscripts Approach
A
Connected
Community
of
Health
|
Copyright
©
2012
Allscripts
Healthcare
Solutions,
Inc. |
 “Clinical outcomes is the name of the game
in ACOs. This is an area where we believe
Allscripts holds a market lead, and needs
to continue to focus on delivering more
integrated outcomes modules for its
client base.”
THE ADVISORY BOARD COMPANY (APRIL 2011, “A PERSPECTIVE ON THE COMPANY”)
Differentiation: Clinical Outcomes Experience and Focus
19
A
Connected
Community
of
Health
|
Copyright
©
2012
Allscripts
Healthcare
Solutions,
Inc. |
          Differentiation: Deliver Solutions in a Value-Based Care
Environment
20
Performance
Management
Solutions
Care Management
Solutions
Community
Solutions
Analytics
Care Coordination
Connectivity
A
Connected
Community
of
Health
|
Copyright
©
2012
Allscripts
Healthcare
Solutions,
Inc. |
 Differentiation: Innovative Solutions
21
Mobile Platforms
Accelerate Adoption
A
Connected
Community
of
Health
|
Copyright
©
2012
Allscripts
Healthcare
Solutions,
Inc. |
 22
MARKET
DIFFERENTIATION
GROWTH
A
Connected
Community
of
Health
|
Copyright
©
2012
Allscripts
Healthcare
Solutions,
Inc. |
 Growth:
Long-Term Focus 23
1. Annual revenue for Allscripts illustrated above is based on a
GAAP presentation and is calenderized based on quarterly results. Please note Allscripts
changed its fiscal year-end to
May between the period of September, 2008 and May, 2010. GAAP revenue also includes the
impact of acquisitions and divestitures. 2. Mid-range of 2012 revenue guidance
provided by Allscripts on April 26, 2012. This document does not subsequently
update or reaffirm prior financial guidance. ALLSCRIPTS REVENUE
1
2007 -
2012E
A
Connected
Community
of
Health
|
Copyright
©
2012
Allscripts
Healthcare
Solutions,
Inc. |
 Ambulatory
58%/
Acute
42%
•
Non-GAAP
Revenue
CY 2010:
$1,300MM
Growth: Historical Performance
24
Note: Please see the Non-GAAP reconciliation and related footnotes in the appendix to
this presentation. tp://investor.allscripts.com
CY2010
CY2011
Non-GAAP Operating Income
($millions)
Ambulatory
48%/
Acute
52%
•
Non-GAAP
Revenue
CY 2011
1
:
$1,465MM
$298
$300
$250
$200
$150
$100
$50
0
$250
1.
Percentages
determined
based
on
GAAP
revenues
included
in
Allscripts’
Annual
Report
on
Form
10-K
for
the
year
ended
December
31,
2011.
A
Connected
Community
of
Health
|
Copyright
©
2012
Allscripts
Healthcare
Solutions,
Inc. |
 Growth:
Distribution Outpaces the Competition 25
~170
Field sales
reps
Hospital Community
Partners
Payers
~75
Internal sales reps
All Providers
~125
Value-added Resellers
(>1,000 representatives)
A
Connected
Community
of
Health
|
Copyright
©
2012
Allscripts
Healthcare
Solutions,
Inc. |
 Growth:
Cost Synergy Opportunities 26
Projected Cost Synergies Over Three Years
•
Duplicative management
structure
•
Duplicative public company
costs
•
Duplicative back-end office
and system integration
•
Marketing
CY2011
CY2012
CY2013 &
Beyond
~$25MM
~$35MM
~$40MM
Key Cost
Synergy Drivers
A
Connected
Community
of
Health
|
Copyright
©
2012
Allscripts
Healthcare
Solutions,
Inc. |
 Growth:
Significant Client Sales Opportunity 27
INCREMENTAL REVENUES
~$430MM + ~$820MM = ~$1,250MM
Sell Acute
Solutions to
Ambulatory
Care Base
Sell
Ambulatory
Solutions to
Acute Care
Base
A
Connected
Community
of
Health
|
Copyright
©
2012
Allscripts
Healthcare
Solutions,
Inc. |
 28
Business Update
•
Q1 Results
•
Bookings $194.6MM
•
Three new Sunrise Clinical Manager sales
•
Non-GAAP revenue growth 6%
•
Non-GAAP operating profit margin 11.2%
•
Non-GAAP EPS $0.12
•
Cash Flow From Operations $74.6MM
•
Factors Impacting Results
•
Lower Q1 sales
•
Unfavorable revenue mix
•
Investments in R&D & lower capitalized software:
o
Gross R&D +29% year/year
o
Software Capitalization 27% in Q1 2012 vs. 40% in Q1 2011
Note: Please see the Non-GAAP reconciliation and related footnotes in the appendix to
this presentation. tp://investor.allscripts.com
A
Connected
Community
of
Health
|
Copyright
©
2012
Allscripts
Healthcare
Solutions,
Inc. |
 Product
Delivery •
$190MM 2012 gross R&D spend
•
New product releases
•
Innovation
Client Experience
•
Added 400 support FTEs
•
$30MM invested in solutions hosting
•
Improve key metrics tied to client
experience
Sales Execution
•
Sales/service integration
•
Single corporate leadership
•
Single client team
•
Increase pipeline size, velocity
Financial Performance
•
Further enhance operational efficiency
•
Expanded share repurchase plan to
$400MM
•
Completed majority of hiring for 2012
Four Point Plan
29
A
Connected
Community
of
Health
|
Copyright
©
2012
Allscripts
Healthcare
Solutions,
Inc. |
 30
Non-GAAP Financial Outlook
CY 2011 ACTUAL
CY 2012
1
NON-GAAP
REVENUE
$1,465
$1,480-$1,520
NON-GAAP
OPERATING MARGIN
20%
16-17%
NON-GAAP
NET INCOME
$176
$143-$154
NON-GAAP
DILUTED EPS
$0.92
$0.74-$0.80
($ in millions; except per share amounts)
Note: Guidance provided by the company in a press release on April 26, 2012. This presentation does not subsequently update or reaffirm Allscripts financial guidance. Please see
the Non-GAAP reconciliation and related footnotes in the appendix to this
presentation. tp://investor.allscripts.com
A
Connected
Community
of
Health
|
Copyright
©
2012
Allscripts
Healthcare
Solutions,
Inc. |
 Utilize
Strong Cash Flow to Enhance Value 31
CAPITALIZATION
ACTUAL
3/31/2012
$ in millions
Cash and Marketable Securities
$177
Revolver ($250mm)
0
Term Loan
343
Total Debt
$343
Equity
1,490
Total Capitalization
$1,833
Credit Statistics
LTM EBITDA
(1)
$311
Total Debt / LTM EBITDA
(1)
1.1x
Debt / Capitalization
18.7%
•
Reduced debt by $227MM since merger
closed (8/10)
•
Minimum required principal payments
over next 12 months totals $48MM
•
Current borrowing cost <3%
•
$200MM, 3-year share repurchase
program instituted in the second quarter
of 2011
•
Expanded program to $400MM on
4/30/2012
•
$348MM remains for repurchase as of
4/30/2012
Note: Please see the Non-GAAP reconciliation and related footnotes in the
appendix to this presentation. tp://investor.allscripts.com
A
Connected
Community
of
Health
|
Copyright
©
2012
Allscripts
Healthcare
Solutions,
Inc.
1. EBITDA is calculated as net income plus income tax expense, interest expense,
stock-based compensation expense, depreciation & amortization, deferred revenue adjustments, certain
one-time and transaction-related expenses, and non-recurring losses on the
sale of investments minus non-recurring gains on the sale of assets, consistent with the calculation as defined in
the Company’s Senior Credit Facilities agreement. |
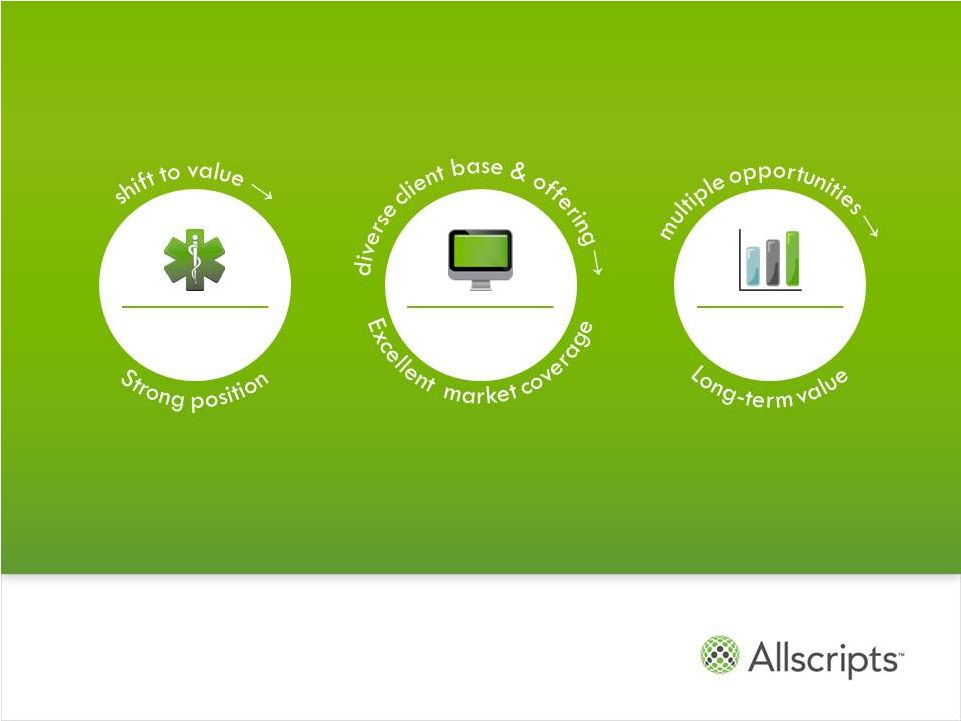 32
In Summary….
MARKET
DIFFERENTIATION
GROWTH
A
Connected
Community
of
Health
|
Copyright
©
2012
Allscripts
Healthcare
Solutions,
Inc. |
    33
Allscripts Investor
Presentation
MAY 2012 |
 Appendix:
Non-GAAP Reconciliations 34
Slide and Financial Measure
GAAP-Non-GAAP
Reconciliation
Slide 24: 2010 Non-GAAP Revenue, Operating Income
Slide 35, 36
Slide 24: 2011 Non-GAAP Revenue, Operating Income
Slide 38
Slide 29: Q1 2012 Non-GAAP Revenue, Operating
Income Margin and Diluted Earnings Per Share
Slide 37
Slide 31: 2011 Non-GAAP Revenue, Operating
Income, and Diluted Earnings Per Share
Slide 38
Slide 32: Trailing Twelve Months EBITDA
Slide 39
A
Connected
Community
of
Health
|
Copyright
©
2012
Allscripts
Healthcare
Solutions,
Inc. |
 35
Appendix: Non-GAAP Reconciliation
•
GAAP
–
non-GAAP
revenue
and
net
income
reconciliation
for
the
twelve
months
ended
December 31, 2010
Three Months
Ended
Twelve Months
Ended
12/31/2010
12/31/2010
Allscripts
Eclipsys
Q1 2010
Allscripts
Eclipsys
Q2 2010
Allscripts
Eclipsys
Additional
Int Exp(a)
Q3 2010
Q4 2010
CY 2010
Total revenue, as reported
$184.4
$128.4
$312.8
$191.4
$134.4
$325.8
$191.2
$51.2
$0.0
$242.4
$316.2
$1,197.2
Deferred revenue adjustment
0.5
0.0
0.5
0.6
0.0
0.6
0.5
6.7
0.0
7.2
20.9
29.2
Eclipsys results pre-merger period
(7/1/10-8/23/10) 0.0
0.0
0.0
0.0
0.0
0.0
0.0
79.5
0.0
79.5
0.0
79.5
Total non-GAAP revenue
$184.9
$128.4
$313.3
$192.0
$134.4
$326.4
$191.7
$137.4
$0.0
$329.1
$337.1
$1,305.9
Net income, as reported
$18.6
$5.4
$24.0
$13.1
$1.6
$14.7
$5.4
($4.0)
$0.0
$1.4
($6.2)
$33.9
Deferred revenue adjustment
0.3
0.0
0.3
0.3
0.0
0.3
0.3
4.0
0.0
4.3
12.7
17.6
Acquisition-related amortization
3.4
1.9
5.3
3.5
1.8
5.3
3.4
3.0
0.0
6.4
10.6
27.6
Stock-based compensation expense
2.4
3.4
5.8
1.8
2.9
4.7
4.0
0.0
0.0
4.0
2.3
16.8
Transaction-related expense
0.1
0.0
0.1
7.7
2.0
9.7
16.0
5.5
(1.9)
19.6
10.9
40.3
ARS Sales
0.0
0.0
0.0
0.0
0.9
0.9
0.0
0.0
0.0
0.0
0.0
0.9
Tax rate alignment
0.7
0.0
0.7
(0.2)
0.0
(0.2)
(1.6)
(0.2)
0.0
(1.8)
8.4
7.1
Eclipsys results pre-merger period
(7/1/10-8/23/10) 0.0
0.0
0.0
0.0
0.0
0.0
0.0
2.9
0.0
2.9
0.0
2.9
Non-GAAP net income
$25.5
$10.7
$36.2
$26.2
$9.2
$35.4
$27.5
$11.2
($1.9)
$36.8
$38.7
$147.1
(a) Transaction-related expenses are fees and expenses, including
legal, investment banking and accounting fees and other
integration-related expenses, incurred in connection with announced
transactions. 3/31/10
6/30/10
9/30/2010
Allscripts Healthcare Solutions, Inc.
Non-GAAP Financial Information - 2010 Financial
Information (In millions, except per-share amounts)
(unaudited)
Three Months Ended
Three Months Ended
Three Months Ended
A
Connected
Community
of
Health
|
Copyright
©
2012
Allscripts
Healthcare
Solutions,
Inc. |
 36
Appendix: Non-GAAP Reconciliation
•
GAAP –
non-GAAP operating income reconciliation by quarter and twelve months
ended December 31, 2010
Three Months
Ended
Twelve Months
Ended
12/31/2010
12/31/2010
Allscripts
Eclipsys
Q1 2010
Allscripts
Eclipsys
Q2 2010
Allscripts
Eclipsys
Additional
Int Exp(a)
Q3 2010
Q4 2010
CY 2010
Operating income, as reported
$32.0
$10.7
$42.7
$20.5
$5.4
$25.9
$6.0
($7.2)
$0.0
($1.2)
$9.5
$76.9
Deferred revenue adjustment
0.5
0.0
0.5
0.6
0.0
0.6
0.5
6.7
0.0
7.2
20.9
29.2
Acquisition-related amortization
5.6
3.1
8.7
5.6
3.1
8.7
5.6
4.9
0.0
10.5
17.4
45.3
Stock-based compensation expense
3.9
3.7
7.6
2.9
3.7
6.6
6.6
0.0
0.0
6.6
3.7
24.5
Transaction-related expense (a)
0.2
0.0
0.2
12.5
3.5
16.0
26.1
9.1
0.0
35.2
17.8
69.2
Eclipsys results pre-merger period
(7/1/10-8/23/10) 0.0
0.0
0.0
0.0
0.0
0.0
0.0
4.7
0.0
4.7
0.0
4.7
Total non-GAAP operating income
$42.2
$17.5
$59.7
$42.1
$15.7
$57.8
$44.8
$18.2
$0.0
$63.0
$69.3
$249.8
Allscripts Healthcare Solutions, Inc.
Non-GAAP Financial Information - 2010 Financial
Information (In millions, except per-share amounts)
(unaudited)
Three Months Ended
Three Months Ended
Three Months Ended
(a) Transaction-related expenses are fees and expenses, including
legal, investment banking and accounting fees and other
integration-related expenses, incurred in connection with announced transactions.
3/31/10
6/30/10
9/30/2010
A
Connected
Community
of
Health
|
Copyright
©
2012
Allscripts
Healthcare
Solutions,
Inc. |
 37
Appendix: Non-GAAP Reconciliation
•
GAAP –
non-GAAP Revenue, operating income margin and net income reconciliation for the three
months ended March 31, 2012
Allscripts Healthcare Solutions, Inc.
Condensed Non-GAAP Financial Information
(In millions, except per-share amounts)
(Unaudited)
A
Connected
Community
of
Health
|
Copyright
©
2012
Allscripts
Healthcare
Solutions,
Inc. |
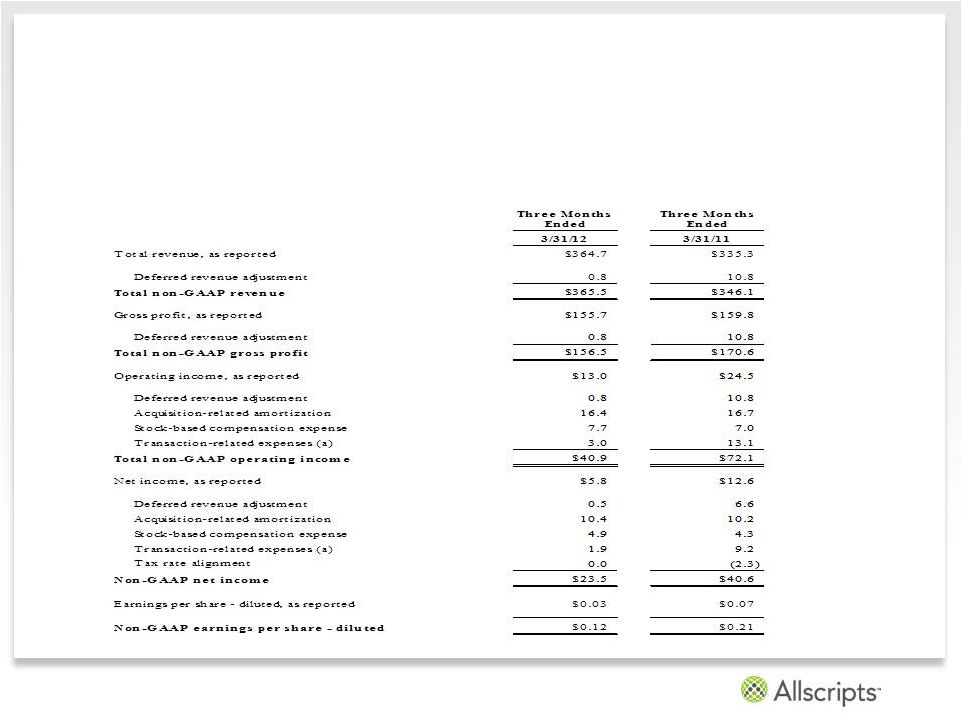
 38
Appendix: Non-GAAP Reconciliation
•
GAAP –
non-GAAP revenue, operating income, net income and diluted earnings per share
reconciliation for the twelve months ended December 31, 2011
Allscripts Healthcare Solutions, Inc.
Non-GAAP Financial Information - 2011 Non-GAAP Financial
Information (In millions, except per-share amounts)
(unaudited)
Three Months
Ended
Three Months
Ended
Three Months
Ended
Three Months
Ended
3/31/11
6/30/11
9/30/11
12/31/2011
CY 2011
Total revenue, as reported
$335.3
$356.8
$363.7
$388.2
$1,444.1
Deferred revenue adjustment
10.8
6.7
2.6
1.0
21.1
Total non-GAAP revenue
$346.1
$363.5
$366.3
$389.2
$1,465.2
Operating income, as reported
$24.5
$32.1
$34.4
$45.6
$136.5
Deferred revenue adjustment
10.8
6.7
2.6
1.0
21.1
Acquisition-related amortization
16.7
16.6
16.6
16.5
66.4
Stock-based compensation expense
7.0
8.9
9.9
11.6
37.4
Transaction-related expenses
13.1
10.2
8.8
4.0
36.1
Total non-GAAP operating income
$72.1
$74.5
$72.3
$78.6
$297.5
Net income, as reported
$12.6
$15.9
$19.1
$26.0
$73.6
Deferred revenue adjustment
6.6
4.1
1.7
0.6
13.0
Acquisition-related amortization
10.2
10.1
11.0
10.5
41.7
Stock-based compensation expense
4.3
5.4
6.5
7.4
23.6
Transaction-related expenses
9.2
6.2
5.8
2.5
23.7
Tax rate alignment
(2.3)
0.8
1.1
0.7
0.3
Non-GAAP net income
$40.6
$42.5
$45.2
$47.6
$175.9
Tax Rate
39%
39%
34%
36%
37%
192.6
193.2
191.5
192.3
191.0
$0.06
$0.08
$0.10
$0.14
$0.39
$0.21
$0.22
$0.24
$0.25
$0.92
Non-GAAP earnings per share - diluted
Weighted shares outstanding - diluted
Earnings
per share - diluted A
Connected
Community
of
Health
|
Copyright
©
2012
Allscripts
Healthcare
Solutions,
Inc. |
 39
Appendix: Non-GAAP Reconciliation
•
GAAP –
non-GAAP EBITDA reconciliation for the year ended March 31, 2012
EBITDA Calculation ($ in thousands)
For the 12 months ended
3/31/12
Net income, as reported
$66.8
Income tax expense
43.2
Stock-based compensation expense
39.7
Depreciation and Amortization
131.5
Interest expense
16.7
Transaction-related expenses
1.9
Deferred revenue adjustment
11.1
Gain on Sale of Assets
(0.3)
Earnings before interest, taxes, depreciation and amortization
$310.6
Allscripts Healthcare Solutions, Inc.
Condensed Non-GAAP Financial Information
(In millions, except per-share amounts)
(Unaudited)
A
Connected
Community
of
Health
|
Copyright
©
2012
Allscripts
Healthcare
Solutions,
Inc. |
 40
Footnotes Regarding Financial Guidance
Financial guidance was last provided by the company in a press release on April 26,
2012. This presentation does not subsequently update or reaffirm Allscripts
financial guidance. Allscripts non-GAAP guidance for calendar year 2012 assumes
the following adjustments to GAAP revenue, operating and net income: an
acquisition-related deferred revenue adjustment of approximately $2.1 million; approximately $63.0 million of acquisition-related
amortization; approximately $44.0 million in stock-based compensation expense; and
approximately $4.0 million in transaction-related expenses, all on a
pre-tax basis. A
Connected
Community
of
Health
|
Copyright
©
2012
Allscripts
Healthcare
Solutions,
Inc. |
 41
Explanation of Non-GAAP Financial Measures
Allscripts reports its financial results in accordance with generally accepted accounting
principles, or GAAP. To supplement this information, Allscripts presents in this
release non-GAAP revenue, gross profit, operating income and net income, including non-GAAP net income on a per share basis,
which are non-GAAP financial measures under Section 101 of Regulation G under the
Securities Exchange Act of 1934, as amended. Non-GAAP revenue consists of GAAP
revenue as reported and adds back the acquisition-related deferred revenue adjustment booked for GAAP purposes.
Non-GAAP gross profit consists of GAAP gross profit as reported and adds back the
acquisition-related deferred revenue adjustment booked for GAAP purposes.
Non-GAAP operating income consists of GAAP operating income as reported and adds back the acquisition-related deferred
revenue adjustment booked for GAAP purposes and excludes acquisition-related
amortization, stock-based compensation expense, transaction- related and
non-recurring expenses. Non-GAAP net income consists of GAAP net income as reported, excludes acquisition-related amortization,
stock-based compensation expense and transaction-related and non-recurring
expenses, and adds back the acquisition-related deferred revenue, in each case
net of any related tax effects. Non-GAAP net income also includes a tax rate alignment adjustment.
Management also believes that non-GAAP revenue, gross profit, operating income and net
income and non-GAAP net income on a per share basis provide useful supplemental
information to management and investors regarding the underlying performance of the Company's business operations
and facilitates comparisons of the separate 2010 pre-merger results of legacy
Allscripts and legacy Eclipsys to that of the Company's 2010 post- merger
results. Acquisition accounting adjustments made in accordance with GAAP can make it difficult to make meaningful comparisons of the
underlying operations of the business without considering the non-GAAP adjustments
that we have provided and discussed herein. Management also uses this information
internally for forecasting and budgeting as it believes that these measures are indicative of the Company's core operating
results. In addition, the Company uses non-GAAP revenue, operating income and/or net
income to measure achievement under the Company's stock and cash incentive
compensation plans. Note, however, that non-GAAP revenue, gross profit, operating income and net income and non-GAAP net
income on a per share basis are performance measures only, and they do not provide any
measure of the Company's cash flow or liquidity. Non- GAAP financial measures
are not in accordance with, or an alternative for, measures of financial performance prepared in accordance with GAAP
and may be different from non-GAAP measures used by other companies. Non-GAAP
measures have limitations in that they do not reflect all of the amounts associated
with Allscripts results of operations as determined in accordance with GAAP. Investors and potential investors are encouraged
to review the reconciliation of non-GAAP financial measures with GAAP financial
measures contained within the attached condensed consolidated financial
statements. A
Connected
Community
of
Health
|
Copyright
©
2012
Allscripts
Healthcare
Solutions,
Inc. |
    42
Allscripts Investor
Presentation
MAY 2012 |