Attached files
| file | filename |
|---|---|
| 8-K - WESTFIELD FINANCIAL, INC. 8-K - Western New England Bancorp, Inc. | a50267492.htm |
Exhibit 99.1

WESTFIELD FINANCIAL INC. NASDAQ: WFD STIFEL NICOLAUS CAPITAL MARKETS SOUTHWEST MASSACHUSETTS & NORTHERN CONNECTICUT CLIENT MEETINGS MAY 7, 2012

FORWARD – LOOKING STATEMENTS Today’s presentation may contain “forward-looking statements” which may be identified by the use of such words as “believe,” “expect,” “anticipate,” “should,” “planned,” “estimated,” and “potential.” Examples of forward-looking statements include, but are not limited to, estimates with respect to our financial condition and results of operation and business that are subject to various factors which could cause actual results to differ materially from these estimates. These factors include, but are not limited to: general and local economic conditions; changes in interest rates, deposit flows, demand for mortgages and other loans, real estate values, and competition; changes in accounting principles, policies, or guidelines; changes in legislation or regulation; and other economic, competitive, governmental, regulatory, and technological factors affecting our operations, pricing, products, and services. Any or all of our forward-looking statements in today’s presentation or in any other public statements we make may turn out to be wrong. They can be affected by inaccurate assumptions we might make or known or unknown risks and uncertainties. Consequently, no forward-looking statements can be guaranteed. We disclaim any obligation to subsequently revise any forward-looking statements to reflect events or circumstances after the date of such statements, or to reflect the occurrence of anticipated or unanticipated events.
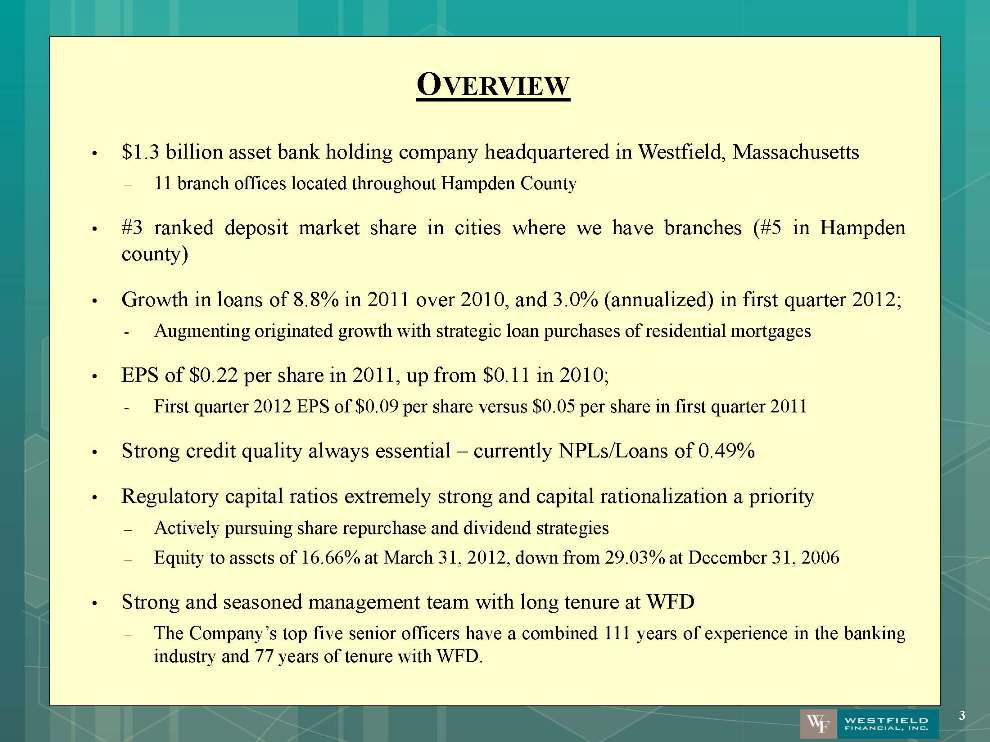
OVERVIEW $1.3 billion asset bank holding company headquartered in Westfield, Massachusetts –11 branch offices located throughout Hampden County #3 ranked deposit market share in cities where we have branches (#5 in Hampden county) rowth in loans of 8.8% in 2011 over 2010, and 3.0% (annualized) in first quarter 2012; -Augmenting originated growth with strategic loan purchases of residential mortgages EPS of $0.22 per share in 2011, up from $0.11 in 2010; -First quarter 2012 EPS of $0.09 per share versus $0.05 per share in first quarter 2011 Strong credit quality always essential – currently NPLs/Loans of 0.49% Regulatory capital ratios extremely strong and capital rationalization a priority –Actively pursuing share repurchase and dividend strategies –Equity to assets of 16.66% at March 31, 2012, down from 29.03% at December 31, 2006 Strong and seasoned management team with long tenure at WFD –The Company’s top five senior officers have a combined 111 years of experience in the banking industry and 77 years of tenure with WFD.
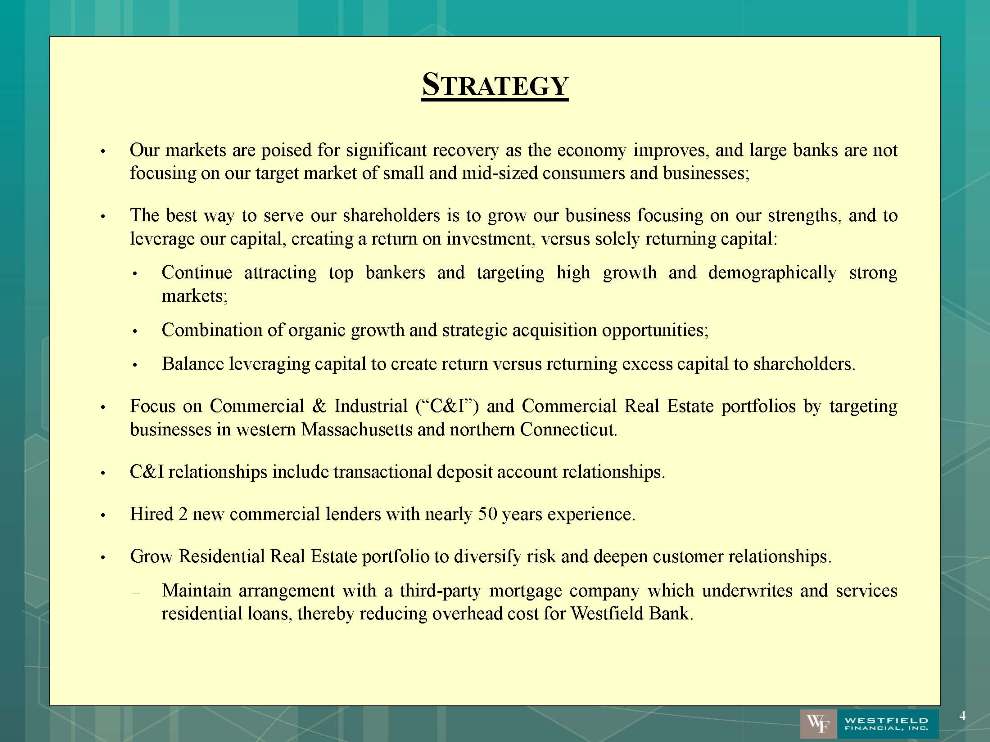
STRATEGY Our markets are poised for significant recovery as the economy improves, and large banks are not focusing on our target market of small and mid-sized consumers and businesses; The best way to serve our shareholders is to grow our business focusing on our strengths, and to leverage our capital, creating a return on investment, versus solely returning capital: Continue attracting top bankers and targeting high growth and demographically strong markets; Combination of organic growth and strategic acquisition opportunities; Balance leveraging capital to create return versus returning excess capital to shareholders. Focus on Commercial & Industrial (“C&I”) and Commercial Real Estate portfolios by targeting businesses in western Massachusetts and northern Connecticut. C&I relationships include transactional deposit account relationships. Hired 2 new commercial lenders with nearly 50 years experience. Grow Residential Real Estate portfolio to diversify risk and deepen customer relationships. –Maintain arrangement with a third-party mortgage company which underwrites and services residential loans, thereby reducing overhead cost for Westfield Bank.
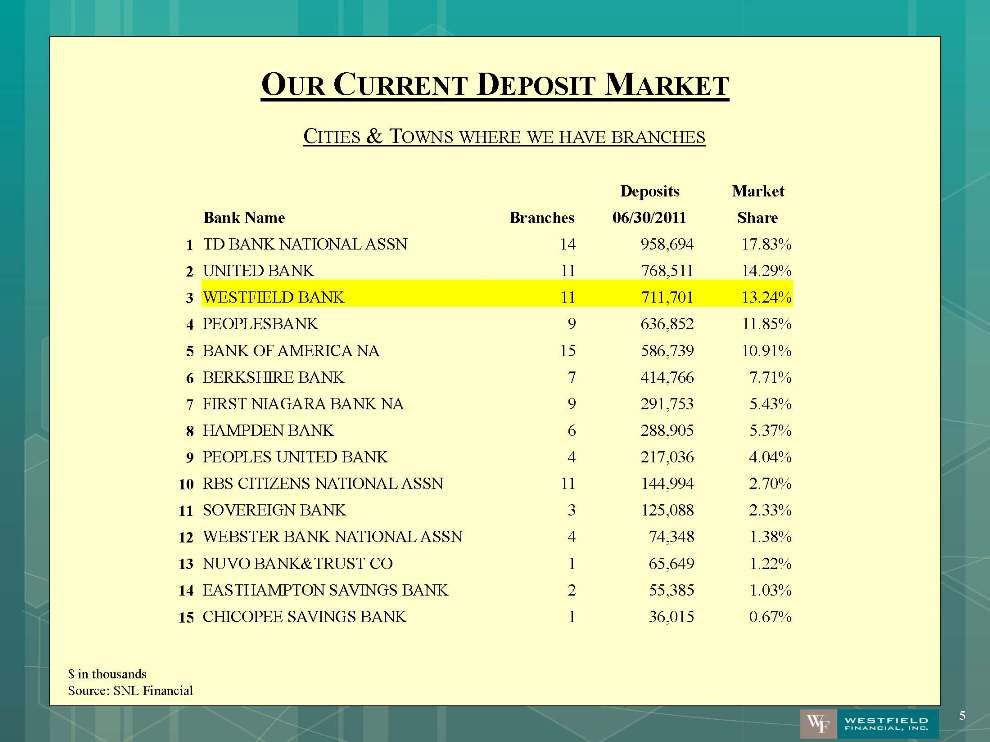
OUR CURRENT DEPOSIT MARKET CITIES & TOWNS WHERE WE HAVE BRANCHES $ in thousands Source: SNL Financial
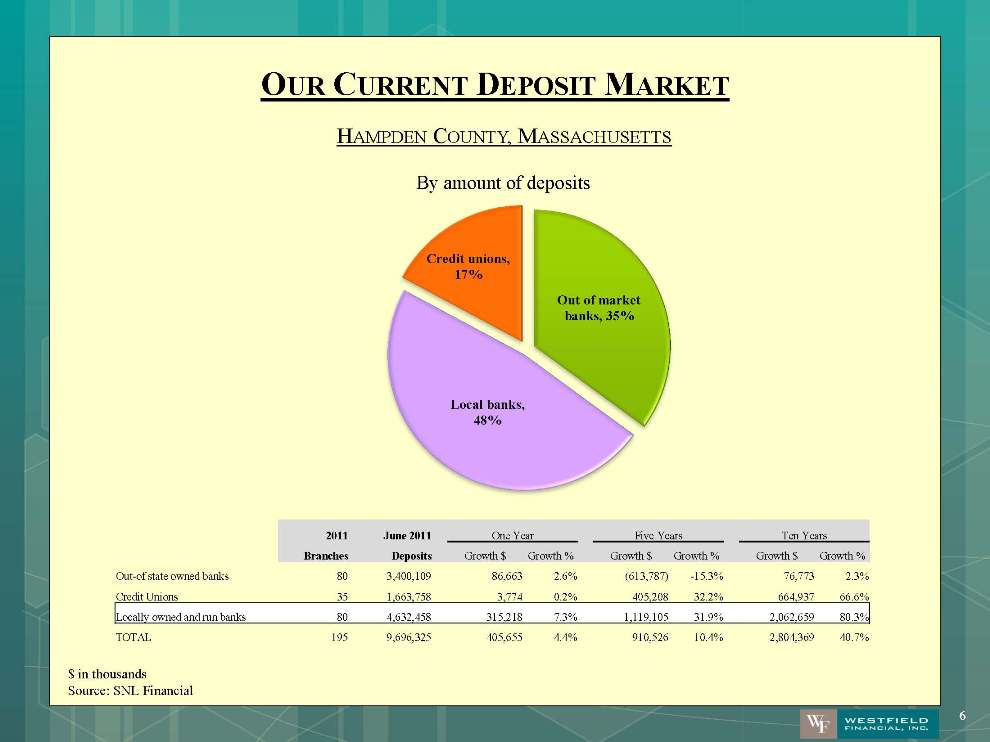
OUR CURRENT DEPOSIT MARKET HAMPDEN COUNTY, MASSACHUSETTS Out of market banks, 35% Local banks, 48% Credit unions, 17% By amount of deposits 2011 June 2011 One Year Five Years Ten Years Branches Deposits Growth $ Growth % Growth $ Growth % Growth $ Growth % Out-of state owned banks 80 3,400,109 86,663 2.6% (613,787) -15.3% 76,773 2.3% Credit Unions 35 1,663,758 3,774 0.2% 405,208 32.2% 664,937 66.6% Locally owned and run banks 80 4,632,458 315,218 7.3% 1,119,105 31.9% 2,062,659 80.3% TOTAL 195 9,696,325 405,655 4.4% 910,526 10.4% 2,804,369 40.7% $ in thousands Source: SNL Financial
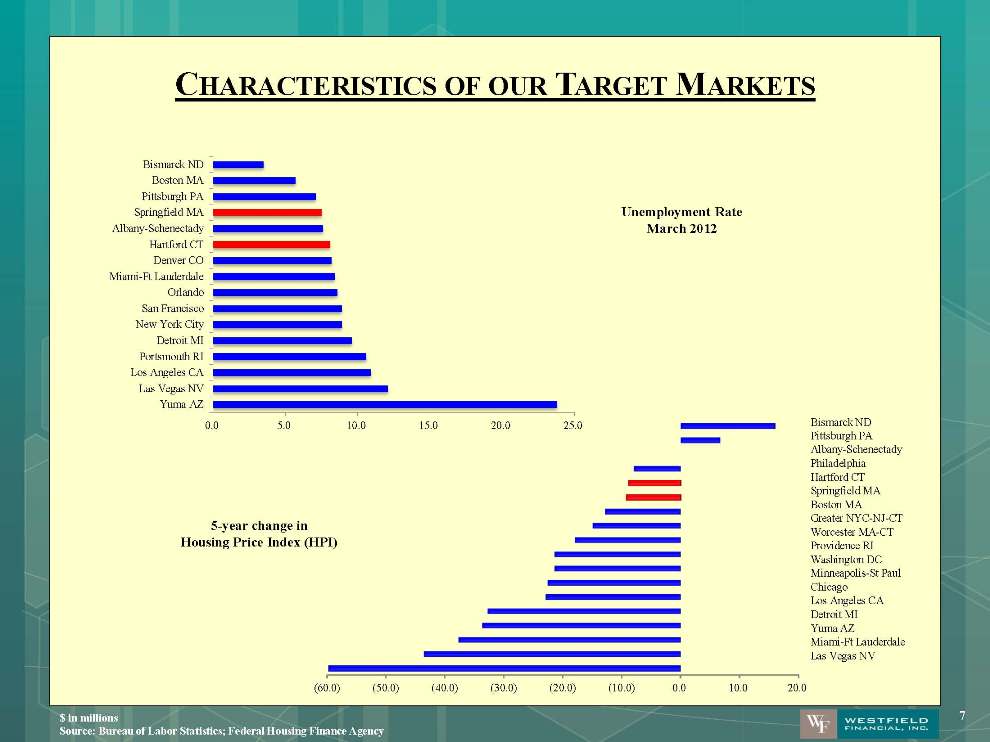
CHARACTERISTICS OF OUR TARGET MARKETS Unemployment Rate March 2012 (60.0) (50.0) (40.0) (30.0) (20.0) (10.0) 0.0 10.0 20.0 Bismarck ND Pittsburgh PA Albany-Schenectady Philadelphia Hartford CT Springfield MA Boston MA Greater NYC-NJ-CT Worcester MA-CT Providence RI Washington DC Minneapolis-St Paul Chicago Los Angeles CA Detroit MI Yuma AZ Miami-Ft Lauderdale Las Vegas NV 5-year change in Housing Price Index (HPI) 0.0 5.0 10.0 15.0 20.0 25.0 Yuma AZ Las Vegas NV Los Angeles CA Portsmouth RI Detroit MI New York City San Francisco Orlando Miami-Ft Lauderdale Denver CO Hartford CT Albany-Schenectady Springfield MA Pittsburgh PA Boston MA Bismarck ND $ in millions Source: Bureau of Labor Statistics; Federal Housing Finance Agency
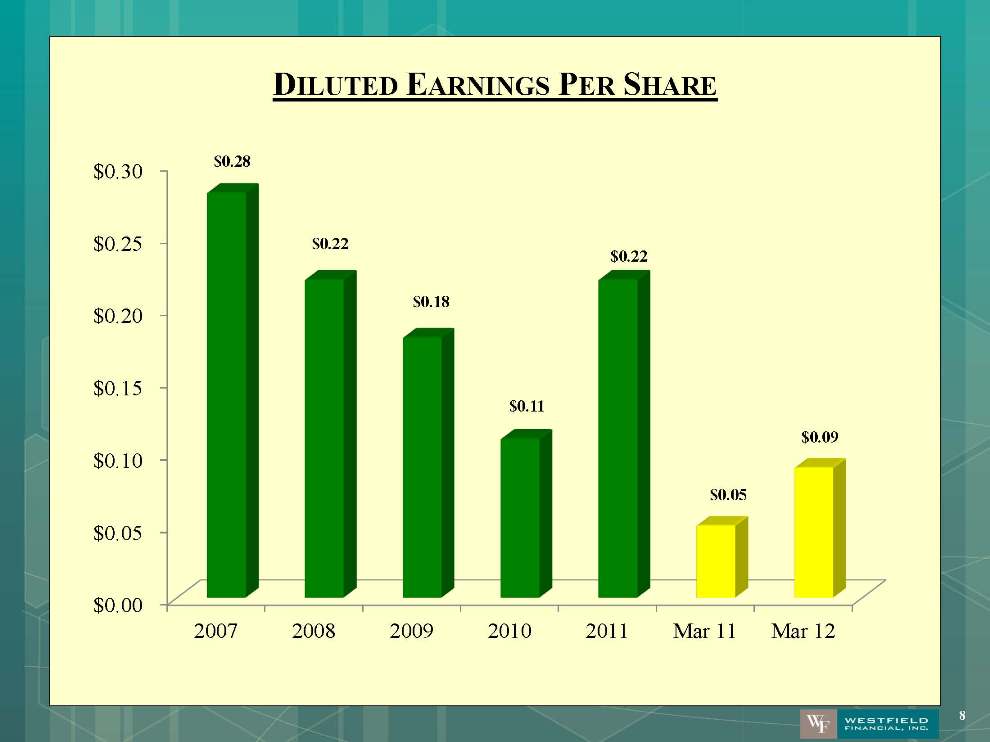
DILUTED EARNINGS PER SHARE $0.00 $0.05 $0.10 $0.15 $0.20 $0.25 $0.30 2007 2008 2009 2010 2011 Mar 11 Mar 12
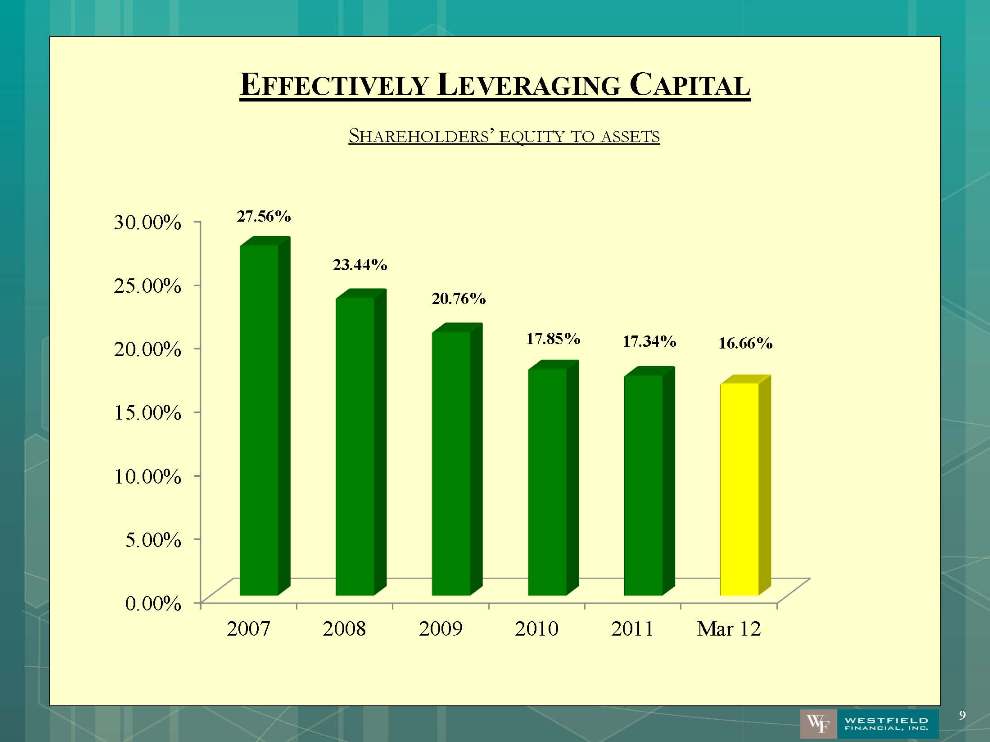
EFFECTIVELY LEVERAGING CAPITAL SHAREHOLDERS’ EQUITY TO ASSETS 0.00% 5.00% 10.00% 15.00% 20.00% 25.00% 30.00% 2007 2008 2009 2010 2011 Mar 12 27.56% 23.44% 20.76% 17.85% 17.34% 16.66%
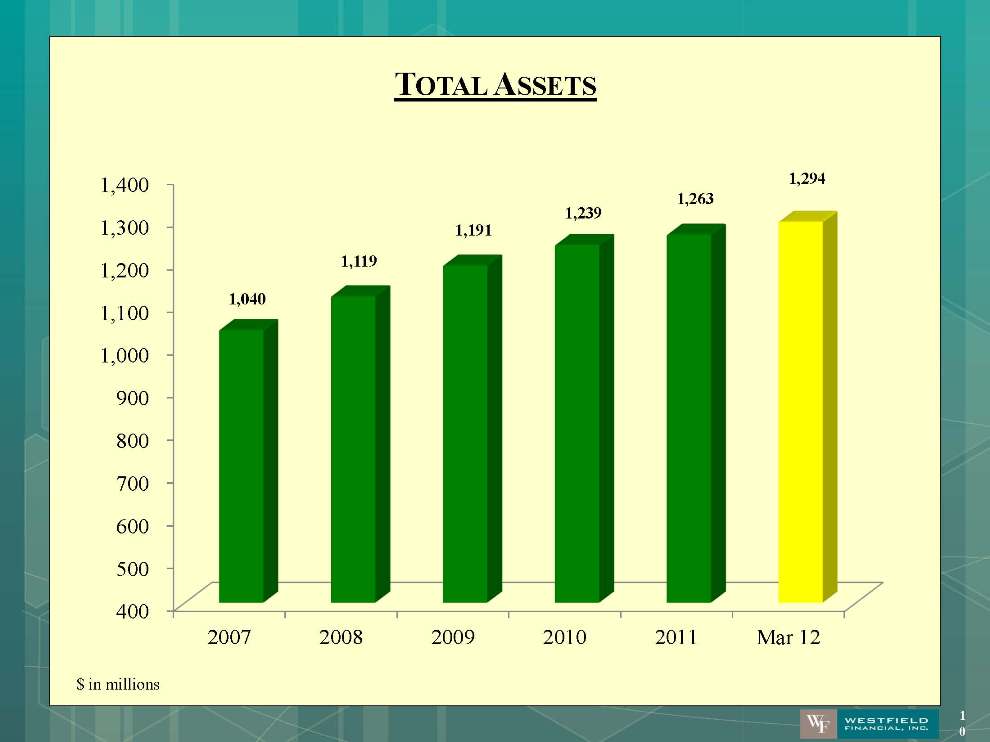
TOTAL ASSETS 400 500 600 700 800 900 1,000 1,100 1,200 1,300 1,400 2007 2008 2009 2010 2011 Mar 12 $ in millions
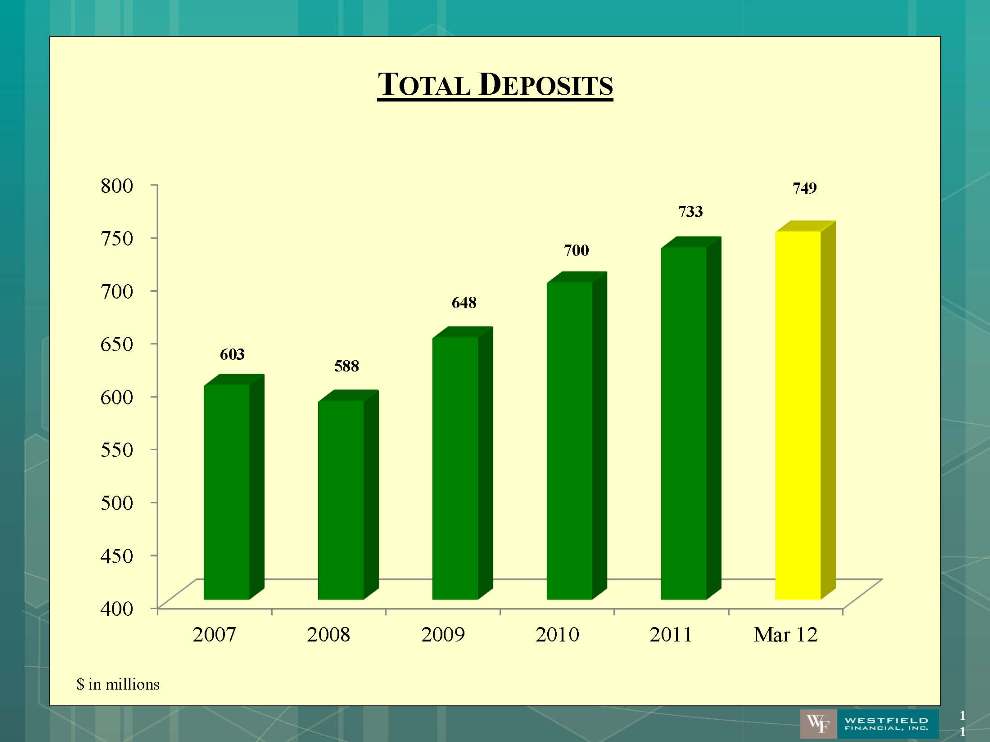
TOTAL DEPOSITS 400 450 500 550 600 650 700 750 800 2007 2008 2009 2010 2011 Mar 12 $ in millions
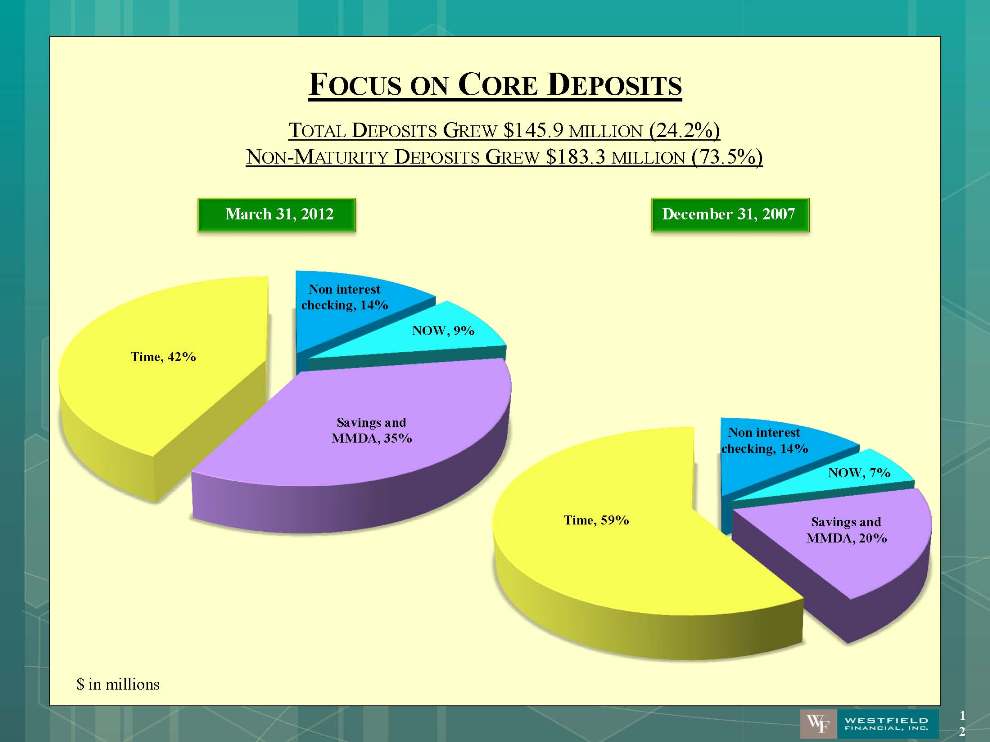
FOCUS ON CORE DEPOSITS TOTAL DEPOSITS GREW $145.9 MILLION (24.2%) NON-MATURITY DEPOSITS GREW $183.3 MILLION (73.5%) March 31, 2012 December 31, 2007 Non interest checking, 14% NOW, 9% Savings and MMDA, 35% Time, 42% Non interest checking, 14% NOW, 7% Savings and MMDA, 20% Time, 59% $ in millions
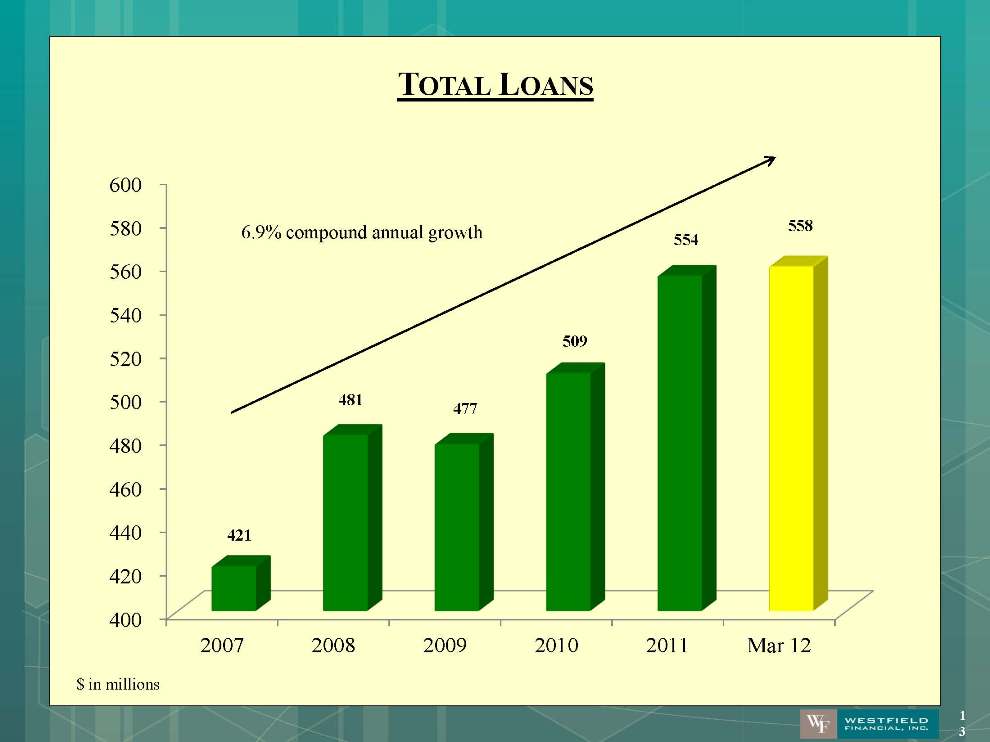
TOTAL LOANS 400 420 440 460 480 500 520 540 560 580 600 2007 2008 2009 2010 2011 Mar 12 421 481 477 509 554 558 6.9% compound annual growth $ in millions
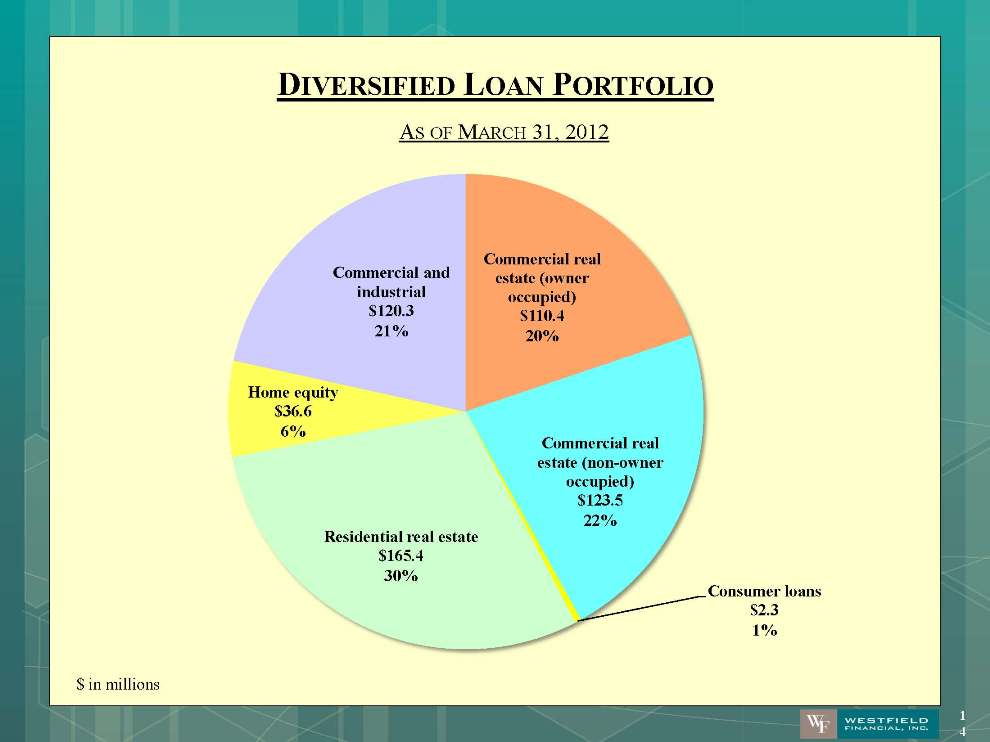
DIVERSIFIED LOAN PORTFOLIO AS OF MARCH 31, 2012 Commercial real estate (owner occupied) $110.4 20% Commercial real estate (non-owner occupied) $123.5 22% Consumer loans $2.3 1% Residential real estate $165.4 30% Home equity $36.6 6% Commercial and industrial $120.3 21% $ in millions
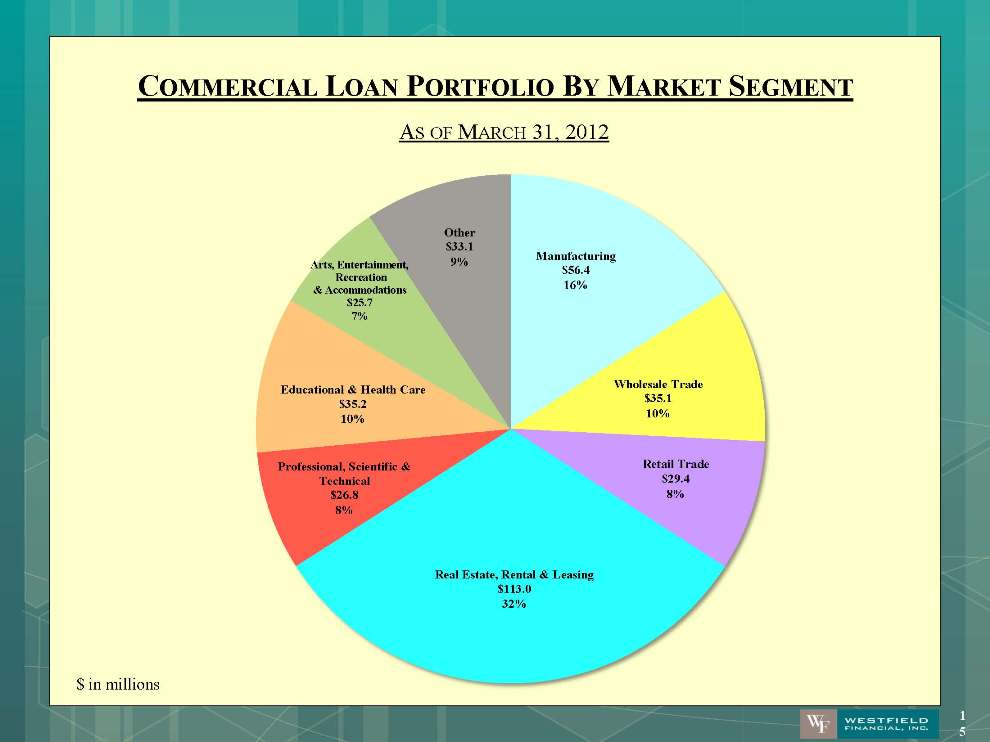
COMMERCIAL LOAN PORTFOLIO BY MARKET SEGMENT AS OF MARCH 31, 2012 Manufacturing $56.4 16% Wholesale Trade $35.1 10% Retail Trade $29.4 8% Real Estate, Rental & Leasing $113.0 32% Professional, Scientific & Technical $26.8 8% Educational & Health Care $35.2 10% Arts, Entertainment, Recreation & Accommodations $25.7 7% Other $33.1 9% 15 $ in millions
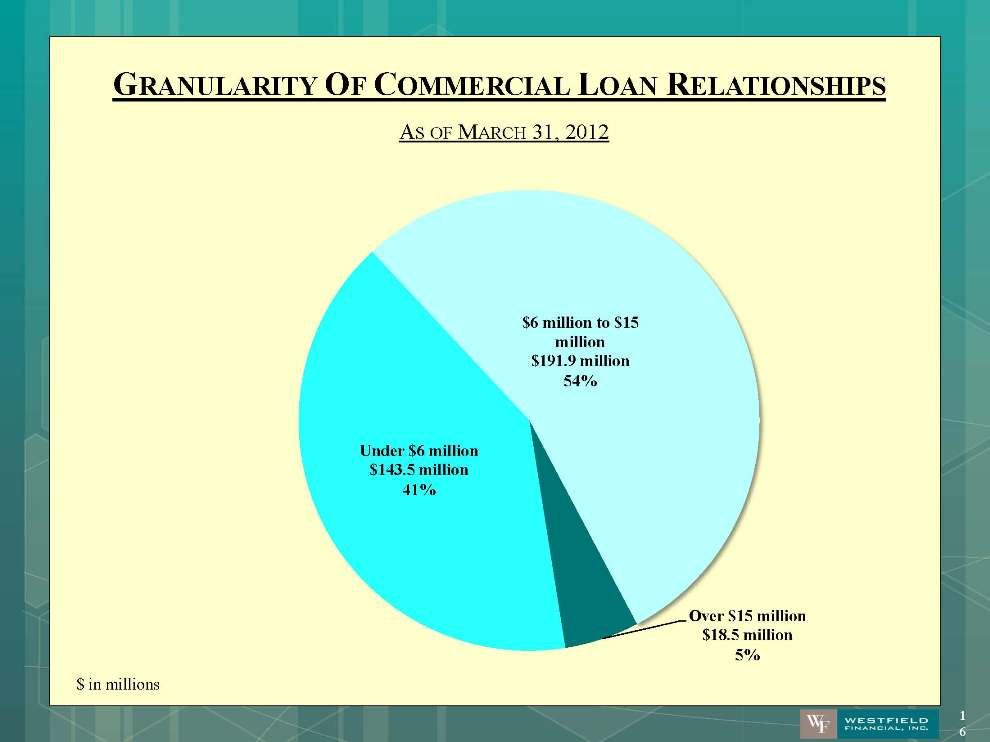
GRANULARITY OF COMMERCIAL LOAN RELATIONSHIPS AS OF MARCH 31, 2012 $6 million to $15 million $191.9 million 54% Over $15 million $18.5 million 5% Under $6 million $143.5 million 41% $ in millions
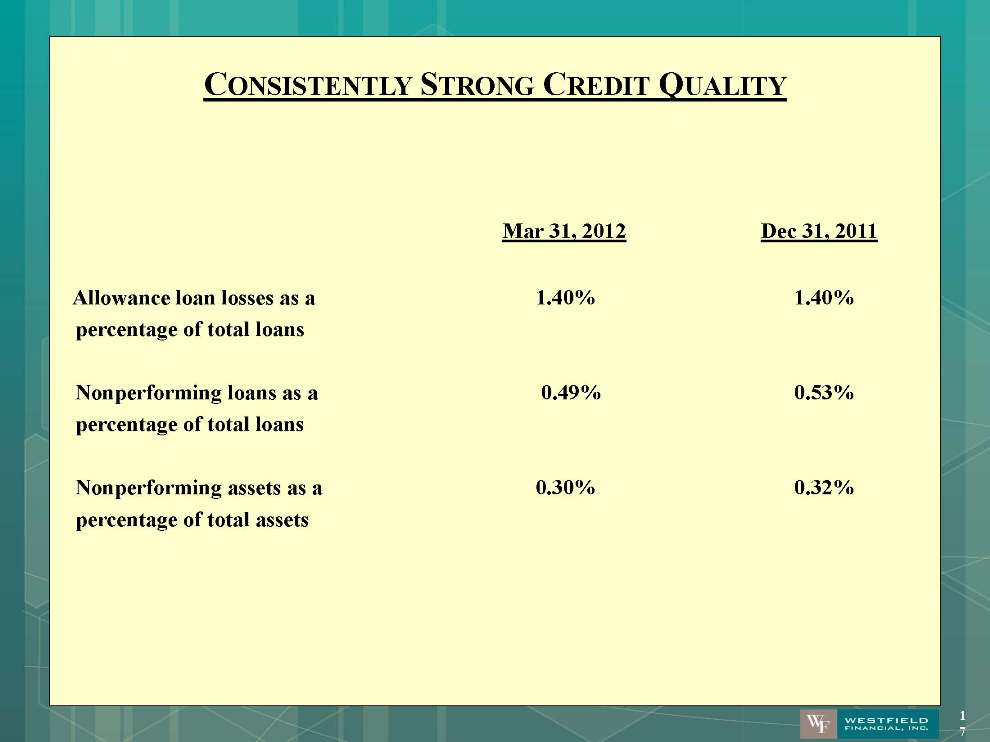
Mar 31, 2012 Dec 31, 2011 Allowance loan losses as a 1.40% 1.40% percentage of total loans Nonperforming loans as a 0.49% 0.53% percentage of total loans Nonperforming assets as a 0.30% 0.32% percentage of total assets 17 CONSISTENTLY STRONG CREDIT QUALITY
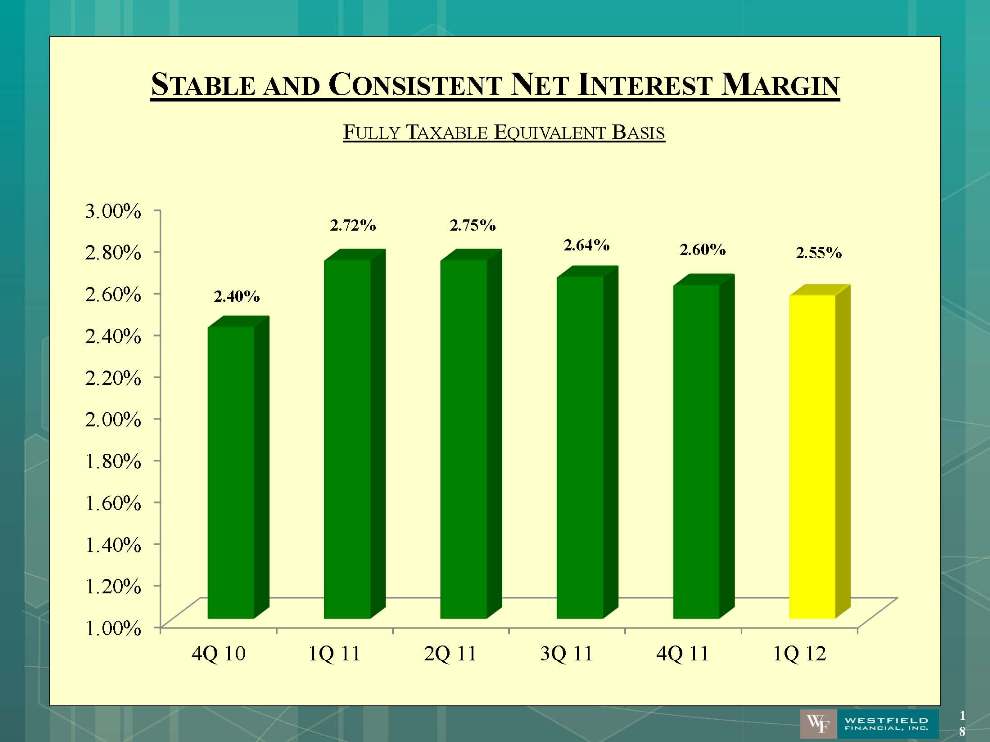
STABLE AND CONSISTENT NET INTEREST MARGIN FULLY TAXABLE EQUIVALENT BASIS 1.00% 1.20% 1.40% 1.60% 1.80% 2.00% 2.20% 2.40% 2.60% 2.80% 3.00% 4Q 10 1Q 11 2Q 11 3Q 11 4Q 11 1Q 12 2.40% 2.72% 2.75% 2.64% 2.60% 2.55%
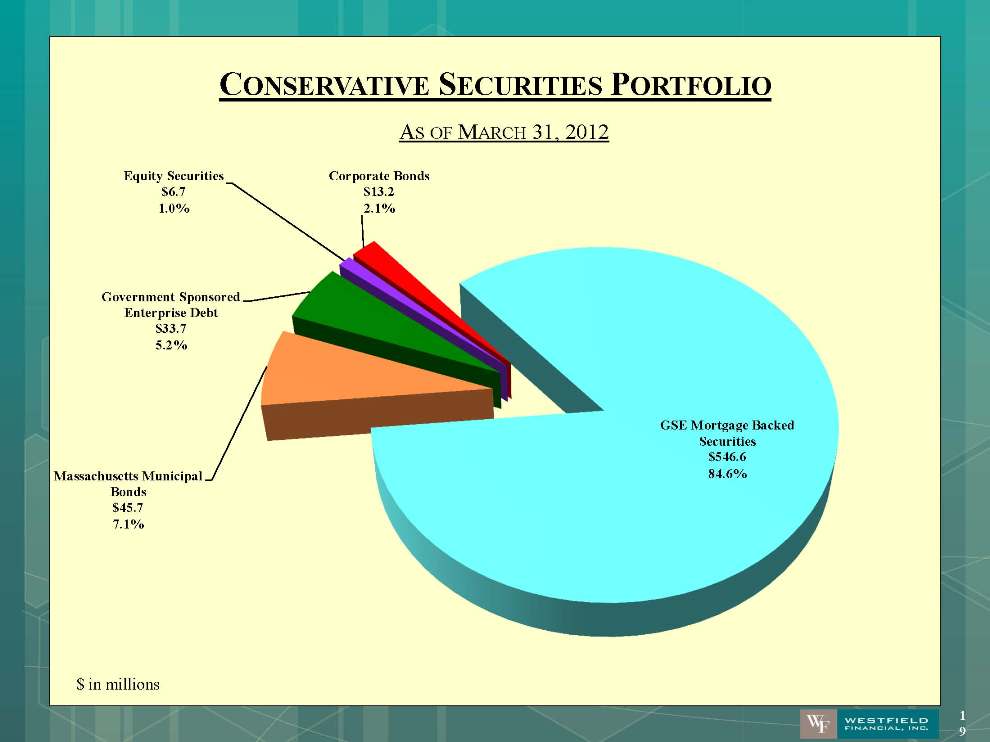
CONSERVATIVE SECURITIES PORTFOLIO AS OF MARCH 31, 2012 Government Sponsored Enterprise Debt $33.7 5.2% Equity Securities $6.7 1.0% Corporate Bonds $13.2 2.1% GSE Mortgage Backed Securities $546.6 84.6% Massachusetts Municipal Bonds $45.7 7.1% $ in millions
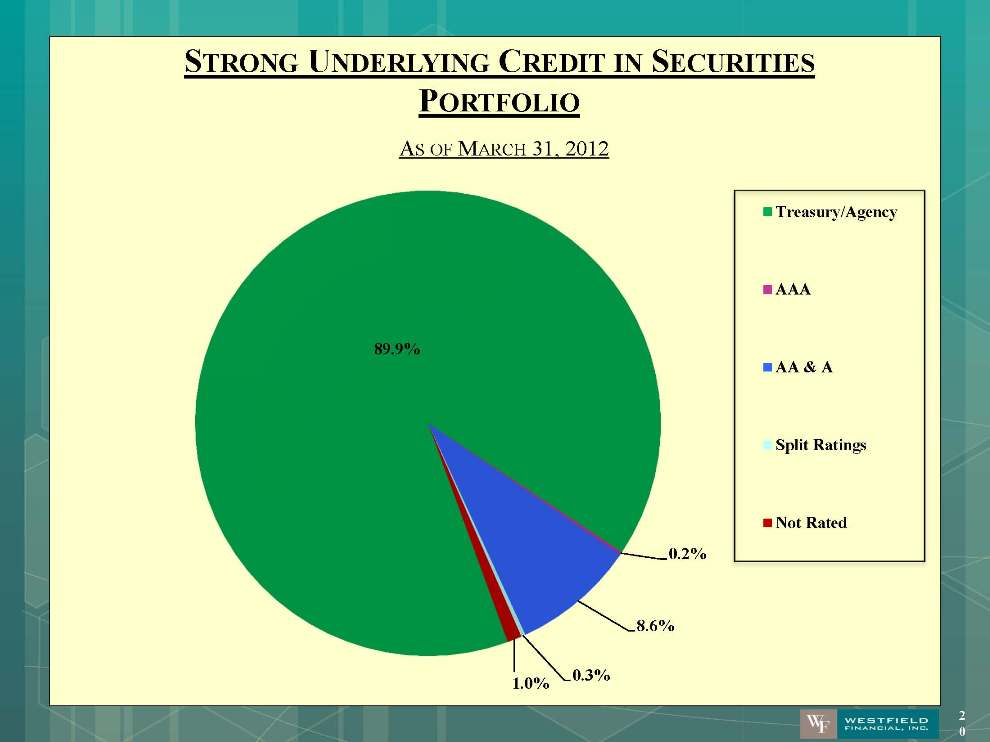
STRONG UNDERLYING CREDIT IN SECURITIES PORTFOLIO AS OF MARCH 31, 2012 89.9% 0.2% 8.6% 0.3% 1.0% Treasury/Agency AAA AA & A Split Ratings Not Rated

CAPITAL MANAGEMENT Fund organic growth. Finance acquisitions. Repurchase shares of our common stock. Pay dividends to shareholders. A COMBINATION OF FOUR INITIATIVES We try to effectively balance leveraging our capital to earn a returnon our shareholders’ investment versus returning the capital dollar-for-dollar in repurchases and dividends
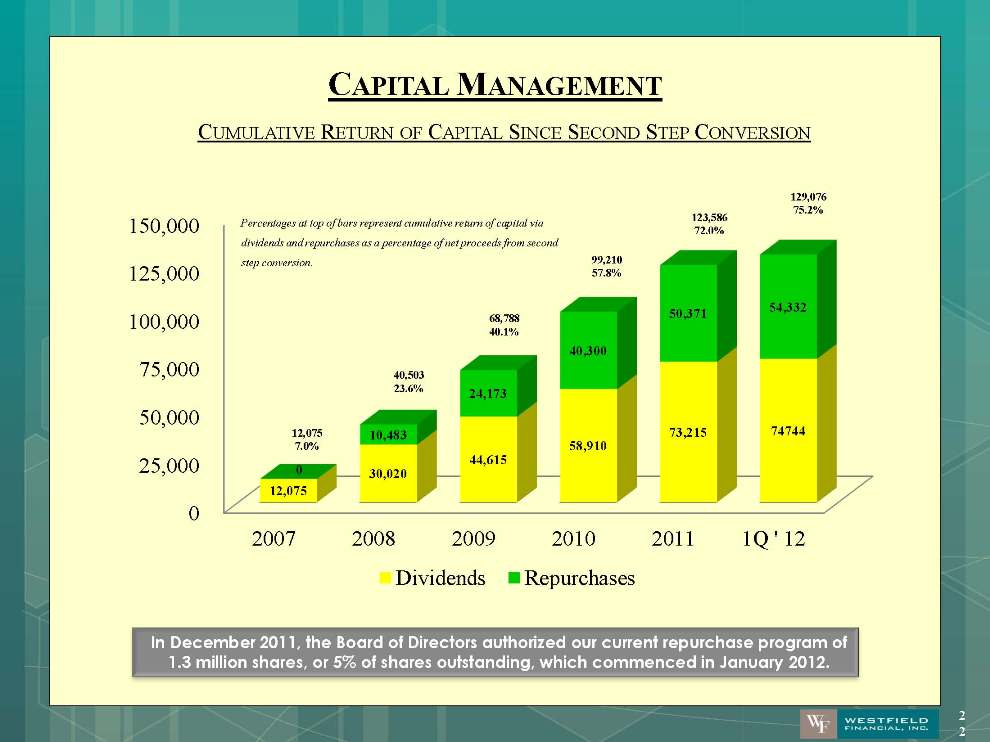
CAPITAL MANAGEMENT CUMULATIVE RETURN OF CAPITAL SINCE SECOND STEP CONVERSION 0 25,000 50,000 75,000 100,000 125,000 150,000 2007 2008 2009 2010 2011 1Q ' 12 12,075 30,020 44,615 58,910 73,215 74744 0 10,483 24,173 40,300 50,371 54,332 Dividends Repurchases Percentages at top of bars represent cumulative return of capital via dividends and repurchases as a percentage of net proceeds from second step conversion. 12,075 7.0% 40,503 23.6% 68,788 40.1% 99,210 57.8% 123,586 72.0% 129,076 75.2% In December 2011, the Board of Directors authorized our current repurchase program of 1.3 million shares, or 5% of shares outstanding, which commenced in January 2012.
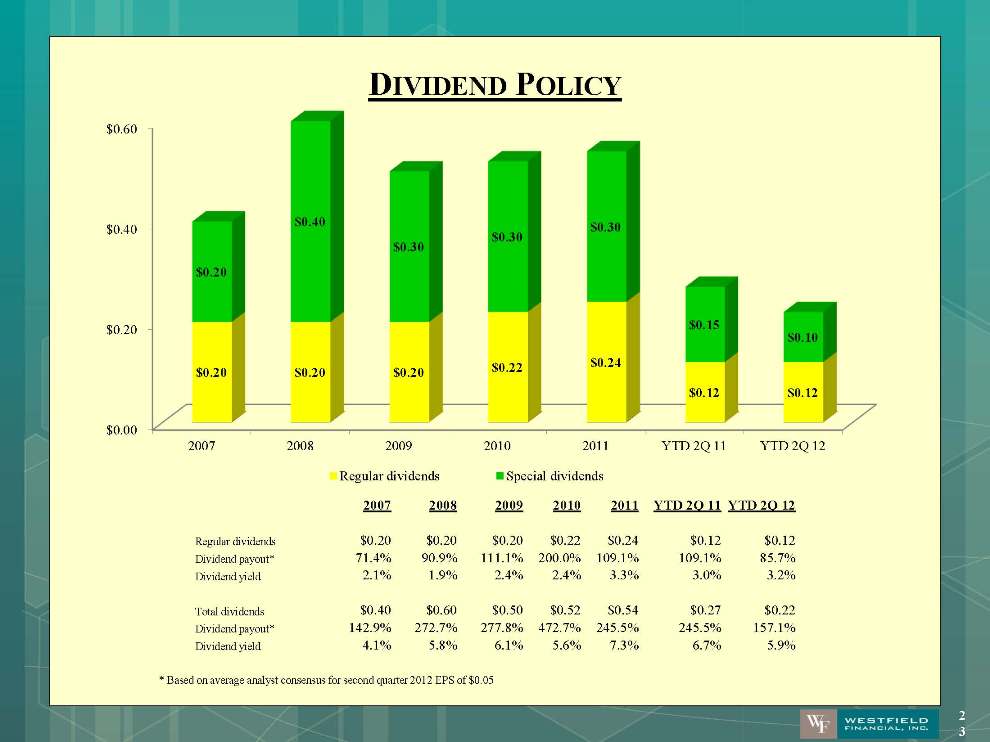
DIVIDEND POLICY $0.00 $0.20 $0.40 $0.60 2007 2008 2009 2010 2011 YTD 2Q 11 YTD 2Q 12 $0.20 $0.20 $0.20 $0.22 $0.24 $0.12 $0.12 $0.20 $0.40 $0.30 $0.30 $0.30 $0.15 $0.10 Regular dividends Special dividends * Based on average analyst consensus for second quarter 2012 EPS of $0.05
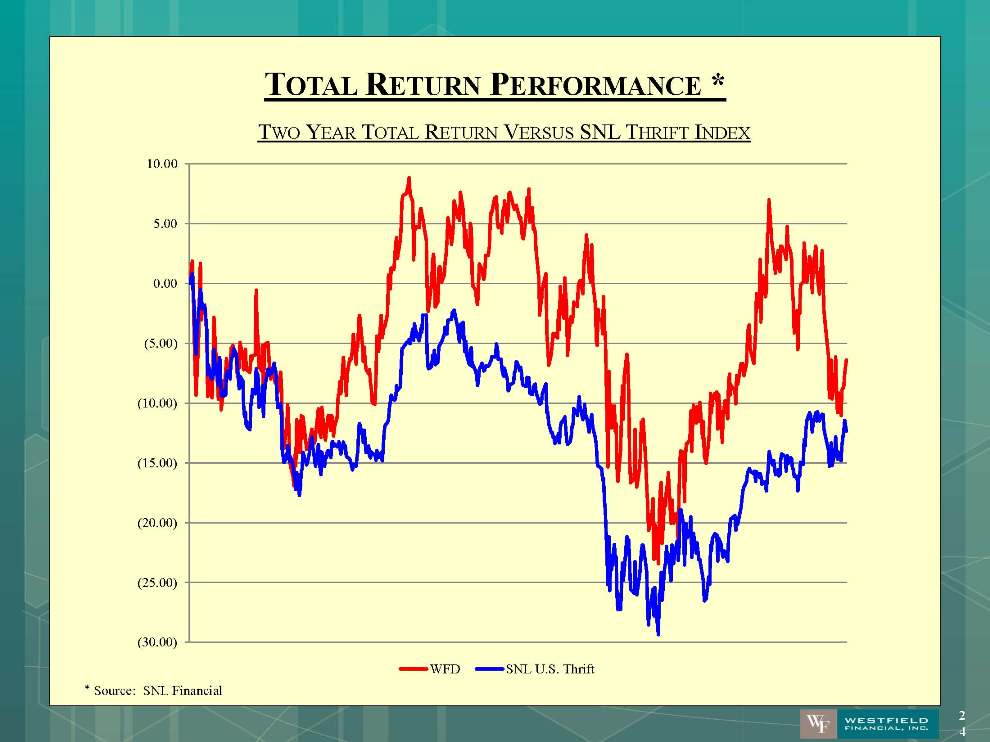
TOTAL RETURN PERFORMANCE * (30.00) (25.00) (20.00) (15.00) (10.00) (5.00) 0.00 5.00 10.00 WFD SNL U.S. Thrift TWO YEAR TOTAL RETURN VERSUS SNL THRIFT INDEX * Source: SNL Financial