Attached files
| file | filename |
|---|---|
| EX-4.1 - EX-4.1 - Community Choice Financial Inc. | a2209342zex-4_1.htm |
| EX-1.1 - EX-1.1 - Community Choice Financial Inc. | a2209342zex-1_1.htm |
| EX-23.2 - EX-23.2 - Community Choice Financial Inc. | a2209342zex-23_2.htm |
| EX-21.1 - EX-21.1 - Community Choice Financial Inc. | a2209342zex-21_1.htm |
| EX-23.1 - EX-23.1 - Community Choice Financial Inc. | a2209342zex-23_1.htm |
| EX-10.2 - EX-10.2 - Community Choice Financial Inc. | a2209342zex-10_2.htm |
| EX-10.15 - EX-10.15 - Community Choice Financial Inc. | a2209342zex-10_15.htm |
| EX-10.17 - EX-10.17 - Community Choice Financial Inc. | a2209342zex-10_17.htm |
As filed with the Securities and Exchange Commission on May 7, 2012
Registration No. 333-176434
UNITED STATES
SECURITIES AND EXCHANGE COMMISSION
Washington, D.C. 20549
AMENDMENT NO. 4
to
Form S-1
REGISTRATION STATEMENT
UNDER
THE SECURITIES ACT OF 1933
Community Choice Financial Inc.
(Exact name of registrant as specified in its charter)
| Ohio (State of Incorporation) |
6099 (Primary Standard Industrial Classification Code Number) |
45-1536453 (I.R.S. Employer Identification No.) |
7001 Post Road, Suite 200
Dublin, Ohio 43016
(614) 798-5900
(Address, including zip code, and telephone number, including
area code, of registrant's principal executive offices)
William E. Saunders, Jr.
Chief Executive Officer
7001 Post Road, Suite 200
Dublin, Ohio 43016
(614) 798-5900
(Name, address, including zip code, and telephone number, including area code, of agent for service)
| Copies to: | ||||
Bridgette Roman, Esq. Senior Vice President, Secretary and General Counsel 7001 Post Road, Suite 200 Dublin, Ohio 43016 Tel: (614) 798-5900 Fax: (614) 760-4057 |
Christopher M. Kelly, Esq. Michael J. Solecki, Esq. John T. Owen, Esq. Jones Day 222 East 41st Street New York, NY 10017-6702 Tel: (212) 326-3939 Fax: (212) 755-7306 |
Craig F. Arcella, Esq. Cravath, Swaine & Moore LLP 825 Eighth Avenue New York, NY 10019-7475 Tel: (212) 474-1000 Fax: (212) 474-3700 |
||
Approximate date of commencement of proposed sale to the public:
As soon as practicable after this Registration Statement becomes effective.
If any of the securities being registered on this Form are to be offered on a delayed or continuous basis pursuant to Rule 415 under the Securities Act of 1933, check the following box. o
If this Form is filed to register additional securities for an offering pursuant to Rule 462(b) under the Securities Act, check the following box and list the Securities Act registration statement number of the earlier effective registration statement for the same offering. o
If this Form is a post-effective amendment filed pursuant to Rule 462(c) under the Securities Act, check the following box and list the Securities Act registration statement number of the earlier effective registration statement for the same offering. o
If this Form is a post-effective amendment filed pursuant to Rule 462(d) under the Securities Act, check the following box and list the Securities Act registration statement number of the earlier effective registration statement for the same offering. o
Indicate by check mark whether the registrant is a large accelerated filer, an accelerated filer, a non-accelerated filer, or a smaller reporting company. See the definitions of "large accelerated filer," "accelerated filer" and "smaller reporting company" in Rule 12b-2 of the Exchange Act.
| Large accelerated filer o | Accelerated filer o | Non-accelerated filer ý (Do not check if a smaller reporting company) |
Smaller reporting company o |
CALCULATION OF REGISTRATION FEE
|
||||||||
| Title of Each Class of Securities to be Registered |
Amount to be Registered(1) |
Proposed Maximum Offering Price Per Share |
Proposed Maximum Aggregate Offering Price(2) |
Amount of Registration Fee(3) |
||||
|---|---|---|---|---|---|---|---|---|
Common Shares, par value $0.01 per share |
12,266,667 | $12.00 | $147,200,004 | $0 | ||||
|
||||||||
- (1)
- Includes 1,600,000 common shares that may be purchased by the underwriters to cover over-allotments, if any.
- (2)
- Estimated solely for purposes of calculating the registration fee pursuant to Rule 457(a) under the Securities Act of 1933.
- (3)
- A registration fee of $16,870 has been paid previously based on an estimate of the aggregate offering price.
The Registrant hereby amends this Registration Statement on such date or dates as may be necessary to delay its effective date until the Registrant shall file a further amendment which specifically states that this Registration Statement shall thereafter become effective in accordance with Section 8(a) of the Securities Act of 1933 or until the Registration Statement shall become effective on such date as the Securities and Exchange Commission acting, pursuant to said Section 8(a), may determine.
The information in this prospectus is not complete and may be changed. We may not sell these securities until the registration statement filed with the Securities and Exchange Commission is effective. This prospectus is not an offer to sell these securities and it is not soliciting an offer to buy these securities in any jurisdiction where the offer or sale is not permitted.
SUBJECT TO COMPLETION, DATED MAY 7, 2012
10,666,667 Shares

Community Choice Financial Inc.
Common Shares
Prior to the offering, there has been no public market for our common shares. The initial public offering price per share is expected to be between $10.00 and $12.00 per share. We have applied to list our common shares on The Nasdaq Global Market under the symbol "CCFI".
We are selling 10,666,667 common shares.
The underwriters have an option to purchase a maximum of 1,600,000 additional shares from us and the selling shareholders to cover over-allotments of shares.
We are an "emerging growth company" and are eligible for reduced reporting requirements.
Investing in our common shares involves risks. See "Risk Factors" beginning on page 23.
| |
Price to Public |
Underwriting Discounts and Commissions |
Proceeds to Company |
|||||||
|---|---|---|---|---|---|---|---|---|---|---|
Per Share |
$ | $ | $ | |||||||
Total |
$ | $ | $ | |||||||
Neither the Securities and Exchange Commission nor any state securities commission has approved or disapproved of these securities or determined if this prospectus is truthful or complete. Any representation to the contrary is a criminal offense.
Delivery of the common shares will be made on or about , 2012.
Joint Book-Running Managers
Credit Suisse
Jefferies |
Stephens Inc. |
Lead Manager |
Co-Manager |
|
| JMP Securities | William Blair & Company |
The date of this Prospectus is , 2012.
You should rely only on the information contained in this prospectus or in any free writing prospectus prepared by us or to which we have referred you. We have not, the selling shareholders have not, and the underwriters have not, authorized anyone to provide you with information that is different. This document may only be used where it is legal to sell these securities. The information in this document may only be accurate on the date of this document.
Until (25 days after the commencement of the offering), all dealers that effect transactions in these securities, whether or not participating in this offering, may be required to deliver a prospectus. This is in addition to the dealer's obligation to deliver a prospectus when acting as an underwriter and with respect to unsold allotments or subscriptions.
INDUSTRY AND MARKET DATA AND PERFORMANCE DATA
This prospectus includes information regarding the retail financial services industry and various markets in which we compete. When we refer to our position in the industry, such market position is based on the number of retail stores we operate and not on our revenues or volumes. Where possible, this information is derived from third-party sources that we believe are reliable, including the Federal Deposit Insurance Corporation, or FDIC, Mercator Advisory Group, or Mercator, Stephens Inc., or Stephens, the Federal Reserve Bank of New York, the National Bureau of Economic Research, or NBER, Bretton Woods, Inc., or Bretton Woods, and Financial Service Centers of America, Inc., or FiSCA. In other cases, this information is based on estimates made by our management, based on their industry and market knowledge and information from third-party sources. However, this data is subject to change and cannot be verified with complete certainty due to limits on the availability and reliability of raw data, the voluntary nature of the data gathering process and other limitations and uncertainties inherent in any statistical survey. As a result, you should be aware that market share, ranking and other similar data set forth herein, and estimates and beliefs based on such data, may not be reliable.
Certain of the industry and market data contained in this prospectus has been derived from research reports produced by Stephens. Stephens is an underwriter in this offering. Research attributed to Stephens in this prospectus has been separately prepared and reviewed by Stephens's independent research analysts.
i
This summary highlights certain information contained elsewhere in this prospectus. Because this is only a summary, it does not contain all the information that may be important to you. For a more complete understanding of our business and this offering, you should read the entire prospectus, including the historical consolidated financial statements and pro forma consolidated statements of operations included elsewhere in this prospectus. You should also carefully consider the matters discussed under "Risk Factors". When we present historical financial information on a "pro forma basis", we provide such information after giving effect to each of the acquisition of CCCS Corporate Holdings, Inc., which we completed in April 2011, and the acquisition of 10 stores in Illinois, which we completed in March 2011, and to each of the offering of our 10.75% senior secured notes due 2019 and the establishment of our $40 million revolving credit facility, each of which we completed in April 2011, and this offering, as described in more detail under "Unaudited Pro Forma Consolidated Financial Information". In this prospectus, unless the context requires otherwise, references to "CCFI", "we", "our", "us" or the "Company" refer to Community Choice Financial Inc. and to our predecessor, CheckSmart, as the context requires.
Overview
We are a leading retailer of alternative financial services to unbanked and underbanked consumers through a network of 435 retail storefronts across 14 states. We focus on providing a wide range of convenient consumer financial products and services to help customers manage their day-to-day financial needs, including short-term consumer loans, medium-term loans, title loans, check cashing, prepaid debit cards, money transfers, bill payments and money orders. Although the majority of our customers have banking relationships, we believe that our customers use our financial services because they are convenient, easy to understand, and in many instances, more affordable than available alternatives.
We strive to provide customers with unparalleled customer service in a safe, clean and welcoming environment. Our stores are located in highly visible, accessible locations that allow customers convenient and immediate access to our services. Our professional work environment combines high employee performance standards, incentive-based pay and a wide array of training programs to incentivize our employees to provide superior customer service. We believe that this approach has enabled us to build strong customer loyalty, putting us in a position to expand and continue to capitalize on our innovative product offerings. As a result of our focus on store selection and design and our efforts to provide consistent, high-quality customer service, we have achieved per store revenue and per store Adjusted EBITDA contribution levels that we believe substantially exceed our publicly traded peers. See "Certain Financial Measures and Other Information" for an explanation of how we calculate these metrics and "—Summary Historical Consolidated Financial Data" for a reconciliation of our net income to Adjusted EBITDA.
We serve the large and growing market of individuals who have limited or no access to traditional sources of consumer credit and financial services. A study conducted by the FDIC published in 2009 indicates 25.6% of U.S. households are either unbanked or underbanked, representing approximately 60 million adults. As traditional financial institutions increase fees for consumer services, such as checking accounts and debit cards, and tighten credit standards as a result of economic and other market driven developments, consumers have looked elsewhere for less expensive and more convenient alternatives to meet their financial needs. According to a recent Federal Reserve Bank of New York report, total consumer credit outstanding has declined over $1.4 trillion since its peak in the third quarter of 2008. This contraction in the supply of consumer credit has resulted in significant unmet demand for consumer loan products.
For the year ended December 31, 2011, we generated $306.9 million in revenue, $16.9 million in net income and $86.8 million in Adjusted EBITDA. As of December 31, 2011, we had $515.5 million of total assets and $61.3 million of stockholders' equity.
1
Our measurement of comparable store sales growth as of December 31, 2011 includes stores which we operated for the full year of 2011 and which were open for the full year of 2010. As of December 31, 2011 we had 280 stores included in this measurement. These stores achieved comparable sales growth of 7.3% for the year ended December 31, 2011 as compared to the year ended December 31, 2010.
Products and Services
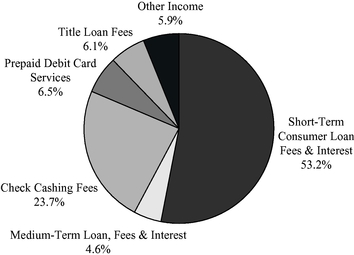
We offer several convenient, fee-based services to meet the needs of our customers, including short-term consumer loans, medium-term loans, title loans, check cashing, prepaid debit cards, money transfers, bill payments, money orders, international and domestic prepaid phone cards, tax preparation, auto insurance, motor vehicle registration services and other ancillary retail financial services. The following charts reflect the major categories of services that we currently offer and the revenues from these services for the year ended December 31, 2011 as well as the number of store locations we have in each state:
Revenue by Product Group |
Store Count by State |
|
|
|
Consumer Loans. We offer a variety of consumer loan products and services. We believe that our customers find our consumer loan products and services to be convenient, transparent and lower-cost alternatives to other, more expensive short-term options, such as incurring returned item fees, credit card late fees, overdraft or overdraft protection fees, utility late payment, disconnect and reconnect fees and other charges imposed by other financing sources when they do not have sufficient funds to cover unexpected expenses or other needs. Our customers often have limited access to more traditional sources of consumer credit, such as credit cards.
The specific consumer loan products we offer vary by location, but generally include the following types of loans:
- •
- Short-Term Consumer Loans. One of our primary products is a short-term, small-denomination consumer loan whereby a customer receives immediate cash, typically in exchange for a post-dated personal check or a pre-authorized debit from his or her bank account. We offer this product in 367 of our 435 stores. As the lender, we agree to defer deposit of the check or initiation of the debit from the customer's bank account until the mutually agreed upon due date, which typically falls on the customer's next payday. Principal amounts of our short-term consumer loans can be up to $1,000 and averaged approximately $426 during 2011. Fees charged vary from state to state, generally ranging from $8 to $15 per $100 borrowed. Our short-term consumer loan products are offered in the following 13 of the 14 states in which we operate
2
stores: Alabama, California, Florida, Illinois, Indiana, Kansas, Kentucky, Michigan, Missouri, Ohio, Oregon, Utah and Virginia.
The following table presents key operating data for our short-term consumer loan products.
| |
Year ended December 31, 2011 |
|||
|---|---|---|---|---|
Loan volume (in thousands) |
$ | 1,543,310 | ||
Number of loans (in thousands) |
3,625 | |||
Average originated loan size |
$ | 425.72 | ||
Average originated loan fee |
$ | 46.37 | ||
Loan loss provision as a percentage of loan volume |
2.6 | % | ||
- •
- Medium-Term Loans. In meeting our customers' financial needs, we also offer a range of medium-term loans. Principal amounts of medium-term loans typically range from $100 to $2,501 and have maturities between three months and 24 months. These loans vary in their structure in order to conform to the specific regulatory requirements of the various jurisdictions in which they are offered. The loans may have an installment repayment plan or provide for a line of credit with periodic monthly payments. We offer these loans in 164 of our 435 stores in the following three of the 14 states in which we operate stores: California, Illinois and Virginia.
The following table presents key operating data for our medium-term loan products.
| |
As of December 31, 2011 |
|||
|---|---|---|---|---|
Principal outstanding(1) (in thousands) |
$ | 12,174 | ||
Number of loans outstanding |
20,818 | |||
Average principal outstanding |
$ | 584.79 | ||
Average monthly percentage rate |
19.2 | % | ||
Allowance as a percentage of finance receivable |
10.6 | % | ||
- (1)
- Loan participations are grouped with medium-term loans in our consolidated financial statements included elsewhere in this prospectus, but excluded from this calculation.
- •
- Title Loans. Title loans are asset-based loans whereby the customer obtains cash using a vehicle as collateral. We offer this product in 243 of our 435 stores. The amount of funds made available is based on the vehicle's value, and our policies typically authorize loans based on the wholesale value of the vehicle in exchange for a first priority lien on the customer's otherwise unencumbered vehicle title. The customer receives the benefit of immediate cash and retains possession of the vehicle while the loan is outstanding. Our title loans are offered in the following eight of the 14 states in which we operate stores: Alabama, Arizona, California, Illinois, Kansas, Missouri, Utah and Virginia, and we intend to introduce title loans in additional states in the future.
The following table presents key operating data for our title loan products.
| |
As of December 31, 2011 |
|||
|---|---|---|---|---|
Principal outstanding (in thousands) |
$ | 17,334 | ||
Number of loans outstanding |
15,283 | |||
Average principal outstanding |
$ | 1,134.20 | ||
Average monthly percentage rate |
13.3 | % | ||
Allowance as a percentage of finance receivable |
5.3 | % | ||
3
For the year ended December 31, 2011, short-term consumer loans, medium-term loans, and title loans generated 53.2%, 4.6%, and 6.1%, respectively, of our revenue.
Check Cashing. We offer check cashing services in 409 of our 435 stores. Prior to cashing a check, our customer service representatives verify the customer's identification and enter the payee's social security number and the payor's bank account information in our internal, proprietary databases, which match these fields to prior transactions in order to mitigate our risk of loss. Although we have established guidelines for approving check cashing transactions, we do not impose maximum check size restrictions. Subject to appropriate approvals, we accept all forms of checks, including payroll, government, tax refund, insurance, money order, cashiers' and personal checks. Our check cashing fees vary depending upon the amount and type of check cashed, applicable state regulations and local market conditions. Our check cashing services are offered in the following 13 of the 14 states in which we operate stores: Alabama, Arizona, California, Florida, Indiana, Kansas, Kentucky, Michigan, Missouri, Ohio, Oregon, Utah and Virginia.
The following table presents key operating data for our check cashing business.
| |
Year ended December 31, 2011 |
|||
|---|---|---|---|---|
Face amount of checks cashed (in thousands) |
$ | 2,163,276 | ||
Number of checks cashed (in thousands) |
4,869 | |||
Face amount of average check |
$ | 444.26 | ||
Average fee per check |
$ | 14.95 | ||
Fee as a percentage of average check size |
3.4 | % | ||
Returned check expense (% of face amount) |
0.2 | % | ||
Check cashing accounted for 23.7% of our revenue for the year ended December 31, 2011.
Prepaid Debit Card Services. One of our fastest growing businesses is the sale and servicing of prepaid debit cards, which we offer in 430 of our 435 stores. As an agent for a third-party debit card provider, we offer access to reloadable prepaid debit cards with a variety of enhanced features that provide our customers with a convenient and secure method of accessing their funds in a manner that meets their individual needs. The cards are provided by Insight Card Services LLC, successor to Insight LLC, or Insight, and our stores serve as distribution points where customers can purchase cards as well as load funds onto and withdraw funds from their cards. Customers can elect to receive check cashing proceeds on their cards without having to worry about security risks associated with carrying cash. The cards can be used at most places where MasterCard® or Visa® branded debit cards are accepted. These cards offer our customers the ability to direct deposit all or a portion of their payroll checks onto their cards, receive real-time wireless alerts for transactions and account balances, and utilize in-store and online bill payment services. In addition to these basic features available on all of the cards offered in our stores, we offer two additional card options with enhanced features. One of the enhanced feature cards provides, at the customer's option, a lower-cost overdraft protection option compared to the typical overdraft fees charged by traditional banks. The other enhanced card option allows qualifying customers to receive loan proceeds from a state-licensed third-party lender directly onto their cards, which we believe is an innovative feature of these cards. This feature is currently offered in Arizona and certain stores in Ohio, and we may introduce this feature in additional states in the future.
Since we began offering Insight cards in April 2010, we have experienced substantial growth in our prepaid debit card business. Active Insight accounts, which we define as accounts reflecting any activity during the preceding 90 days, had grown to 140,970 as of December 31, 2011, an increase of over 62% from December 31, 2010. We are paid certain agent fees from Insight that are based on monthly card fees, overdraft charges, interchange fees and ATM access fees. In addition, we earn fees from the sale of prepaid debit cards and are required to pre-fund certain card activity when customers load funds onto their cards. Our pre-funding obligation arises as a result of the time lag between when customers
4
load funds onto their cards in our stores and when funds are subsequently remitted to the banks that issue the cards. We also are required to pre-fund amounts in order to fund our obligation to purchase loan participations when our Arizona customers receive loan proceeds from a third-party lender onto their cards and in relation to negative card balances our customers may experience. The following table presents key operating data for our prepaid debit card services business as of December 31, 2011:
| |
As of December 31, 2011 |
|||
|---|---|---|---|---|
Active card holders in network (in thousands) |
141.0 | |||
Active direct deposit customers (in thousands) |
33.2 | |||
Prepaid debit card services accounted for 6.5% of our revenue for the year ended December 31, 2011.
Other Products and Services. Introducing new products into our markets has historically created profitable revenue expansion. Other products and services that we currently offer through our stores include money transfer, bill payment, and international and prepaid phone cards. Additionally, we piloted a new tax preparation offering during the first quarter of 2011 and an automotive insurance program in the fourth quarter of 2011. Neither of these new products had a material impact on our 2011 financial results, but the offerings were well received by our customers and we believe these offerings represent an example of an avenue for growth in future years. These other products and services provide revenues and help drive additional traffic to our stores, resulting in increased volume across all of our product offerings. Other products and services accounted for 5.9% of our revenue for the year ended December 31, 2011.
Historical Acquisitions
California Acquisition. On April 29, 2011, we acquired CCCS, an alternative financial services business with similar product offerings as CheckSmart. CheckSmart, together with CCCS and certain other parties, executed an agreement and plan of merger, under which CCFI, a newly formed holding company, acquired all outstanding shares of both CheckSmart and CCCS. We refer to this transaction as the California Acquisition. In connection with consummating the California Acquisition, we also issued $395 million in aggregate principal amount of our 10.75% senior secured notes due 2019, which we refer to as our senior notes, and entered into a $40 million senior secured revolving credit facility, which we refer to as our revolving credit facility.
Other Acquisitions. Since August 2009, we have also acquired:
- •
- 10 stores in Illinois, which we acquired on March 21, 2011 in an asset purchase transaction. We refer to this
transaction as the Illinois Acquisition.
- •
- 19 stores in Alabama, which we acquired in March 2010. We refer to this transaction as the Alabama
Acquisition.
- •
- Eight stores in Michigan, which we acquired in August 2009. We refer to this transaction as the Michigan Acquisition.
Following these acquisitions, we have successfully integrated our expanded product offerings and retailing strategies at acquired stores. The stores acquired in the Alabama and Michigan Acquisitions, both owned and operated for the full year of 2011, experienced revenue growth in excess of 26% in 2011. We have invested significant resources in building a scalable company-wide platform in areas such as collections, call center operations, information technology, legal, compliance and accounting in order to quickly and successfully integrate acquired stores into our existing business.
5
Recent and Pending Acquisitions
We have recently completed one investment, one acquisition, and have one additional acquisition pending that we believe will allow us to further expand our product offerings and the locations in which we offer our products.
Insight Investment. We acquired a 22.5% stake in Insight Holding Company LLC, or Insight Holding, in November 2011. Insight Holding is the parent company of Insight Cards Services LLC, the program manager for the Insight Card that is offered through our retail locations.
DFS Acquisition. On April 1, 2012 we acquired all of the equity interests of Direct Financial Solutions, LLC and its subsidiaries, or DFS, as well as three other affiliated entities, Direct Financial Solutions of UK Limited and its subsidiary Cash Central UK Limited, or DFS UK, DFS Direct Financial Solutions of Canada, Inc., or DFS Canada, and Reliant Software Inc., all of which we collectively refer to as the DFS Companies. The purchase price was approximately $22 million, subject to a post-closing working capital adjustment.
DFS offers short-term loans to consumers via the Internet under a state-licensed model in compliance with the applicable laws of the jurisdiction of its customers.
Currently, DFS offers loans, under a state-law based model, to residents of Alabama, Alaska, California, Delaware, Hawaii, Idaho, Kansas, Louisiana, Minnesota, Missouri, Nevada, North Dakota, Rhode Island, South Dakota, Utah, Washington, Wyoming, and Wisconsin, and operates as a Credit Access Business in Texas, through which it offers loans originated by an unaffiliated, third-party lender. In addition, DFS UK offers loans in the United Kingdom. DFS Canada does not currently offer any loans.
As of April 1, 2012, DFS had 76 employees, including part-time employees, primarily located at DFS's corporate headquarters in North Logan, Utah, which manages the loan underwriting, collections, information technology, and other aspects of the DFS business. Unless stated otherwise, information in this prospectus regarding our business does not give effect to the acquisition of DFS.
Through our acquisition of DFS, we gain access to a scalable Internet-based revenue opportunity. We believe this additional retail channel will enable us to efficiently reach consumers not fully served by our existing retail locations. Our objective will be to accelerate the growth of DFS through incremental capital, application of retailing strategies and an expansion of its product offerings.
For the year ended December 31, 2011, based on DFS's unaudited financial information provided to us by the seller, DFS reported revenues and EBITDA of approximately $22.7 million and $3.5 million, respectively.
Florida Acquisition. On April 22, 2012, we signed a definitive purchase agreement to acquire the assets of a retail consumer finance operator in the state of Florida. This retail consumer finance company operates over 30 stores in South Florida markets. The purchase price will be $45.5 million, subject to certain closing adjustments, and we expect to close this transaction in the second fiscal quarter of 2012, though our obligation to close is conditioned on completion of this offering. For 2011, based on unaudited financial information provided to us by the seller, the company reported revenues and EBITDA of approximately $20.5 million and $7.2 million, respectively. We believe this potential acquisition, or the Florida Acquisition, represents an attractive growth opportunity in what we view as a stable market. We believe we will be able to enhance the contribution of the acquired stores through a combination of implementing our prepaid card program and applying our retail strategies.
We remain in active dialogue with numerous potential acquisition targets. Our historic growth has included acquisitions, which have provided additional revenue through increasing the number of our retail locations, and growth from implementing our business plan and product offerings in newly acquired stores. We plan to continue to execute on this strategy in the future.
6
We operate in a segment of the financial services industry that serves unbanked and underbanked consumers in need of convenient and immediate access to cash and other financial products and services, often referred to as "alternative financial services". Our industry provides services to an estimated 60 million unbanked and underbanked consumers in the United States. Products and services offered by this industry segment include various types of short-term loans (including payday loans, title loans, small installment loans, internet loans and pawn loans), medium-term loans, check cashing, prepaid card products, rent-to-own products, bill payment services, tax preparation, money orders and money transfers. Consumers who use these services are often underserved by banks and other traditional financial institutions and referred to as "unbanked" or "underbanked" consumers.
We believe that consumers seek our industry's services for numerous reasons, including because they often:
- •
- prefer and trust the simplicity, transparency and convenience of our products;
- •
- may have a dislike or distrust of banks due to confusing and complicated fee structures that are not uncommon for
traditional bank products;
- •
- require access to financial services outside of normal banking hours;
- •
- have an immediate need for cash for sudden financial challenges and unexpected expenses;
- •
- have been rejected for or are unable to access traditional banking or other credit services;
- •
- seek an alternative to the high cost of bank overdraft fees, credit card and other late payment fees and utility late
payment, disconnect and reconnection fees; and
- •
- wish to avoid potential negative credit consequences of missed payments with traditional creditors.
Demand in our industry has been fueled by several demographic and socioeconomic trends, including an overall increase in the population and stagnant to declining growth in the household income for working-class individuals. In addition, many banks have reduced or eliminated services that working-class consumers require, due to the higher costs associated with serving these consumers and increased regulatory and compliance costs. The necessity for our products was highlighted by a recent paper from the NBER, which found that half of the Americans surveyed reported that it is unlikely that they would be able to gather $2,000 to cover a financial emergency, even if given a month to obtain funds. As a result of these trends, a significant number of retailers in other industries have begun to offer financial services to these consumers. The providers of these services are fragmented and range from specialty finance stores to retail stores in other industries that offer ancillary financial services.
We believe that the markets in which we operate are highly fragmented. Stephens estimates that short-term consumer lenders generated approximately $40.0 billion of domestic transaction volume in 2010 from approximately 19,500 storefronts and 150 online lenders. According to Stephens, only seven industry participants have more than 500 storefront locations, and the largest 15 operators account for less than 51% of the storefronts in the United States. FiSCA estimated that in 2007 there were approximately 13,000 check-cashing and other fee-based financial service locations in the United States that cashed approximately $58.0 billion in aggregate face amount of checks.
We anticipate consolidation within the industry will continue as a result of numerous factors, including:
- •
- economies of scale available to larger operators;
- •
- adoption of technology to better serve customers and control large store networks;
7
- •
- increased licensing, zoning and other regulatory requirements; and
- •
- the inability of smaller operators to form the alliances necessary to deliver new products and adapt to changes in the regulatory environment.
The prepaid debit card space is one of the most rapidly growing segments of our industry. Mercator's analysis of the prepaid debit card industry indicates that $28.6 billion was loaded onto general-purpose reloadable cards during 2009, a 47% growth rate from 2008, and estimates that the total general-purpose reloadable card market will grow at a compound annual growth rate of 63% from 2007 to 2013, reaching an estimated $201.9 billion in load volume by 2013. A March 2011 study conducted by Bretton Woods concluded that the opening of reloadable prepaid debit card accounts may surpass the opening of new checking accounts in the coming years as a result of the fact that prepaid debit cards, particularly when combined with direct deposit, will in many instances be less expensive for consumers than traditional checking accounts.
We take an active leadership role in numerous trade organizations that represent our industry's interests and promote best practices within the industry, including the Community Financial Services Association of America, FiSCA, the National Branded Prepaid Card Association and the American Association of Responsible Auto Lenders.
We believe the following strengths differentiate us from our competitors in the marketplace and will enable us to maintain our position as a leading retailer in the alternative financial services industry.
Leading Market Position with Industry Leading Operating Metrics. We are one of the largest operators in our industry. We operate 435 stores across 14 states, in an industry that remains highly fragmented. As a result of our focus on store selection and design and our efforts to provide consistent, high-quality customer service, we have achieved per store revenue and per store Adjusted EBITDA contribution levels that we believe substantially exceed our publicly traded peers. For the year ended December 31, 2011, we generated revenue per store of over $795,000, with each store contributing, on average, more than $227,000 to Adjusted EBITDA. We estimate that these figures are approximately 1.7 to 3.2 times and 1.4 to 4.3 times, respectively, those of our publicly traded peers over the same period. For an explanation of how we calculate these figures, see "Certain Financial Measures and Other Information".
Proven History of Successful Acquisition Integration. We have invested significant resources in building a scalable company-wide platform in areas such as collections, call center operations, information technology, and legal and compliance, in order to successfully integrate acquired companies and stores into our business. This scalable infrastructure and proven acquisition platform has allowed us to integrate acquired businesses and stores efficiently and implement our unique retail focus to grow revenue. For example, we have been able to integrate our existing product offerings and customer service-oriented approach to significantly increase store-level revenues following the acquisition of 19 stores in the Alabama Acquisition and eight stores in the Michigan Acquisition. Our stores in the Michigan market experienced 26.4% revenue growth for the year ended December 31, 2011 as compared to the year ended December 31, 2010. Our stores in the Alabama market experienced 34.4% revenue growth for the year ended December 31, 2011 as compared to the same period in 2010. In both California and Illinois, we have introduced our enhanced service offerings following those acquisitions. Revenues from the stores acquired in the California Acquisition grew 9.8% during the fourth quarter of 2011 as compared to the fourth quarter of 2010. In the acquired Illinois stores, we have focused on growing customer count in 2011 following the implementation of a new lending statute in Illinois that resulted in a decline in revenue.
Best-in-Class Customer Service. We believe that our retailing competency and our focus on and reputation for superior customer service have been key drivers of our success. We seek to consistently
8
deliver fast, professional service with courteous, personalized treatment designed to ensure that customers feel valued and respected. Our superior customer service culture is primarily the result of the following:
- •
- Convenient store layout, locations and hours. Our stores
are generally designed to maximize customer traffic and privacy while minimizing customer wait time. Our stores typically have five to seven teller stations, which allow us to serve multiple customers
simultaneously and reduce customer wait time. We seek to place our stores in locations that are easily accessible, have ample parking and are in areas of high commercial traffic. We use highly visible
signage to attract customers and reinforce brand recognition. Our management believes that our stores are typically open longer hours than those of our publicly traded peers and that we have more
24-hour stores than any of our publicly traded peers. Our stores are typically open from 8 a.m. to 8 p.m., Monday through Saturday, and 11 a.m. to 5 p.m. on
Sunday, and 26 of our stores are open 24 hours per day.
- •
- Highly Trained and Long-Tenured Employees. We dedicate significant resources to training and retaining our employees, resulting in what we believe is meaningfully lower employee turnover compared to our peers. Our branch employees are trained and incentivized to be efficient and helpful in meeting customer needs. We believe our approach promotes customer trust and, ultimately, customer loyalty. All of our district and regional managers have experience working in our stores, where they gained operational expertise and local market awareness, which we believe translates into the ability to make and implement appropriate strategic and operational decisions. We maintain an internal, centralized collections department that is staffed with personnel who specialize in collection activities. Our centralized collections model allows store-level employees to focus on customer service while leaving collections activities to dedicated and skilled professionals. We have designed an incentive-based compensation structure that we believe keeps our branch employees, managers and collections specialists properly motivated.
Diversified Revenue Mix. We operate a scalable business model with significant product and geographic diversification across our operating platform. Our diverse product offerings allow us to better serve our customers by providing a solution that fits their particular financial needs.
In 2011, newly piloted offerings included a revamped tax preparation service which, in most states in which it was offered, was coupled with a lending feature, and an automotive insurance product. In addition to product expansion, we have focused on channel expansion. During 2011, we expanded our call-center capabilities to enable direct-to-consumer marketing. The acquisition of DFS provides us with an Internet channel to serve customers.
Track Record of Flexible and Innovative Execution. Historically, we have proactively and successfully responded to legislative developments in the jurisdictions in which we operate and have continued to offer innovative products that meet our customers' financial needs. In states where the market has been impacted by disruptive legislative developments, we have generally been able to utilize our execution capabilities to modify and introduce products that comply with the applicable legislative frameworks but preserve, to the greatest extent possible, our financial performance. We have not exited any geographic markets as a result of regulatory changes, although we have ceased offering short-term loans to members of the U.S. military as a result of Department of Defense regulations and to residents of Arizona as a result of a change in the law in Arizona. Despite recent changes in the regulatory regimes in a number of the states in which we operate, from 2009 to 2011, we grew revenue and Adjusted EBITDA at compound annual growth rates of 23.1% and 21.3%, respectively.
Scalable IT Infrastructure and Compliance Focus. We have committed significant resources to develop a scalable technology platform capable of supporting significant growth. Our point-of-sale, or POS, systems and collections and accounting systems interface with each other, allowing close monitoring of store performance and collections while also providing real-time reporting capabilities.
9
Our IT infrastructure enables us to centrally control and implement changes to consumer loan agreement terms or Truth-in-Lending disclosures required by statutory or regulatory developments. We utilize our scalable IT infrastructure with robust internal compliance systems and audit teams, which regularly evaluate each store to confirm strict adherence to applicable laws and regulations and test store-based systems that are in place to detect and prevent fraudulent activities. Our Chief Compliance and Technology Officer serves as an executive level officer and is actively involved in the process of developing new products and bringing them to market. The acquisition of DFS, an e-commerce company, provides us additional scalable IT competencies, including systematic risk-management tools, which can be applied across our business.
Experienced and Innovative Management Team. Our management team consists of individuals highly experienced in the short-term consumer loan, check cashing and prepaid debit card industries, as well as other financial and retail-based businesses. Ted Saunders, our Chief Executive Officer, who has been with us for 5 years and was promoted from Chief Financial Officer to Chief Executive Officer in 2008, has managed all areas of operations and finance during his tenure. Kyle Hanson, our President, has been with us for 13 years and was previously a District Manager, Regional Manager and then our Vice-President of Store Operations before assuming his current position. Our Chief Compliance and Technology Officer, Chad Streff, has been with us for 10 years. Michael Durbin, our Chief Financial Officer, joined us in 2008. Additionally, since its initial investment in 2006, Diamond Castle Holdings LLC, or Diamond Castle, and its board designees have provided us with valuable operational and strategic experience and insight. Our Chairman, H. Eugene Lockhart, has substantial experience in retail financial services and card products and services, having previously served as President of the Global Retail Bank at Bank of America, President and Chief Executive Officer of MasterCard International and Chairman of NetSpend Corporation.
Our goal is to be the provider of choice for retail consumer finance products in each of the markets in which we operate. Our strategy is to capitalize on our competitive strengths to increase our revenues, profitability and cash flow through (1) advancing our retail strategies with innovative products and services, (2) executing on strategic accretive acquisitions and organic growth and (3) continuing to diversify through product, geographic and retail channel expansion.
Advancing our retail strategies with innovative products and services. We believe we achieve superior per store metrics by successfully executing customer-centric retailing. In striving to satisfy our customers' financial service needs, we continue to expand our product and service offerings. This expansion in products and services is evident in the growth of title loans, which represented 6.1% of revenue in 2011 versus only 3.5% in 2009, and in the growth of prepaid debit card products and services, which represented 6.5% of revenue in 2011 versus only 1.0% in 2009. The launch of prepaid debit card products in our stores, which offer an increasingly popular alternative to cash for our customers, has been highly successful to date, and we anticipate positioning our card products as a central platform to address our customers' wide range of financial needs. In addition, during 2011, we successfully piloted a tax preparation service, which was coupled with a lending feature in most states in which it was offered, and began piloting an automotive insurance product. We intend to continue to evaluate and offer new products and services to meet the needs of our customers and to increase customer loyalty and our market share. We believe that our retailing expertise, together with our scalable infrastructure, provide us with the ability to innovate in product development by introducing new products or adapting and evolving current products and services to respond to consumer demand or potential regulatory changes.
Executing on strategic accretive acquisitions and organic growth. We believe that opportunistic and strategic accretive acquisitions of stores, loan portfolios and customer lists will allow us to continue to expand into new markets, increase our presence in existing markets and grow transaction volume in
10
existing stores. CCCS is a recent example of an acquisition that we believe positions us for continued growth. The combination of CCCS with CheckSmart provided us with a unique opportunity to expand our market presence in California through an established platform that shared many of CheckSmart's operating practices and philosophies, including a customer service-oriented retail business model, diverse product offerings, attractive and prominent real estate and comprehensive information technology infrastructure. We believe the California market offers a stable regulatory environment for our products and services, as California's enabling legislation has remained substantially unchanged since its passage 15 years ago. In combining CCCS's 114 Northern California stores with CheckSmart's existing 17 Northern California stores, we believe we are the alternative financial services market leader in Northern California by store count, with a combined population of approximately 14.3 million in the Northern California markets we serve. We have introduced elements of CheckSmart's retail model within CCCS's operations. In December of 2011, we completed the consolidation of the corporate headquarters facility to achieve operational efficiencies. Revenues from the stores acquired in the California Acquisition grew 9.8% during the fourth quarter of 2011 as compared to the fourth quarter of 2010. We also anticipate introducing certain other of our best practices at existing CCCS stores in order to enhance further the CCCS store base, particularly in the areas of consumer lending and prepaid debit card products. We believe that we will be able to further increase store volume in CCCS stores, bringing store-level performance closer to the performance we have historically experienced across the rest of our store portfolio.
The market in which we operate is fragmented. We believe compliance demands and competitive pressures will continue to encourage weaker competitors to exit the market. We intend to continue to expand our network of stores opportunistically through strategic acquisitions in our current markets, as well as in new domestic and, possibly, international markets. In the past, we have opportunistically acquired loan portfolios and customer lists from small competitors, and we will continue to evaluate these opportunities in the future as an efficient means of growing transaction volume in our existing stores and delivering our full suite of services to a broader customer base. We believe that our scalable infrastructure and acquisition platform enables us to successfully integrate and improve the operations of stores that we acquire. At the stores we acquired in Alabama and Michigan, we were able to substantially improve store level operating profit during the first year following each acquisition. For the year ended December 31, 2011, the revenues from the stores acquired through the Michigan and Alabama Acquisitions increased by more than 26% compared to the prior year. We intend to use our experience in implementing best practices to continue to improve the financial performance of acquired stores.
In select markets that we believe represent unique growth opportunities, we will continue to open new stores. These will typically be to fill-in markets, to improve our market presence or to pursue niche opportunities.
Continuing to diversify through product, geographic, and retail channel expansion. The segment of the market we serve is large and growing. The National Bureau of Economic Research reports that half of the Americans surveyed reported that it is unlikely they would be able to gather $2,000 to cover a financial emergency, even if given a month to obtain funds. We believe there is an opportunity to provide these potential customers with multiple financial products and services through the channel of their preference. At December 31, 2008, we operated through 252 retail branches in 11 states. At December 31, 2011, we operated through 435 retail branches in 14 states, serviced customers through a
11
call center and delivered products through a prepaid card offered by Insight. Our objective is to continue to expand the products and services we offer this growing market segment as well as the geography and channels through which they are offered, as evidenced by our acquisition of the DFS Companies.
Founded in 2004, Diamond Castle is a leading private equity investment firm with over $1.85 billion of capital under management. The Diamond Castle partners have an established history of successful investing at DLJ Merchant Banking Partners dating back to the early 1990s. The firm invests across a range of industries, with particular focus on the financial services, energy and power, and healthcare sectors. The Community Choice Financial investment was led by H. Eugene Lockhart, the former Chairman of Financial Institutions at Diamond Castle, President of the Global Retail Bank at Bank of America, CEO of MasterCard International and Chairman of NetSpend Corporation. In addition to Community Choice Financial, Diamond Castle's current portfolio of companies includes Alterra Capital, EverBank Financial, Beacon Health Strategies, Managed Health Care Associates, KDC Solar and Professional Directional. Upon completion of this offering, Diamond Castle will beneficially own approximately 25.8% of our outstanding common shares, or approximately 20.8% of our outstanding common shares if the underwriters fully exercise their overallotment option.
Community Choice Financial Inc. was formed on April 6, 2011 under the laws of the State of Ohio by the shareholders of CheckSmart Financial Holdings Inc. to be the holding company of CheckSmart Financial Holdings Corp. and to acquire the ownership interests of CCCS Corporate Holdings, Inc. through a merger. CCFI acquired CCCS through a merger on April 29, 2011. As of December 31, 2011, we owned and operated 435 stores in 14 states. We are primarily engaged in the business of providing consumer retail financial services and have grown from 179 stores in April 2006, when Diamond Castle purchased a majority interest in CheckSmart.
Our corporate offices are located at 7001 Post Road, Suite 200, Dublin, Ohio 43016. Our telephone number is (614) 798-5900 and our website is located at www.ccfi.com. Information appearing on or accessible through our website is not part of this prospectus.
12
Common shares offered by us |
10,666,667 common shares | |
Common shares to be outstanding after this offering |
18,648,203 common shares |
|
Option to purchase additional shares |
We and the selling shareholders have granted the underwriters an option for a period of 30 days to purchase up to an aggregate of an additional 1,600,000 common shares. |
|
Use of proceeds |
We estimate that the net proceeds to us of this offering, after deducting the underwriting discount and estimated offering expenses, will be approximately $106.8 million. We intend to use the net proceeds to fund acquisitions, including the Florida Acquisition, to pay a termination fee of approximately $5.8 million under our management agreement and for general corporate purposes, which may include redeeming up to $39.5 million aggregate principal amount of our senior notes. We will not receive any of the proceeds from the sale of common shares by the selling shareholders in connection with any exercise of the underwriters' overallotment option. However, we will receive net proceeds of approximately $2.0 million if the underwriters exercise their overallotment option in full, prior to giving effect to the payment of $5.2 million to management referred to under the heading "Management's Discussion and Analysis of Financial Condition and Results of Operations—Contractual Obligations and Commitments". See "Use of Proceeds". |
|
Dividend policy |
We do not expect to pay dividends on our common shares in the foreseeable future. Our future decisions concerning the payment of dividends on our common shares will depend upon our results of operations, financial condition, contractual obligations, business prospects and capital expenditure plans, as well as any other factors that our board of directors may consider relevant. See "Dividend Policy". |
|
Proposed Nasdaq Global Market symbol |
We have applied to list our common shares on The Nasdaq Global Market under the symbol "CCFI". |
|
Risk factors |
See "Risk Factors" beginning on page 23 and other information included in this prospectus for a discussion of factors you should carefully consider before deciding whether to invest in our common shares. |
13
Unless otherwise indicated, this prospectus:
- •
- assumes no exercise of the underwriters' option to purchase up to an aggregate of additional common shares
from us and the selling shareholders;
- •
- assumes an initial public offering price of $11.00 per share, the midpoint of the estimated offering range set forth on
the cover of this prospectus;
- •
- reflects a six-for-one share split with respect to our common shares;
- •
- does not reflect a total of 35,130 restricted stock units, which vest in three equal annual installments beginning on
February 14, 2013;
- •
- does not reflect a total of 1,577,004 common shares underlying employee equity grants; and
- •
- does not reflect 312,768 additional common shares reserved for issuance under our equity compensation plan.
14
SUMMARY HISTORICAL CONSOLIDATED FINANCIAL DATA
The following table sets forth CCFI's summary historical consolidated financial and other data, as of December 31, 2010 and 2011 and for the years ended December 31, 2009, 2010 and 2011. The summary historical financial and other data as of December 31, 2010 and 2011 and for each of the years ended December 31, 2009, 2010 and 2011 have been derived from, and should be read together with, CCFI's audited historical consolidated financial statements and the accompanying notes included elsewhere in this prospectus.
You should read the following information in conjunction with "Capitalization" and "Management's Discussion and Analysis of Financial Condition and Results of Operations" and CCFI's consolidated financial statements and related notes included elsewhere in this prospectus.
| |
Year Ended December 31, | |||||||||||
|---|---|---|---|---|---|---|---|---|---|---|---|---|
(In thousands)
|
2009 | 2010 | 2011 | |||||||||
Revenues: |
||||||||||||
Finance receivable fees |
$ | 136,957 | $ | 146,059 | $ | 196,153 | ||||||
Check cashing fees |
53,049 | 55,930 | 72,800 | |||||||||
Card fees |
2,063 | 10,731 | 19,914 | |||||||||
Other |
10,614 | 11,560 | 18,067 | |||||||||
Total revenues |
202,683 | 224,280 | 306,934 | |||||||||
Branch expenses: |
||||||||||||
Salaries and benefits |
34,343 | 38,759 | 57,411 | |||||||||
Provision for loan losses |
43,463 | 40,316 | 65,351 | |||||||||
Occupancy |
13,855 | 14,813 | 21,216 | |||||||||
Depreciation and amortization |
6,613 | 5,318 | 5,907 | |||||||||
Other |
22,652 | 27,994 | 35,515 | |||||||||
Total branch expenses |
120,926 | 127,200 | 185,400 | |||||||||
Branch gross profit |
81,757 | 97,080 | 121,534 | |||||||||
Corporate expenses |
31,518 | 33,940 | 44,742 | |||||||||
Transaction expense |
— | 237 | 9,351 | |||||||||
Depreciation and amortization |
568 | 1,222 | 2,332 | |||||||||
Interest expense, net |
11,532 | 8,501 | 34,334 | |||||||||
Equity investment loss |
— | — | 415 | |||||||||
Nonoperating income, management fees |
(172 | ) | (46 | ) | (46 | ) | ||||||
Income before income taxes and discontinued operations |
38,311 | 53,226 | 30,406 | |||||||||
Provision for income taxes |
14,042 |
19,801 |
13,553 |
|||||||||
Income from continuing operations |
24,269 | 33,425 | 16,853 | |||||||||
Discontinued operations (net of provision (benefit) for income tax of $226, ($1,346) and $0) |
368 |
(2,196 |
) |
— |
||||||||
Net income |
24,637 | 31,229 | 16,853 | |||||||||
Net loss attributable to non-controlling interests |
— |
(252 |
) |
(120 |
) |
|||||||
Net income attributable to controlling interests |
$ | 24,637 | $ | 31,481 | $ | 16,973 | ||||||
15
| |
Year Ended December 31, | |||||||||||
|---|---|---|---|---|---|---|---|---|---|---|---|---|
(In thousands, except per share and share amounts)
|
2009 | 2010 | 2011 | |||||||||
Earnings per share—basic |
||||||||||||
Operating income available to controlling interests—per share |
$ | 3.95 | $ | 5.49 | $ | 2.30 | ||||||
Discontinued operations—per share |
0.06 | (0.36 | ) | — | ||||||||
Net income available to controlling interests—per share |
$ | 4.01 | $ | 5.13 | $ | 2.30 | ||||||
Earnings per share—diluted |
||||||||||||
Operating income available to controlling interests—per share |
$ | 3.88 | $ | 5.33 | $ | 2.21 | ||||||
Discontinued operations—per share |
0.06 | (0.34 | ) | — | ||||||||
Net income available to controlling interests—per share |
$ | 3.94 | $ | 4.99 | $ | 2.21 | ||||||
Weighted average common shares outstanding—basic |
6,139,536 | 6,139,536 | 7,380,996 | |||||||||
Weighted average common shares outstanding—diluted |
6,251,316 | 6,314,358 | 7,686,072 | |||||||||
| |
Year Ended December 31, | |||||||||
|---|---|---|---|---|---|---|---|---|---|---|
(In thousands, except for stores data, averages, percentages or unless otherwise specified) |
2009 | 2010 | 2011 | |||||||
Balance Sheet Data (at period end): |
||||||||||
Cash and cash equivalents |
$ | 27,959 | $ | 39,780 | $ | 65,635 | ||||
Finance receivables, net |
66,035 | 81,337 | 120,451 | |||||||
Total assets |
280,476 | 310,644 | 515,547 | |||||||
Total debt |
193,365 | 188,934 | 395,000 | |||||||
Total stockholders' equity |
77,791 | 109,791 | 61,314 | |||||||
Other Operating Data (unaudited): |
||||||||||
Number of stores (at period end) |
264 | 282 | 435 | |||||||
Short-term consumer loans data: |
||||||||||
Loan volume |
$ | 1,162,086 | $ | 1,237,163 | $ | 1,543,310 | ||||
Number of loans |
2,816 | 2,956 | 3,625 | |||||||
Average new loan size |
$ | 412.67 | $ | 418.53 | $ | 425.72 | ||||
Average new loan fee |
$ | 42.79 | $ | 43.14 | $ | 46.37 | ||||
Loan loss provision |
$ | 28,856 | $ | 27,560 | $ | 40,636 | ||||
Loan loss provision as a percentage of volume |
2.5 | % | 2.2 | % | 2.6 | % | ||||
Check cashing data: |
||||||||||
Face amount of checks cashed |
$ | 1,309,425 | $ | 1,442,501 | $ | 2,163,276 | ||||
Number of checks cashed |
3,029 | 3,292 | 4,869 | |||||||
Face amount of average check |
$ | 432.08 | $ | 438.13 | $ | 444.26 | ||||
Average fee per check |
$ | 17.51 | $ | 16.99 | $ | 14.95 | ||||
Returned check expense |
$ | 3,058 | $ | 3,034 | $ | 5,085 | ||||
Returned check expense as a percentage of face amount of checks cashed |
0.2 | % | 0.2 | % | 0.2 | % | ||||
16
| |
Year Ended December 31, | |||||||||
|---|---|---|---|---|---|---|---|---|---|---|
(In thousands, except for stores data, averages, percentages or unless otherwise specified) |
2009 | 2010 | 2011 | |||||||
Medium-term loan data:(1) |
||||||||||
Principal outstanding |
$ | 3,109 | $ | 3,601 | $ | 12,174 | ||||
Number of loans outstanding |
9,365 | 10,275 | 20,818 | |||||||
Average principal outstanding |
$ | 331.97 | $ | 350.47 | $ | 584.79 | ||||
Average monthly percentage rate |
22.3 | % | 22.0 | % | 19.2 | % | ||||
Allowance as a percentage of finance receivable |
42.7 | % | 11.7 | % | 10.6 | % | ||||
Loan loss provision |
$ | 6,708 | $ | 5,267 | $ | 11,470 | ||||
Title loan data: |
||||||||||
Principal outstanding |
$ | 6,047 | $ | 9,541 | $ | 17,334 | ||||
Number of loans outstanding |
6,077 | 9,597 | 15,283 | |||||||
Average principal outstanding |
$ | 995.00 | $ | 994.12 | $ | 1,134.20 | ||||
Average monthly percentage rate |
16.0 | % | 13.8 | % | 13.3 | % | ||||
Allowance as a percentage of finance receivable |
12.1 | % | 5.3 | % | 5.3 | % | ||||
Loss loss provision |
$ | 2,970 | $ | 3,497 | $ | 5,463 | ||||
Overall company data: |
||||||||||
Total revenues |
$ | 202,683 | $ | 224,280 | $ | 306,934 | ||||
Loan loss provisions |
41,592 | 39,358 | 62,654 | |||||||
Other ancillary product provisions |
1,871 | 958 | 2,697 | |||||||
Total loan loss provision |
$ | 43,463 | $ | 40,316 | $ | 65,351 | ||||
Total loan loss provision as a percentage of revenue |
21.4 | % | 18.0 | % | 21.3 | % | ||||
Other Financial Data (unaudited): |
||||||||||
EBITDA(2) |
$ | 57,392 | $ | 66,071 | $ | 72,979 | ||||
Adjusted EBITDA(2) |
59,421 | 72,012 | 86,807 | |||||||
Capital expenditures |
2,769 | 1,688 | 4,261 | |||||||
- (1)
- Loan
participations are grouped with medium-term loans in our consolidated financial statements included elsewhere in this prospectus, but are excluded from
these calculations.
- (2)
- EBITDA
is defined as net income (loss) plus provision for income taxes, net interest expense, and depreciation and amortization. Adjusted EBITDA represents
EBITDA as adjusted for certain items described in the table below.
- EBITDA
is presented because we believe it is useful to investors as a widely accepted financial indicator of our operating performance. We
utilize EBITDA frequently in our decision-making because we believe it provides meaningful information regarding our operating performance and facilitates comparisons to our historical operating
results.
- We
also use, and we believe investors also benefit from the presentation of, Adjusted EBITDA to assess our operating performance. Adjusted
EBITDA excludes net income (loss) attributable to non-controlling interests and certain expenses that we do not consider indicative of our ongoing performance, and therefore we believe that Adjusted
EBITDA makes it easier for investors and others to evaluate our results on a normalized basis and to compare our operating results from period to period.
- EBITDA
and Adjusted EBITDA are not defined under United States generally accepted accounting principles, or GAAP, should not be considered in
isolation or as a substitute for measures of our performance prepared in accordance with GAAP and are not indicative of income from operations as determined under GAAP. Because not all companies use
identical calculations, the presentation of EBITDA and Adjusted EBITDA may not be comparable to other similarly titled measures of other companies.
17
- The following table provides an unaudited reconciliation of net income (loss) to EBITDA and Adjusted EBITDA:
| |
Year Ended December 31, | ||||||||||
|---|---|---|---|---|---|---|---|---|---|---|---|
| |
2009 | 2010 | 2011 | ||||||||
| |
(In thousands) |
||||||||||
Net income |
$ | 24,637 | $ | 31,229 | $ | 16,853 | |||||
Provision for income taxes |
14,042 | 19,801 | 13,553 | ||||||||
Interest expense, net |
11,532 | 8,501 | 34,334 | ||||||||
Depreciation and amortization (Branch) |
6,613 | 5,318 | 5,907 | ||||||||
Depreciation and amortization (Corporate) |
568 | 1,222 | 2,332 | ||||||||
EBITDA |
57,392 | 66,071 | 72,979 | ||||||||
Discontinued operations(a) |
(368 | ) | 2,196 | — | |||||||
Diamond Castle management fee(b) |
833 | 1,184 | 1,381 | ||||||||
Diamond Castle collateral fee(c) |
— | 400 | 107 | ||||||||
Transaction expenses(d) |
— | 237 | 9,351 | ||||||||
Non-controlling interest(e) |
— | 252 | — | ||||||||
Non-cash loss(f) |
361 | — | 34 | ||||||||
Non-cash compensation(g) |
1,057 | 338 | 105 | ||||||||
Ohio DIT tax(h) |
146 | 105 | 144 | ||||||||
Non-recurring legal settlement(i) |
— | 900 | — | ||||||||
Latin Card consolidated loss(j) |
— | 329 | 911 | ||||||||
Insight Card equity investment loss(k) |
— | — | 159 | ||||||||
Lease adjustment(l) |
— | — | 678 | ||||||||
One-time compensation charge(m) |
— | — | 49 | ||||||||
CCCS corporate closure(n) |
— | — | 411 | ||||||||
CCCS Integration costs(o) |
— | — | 498 | ||||||||
Adjusted EBITDA |
$ | 59,421 | $ | 72,012 | $ | 86,807 | |||||
- (a)
- Reflects
results, net of tax, of our discontinued Florida commercial check cashing business. See "Management's Discussion and Analysis of Financial
Condition and Results of Operations—Discontinued Operations".
- (b)
- Represents
fees paid by us to Diamond Castle. The management agreement will be terminated upon completion of this offering and a termination fee will be
paid using a portion of the proceeds from this offering. See "Use of Proceeds" and "Certain Relationships and Related Party Transactions".
- (c)
- Represents
fees paid by us to Diamond Castle with respect to an arrangement of treasury management services.
- (d)
- Represents
legal and due diligence expenses incurred in connection with acquisitions.
- (e)
- Represents
the non-controlling interest's share of a consolidated subsidiary's net loss.
- (f)
- Represents
non-cash loss on properties sold by us.
- (g)
- Represents
non-cash compensation expense incurred in connection with employee equity grants.
- (h)
- Represents Ohio's Dealer Intangibles tax, which is a replacement for the franchise tax that is not accounted for as income tax in our consolidated financial statements.
18
- (i)
- Represents
amounts reserved in connection with the anticipated settlement of litigation in California stemming from employee claims under California law.
See "Business—Legal Proceedings".
- (j)
- Represents
results attributable to Latin Card Strategy, LLC, or Latin Card, an entity which we formerly consolidated for purposes of our financial
statements prior to March 31, 2011. In May 2011, we decreased our ownership interest in Latin Card to 49% and no longer consolidate the results of this entity for purposes of our financial
statements.
- (k)
- Represents
results attributable to the investment in Insight Holding, in which we acquired a 22.5% interest on November 11, 2011.
- (l)
- Represents
non-cash expense recognized for deferred rent as it relates to escalation of rent payments.
- (m)
- Represents
severance payments to CCCS employees terminated as a result of the California Acquisition.
- (n)
- Represents
the lease termination accrual and severance related to closing the CCCS corporate office in December 2011.
- (o)
- Represents costs for activities directly related to the integration of the California Acquisition, including information technology, accounting and training expenses.
19
SUMMARY UNAUDITED PRO FORMA CONSOLIDATED FINANCIAL INFORMATION
The pro forma information set forth below gives effect to the California Acquisition, the Illinois Acquisition, the senior notes offering, the establishment of our revolving credit facility and this offering, as if they had each occurred on January 1, 2011. We have derived the pro forma consolidated financial data for the year ended December 31, 2011 by calculating the historical consolidated financial data for the period ended December 31, 2011 for CCFI and for the period ended April 29, 2011 for CCCS, the date of the California Acquisition, and then applying pro forma adjustments to give effect to such transactions. The pro forma information is unaudited, is for informational purposes only and is not necessarily indicative of what our financial position or results of operations would have been had such transactions been completed as of the dates indicated and does not purport to represent what our results of operations might be for any future period.
The following summary pro forma consolidated financial data should be read in conjunction with "Selected Historical Consolidated Financial Data", "Unaudited Pro Forma Consolidated Financial Information", "Use of Proceeds", "Management's Discussion and Analysis of Financial Condition and Results of Operations", and the consolidated financial statements of CCFI and CCCS and the accompanying notes thereto included elsewhere in this prospectus.
(In thousands)
|
Year Ended December 31, 2011 |
||||||
|---|---|---|---|---|---|---|---|
Revenue: |
|||||||
Finance receivable fees |
$ | 208,093 | |||||
Check cashing fees |
82,272 | ||||||
Card fees |
20,611 | ||||||
Other |
21,751 | ||||||
Total revenue |
332,727 | ||||||
Salaries and benefits |
65,286 | ||||||
Provision for loan losses |
67,832 | ||||||
Occupancy |
24,207 | ||||||
Depreciation and amortization |
6,050 | ||||||
Other |
37,653 | ||||||
Total branch expenses |
201,028 | ||||||
Branch gross profit |
131,699 |
||||||
Corporate Expenses |
45,510 |
||||||
Depreciation and amortization |
3,407 | ||||||
Interest expense, net |
40,706 | ||||||
Goodwill impairment |
28,986 | ||||||
Equity investment loss |
415 | ||||||
Non-operating income, mgmt fees |
(46 | ) | |||||
Income before taxes and discontinued operations |
12,721 | ||||||
Provision for income taxes |
4,834 | ||||||
Total net income |
7,887 | ||||||
Pro Forma EBITDA(1) |
62,884 |
||||||
Pro Forma Adjusted EBITDA(1) |
$ |
98,148 |
|||||
- (1)
- Pro Forma EBITDA is defined as pro forma net income plus provision for income taxes, net interest expense, and depreciation and amortization. Pro Forma Adjusted EBITDA represents Pro Forma EBITDA adjusted for certain items described in the table below.
20
EBITDA (including Pro Forma EBITDA) is presented because we believe it is useful to investors as a widely accepted financial indicator of our operating performance. We utilize EBITDA frequently in our decision-making because it provides meaningful information regarding our operating performance and facilitates comparisons to our historical operating results.
We also use, and we believe investors also benefit from the presentation of, Adjusted EBITDA (including Pro Forma Adjusted EBITDA) to assess our operating performance. Adjusted EBITDA excludes net income (loss) attributable to non-controlling interests and certain expenses that we do not consider indicative of our ongoing performance, and therefore we believe that Adjusted EBITDA makes it easier for investors and others to evaluate our results on a normalized basis and to compare our operating results from period to period.
Pro Forma EBITDA and Pro Forma Adjusted EBITDA are not defined under GAAP, should not be considered in isolation or as a substitute for measures of our performance prepared in accordance with GAAP and are not indicative of income from operations as determined under GAAP. Because not all companies use identical calculations, the presentation of EBITDA and Adjusted EBITDA (including such measures presented on a Pro Forma basis) may not be comparable to other similarly titled measures of other companies.
The following table provides an unaudited reconciliation of pro forma net income to Pro Forma EBITDA and Pro Forma Adjusted EBITDA for the year ended December 31, 2011:
(In thousands)
|
Year Ended December 31, 2011 |
|||||
|---|---|---|---|---|---|---|
Pro Forma Net Income |
$ | 7,887 | ||||
Depreciation and amortization |
9,457 | |||||
Interest expense, net |
40,706 | |||||
Provision for income taxes |
4,834 | |||||
Pro Forma EBITDA |
62,884 | |||||
Adjustments to Pro Forma EBITDA |
||||||
Latin card(a) |
911 | |||||
Loss on disposition of assets(b) |
34 | |||||
Diamond Castle collateral fee(c) |
107 | |||||
Non-cash compensation(d) |
105 | |||||
Ohio DIT tax(e) |
144 | |||||
One-time compensation charges(f) |
49 | |||||
Insight Card equity investment loss(g) |
159 | |||||
Lease adjustment(h) |
678 | |||||
California Acquisition provision adjustment(i) |
1,150 | |||||
Goodwill and intangible assets impairment(j) |
28,986 | |||||
CCCS corporate closure(k) |
411 | |||||
CCCS integration costs(l) |
498 | |||||
CCCS closure cost savings(m) |
2,032 | |||||
Total Adjustments to EBITDA |
35,264 | |||||
Pro Forma Adjusted EBITDA |
$ |
98,148 |
||||
- (a)
- Represents results attributable to Latin Card, an entity which we formerly consolidated for purposes of our financial statements prior to March 31, 2011. In May 2011, we decreased our ownership in Latin Card to 49% and no longer consolidate the results of this entity for purposes of our financial statements.
21
- (b)
- Represents
non-cash loss on properties sold by us.
- (c)
- Represents
fees paid by us to Diamond Castle with respect to an arrangement of treasury management services.
- (d)
- Represents
non-cash compensation expense in connection with employee equity grants.
- (e)
- Represents
Ohio's Dealer Intangibles tax, which is replacement for the franchise tax that is not accounted for as income tax in our consolidated financial
statements.
- (f)
- Represents
severance payments to CCCS's employees as the result of the California Acquisition.
- (g)
- Represents
equity in investee losses from the date of our investment in Insight Holding to December 31, 2011.
- (h)
- Represents
non-cash expense recognized for deferred rent as it relates to escalation of rent payments.
- (i)
- Represents
a one-time adjustment in connection with the California Acquisition to expense returned checks and loans past due, in each case for CCCS, in
order to conform with our accounting policies related to chargeoffs.
- (j)
- Represents
impairments of intangible assets associated with CCCS as of March 31, 2011, comprising a $24.1 million impairment of goodwill and a
$4.9 million impairment of trademarks. These impairments were determined using cash flow analysis and other relevant factors and were tested when the California Acquisition value indicated
potential impairment.
- (k)
- Represents
the lease termination accrual and severance related to closing the CCCS corporate office in December of 2011.
- (l)
- Represents
costs for activities directly related to the integration of the California Acquisition, including information technology, accounting and training
expenses.
- (m)
- Represents the full-year effect of costs eliminated as a result of closure of CCCS's corporate office. We closed the office on December 31, 2011, eliminating inefficiencies by consolidating these operations into CCFI headquarters in Dublin, Ohio.
22
An investment in our common shares involves a significant degree of risk. Prior to making an investment decision, you should carefully consider, along with other information set forth in this prospectus, the following risk factors. The following risks and uncertainties could materially adversely affect our business, financial condition or operating results. In this event, the trading price of our common shares could decline, and you could lose part or all of your investment.
Risks Related to Our Business
We are subject to regulation at both the state and federal levels that is subject to varying interpretations, and our failure to comply with applicable regulations could result in significant liability to us as well as significant additional costs to bring our business practices into compliance.
Our business and products are subject to extensive regulation by state, federal and local governments that may impose significant costs or limitations on the way we conduct or expand our business. In general, these regulations are intended to protect consumers and not our shareholders. See "Business—Regulation and Compliance" for a discussion of the regulatory environment in which we operate.
These regulations include those relating to:
- •
- usury, interest rates and fees;
- •
- deferred presentment/small denomination lending, including terms of loans (such as maximum rates, fees and amounts and
minimum durations); limitations on renewals and extensions; and disclosures;
- •
- licensing and posting of fees;
- •
- lending practices, such as Truth-in-Lending;
- •
- unfair, deceptive and abusive acts and practices in consumer transactions;
- •
- check cashing;
- •
- money transmission;
- •
- currency and suspicious activity recording and reporting;
- •
- privacy of personal consumer information; and
- •
- prompt remittance of excess proceeds for the sale of repossessed automobiles in certain states in which we operate as a title lender.
Most state laws that specifically regulate our products and services establish allowable fees, interest rates and other financial terms. In addition, many states regulate the maximum amount, maturity, frequency and renewal or extension terms of the loans we provide, as well as the number of simultaneous or consecutive loans. The terms of our products and services vary from state to state in order to comply with the specific laws and regulations of those states.
Our business is also regulated at the federal level. Our lending, like our other activities, is subject to routine oversight by the Federal Trade Commission, or FTC, and, effective July 2011 and as discussed in more detail below, is also subject to supervision by the Consumer Financial Protection Bureau, or CFPB. See "—The Dodd-Frank Act authorizes the newly created CFPB to adopt rules that could potentially have a serious impact on our ability to offer short-term consumer loans and it also empowers the CFPB and state officials to bring enforcement actions against companies that violate federal consumer financial laws."
23
In addition, our lending activities are subject to disclosure and non-discrimination requirements, including under the federal Truth-in-Lending Act, Regulation Z adopted under that Act and the Equal Credit Opportunity Act, as well as requirements governing electronic payments and transactions, including the Electronic Funds Transfer Act. In 2007, the U.S. Congress effectively prohibited lenders from making certain short-term consumer loans to members of the U.S. military, active-duty reservists and National Guard, and their respective dependents. Our operations are also subject to the rules and oversight of the Internal Revenue Service and U.S. Treasury related to the Bank Secrecy Act and other anti-money laundering laws and regulations, as well as the privacy and data security regulations under the Gramm-Leach-Bliley Act.
Statutes authorizing consumer loans and similar products and services, such as those we provide, typically provide the state agencies that regulate banks and financial institutions or similar state agencies with significant regulatory powers to administer and enforce the law. In most jurisdictions, we are required to apply for a license, file periodic written reports regarding business operations, and undergo comprehensive examinations or audits from time to time to assess our compliance with applicable laws and regulations.
State attorneys general and financial services regulators scrutinize our products and services and could take actions that may require us to modify, suspend, or cease operations in their respective states. We regularly receive, as part of comprehensive state examinations or audits or otherwise, comments from state attorneys general and financial services regulators about our business operations and compliance with state laws and regulations. These comments sometimes allege violations of, or deficiencies in complying with, applicable laws and regulations. While we have resolved most such allegations promptly and without penalty, we operate in a large number of jurisdictions with varying requirements and we cannot anticipate how state attorneys general and financial services regulators will scrutinize our products and services or the products and services of our industry in the future. If we fail to resolve future allegations satisfactorily, there is a risk that we could be subject to significant penalties, including material fines, or that we may lose our licenses to operate in certain jurisdictions.
Regulatory authorities and courts have considerable discretion in the way they interpret licensing and other statutes under their jurisdiction and may seek to interpret or enforce existing regulations in new ways. If we fail to observe, or are not able to comply with, applicable legal requirements (as such requirements may be interpreted by courts or regulatory authorities), we may be forced to modify or discontinue certain product service offerings or to invest additional amounts to bring our product service offerings into compliance, which could adversely impact our business, results of operations and financial condition. In addition, in some cases, violation of these laws and regulations could result in fines, penalties and other civil and/or criminal penalties. For example, state laws may require lenders that charge interest at rates considered to be usurious or that otherwise violate the law to pay a penalty equal to the principal and interest due for a given loan or loans or a multiple of the finance charges assessed. Depending on the nature and scope of a violation, fines and other penalties for non-compliance of applicable requirements could be significant and could have a material adverse effect on our business, results of operation and financial condition.
In states in which we are licensed to operate, we must comply with all applicable license requirements, including those concerning direct or indirect changes in control of the licensed entities. Most states in which we conduct licensed operations impose requirements related to changes in control of licensed entities or changes of officers of licensed entities or of controlling entities of licensed entities. There is a risk that state agencies responsible for licensing our operations may, as a result of this offering, impose unexpected requirements related to the change of control of the Company or its subsidiaries. Any such unexpected requirements in any state, if imposed, could result in delays or limitations on our operations in that state.
24
Changes in applicable laws and regulations, including adoption of new laws and regulations, governing consumer protection, lending practices and other aspects of our business could have a significant adverse impact on our business, results of operations, financial condition or ability to meet our obligations, or make the continuance of our current business impractical, unprofitable or impossible.
We are subject to the risk that the laws and regulations governing our business are subject to change. State legislatures, the U.S. Congress, and various regulatory bodies may adopt legislation, regulations or rules that could negatively affect our results of operations or make the continuance of our current business impractical, unprofitable or impossible.
For instance, at the federal level, bills were introduced in Congress in 2008 and 2009 that would have placed a federal cap of 36% on the APR applicable to all consumer loan transactions. Another bill directed at payday loans would have placed a 15-cent-per-dollar borrowed ($0.15/$1.00) cap on fees for cash advances, banned rollovers (which is a practice that allows consumers to pay a fee to extend the term of a payday or other short-term loan), and required us to offer an extended payment plan that would have severely restricted many of our payday lending products. Consumer advocacy groups and other opponents of payday and title lending are likely to continue their efforts before Congress, state legislatures and, now, the CFPB, to adopt laws or promulgate rules that would severely limit, if not eliminate, such loans.
Various states have also enacted or considered laws and regulations that could affect our business. Since July 1, 2007, several states in which we operate, including Florida, Illinois, Indiana, Kentucky, Ohio, and Virginia, have enacted laws (or in the case of Arizona, allowed the deferred presentment law to expire) that have impacted our short-term consumer loan business by adversely modifying or eliminating our ability to offer the loan products we previously offered in our stores in those jurisdictions. Recent state legislation has included the adoption of maximum APRs at rates well below a rate at which short-term consumer lending is profitable, the implementation of statewide consumer databases combined with the adoption of rules limiting the maximum number of payday or other short-term consumer loans any one customer can have outstanding at one time or in the course of a given period of time, the adoption of mandatory cooling-off periods for consumer borrowers and the implementation of mandatory and frequently cost-free installment repayment plan options for borrowers who request them, who default on their loans or who claim an inability to repay their loans.
In addition, under statutory authority, state regulators have broad discretionary power and may impose new licensing requirements, interpret or enforce existing regulatory requirements in different ways or issue new administrative rules, even if not contained in state statutes, that affect the way we do business and may force us to terminate or modify our operations in particular states or affect our ability to renew licenses we hold. Regulators may also impose rules that are generally adverse to our industry. Any new licensing requirements or rules, or new interpretations of existing licensing requirements or rules, or our failure to follow licensing requirements or rules could have a material adverse effect on our business, prospects, results of operations and financial condition.
We cannot currently assess the likelihood of the enactment of any future unfavorable federal or state legislation or regulations. We cannot assure you that further legislative or regulatory initiatives will not be enacted that would severely restrict, prohibit or eliminate our ability to offer small denomination loan products to consumers. Future legislative or regulatory actions could entail reductions of the fees and interest that we are currently allowed to charge, limitations on loan amounts, lengthening of the minimum loan term and reductions in the number of loans a consumer may have outstanding at one time or over a stated period of time or could entail prohibitions against rollovers, consumer loan transactions or other services we offer. Such changes could have a material adverse impact on our business prospects, result of operations, financial condition and cash flows or could make the continuance of our current business impractical, unprofitable or impossible and therefore could impair our ability to meet our obligations and to continue current operations. Moreover, similar actions by
25
states or by foreign countries in which we do not currently operate could limit our opportunities to pursue our growth strategies. As we develop new services, we may become subject to additional federal and state regulations.
As a result of our acquisition of DFS, we are subject to additional regulatory requirements and our failure to comply with such regulation could result in significant liability and materially adversely affect our business.
As a result of our acquisition of DFS, we are now offering loans to consumers over the Internet through the DFS Companies. In most cases, DFS's subsidiaries are licensed by the jurisdiction in which they offer loans. In the event a state does not have licensing requirements for entities that have no physical presence in the state, the loans are offered under DFS's home state license in Delaware. DFS offers loans to residents of Alabama, Alaska, California, Delaware, Hawaii, Idaho, Kansas, Louisiana, Minnesota, Missouri, Nevada, North Dakota, Rhode Island, South Dakota, Utah, Washington, Wyoming and Wisconsin. In addition, DFS operates as a credit access business in Texas, through which it offers loans originated by an unaffiliated third-party lender. Further, DFS also offers loans in the United Kingdom through DFS UK and is able to offer loans through a Canadian entity, though it does not currently do so. While we have not previously offered loans in many of these jurisdictions, as a result of the acquisition of DFS, we are subject to the regulatory requirements of such jurisdictions, and our failure to comply with such regulations could subject us to significant liability and result in a material adverse effect on our business.
In addition, DFS relies heavily on the use of lead generators or providers as a source of first-time borrowers. The CFPB has indicated its intention to examine compliance with federal laws and regulations and to scrutinize the flow of non-public, private consumer information between lead generators and lead buyers, such as DFS. The use of such lead generators could subject us to additional regulatory cost and expense and, if DFS's ability to use lead generators were to be impaired, DFS's business could be materially adversely affected and we may not realize the expected benefits of our acquisition of DFS.
Further, borrowers repay loans made by DFS in the United States through automated clearing house funds transfer authorizations. Borrowers repay loans made by DFS in the United Kingdom by way of authorizations to process the repayment charge to the borrower's debit card. The CFPB has indicated its intention to scrutinize the electronic transfers of funds to repay certain small denomination loans. If DFS were to be restricted in its ability to rely on such funds transfers, its business could be materially adversely affected and we may not realize the expected benefits of our acquisition of DFS.
Short-term consumer lending, including payday lending, is highly controversial and has been criticized as being predatory by certain advocacy groups, legislators, regulators, media organizations and other parties.
A significant portion of our revenue and net income comes from loan interest and fees on payday or similar short-term consumer loans and from services we provide our customers. The short-term consumer loans we make typically involve APRs exceeding 395%. Consumer advocacy groups and media reports often focus on the costs to a consumer for small denomination loans and claim that such loans can trap borrowers in a "cycle of debt" and claim further that they are predatory or abusive. While we believe that these loans provide substantial benefits when responsibly utilized, the controversy surrounding this activity may result in our and the industry being subject to the threat of adverse legislation, regulation or litigation motivated by such critics. Such legislation, regulation or litigation could have a material adverse effect on our business, results of operations and financial condition or could make the continuance of our current business impractical, unprofitable or impossible. In addition, if this negative characterization of small consumer loans becomes increasingly accepted by consumers, demand for these loan products could significantly decrease, which could have a material adverse effect
26
on our business, results of operations and financial condition. Further, media coverage and public statements that assert some form of inappropriateness in our products and services can lower employee morale, make it more difficult for us to attract and retain qualified employees, management and directors, divert management attention and increase expense.
The Dodd-Frank Act authorizes the newly created CFPB to adopt rules that could potentially have a serious impact on our ability to offer short-term consumer loans and it also empowers the CFPB and state officials to bring enforcement actions against companies that violate federal consumer financial laws.
Title X of the Dodd-Frank Wall Street Reform and Consumer Protection Act of 2010, or Dodd-Frank or the Dodd-Frank Act, created the CFPB. The CFPB became operational in July 2011, and on January 4, 2012, Richard Cordray was installed as its director. The CFPB has regulatory, supervisory and enforcement powers over providers of consumer financial products and services, including explicit supervisory authority to examine and require registration of payday lenders. Although it has not yet done so, the CFPB now has the authority to adopt rules describing specified acts and practices as being "unfair", "deceptive" or "abusive," and hence unlawful. In addition, the CFPB has issued examination procedures for, and has begun conducting examinations of, payday lenders, evidencing the CFPB's intention to exercise the powers afforded it. The CFPB has informed us that it will begin an examination of us in late April 2012. Though we expect that this examination will be similar to those conducted by other regulators with which we work, the CFPB has never examined us before and has only very recently begun conducting examinations at all. Accordingly, we can provide no assurances as to the process, scope or results of their examination of us and how their examination of us or others will impact us directly or their rulemaking. Some consumer advocacy groups have suggested that payday and title lending should be a regulatory priority. In addition, some consumer advocacy groups have suggested that certain aspects of payday loans are "abusive" and therefore such loans should be declared unlawful. Accordingly, it is possible that at some time in the future the CFPB could propose and adopt rules making such lending services materially less profitable or impractical, forcing us to modify or terminate certain product offerings, including payday and/or title loans. The CFPB could also adopt rules imposing new and potentially burdensome requirements and limitations with respect to our other lines of business. Any of these potential rules discussed in this paragraph could have a material adverse effect on our business, results of operation and financial condition or could make the continuance of our current business impractical, unprofitable or impossible.
In addition to Dodd-Frank's grant of regulatory and supervisory powers to the CFPB, Dodd-Frank gives the CFPB authority to pursue administrative proceedings or litigation for violations of federal consumer financial laws (including the CFPB's own rules). In these proceedings, the CFPB can obtain cease and desist orders (which can include orders for restitution or rescission of contracts, as well as other kinds of affirmative relief) and monetary penalties ranging from $5,000 per day for ordinary violations of federal consumer financial laws to $25,000 per day for reckless violations and $1 million per day for knowing violations. Also, where a company has violated Title X of Dodd-Frank or CFPB regulations under Title X, Dodd-Frank empowers state attorneys general and state regulators to bring civil actions for the kind of cease and desist orders available to the CFPB (but not for civil penalties). If the CFPB or one or more state officials believe we have violated the foregoing laws or regulations, they could exercise their enforcement powers in ways that would have a material adverse effect on us.
Some of our (and our competitors') lending practices in certain states have become or may become the subject of regulatory scrutiny and/or litigation. An unfavorable outcome in ongoing or future litigation could force us to discontinue these business practices and/or make monetary payments. This could have a material adverse effect on our business, financial condition and results of operations.
In most cases, our lending companies make short-term loans without any involvement of either affiliated or unaffiliated third parties. In Ohio and Arizona, however, our customers receive financial
27
services through us from multiple parties. In Ohio, one of our companies makes loans at the highest rate permitted by applicable law and disburses loan proceeds in the form of money orders. One of our other companies, sharing the same office, at the borrower's election cashes these money orders for a fee. In Arizona (and to a limited extent in Ohio), we market prepaid debit cards and lines of credit offered by a licensed lender unaffiliated with us. If a customer obtains both a prepaid debit card and a line of credit, loan funds can be disbursed in multiple ways at the borrower's election, including: (1) a card load, if and when the borrower seeks to make a card purchase but has insufficient funds on the card; (2) a card load at the borrower's request in advance of a transaction; and (3) a check mailed to the borrower at his or her request. The lender charges the borrower the highest interest rate permitted by applicable law on their lines of credit and the card program manager charges cardholders separate monthly, transaction, load and other fees charged for their cards.
While we believe that these multiple-party programs are lawful, they entail heightened legal risk when compared to our single-party loan programs. In an effort to prohibit programs similar to our Ohio program, in 2010 the Ohio Department of Commerce, Division of Financial Institutions, or the Ohio Division, adopted a rule (which was judicially declared invalid) and entered an order against another lender in regulatory enforcement proceedings (which order was vacated by the same judge that overturned the Ohio Division rule). The Ohio Division waived its right to appeal and agreed to terminate and/or not commence any regulatory proceedings challenging this practice. While this may mitigate the risk in Ohio under the current statutory and regulatory structure, if we adopted a similar program elsewhere, if there was a change in law in Ohio or if other pending litigation in Ohio successfully advances arguments that are contrary to those of the Ohio Division's currently stated position, we could be forced to discontinue charging fees for cashing money orders or checks that disburse the proceeds of loans we make and we could also become subject to private class action litigation with respect to fees collected under the current version of the program. This could have a material adverse effect on our business, financial condition and results of operations. See "Business—Legal Proceedings—Ohio Third-Party Litigation". Additionally, in the event of class action litigation and/or regulatory action in Arizona, a similar material adverse effect on our business, financial condition and results of operations could result.
Judicial decisions, CFPB rule-making or amendments to the Federal Arbitration Act could render the arbitration agreements we use illegal or unenforceable.
We include pre-dispute arbitration provisions in our loan agreements. These provisions are designed to allow us to resolve any customer disputes through individual arbitration rather than in court. Our arbitration agreements contain certain consumer-friendly features, including terms that require in-person arbitration to take place in locations convenient for the consumer and provide consumers the option to pursue a claim in small claims court. However, our arbitration provisions explicitly provide that all arbitrations will be conducted on an individual and not on a class basis. Thus, our arbitration agreements, if enforced, have the effect of shielding us from class action liability. They do not generally have any impact on regulatory enforcement proceedings.
We take the position that the Federal Arbitration Act requires the enforcement in accordance with the terms of arbitration agreements containing class action waivers of the type we use. While many courts, particularly federal courts, have agreed with this argument in cases involving other parties, an increasing number of courts, including courts in California, Missouri, Washington, New Jersey, and a number of other states, have concluded that arbitration agreements with class action waivers are "unconscionable" and hence unenforceable, particularly where a small dollar amount is in controversy on an individual basis.
In April 2011, the U.S. Supreme Court ruled in the AT&T Mobility v. Concepcion case that consumer arbitration agreements meeting certain specifications are enforceable. Because our arbitration agreements differ in several respects from the agreement at issue in that case, this potentially limits the
28
precedential effect of the decision on our business. In addition, Congress has considered legislation that would generally limit or prohibit mandatory pre-dispute arbitration in consumer contracts and has adopted such a prohibition with respect to certain mortgage loans and also certain consumer loans to members of the military on active duty and their dependents. Further, Dodd-Frank directs the CFPB to study consumer arbitration and report to Congress, and it authorizes the CFPB to adopt rules limiting or prohibiting consumer arbitration, consistent with the results of its study. Any such rule would apply to arbitration agreements entered into more than six months after the final rule becomes effective (and not to prior arbitration agreements).
Any judicial decisions, legislation or other rules or regulations that impair our ability to enter into and enforce pre-dispute consumer arbitration agreements could significantly increase our exposure to class action litigation as well as litigation in plaintiff-friendly jurisdictions. Such litigation could have a material adverse effect on our business, results of operations and financial condition.
Provisions of Dodd-Frank limiting interchange fees on debit cards could reduce the appeal of debit cards we distribute and/or limit revenues we receive from our debit card activities.
Dodd-Frank contains provisions that require the Federal Reserve Board to adopt rules that would sharply limit the interchange fees that large depository institutions (those that, together with their affiliates, have at least $10 billion of assets) can charge retailers who accept debit cards they issue. On June 29, 2011, the Federal Reserve Board set the interchange fee applicable to debit card transactions at 21 cents per transaction. While the statute does not apply to smaller entities, it is possible, and perhaps likely, that Visa, MasterCard and other debit card networks will continue their current practice of establishing the same interchange fees for all issuers or will establish interchange fees for exempt entities at levels significantly below current levels. If this happens, we would expect the issuer and processor of our debit cards to attempt to recover lost interchange revenues by imposing new or higher charges on cardholders and by seeking to capture a greater percentage of card revenues from us. Additional charges on debit cardholders could discourage use of debit cards for consumer transactions, and in either event, our revenues from prepaid debit card distribution would likely decline, perhaps materially.
Changes in local rules and regulations such as local zoning ordinances could negatively impact our business, results of operations and financial condition.
In addition to state and federal laws and regulations, our business is subject to various local rules and regulations, such as local zoning regulations and permit licensing. Local jurisdictions' efforts to restrict the business of alternative financial services providers through the use of local zoning and permit laws have been on the rise. Any actions taken in the future by local zoning boards or other local governing bodies to require special use permits for, or impose other restrictions on, our ability to provide products and services could adversely affect our ability to expand our operations or force us to attempt to relocate existing stores.
Potential litigation and regulatory proceedings could have a material adverse impact on our business, results of operations and financial condition in future periods.
We could become subject to lawsuits, regulatory proceedings or class actions challenging the legality of our lending practices. An adverse ruling in any proceeding of this type could force us to refund fees and/or interest collected, refund the principal amount of advances, pay triple or other multiple damages, pay monetary penalties and/or modify or terminate operations in particular states or nationwide. Defense of any lawsuit, even if successful, could require substantial time and attention of our senior management that would otherwise be spent on other aspects of our business and could require the expenditure of significant amounts for legal fees and other related costs. Settlement of lawsuits may also result in significant payments and modifications to our operations. For example, in
29
December 2010, we reserved $0.9 million in connection with the pending settlements of lawsuits alleging violations of the California wage laws related to meal periods and rest breaks. See "Business—Legal Proceedings—California Settlement". Adverse interpretations of the law in proceedings in which we are not currently a party could also have a material adverse effect on our business, results of operations and financial condition. To protect us from potential legal and regulatory liability, we rely, in part, on the maintenance of the legal separation, or corporate veil, of our operating subsidiaries. If a court or regulatory body were to determine that such corporate veil is invalid, our business could be materially affected. For a more detailed description of the lawsuits, regulatory proceedings and potential settlements we are currently subject to, see "Business—Legal Proceedings".
A significant portion of our revenue is generated by our stores in Ohio and California and a limited number of other states.
Approximately 35.8% of our stores are located in California, 22.8% of our stores are located in Ohio, 9.9% of our stores are located in Arizona and 5.1% of our stores are located in Virginia. In addition, if we complete the Florida Acquisition, approximately 10.1% of our stores would be located in Florida. As a result, if any of the events noted in this "Risk Factors" section were to occur with respect to our stores in these states, including changes in the regulatory environment, or if the economic conditions in any of these states were to worsen, any such event could significantly reduce our revenue and cash flow and materially adversely affect our business, results of operations and financial condition.
Our revenue and net income from check cashing services may be materially adversely affected if the number of consumer check cashing transactions decreases as a result of technological development or in response to changes in the tax preparation industry.
For the fiscal years ended December 31, 2009, 2010 and 2011, approximately 26.2%, 24.9% and 23.7% of our revenues were generated from the check cashing business, respectively. For the year ended December 31, 2011, on a pro forma basis, approximately 29.0% of our revenues were generated from the check cashing business. Recently, there has been increasing penetration of electronic banking services into the check cashing and money transfer industry, including the increasing adoption of prepaid debit cards, direct deposit of payroll checks, electronic payroll payments, electronic transfers of government benefits, electronic transfers using on-line banking and other payment platforms. A recent study by the Federal Reserve Board suggests that payments through electronic transfers are displacing a portion of the paper checks traditionally cashed in our stores by our customers. Employers are increasingly making payroll payments available through direct deposit or onto prepaid debit cards. In addition, state and federal assistance programs are increasingly delivering benefits either through direct deposit programs or prepaid debit cards, and the federal government has announced initiatives to transition the disbursement of some federal tax refunds to prepaid debit cards. For example, in April 2011, the State of California stopped issuing paper checks to benefits recipients, which adversely affected our check cashing revenue in that state. Moreover, the rise of on-line payment systems that allow for electronic check and credit card payments to be made directly to individuals has further contributed to the decline in this market. To the extent that checks received by our customer base are replaced with such electronic transfers or electronic transfer systems developed in the future, both the demand for our check cashing services and our revenues from our check cashing business could decrease. In addition, a significant part of our business involves the cashing of tax refund checks. Recent changes in the tax preparation industry, including tax preparers offering prepaid debit cards as an alternative to tax refund checks and a decrease in the number of tax preparers offering refund anticipation loans (which are typically disbursed by checks at the offices of the tax preparer) could cause the number of tax refund checks we cash to decline, which could have a material adverse effect on our financial condition and results of operations.
30
If our estimates of our loan losses are not adequate to absorb actual losses, our financial condition and results of operations could be adversely affected.
We utilize a variety of underwriting criteria, actively monitor the performance of our loan portfolio and maintain an allowance for losses on loans we underwrite (including fees and interest) at a level estimated to be adequate to absorb credit losses inherent in our loan receivables portfolio. To estimate the appropriate level of loan loss reserves, we consider known and relevant internal and external factors that affect loan collectability, including the total amount of loans outstanding, historical loans charge-offs, our current collection patterns and current economic trends. Our methodology for establishing our allowance for doubtful accounts and our provision for loan losses is based in large part on our historic loss experience. If customer behavior changes as a result of economic conditions and if we are unable to predict how the widespread loss of jobs, housing foreclosures and general economic uncertainty may affect our loan loss allowance, our provision may be inadequate. In addition, our shift in mix to more medium-term loans will result in a higher provision for loan losses as a result of the nature of medium-term loans as compared to short term loans, and, as this is a relatively new product for us, our provision for loan losses may be inadequate to cover losses on medium-term loans. At December 31, 2010, our loan loss allowance was $3.4 million, and in 2010 we had a net charge off of $38.4 million related to losses on our loans. As of December 31, 2011, our loan loss allowance was $5.6 million, and in 2011 we had a net charge off of $55.3 million related to losses on our loans. Our loan loss allowance, however, is an estimate, and if actual loan losses are materially greater than our loan loss allowance, our financial condition and results of operations could be adversely affected.
The failure of third parties who provide products, services or support to us to maintain their products, services or support could disrupt our operations or result in a loss of revenue.
We are reliant on third parties to provide certain products, services and support that is material to our business. In the event such parties become unwilling or unable to continue to provide such products, services or support to us, our business operations could be disrupted and our revenue could be materially and adversely affected. For example:
- •
- In select markets, an optional feature available to customers who purchase prepaid debit cards is the ability to have a
third-party lender direct loan proceeds onto the cards. In the event that this lender terminates this relationship or becomes unwilling or unable to fund short-term consumer loans to our
customers, and there is not an alternative third-party lender willing to make short-term consumer loans to our customers on substantially similar terms, our revenue related to the sale and
usage of prepaid debit cards could be materially and adversely affected.
- •
- Our prepaid debit card business depends on our agreements for related services with Insight. If any disruption in this
relationship occurs, our revenue generated as an agent for Insight's product offerings and one of the central focuses for our future growth strategy may be adversely affected.
- •
- Our money transfer and money order business depends on our agreements for such services with Western Union and MoneyGram.
If any disruption in these relationships occurs, our revenue generated from our money order and money transfer product offerings may be adversely affected. Approximately $1.5 million in 2009,
$1.3 million in 2010 and $4.9 million in 2011, or 0.8%, 0.6% and 1.6%, respectively, of our total revenue for the years ended December 31, 2009, 2010 and 2011, was related to our
money transfer and money order services, respectively.
- •
- We also have product and support agreements with various other third-party vendors and suppliers. If a third-party provider fails to provide its product or service or to maintain its quality and consistency, we could lose customers and related revenue from those products or services, or we could experience a disruption in our operations, any of which may adversely affect our business, results of operations and financial condition.
31
Our current and future business growth strategy involves new store acquisitions, and our failure to manage our growth or integrate or manage newly acquired stores may adversely affect our business, results of operations and financial condition.
Our growth strategy provides for our continued expansion through the acquisition of new stores. The acquisition of additional stores may impose costs on us and subject us to numerous risks, including:
- •
- costs associated with identification of stores to be acquired and negotiation of acceptable lease terms;
- •
- exposure to new or unexpected changes to existing regulations as we enter new geographic markets;
- •
- costs associated with, and consequences related to our failure to obtain, necessary regulatory approvals, including state
licensing approvals for change-of-control;
- •
- integration of acquired operations or businesses, including the transition to our information technology systems;
- •
- the loss of key employees from acquired businesses;
- •
- diversion of management's attention from our core business;
- •
- incurrence of additional indebtedness (if necessary to finance acquisitions);
- •
- assumption of contingent liabilities;
- •
- the potential impairment of acquired assets;
- •
- the possibility that tax authorities may challenge the tax treatment of future and past acquisitions;
- •
- incurrence of significant immediate write-offs; and
- •
- performance which may not meet expectations.
We opened or acquired 21 stores in 2010. In 2011, we acquired 10 stores in Illinois in connection with the Illinois Acquisition, 141 stores in connection with the California Acquisition and we opened two other locations. Our continued growth is dependent upon a number of factors, including the availability of adequate financing and suitable store locations, acquisition opportunities and experienced management employees, the ability to obtain any required government permits and licenses and other factors, some of which are beyond our control. We cannot assure you that we will be able to expand our business successfully through additional store acquisitions. Our failure to successfully expand, manage or complete the integration of new stores or acquired businesses may adversely affect our business, results of operations and financial condition.
We may not realize the expected benefits of the recent or pending acquisitions because of integration difficulties and other challenges.
The success of any acquisitions will depend, in part, on our ability to integrate the acquired business with our business and our ability to increase their store-level performance in line with our historical store-level performance. The integration process may be complex, costly and time-consuming and may not result in the anticipated improvements to store-level performance. The difficulties of integrating the operation of a business may include, among others:
- •
- failure to implement our business plan for the combined business;
- •
- failure to achieve expected synergies or cost savings;
32
- •
- unanticipated issues in integrating information, technology and other systems;
- •
- unanticipated challenges in implementing our short-term consumer lending practices in acquired stores or in
marketing loan products to their existing customers;
- •
- unanticipated changes in applicable laws and regulations; and
- •
- unanticipated issues, expenses and liabilities.
We may not accomplish the integration of the acquired business smoothly, successfully or with the anticipated costs or time frame. The diversion of the attention of management from our operations to the integration effort and any difficulties encountered in combining operations could prevent us from realizing the full benefits anticipated to result from the acquisition and could adversely affect our business.
The acquisition of DFS has resulted in a new line of business for us that could be difficult to integrate, disrupt our business or harm our results of operations.
We have never provided Internet loan products. The acquisition of DFS provides us with a new line of business offering loan products over the Internet. The process of integrating the acquired business, technology and service component into our business and operations, or our entry into a line of business in which we are inexperienced, may result in unforeseen operating difficulties and expenditures. We are relying on DFS's existing management team's experience and expertise in providing Internet loan products as we expand into this new line of business. If we were to lose the services of a significant portion of this management team, this line of business and our financial results could be adversely affected. In developing this line of business, we may invest significant time and resources and devote significant attention of management that would otherwise be focused on development of our existing business, which may affect our results of operations, and we may not be able to take full advantage of the business opportunities available to us as we expand this new line of business. Additionally, we may experience difficulties with technological changes in the Internet lending business. Moreover, we will be subject to regulations in connection with doing business and offering loan products over the Internet, with which we do not have experience. Failure to successfully manage these risks in the development and implementation of this new line of business could have a material adverse effect on our business, financial condition and results of operations.
We are subject to impairment risk.
At December 31, 2011, we had goodwill totaling $256.0 million on our consolidated balance sheet, all of which represents the excess of costs paid to acquire assets and liabilities over the fair value of those assets and liabilities. Accounting for goodwill requires significant management estimates and judgment. Events may occur in the future and we may not realize the value of our goodwill. Management performs reviews annually and when events or circumstances warrant a review of the carrying values of the goodwill to determine whether events and circumstances indicate that an impairment in value may have occurred. A variety of factors could cause the carrying value of our goodwill to become impaired. Should a review indicate impairment, a write-down of the carrying value of our goodwill would occur, resulting in a non-cash charge, which would adversely affect our results of operations.
We may not be successful at entering new businesses or broadening the scope of our existing product and service offerings.
We may enter into new businesses that are adjacent or complementary to our existing businesses and that broaden the scope of our existing product and service offerings. For example, we have recently
33
entered the business of offering loan products over the Internet through the acquisition of DFS. We may not achieve our expected growth if we are not successful in entering these new businesses or in broadening the scope of our existing product and service offerings. In addition, entering new businesses and broadening the scope of our existing product and service offerings may require significant upfront expenditures that we may not be able to recoup in the future. These efforts may also divert management's attention and expose us to new risks and regulations. As a result, entering businesses and broadening the scope of our existing product and service offerings may have a material adverse effect on our business, results of operations and financial condition.
Our substantial indebtedness could adversely affect our ability to raise additional capital to fund our operations, limit our ability to react to changes in the economy or our industry, expose us to interest rate risk to the extent of our variable rate debt and prevent us from meeting our obligations under our senior notes or other indebtedness.
We have a significant amount of indebtedness. As of December 31, 2011, our outstanding senior indebtedness was approximately $395 million, all of which was secured indebtedness, and we had availability of $40 million under our revolving credit facility, and our Alabama subsidiary's borrowing availability under its secured credit facility was $7 million.
Our substantial indebtedness could have important consequences to you. For example, it could:
- •
- make it more difficult for us to satisfy our obligations with respect to our senior notes and our other indebtedness;
- •
- require us to dedicate a substantial portion of our cash flow from operations to payments of principal and interest on our
indebtedness, thereby reducing the availability of our cash flow to fund working capital, capital expenditures, business development, acquisitions, general corporate or other purposes;
- •
- increase our vulnerability to and limit our flexibility in planning for, or reacting to, changes in our business and the
industry in which we operate;
- •
- increase our vulnerability to general adverse economic and industry conditions;
- •
- restrict us from making strategic acquisitions or cause us to make non-strategic divestitures;
- •
- place us at a competitive disadvantage compared to our competitors that have less debt; and
- •
- limit our ability to refinance our indebtedness, including our senior notes, or to obtain additional debt or equity financing for working capital, capital expenditures, business development, debt service requirements, acquisitions and general corporate or other purposes.
We expect to use cash flow from operations and borrowings under our revolving credit facilities to meet our current and future financial obligations, including funding our operations, debt service requirements, small acquisitions and capital expenditures. Our ability to make these payments depends on our future performance, which will be affected by financial, business, economic and other factors, many of which we cannot control. Our business may not generate sufficient cash flow from operations in the future, which could result in our being unable to repay indebtedness or to fund other liquidity needs.
Risks of leverage and debt service requirements may hamper our ability to operate and grow our revenues.
Our debt-to-equity ratio is high due to the requirement of borrowing funds to continue operations. High leverage creates risks, including the risk of default under our revolving credit facility or our senior notes. The interest expense associated with our debt burden may be substantial and may create a significant drain on our future cash flow. These payments may also place us at a disadvantage relative
34
to other better capitalized competitors and increase the impact of competitive pressures within our markets. For more information regarding the impact of our substantial indebtedness, please see "—Our substantial indebtedness could adversely affect our ability to raise additional capital to fund our operations, limit our ability to react to changes in the economy or our industry, expose us to interest rate risk to the extent of our variable rate debt and prevent us from meeting our obligations under our senior notes or other indebtedness." As of December 31, 2011, our total debt was $395.0 million and our negative tangible capital was $198.2 million.
Despite our current level of indebtedness, we may still be able to incur substantial additional indebtedness. This could exacerbate the risks associated with our substantial indebtedness.
We and our subsidiaries may be able to incur substantial additional indebtedness in the future. The terms of the indenture governing our senior notes and the agreement governing our revolving credit facility limit, but do not prohibit, us or our subsidiaries from incurring additional indebtedness. If we incur any additional indebtedness the holders of that indebtedness will be entitled to share ratably with our other secured and unsecured creditors in any proceeds distributed in connection with any insolvency, liquidation, reorganization, dissolution or other winding-up of our business prior to any recovery by our shareholders. This may have the effect of reducing the amount of proceeds paid to you in such an event. If new indebtedness, including under our revolving credit facilities, is added to our current debt levels, the related risks that we and our subsidiaries now face could intensify, especially with respect to the demands on our liquidity as a result of increased interest commitments.
Covenants in our debt agreements restrict our business in many ways.
The indenture governing our senior notes and the agreement governing our revolving credit facility contain various covenants that, subject to certain exceptions, including customary baskets, generally limit our ability and our subsidiaries' ability to, among other things:
- •
- incur or assume liens or additional debt or provide guarantees in respect of obligations of other persons;
- •
- issue redeemable stock and preferred stock;
- •
- pay dividends or distributions or redeem or repurchase capital stock;
- •
- prepay, redeem or repurchase debt;
- •
- make loans and investments;
- •
- enter into agreements that restrict distributions from our subsidiaries;
- •
- sell assets and capital stock of our subsidiaries;
- •
- engage in certain transactions with affiliates; and
- •
- consolidate or merge with or into, or sell substantially all of our assets to, another person.
As of the end of any fiscal quarter for which we have borrowings outstanding under our revolving credit facility, we must have a leverage ratio, defined as consolidated total indebtedness less excess cash, divided by EBITDA for the trailing twelve months, equal to or less than 5.0 to 1. In calculating the leverage ratio, we calculate EBITDA and excess cash, which were $98.4 million and $43.3 million, respectively, for the twelve months ended and as of December 31, 2011, pursuant to the terms of our revolving credit facility. EBITDA is calculated under our revolving credit facility in substantially the same manner as Pro Forma Adjusted EBITDA is calculated as set forth under the heading "Prospectus Summary—Summary Unaudited Pro Forma Consolidated Financial Information". However, EBITDA, as calculated under our revolving credit facility, does not include an add-back for $678,000 of lease
35
adjustments, which is included in the calculation of Pro Forma Adjusted EBITDA, but includes $946,000 of additional corporate allocations in connection with the integration of CCCS, which are excluded from the calculation of Pro Forma Adjusted EBITDA. Excess cash under our revolving credit facility is an amount equal to our and our restricted subsidiaries' cash and cash equivalents minus (i) funds in accounts used for taxes or payments to employees and other fiduciary funds and (ii) an amount equal to the product of $50,000 multiplied by the number of stores we own and operate. As of December 31, 2011, our leverage ratio was 3.6 to 1. A breach of any of these covenants would limit our ability to borrow funds under our revolving credit facility and could result in a default under the revolving credit facility and/or the senior notes. Upon the occurrence of an event of default under our revolving credit facility or our senior notes, the lenders or the holders of our senior notes, as the case may be, could elect to declare all amounts outstanding under the applicable indebtedness to be immediately due and payable and the lenders could terminate all commitments to extend further credit under our revolving credit facility. If we were unable to repay those amounts, the lenders and holders of our senior notes could proceed against the collateral granted to them to secure that indebtedness. We have pledged substantially all of our assets as collateral under the revolving credit facility and as security for our senior notes. If the lenders under our revolving credit facility accelerate the repayment of borrowings or the holders of our senior notes accelerate repayment of our senior notes, we may not have sufficient assets to repay the amounts outstanding under our indebtedness. See "Description of Certain Indebtedness".
Changes in credit ratings issued by statistical rating organizations could adversely affect our costs of financing.
Credit rating agencies rate our indebtedness based on factors that include our operating results, actions that we take, their view of the general outlook for our industry and their view of the general outlook for the economy. Actions taken by the rating agencies can include maintaining, upgrading or downgrading the current rating or placing us on a watch list for possible future downgrading. Downgrading the credit rating of our indebtedness or placing us on a watch list for possible future downgrading could limit our ability to access the capital markets to meet liquidity needs and refinance maturing liabilities or increase the interest rates and our cost of financing.
If we lose key management or are unable to attract and retain the talent required for our business, our operating results and growth could suffer.
Our future success depends to a significant degree upon the members of our senior management. The loss of the services of members of senior management could harm our business and prospects for future development. Our continued growth also will depend upon our ability to attract and retain additional skilled management personnel. If we are unable to attract and retain the requisite personnel, our business, results of operations and financial condition may be adversely affected.
We are dependent on hiring an adequate number of hourly employees to run our business and are subject to government regulations concerning these and our other employees, including minimum wage laws.
Our workforce is comprised primarily of employees who work on an hourly basis. In certain areas where we operate, there is significant competition for employees. Our ability to continue to expand our operations depends on our ability to attract, train and retain a large and growing number of qualified employees. The lack of availability of an adequate number of hourly employees or increase in wages and benefits to current employees could adversely affect our operations. We are subject to applicable rules and regulations relating to our relationship with our employees, including the U.S. Fair Labor Standards Act, the U.S. Immigration Reform and Control Act of 1986 and various federal and state laws governing various matters including minimum wage and break requirements, exempt status classification, health benefits, unemployment and employment taxes and overtime and working conditions. Legislative increases in the federal minimum wage, as well as increases in additional labor
36
cost components, such as employee benefit costs, workers' compensation insurance rates, compliance costs and fines, as well as the cost of litigation in connection with these regulations, would increase our labor costs. Furthermore, if we are unable to locate, attract, train or retain qualified personnel, or if our costs of labor increase significantly, our business, results of operations and financial condition may be adversely affected.
Competition in the retail financial services industry is intense and could cause us to lose market share and revenue.
The industry in which we operate has low barriers to entry and is highly fragmented and very competitive. In addition, we believe that the market will become more competitive as the industry continues to consolidate. We compete with other check cashing stores, short-term consumer lenders, internet lenders, mass merchandisers, grocery stores, banks, savings and loan institutions, other financial services entities and other retail businesses that cash checks, offer short-term consumer loans, sell money orders, provide money transfer services or offer similar products and services. Some of our competitors have larger and more established customer bases, and substantially greater financial, marketing and other resources, than we do. For example, Walmart offers a general-purpose reloadable prepaid debit card and also offers check cashing services, money transfers and bill payments through its "Money Centers" in select locations. In addition, short-term consumer loans are increasingly being offered by local banks and employee credit unions. Our stores also face competition from automated check cashing machines deployed in supermarkets, convenience stores and other venues by large financial services organizations. In addition, our competitors may operate, or begin to operate, under business models less focused on legal and regulatory compliance than ours, which could put us at a competitive disadvantage. We cannot assure you that we will be able to compete successfully against any or all of our current or future competitors. As a result, we could lose market share and our revenue could decline, thereby affecting our ability to generate sufficient cash flow to service our indebtedness and fund our operations.
Our competitors' use of other business models could put us at a competitive disadvantage and have a material adverse effect on our business.
We operate our business pursuant to the laws and regulations of the states in which our stores are located, including compliance with the maximum fees allowed and other limitations, and we are licensed in every state in which we lend. Some of our competitors, especially internet lenders, operate using other business models, including a "single-state model" where the lender is generally licensed in one state and follows only the laws and regulations of that state regardless of the state in which the customer resides and the lending transaction takes place, an "offshore model" where the lender is not licensed in any U.S. state and does not typically comply with any particular state's laws or regulations and a "tribal model" where the lender follows the laws of a Native American tribe regardless of the state in which the lender is located, the customer resides and the lending transaction takes place. Competitors using these models may have higher revenue per customer and significantly less burdensome compliance requirements, among other advantages. Additionally, negative perceptions about these models could cause legislators or regulators to pursue additional industry restrictions that could affect the business model under which we operate, which could have a material adverse effect on our business, prospects, results of operations and financial condition.
A reduction in demand for our products and services and failure by us to adapt to such reduction could adversely affect our business and results of operations.
The demand for a particular product or service we offer may be reduced due to a variety of factors, such as regulatory restrictions that decrease customer access to particular products, the availability of competing products or changes in customers' preferences or financial conditions. Should
37
we fail to adapt to significant changes in our customers' demand for, or access to, our products or services, our revenues could decrease significantly and our operations could be harmed. Even if we do make changes to existing products or services or introduce new products or services to fulfill customer demand, customers may resist or may reject such products or services. Moreover, the effect of any product change on the results of our business may not be fully ascertainable until the change has been in effect for some time and by that time it may be too late to make further modifications to such product or service without causing further harm to our business, results of operations and financial condition.
Demand for our products and services is sensitive to the level of transactions effected by our customers, and accordingly, our revenues could be affected negatively by a general economic slowdown.
A significant portion of our revenue is derived from cashing checks and consumer lending. Revenues from check cashing and consumer lending accounted for 24.9% and 65.2%, respectively, of our total revenue for the year ended December 31, 2010 and 23.7% and 63.9%, respectively, of our total revenue for the year ended December 31, 2011. An economic slowdown could cause deterioration in the performance of our loan portfolio and in consumer demand for our financial products and services. For example, a significant portion of our check cashing business is generated by cashing payroll checks and any prolonged economic downturn or increase in unemployment could have a material adverse effect on such business. In addition, reduced consumer confidence and spending may decrease the demand for our other products and services. Also, any changes in economic factors that adversely affect consumer transactions and employment could reduce the volume of transactions that we process and have an adverse effect on our business, results of operations and financial condition.
Our future growth and financial success will be harmed if there is a decline in the use of prepaid debit cards as a payment mechanism or if there are adverse developments with respect to the prepaid debit card services industry in general.
Our business strategy is dependent, in part, upon the general growth in demand for prepaid debit cards. As the market for prepaid debit card services matures, consumers may find prepaid debit cards to be less attractive than traditional bank solutions. Further, other alternatives to prepaid debit cards may develop and limit the growth of, or cause a decline in the demand for, prepaid debit cards. In addition, negative publicity surrounding other prepaid debit card services providers could impact our business and prospects for growth to the extent it adversely impacts the perception of prepaid debit card services industry among consumers. If consumers do not continue to increase their usage of prepaid debit card services, our operating revenues may remain at current levels or decline. Predictions by industry analysts and others concerning the growth of prepaid debit card services as an electronic payment mechanism, including those in this prospectus, may overstate the growth of an industry, segment or category, and you should not place undue reliance upon them. The projected growth may not occur or may occur more slowly than estimated. If consumer acceptance of prepaid debit card services does not continue to develop or develops more slowly than expected or if there is a shift in the mix of payment forms, such as cash, credit cards, traditional debit cards and prepaid debit cards, away from our products and services, it could have a material adverse effect on our business, results of operations and financial condition.
The pro forma financial information in this prospectus may not be reflective of our operating results and financial condition following the California Acquisition and related transactions.
The pro forma financial information included in this prospectus is derived from our and CCCS's separate historical audited and unaudited consolidated financial statements, as well as from certain internal, unaudited financial statements relating to our acquired stores in Illinois that were provided by the sellers in connection with those acquisitions. The preparation of this pro forma information is based
38
upon available information and certain assumptions and estimates that we believe are reasonable. This pro forma information may not necessarily reflect what our results of operations and financial position would have been had the California Acquisition and related transactions and the Illinois Acquisition occurred during the periods presented or what our results of operations and financial position will be in the future. Additionally, the pro forma information reflects financial information for our Alabama and Illinois acquired stores for the periods prior to when we acquired them, and we cannot assure you that this financial information is accurate.
Disruptions in the credit markets may negatively impact the availability and cost of our short-term borrowings, which could adversely affect our results of operations, cash flows and financial condition.
If our cash flow from operations is not sufficient to fund our working capital and other liquidity needs, we may need to rely on the banking and credit markets to meet our financial commitments and short-term liquidity needs. Disruptions in the capital and credit markets, as have been experienced since 2008, could adversely affect our ability to draw on our revolving credit facility. Our access to funds under that credit facility is dependent on the ability of the banks that are parties to the facility to meet their funding commitments. Those banks may not be able to meet their funding commitments to us if they experience shortages of capital and liquidity or if they experience excessive volumes of borrowing requests from us and other borrowers within a short period of time. In addition, the effects of the global recession and its effects on our operations could cause us to have difficulties in complying with the terms of our revolving credit facility.
Longer-term disruptions in the capital and credit markets as a result of uncertainty, changing or increased regulation, reduced alternatives, or failures of significant financial institutions could adversely affect our ability to refinance our outstanding indebtedness on favorable terms, if at all. The lack of availability under, and the inability to subsequently refinance, our indebtedness could require us to take measures to conserve cash until the markets stabilize or until alternative credit arrangements or other funding for our business needs can be arranged. Such measures could include deferring capital expenditures, including acquisitions, and reducing or eliminating other discretionary uses of cash.
Our revenue and net income from check cashing services may be materially adversely affected if the number and amount of checks we cash that go uncollected significantly increases.
When we cash a check, we assume the risk that we will be unable to collect from the check payor. We may not be able to collect from check payors as a result of a payor having insufficient funds in the account on which a check was drawn, stop payment orders issued by a payor or check fraud. If the number or amount of checks we cash that are uncollected increases significantly, our business, results of operations and financial condition may be materially adversely affected.
Any disruption in the availability or the security of our information systems or the Internet lending platform that we acquired from DFS or fraudulent activity could adversely affect our operations or subject us to significant liability or increased regulation.
We depend on our information technology infrastructure to achieve our business objectives. Our information systems include POS systems in our stores and a management information system. Our personal computer-based POS systems are fully operational in all stores. The management information system is designed to provide summary and detailed information to our regional and corporate managers at any time through the Internet. In addition, this system is designed to manage our credit risk and to permit us to maintain adequate cash inventory, reconcile cash balances on a daily basis and report revenues and expenses to our headquarters. Moreover, in connection with our acquisition of DFS, we will begin offering loans and other products through our Internet lending platform. Any disruption in the availability of our information systems or Internet lending platform could adversely affect our business, results of operations and financial condition.
39
Furthermore, a security breach of our information systems or Internet lending platform could also interrupt or damage our operations or harm our reputation, and could subject us to significant liability if confidential customer information is misappropriated. Despite the implementation of significant security measures, our information systems and Internet lending platform may still be vulnerable to physical break-ins, computer viruses, programming errors, telecommunications failure or lost connectivity, attacks by third parties or similar disruptive problems. If confidential information belonging to our customers or business partners is misappropriated from our information systems or over the Internet, the owners of such information could sue us, asserting that we did not take adequate precautions to safeguard our systems and confidential data. Any breach of our security measures could damage our reputation and cause us to lose customers and revenue, result in the unintentional disclosure of company and customer information, and require us to incur significant expense to eliminate these problems, address related data security concerns and pay damages to third parties including customers.
In addition, criminals are using increasingly sophisticated methods to engage in illegal activities such as fraud. Over the past several years, we and others in our industry have had customers and former customers contacted by unknown criminals making telephone calls attempting to collect debt, purportedly on our behalf. These criminals are often successful in fraudulently inducing payments to them. Increased fraud involving our products and services or affecting our customers could lead to litigation, significantly increased expenses, reputational damage, reduced use and acceptance of our products and services or new regulations and compliance obligations, which could have a material adverse effect on our business, prospects, results of operations and financial condition.
Our business may suffer if our trademarks or service marks are infringed.
We rely on trademarks and service marks to protect our various brand names in our markets. Many of these trademarks and service marks have been a key part of establishing our business in the communities in which we operate. We believe these trademarks and service marks have significant value and are important to the marketing of our services. We cannot assure you that the steps we have taken or will take to protect our proprietary rights will be adequate to prevent misappropriation of our rights or the use by others of features based upon, or otherwise similar to, ours. In addition, although we believe we have the right to use our trademarks and service marks, we cannot assure you that our trademarks and service marks do not or will not violate the proprietary rights of others, that our trademarks and service marks will be upheld if challenged, or that we will not be prevented from using our trademarks and service marks, any of which occurrences could harm our business.
Part of our business is seasonal, which causes our revenue to fluctuate and may adversely affect our ability to service our debt.
Our business is seasonal due to the impact of our customers cashing their tax refund checks with us and using the related proceeds in connection with our other products and services, such as prepaid debit cards. Also, our consumer loan business declines slightly in the first calendar quarter as a result of customers' receipt of tax refund checks. If our revenue were to fall substantially below what we would normally expect during certain periods, our annual financial results would be adversely impacted, as would our ability to service our debt.
Because we maintain a significant supply of cash in our stores, we may be subject to cash shortages due to robbery, employee errors and theft.
Since our business requires us to maintain a significant supply of cash in each of our stores, we are subject to the risk of cash shortages resulting from robberies, as well as employee errors and theft. Although we have implemented various procedures and programs to reduce these risks, provide security, systems and processes for our employees and facilities, we cannot assure you that robberies,
40
employee errors and theft will not occur. The extent of these cash shortages could increase as we expand the nature and scope of our products and services. Any such cash shortages could adversely affect our business, results of operations and financial condition.
If our insurance coverage limits are inadequate to cover our liabilities, or increases in our insurance costs continue to increase or we suffer losses due to one or more of our insurance carriers defaulting on their obligations, our financial condition and results of operations could be materially adversely affected.
As a result of the liability risks inherent in our lines of business we maintain liability insurance intended to cover various types of property, casualty and other risks. The types and amounts of insurance that we obtain vary from time to time, depending on availability, cost and our decisions with respect to risk retention. The policies are subject to deductibles and exclusions that result in our retention of a level of risk on a self-insured basis. Our insurance policies are subject to annual renewal. The coverage limits of our insurance policies may not be adequate, and we may not be able to obtain liability insurance in the future on acceptable terms or at all. In addition, our insurance premiums may be subject to increases in the future, which increases may be material. Furthermore, the losses that are insured through commercial insurance are subject to the credit risk of those insurance companies. While we believe our commercial insurance providers are currently credit worthy, we cannot assure you that such insurance companies will remain so in the future. Inadequate insurance coverage limits, increases in our insurance costs or losses suffered due to one or more of our insurance carriers defaulting on their obligations, could have a material adverse effect on our financial condition and results of operations.
Our operations could be subject to natural disasters and other business disruptions, which could adversely impact our future revenue and financial condition and increase our costs and expenses.
Our operations could be subject to natural disasters and other business disruptions, which could adversely impact our future revenue and financial condition and increase our costs and expenses. For example, the occurrence and threat of terrorist attacks may directly or indirectly affect economic conditions, which could in turn adversely affect demand for our services. In the event of a major natural or man-made disaster, such as hurricanes, floods, fires or earthquakes, we could experience loss of life of our employees, destruction of facilities or business interruptions, any of which could materially adversely affect us. More generally, any of these events could cause consumer confidence and spending to decrease or result in increased volatility in the U.S. economy and worldwide financial markets. Any of these occurrences could have a material adverse effect on our business, results of operations and financial condition.
Adverse real estate market fluctuations could affect our profits.
We lease all of our store locations. A significant rise in overall lease costs may result in an increase in our store occupancy costs as we open new locations and renew leases for existing locations.
Risks Related to this Offering, the Securities Markets and Ownership of our Common Shares
There is no existing market for our common shares, and a trading market that will provide our shareholders with adequate liquidity may not develop.
Prior to this offering, there has been no public market for our common shares. An active trading market for our common shares may never develop or be sustained, which could depress the market price of our common shares and could affect your ability to sell your common shares. In the event that the number of common shares to be sold in this offering is decreased, liquidity could be adversely affected even further. Shareholders may not be able to resell their shares at or above the initial public offering price. Additionally, the lack of liquidity may result in wide bid-ask spreads, contribute to significant fluctuations in the market price of our common shares and limit the number of investors who are able to buy our common shares.
41
The price of our common shares may fluctuate significantly, and shareholders could lose all or part of their investment.
The initial public offering price for our common shares will be determined by negotiations between us and the representative of the underwriters and may bear no relationship to the price at which our common shares will trade following the completion of this offering. The market price of our common shares may decline below the initial public offering price. The market price of our common shares following this offering is likely to be highly volatile and may be influenced by many factors, some of which are beyond our control, including:
- •
- our quarterly or annual earnings or those of other companies in our industry;
- •
- changes in accounting standards, policies, guidance, interpretations or principles;
- •
- general economic conditions;
- •
- the failure of securities analysts to cover our shares after this offering or changes in financial estimates by analysts;
- •
- future sales of our common shares; and
- •
- other factors described in this "Risk Factors" section.
After this offering, Diamond Castle will continue to have substantial influence over us, and their interests in our business may be different from yours.
Upon completion of this offering, Diamond Castle will beneficially own approximately 25.8% of our outstanding common shares, or approximately 20.8% of our outstanding common shares if the underwriters fully exercise their overallotment option. Diamond Castle will, for the foreseeable future, have significant influence over our reporting and corporate management and affairs, and virtually all matters requiring shareholder approval. In particular, Diamond Castle will be able to exert a significant degree of influence over the election of directors and actions to be taken by us and our board of directors, including amendments to our articles of incorporation and code of regulations and approval of significant corporate transactions, including mergers and sales of substantially all of our assets. The directors so elected will have the authority, subject to the terms of our indebtedness and Ohio law, to issue additional shares, implement share repurchase programs, declare dividends and make other decisions. It is possible that the interests of Diamond Castle may in some circumstances conflict with our interests and the interests of our other shareholders, including you. For example, Diamond Castle may have an interest in pursuing acquisitions, divestitures, financings or other transactions that, in its judgment, could enhance the value of its investment, even through such transactions might involve risks to you as a holder of our common shares or that could depress our share price. See "Certain Relationships and Related-Party Transactions" and "Principal and Selling Shareholders".
Reports published by securities or industry analysts, including projected results contained in those reports that exceed our actual results, could adversely affect our share price and trading volume.
We currently expect securities research analysts, including those affiliated with our underwriters, to establish and publish their own quarterly projections regarding our operating results. These projections may vary widely from one another and may not accurately predict the results we actually achieve. Our share price may decline if we fail to meet securities research analysts' projections. Similarly, if one or more of the analysts who covers us downgrades our shares or publishes inaccurate or unfavorable research about our business, our share price could decline. If one or more of these analysts ceases coverage of us or fails to publish reports on us regularly, our share price or trading volume could decline. Additionally, while we expect securities research analyst coverage, if no securities or industry analysts commence coverage of us, the trading price of our shares and the trading volume could decline.
42
Future sales of common shares by existing shareholders could depress the market price of our common shares.
If our existing shareholders sell, or indicate an intent to sell, substantial amounts of our common shares in the public market after the 180-day contractual lock-up period and other legal restrictions on resale discussed in this prospectus lapse, the trading price of our common shares could decline significantly and could decline below the initial public offering price. Upon completion of this offering, we will have approximately 18,648,203 common shares outstanding, assuming no exercise of the underwriters' overallotment option. Credit Suisse Securities (USA) LLC may, in its sole discretion, permit our executive officers, directors, employees and current shareholders to sell shares prior to the expiration of the lock-up agreements.
After the lock-up agreements pertaining to this offering expire, an additional 7,981,536 shares will be eligible for sale in the public market, 6,147,750 of which are held by directors, executive officers and other affiliates and will be subject to volume limitations under Rule 144 under the Securities Act and substantially all of which will be subject to registration rights. In addition, the 1,577,004 shares underlying outstanding employee equity awards and the 312,768 shares reserved for future issuance under our equity compensation plan will become eligible for sale in the public market in the future, subject to certain legal and contractual limitations. If these additional shares are sold, or if it is perceived that they will be sold, in the public market, the trading price of our common shares could decline substantially.
The availability of our common shares for sale in the future could reduce the market price of our common shares.
In the future, we may issue additional securities to raise capital. We may also acquire interests in other companies by using a combination of cash and our common shares or just our common shares. We may also issue securities convertible into our common shares. Any of these events may dilute your ownership interest in our company and have an adverse impact on the price of our common shares. In addition, sales of a substantial amount of our common shares in the public market, or the perception that these sales may occur, could reduce the market price of our common shares. This could also impair our ability to raise additional capital through the sale of our securities.
We do not intend to pay dividends in the foreseeable future.
For the foreseeable future, we intend to retain any earnings to finance the development of our business, and we do not anticipate paying any cash dividends on our common shares. Any future determination to pay dividends will be at the discretion of our board of directors and will be dependent upon then-existing conditions, including our operating results and financial condition, capital requirements, contractual restrictions, business prospects and other factors that our board of directors considers relevant. Accordingly, investors must rely on sales of their common shares after price appreciation, which may never occur, as the only way to realize a return on their investment.
Anti-takeover provisions contained in our articles of incorporation and code of regulations, as well as provisions of Ohio law, could impair a takeover attempt.
Our articles of incorporation and code of regulations provisions may have the effect of delaying, deferring or discouraging a prospective acquiror from making a tender offer for our shares or otherwise attempting to obtain control of us. To the extent that these provisions discourage takeover attempts, they could deprive shareholders of opportunities to realize takeover premiums for their shares. Moreover, these provisions could discourage accumulations of large blocks of common shares, thus depriving shareholders of any advantages which large accumulations of shares might provide.
As an Ohio corporation, we will also be subject to provisions of Ohio law, including Chapter 1704 of the Ohio Revised Code. Chapter 1704 of the Ohio Revised Code prevents shareholders holding more than 10% of the voting power of our outstanding common shares from engaging in certain
43
business combinations unless the business combination was approved in advance by our board of directors, is approved by the holders of at least 662/3% of our outstanding common shares, including shares representing at least a majority of voting shares that are not beneficially owned by the shareholder engaging in the transaction, or satisfies statutory conditions relating to the fairness of the consideration to be received by our shareholders.
Any provision of our articles of incorporation or our code of regulations or Ohio law that has the effect of delaying or deterring a change in control could limit the opportunity for our shareholders to receive a premium for their common shares and could also affect the price that some investors are willing to pay for our common shares.
Our board of directors can issue, without shareholder approval, preferred shares with voting and conversion rights that could adversely affect the voting power of the holders of common shares.
Our board of directors can issue, without shareholder approval, preferred shares with voting and conversion rights that could adversely affect the voting power of the holders of common shares and reduce the likelihood that such holders will receive dividend payments or payments upon liquidation. Such issuance could have the effect of decreasing the market price of the common shares. Our ability to issue certain types of preferred shares is restricted by the terms of the indenture governing our senior notes and the agreement governing our revolving credit facility. See "—Covenants in our debt instruments restrict our business in many ways." The issuance of preferred shares or even the ability to issue preferred shares could also have the effect of delaying, deterring or preventing a change of control or other corporate action.
You will experience immediate and substantial dilution.
The initial public offering price will be substantially higher than the net tangible book value of each outstanding common share immediately after this offering. If you purchase common shares in this offering, you will suffer immediate and substantial dilution. The dilution will be $15.90 per share in the net tangible book value of the common shares from the expected initial public offering price. In addition, if outstanding options to purchase our common shares are exercised, there could be further dilution.
Our board of directors and management will have broad discretion over the use of the proceeds we receive in this offering and might not apply the proceeds in ways that increase the value of your investment.
Our board of directors and management will have broad discretion to use the net proceeds from this offering and you will be relying on their judgment regarding the application of these remaining proceeds. Our board of directors and management might not apply the net proceeds of this offering in ways that increase the value of your investment. We expect to use the remaining net proceeds from this offering for general corporate purposes, including acquisitions (including the Florida Acquisition) and the repayment of debt, including redeeming up to $39.5 million aggregate principal amount of our senior notes. Until we use the net proceeds from this offering, we plan to invest them, and these investments may not yield a favorable rate of return. If we do not invest or apply the net proceeds from this offering in ways that enhance shareholder value, we may fail to achieve expected financial results, which could cause our share price to decline.
As a result of becoming a public company, we will be obligated to develop and maintain proper and effective internal control over financial reporting. We may not complete our analysis of our internal controls over financial reporting in a timely manner, or these internal controls may not be determined to be effective, which may adversely affect investor confidence in our company and, as a result, the value of our common shares.
We will be required, pursuant to Section 404 of the Sarbanes-Oxley Act, to furnish a report by management on, among other things, the effectiveness of our internal control over financial reporting for the first fiscal year beginning after the effective date of this offering. This assessment will need to
44
include disclosure of any material weaknesses identified by our management in our internal control over financial reporting; however, as an "emerging growth company" under the "Jumpstart Our Business Startups Act", or the JOBS Act, our auditors will not be required to issue an attestation report on our management's assessment of our internal controls until the end of the fiscal year following the fifth anniversary of the date of completion of this offering, so long as we do not otherwise cease to be an "emerging growth company" during that period.
We are in the very early stages of the costly and challenging process of compiling the system and processing documentation necessary to perform the evaluation needed to comply with Section 404. We may not be able to complete our evaluation, testing and any required remediation in a timely fashion. We and, when required in the future, our independent registered public accounting firm, will be testing our internal controls in connection with the Section 404 requirements and could, as part of that documentation and testing, identify material weaknesses, significant deficiencies or other areas for further attention or improvement. Two significant deficiencies were identified in our internal controls in connection with the preparation of our financial statements and the audit of our financial results for 2011. We have significant deficiencies in our internal controls relating to the preparation and review of our provision for income taxes and certain processes and procedures in respect of our information technology systems. While we intend to remediate these significant deficiencies in our internal controls, there can be no assurances we will successfully do so or that other significant deficiencies or material weaknesses will not be discovered. Implementing any appropriate changes to our internal controls may require specific compliance training for our directors, officers and employees, require the hiring of additional finance, accounting and other personnel, entail substantial costs to modify our existing accounting systems, and take a significant period of time to complete. Such changes may not, however, be effective in maintaining the adequacy of our internal controls, and any failure to maintain that adequacy, or consequent inability to produce accurate financial statements on a timely basis, could increase our operating costs and could materially impair our ability to operate our business. Moreover, effective internal controls are necessary for us to produce reliable financial reports and are important to help prevent fraud.
If we are unable to assert that our internal control over financial reporting is effective, or if, when required in the future, our auditors are unable to express an opinion on the effectiveness of our internal controls, we could lose investor confidence in the accuracy and completeness of our financial reports, which would cause the price of our common shares to decline.
We will incur increased costs as a result of being a publicly traded corporation.
We have no history operating as a publicly traded corporation. As a publicly traded corporation, we will incur additional legal, accounting and other expenses that we did not incur as a private company. This increase will be due to the increased accounting support services, filing annual, quarterly and other reports with the SEC, increased audit fees, investor relations costs, directors' fees, directors' and officers' insurance, legal fees, stock exchange listing fees and registrar and transfer agent fees, which we expect to incur after the completion of this offering. In addition, we expect that complying with the rules and regulations implemented by the SEC and Nasdaq will increase our legal and financial compliance costs and make activities more time-consuming and costly. For example, as a result of becoming a publicly traded corporation, we are required to have a board containing a majority of independent directors, create additional board committees and adopt policies regarding internal controls and disclosure controls and procedures, including the preparation of reports on internal control over financial reporting. In addition, we will incur additional costs associated with our publicly traded corporation reporting requirements.
45
SPECIAL NOTE REGARDING FORWARD-LOOKING STATEMENTS
This prospectus contains forward-looking statements, which reflect management's expectations regarding our future growth, results of operations, operational and financial performance and business prospects and opportunities. All statements, other than statements of historical fact, are forward-looking statements. You can identify such statements because they contain words such as "plans", "expects" or "does not expect", "forecasts", "anticipates" or "does not anticipate", "believes", "intends" and similar expressions or statements that certain actions, events or results "may", "could", "would", "might" or "will" be taken, occur or be achieved. Although the forward-looking statements contained in this prospectus reflect management's current beliefs based upon information currently available to management and upon assumptions which management believes to be reasonable, actual results may differ materially from those stated in or implied by these forward-looking statements.
A number of factors could cause actual results, performance or achievements to differ materially from the results expressed or implied in the forward-looking statements, including those listed in the "Risk Factors" section of this prospectus. These factors should be considered carefully and readers should not place undue reliance on the forward-looking statements. Forward-looking statements necessarily involve significant known and unknown risks, assumptions and uncertainties that may cause our actual results, performance and opportunities in future periods to differ materially from those expressed or implied by such forward-looking statements. These risks and uncertainties include, among other things:
- •
- our ability to complete pending acquisitions and successfully integrate newly acquired businesses and stores into our
current operations;
- •
- changes in customer demand for our products and services;
- •
- the actions of third parties who offer products and services to or for us;
- •
- regulatory matters affecting our products and services;
- •
- the duration and impact of any economic downturn;
- •
- our ability to effectively compete in the financial services industry and maintain our share of the market;
- •
- the effects of any current or future litigation or regulatory proceedings against us;
- •
- our ability to offer new products and services;
- •
- our ability to compete in light of technological advances;
- •
- our ability to safeguard against employee error and theft;
- •
- our dependence upon key management personnel and executives;
- •
- issues relating to our information systems; and
- •
- the influence of our largest shareholder, Diamond Castle, on our business.
Although we have attempted to identify important risks and factors that could cause actual actions, events or results to differ materially from those described in or implied by our forward-looking statements, other factors and risks may cause actions, events or results to differ materially from those anticipated, estimated or intended. We cannot assure you that forward-looking statements will prove to be accurate, as actual actions, results and future events could differ materially from those anticipated or implied by such statements. Accordingly, as noted above, readers should not place undue reliance on forward-looking statements. These forward-looking statements are made as of the date of this prospectus and, except as required by law, we assume no obligation to update or revise them to reflect new events or circumstances.
46
CERTAIN FINANCIAL MEASURES AND OTHER INFORMATION
Our consumer loan product offerings vary state-by-state, depending on the applicable statutes in each jurisdiction.
We calculate per store revenue by dividing our total revenue over the applicable period by the average number of stores we operated during a period. We calculate each store's contribution to Adjusted EBITDA by dividing Adjusted EBITDA over the applicable period by the average number of stores we operated during such period. We calculate the average number of stores we operated during a period by adding the number of stores operated on each day of the period and dividing that number by the number of days in such period. Where these metrics are compared to those of our publicly traded competitors, we have calculated them for our competitors using the same method. In calculating Adjusted EBITDA for our competitors we add back to their net income the following, based on the following publicly available financial information: provision for taxes, depreciation and amortization expense, net interest expense and, where applicable, non-cash compensation expense, charges related to one-time legal settlements and losses realized in connection with discontinued operations.
Revenue and other financial information for our acquired businesses and businesses to be acquired for periods prior to our acquisition of such businesses have been derived from unaudited internal financial information that was provided to us by the sellers in each completed acquisition and pending acquisition. Thus, this information was not subject to our accounting controls and has not been reviewed by our independent accountants, and we cannot assure you that it is accurate.
47
We estimate that the net proceeds from this offering with respect to the shares to be sold by us will be $106.8 million, after deducting the underwriting discount and estimated expenses payable by us in connection with this offering, and assuming a public offering price of $11.00 per share (the midpoint of the price range set forth on the cover of this prospectus), assuming no exercise of the underwriters' overallotment option.
We will not receive any of the proceeds from the sale of shares by the selling shareholders in connection with any exercise of the underwriters' overallotment option. However, we will receive net proceeds of approximately $2.0 million if the underwriters exercise their overallotment option in full, prior to giving effect to the payment of $5.2 million to management referred to under the heading "Management's Discussion and Analysis of Financial Condition and Results of Operations—Contractual Obligations and Commitments".
We intend to use the net proceeds received by us to fund acquisitions, including the Florida Acquisition, to pay a termination fee of approximately $5.8 million under our management agreement and for general corporate purposes, which may include redeeming up to $39.5 million aggregate principal amount of our 10.75% senior secured notes due 2019.
The net proceeds from the offering of the senior notes, together with the initial borrowings under our revolving credit facility and cash on hand, were used to retire $207.2 million of CheckSmart's outstanding debt and $74.1 million of CCCS's outstanding debt, pay a $120.6 million special dividend to our shareholders, and pay a $4.4 million bonus to management.
We have discussions on an ongoing basis regarding possible acquisitions of businesses complementary to our business. Although we may use a portion of the net proceeds received by us for these kinds of possible acquisitions, no definitive agreements or commitments in this regard currently exist.
A $1.00 increase (decrease) in the assumed initial public offering price of $11.00 per share would increase (decrease) the net proceeds to us from this offering by $9.9 million, assuming the number of shares offered by us, as set forth on the cover page of this prospectus, remains the same and after deducting the underwriting discount and estimated offering expenses payable by us. In addition, an increase or decrease in the number of shares of our common shares sold by us in this offering by 10% would cause the net proceeds received by us from this offering, after deducting the estimated underwriting discount and estimated offering expenses, to increase or decrease by approximately $10.9 million, assuming an initial offering price of $11.00 per common share, which is the midpoint of the estimated range set forth on the cover page of this prospectus.
48
We paid a special dividend of $120.6 million to our shareholders in April 2011 in connection with the offering of our senior notes. Although we have paid a special dividend in the past, we do not expect to pay dividends on our common shares for the foreseeable future. Our future decisions concerning the payment of dividends on our common shares will depend upon our results of operations, financial condition, contractual obligations, business prospects and capital expenditure plans, as well as any other factors that our board of directors may consider relevant. Our ability to pay dividends is subject to covenants contained in the agreement governing our revolving credit facility and the indenture governing our senior notes, subject to certain exceptions, including customary baskets.
49
The table below shows our cash and cash equivalents and capitalization as of December 31, 2011. The table also shows our cash and cash equivalents and capitalization as adjusted to give effect to this offering, assuming a public offering price of $11.00 per share, and our receipt of the estimated net proceeds of shares sold by us in this offering. You should read the table in conjunction with the information set forth under "Use of Proceeds", "Selected Historical Consolidated Financial Data" and "Management's Discussion and Analysis of Financial Condition and Results of Operations" and our consolidated financial statements and related notes included elsewhere in this prospectus.
| |
As of December 31, 2011 | |||||||||
|---|---|---|---|---|---|---|---|---|---|---|
| |
Actual | As adjusted(1)(2) | ||||||||
(in thousands) |
||||||||||
Cash and cash equivalents |
$ | 65,635 | $ | 125,971 | (3)(4) | |||||
Current debt: |
||||||||||
Current portion of long-term debt |
— | — | ||||||||
Notes payable |
— | — | ||||||||
Total current debt |
— | — | ||||||||
Long-term debt: |
||||||||||
Revolving credit facility |
— | — | ||||||||
Alabama revolving credit facility |
— | — | ||||||||
Senior notes |
395,000 | 355,500 | ||||||||
Total long-term debt |
395,000 | 355,500 | ||||||||
Total debt |
395,000 | 355,500 | ||||||||
Shareholders' equity: |
||||||||||
Preferred shares, $0.01 par value; 3,000 shares authorized, no shares issued and outstanding |
— | — | ||||||||
Common shares, $0.01 par value; 300,000 shares authorized, 7,982 shares issued and outstanding actual, 18,648 shares issued and outstanding as adjusted |
80 | 187 | ||||||||
Additional paid-in capital |
113,250 | 222,009 | ||||||||
Accumulated other comprehensive income |
— | — | ||||||||
Retained deficit |
(52,016 | ) | (57,731 | ) | ||||||
Total shareholders' equity |
61,314 | 164,465 | ||||||||
Total capitalization |
$ | 456,314 | $ | 519,965 | ||||||
- (1)
- A
$1.00 increase (decrease) in the assumed initial public offering price per share would increase (decrease) each of as adjusted cash and cash equivalents,
total shareholders' equity and total capitalization by $9.9 million, assuming the number of shares offered by us, as set forth on the cover page of this prospectus, remains the same and after
deducting the underwriting discount and estimated offering expenses payable by us.
- (2)
- Assumes
(a) redemption of $39.5 million aggregate principal amount of our senior notes and (b) the vesting of certain equity
compensation awards in connection with this offering and associated expense related to such options.
- (3)
- Assumes
the payment of a termination fee of approximately $5.8 million under our management agreement.
- (4)
- This amount does not give effect to the use of approximately $22 million of cash as payment of the purchase price for the DFS Acquisition or our expected use of $45.5 million as payment of the purchase price for the Florida Acquisition. Giving effect thereto, the amount of cash and cash equivalents would be $58.5 million.
50
Dilution is the amount by which the portion of the offering price paid by the investors purchasing common shares to be sold in this offering exceeds the net tangible book value per common share after the offering. Net tangible book value per common share is determined at any date by subtracting total liabilities from our total assets less our intangible assets and dividing the difference by the number of common shares outstanding at that date.
Our net tangible book value as of December 31, 2011 was approximately $(198.2) million, or $(24.83) per common share. After giving effect to our receipt of approximately $106.8 million of estimated net proceeds (after deducting the underwriting discount and estimated offering expenses payable by us) from our sale of common shares in this offering based on an assumed initial public offering price of $11.00 per common share, which is the midpoint of the estimated range set forth on the cover page of this prospectus, our adjusted net tangible book value as of December 31, 2011, would have been approximately $(91.4) million, or $(4.90) per common share. This amount represents an immediate increase in net tangible book value of $19.93 per common share to existing shareholders and an immediate dilution of $15.90 per common share to investors purchasing common shares in this offering at the assumed initial public offering price.
The following table illustrates this dilution on a per share basis:
Assumed initial public offering price per share |
$ | 11.00 | |||
Net tangible book value per share as of December 31, 2011 |
$ | (24.83 | ) | ||
Increase per share attributable to new investors |
$ | 19.93 | |||
As adjusted net tangible book value per share after this offering |
$ | (4.90 | ) | ||
Dilution in as adjusted net tangible book value per share to new investors |
$ | 15.90 | |||
A $1.00 increase (decrease) in the assumed initial public offering price per common share would increase (decrease) our as adjusted net tangible book value by $9.9 million, our as adjusted net tangible book value per share by $0.53 per share and the dilution in as adjusted net tangible book value to new investors in this offering by $0.47 per share, assuming the number of common shares offered by us, as set forth on the cover page of this prospectus, remains the same.
The following table summarizes on an as adjusted basis as of December 31, 2011, the number of common shares purchased from us, the total contribution paid to us, and the average price per share paid to us by our existing shareholders and to be paid by new investors purchasing common shares from us in this offering. The table is based on an assumed initial public offering price of $11.00 per share before deduction of the underwriting discount and estimated expenses payable by us in connection with this offering:
| |
Shares Purchased | Total Consideration | |
|||||||||||||
|---|---|---|---|---|---|---|---|---|---|---|---|---|---|---|---|---|
| |
Average Price per Share |
|||||||||||||||
| |
Number | Percent | Amount | Percent | ||||||||||||
| |
|
|
(in thousands) |
|
|
|||||||||||
Existing investors |
7,981,536 | 43 | % | $ | 113,330 | 49 | % | $ | 14.20 | |||||||
New investors |
10,666,667 | 57 | 117,333 | 51 | 11.00 | |||||||||||
Total |
18,648,203 | 100 | % | $ | 230,663 | 100 | % | |||||||||
The above discussion and tables assume no exercise of the underwriters' option to purchase up to an aggregate of 1,600,000 additional common shares from us and the selling shareholders.
If the underwriters exercise their option to purchase additional shares in full and, as a result, management is paid the $5.2 million described under the heading "Management's Discussion and Analysis of Financial Condition and Results of Operations—Contractual Obligations and Commitments":
- •
- the percentage of our common shares held by our existing shareholders will decrease to approximately 34.9% of the total
outstanding amount of our common shares after this offering;
- •
- the common shares held by new investors will represent approximately 65.1% of the total outstanding amount of our common
shares after this offering; and
- •
- there will be an immediate dilution of $16.02 per common share to new investors.
51
SELECTED HISTORICAL CONSOLIDATED FINANCIAL DATA
The following table sets forth selected historical consolidated financial data as of and for the years ended December 31, 2007, 2008, 2009, 2010 and 2011. The selected historical consolidated financial data as of December 31, 2010 and 2011 and for each of the years ended December 31, 2009, 2010 and 2011 have been derived from, and should be read together with, our audited historical consolidated financial statements and the accompanying notes included elsewhere in this prospectus. The selected historical consolidated financial data as of December 31, 2007, 2008 and 2009 and for each of the years ended December 31, 2007 and 2008 have been derived from CCFI's audited historical consolidated financial statements not included in this prospectus.
The results of operations for the periods presented below are not necessarily indicative of the results to be expected for any future period. The selected historical financial data should be read together with the section captioned "Management's Discussion and Analysis of Financial Condition and Results of Operations" (including the discussion therein of critical accounting policies and recent acquisitions) and CCFI's consolidated financial statements and the accompanying notes included elsewhere in this prospectus.
| |
Year Ended December 31, | ||||||||||||||||
|---|---|---|---|---|---|---|---|---|---|---|---|---|---|---|---|---|---|
(In thousands)
|
2007 | 2008 | 2009 | 2010 | 2011 | ||||||||||||
Statement of Operations Data: |
|||||||||||||||||
Finance receivable fees |
$ | 138,736 | $ | 152,732 | $ | 136,957 | $ | 146,059 | $ | 196,153 | |||||||
Check cashing fees |
23,822 | 25,634 | 53,049 | 55,930 | 72,800 | ||||||||||||
Card fees |
— | 1,808 | 2,063 | 10,731 | 19,914 | ||||||||||||
Other |
11,298 | 8,845 | 10,614 | 11,560 | 18,067 | ||||||||||||
Total revenues |
173,856 | 189,019 | 202,683 | 224,280 | 306,934 | ||||||||||||
Branch expenses: |
|||||||||||||||||
Salaries and benefits |
30,891 | 33,738 | 34,343 | 38,759 | 57,411 | ||||||||||||
Provision for loan losses |
37,026 | 37,544 | 43,463 | 40,316 | 65,351 | ||||||||||||
Occupancy |
11,413 | 13,457 | 13,855 | 14,813 | 21,216 | ||||||||||||
Depreciation and amortization |
5,920 | 10,422 | 6,613 | 5,318 | 5,907 | ||||||||||||
Other |
21,339 | 21,420 | 22,652 | 27,994 | 35,515 | ||||||||||||
Total branch expenses |
106,589 | 116,581 | 120,926 | 127,200 | 185,400 | ||||||||||||
Branch gross profit |
67,267 | 72,438 | 81,757 | 97,080 | 121,534 | ||||||||||||
Corporate expenses |
29,518 | 31,795 | 31,518 | 33,940 | 44,742 | ||||||||||||
Transaction expense |
— | — | — | 237 | 9,351 | ||||||||||||
Depreciation and amortization |
1,513 | 1,063 | 568 | 1,222 | 2,332 | ||||||||||||
Interest expenses, net |
18,421 | 16,191 | 11,532 | 8,501 | 34,334 | ||||||||||||
Goodwill impairment |
— | 53,263 | — | — | |||||||||||||
Equity investment loss |
— | — | — | — | 415 | ||||||||||||
Non-operating income, management fees |
(104 | ) | (260 | ) | (172 | ) | (46 | ) | (46 | ) | |||||||
Income (loss) before provision (benefit) for income taxes, discontinued operations, and extraordinary item |
17,919 | (29,614 | ) | 38,311 | 53,226 | 30,406 | |||||||||||
Provision (benefit) for income taxes |
7,237 | (10,635 | ) | 14,042 | 19,801 | 13,553 | |||||||||||
Income (loss) from continuing operations |
10,682 | (18,979 | ) | 24,269 | 33,425 | 16,853 | |||||||||||
Discontinued operations(1) |
243 | 482 | 368 | (2,196 | ) | — | |||||||||||
Income (loss) before extraordinary item |
10,925 | (18,497 | ) | 24,637 | 31,229 | 16,853 | |||||||||||
Extraordinary item(2) |
— | 3,913 | — | — | — | ||||||||||||
Net income (loss) |
10,925 | (22,410 | ) | 24,637 | 31,229 | 16,853 | |||||||||||
Net loss attributable to non-controlling interests |
— | — | — | (252 | ) | (120 | ) | ||||||||||
Net income (loss) attributable to controlling interests |
$ | 10,925 | $ | (22,410 | ) | $ | 24,637 | $ | 31,481 | $ | 16,973 | ||||||
52
| |
Year Ended December 31, | |||||||||||||||||
|---|---|---|---|---|---|---|---|---|---|---|---|---|---|---|---|---|---|---|
(In thousands, except per share and share amounts) |
2007 | 2008 | 2009 | 2010 | 2011 | |||||||||||||
Earnings per share—basic |
||||||||||||||||||
Operating income (loss) available to controlling interests—per share |
$ | 1.74 | $ | (3.09 | ) | $ | 3.95 | $ | 5.49 | $ | 2.30 | |||||||
Discontinued operations—per share |
.04 | .08 | .06 | (.36 | ) | — | ||||||||||||
Extraordinary item—per share |
— | (.64 | ) | — | — | — | ||||||||||||
Net income (loss) available to controlling interests—per share |
$ | 1.78 | $ | (3.65 | ) | $ | 4.01 | $ | 5.13 | $ | 2.30 | |||||||
Earnings per share—diluted |
||||||||||||||||||
Operating income (loss) available to controlling interests—per share |
$ | 1.71 | $ | (3.09 | ) | $ | 3.88 | $ | 5.33 | $ | 2.21 | |||||||
Discontinued operations—per share |
.04 | .08 | .06 | (.34 | ) | — | ||||||||||||
Extraordinary item—per share |
— | (.64 | ) | — | — | — | ||||||||||||
Net income (loss) available to controlling interests—per share |
$ | 1.75 | $ | (3.65 | ) | $ | 3.94 | $ | 4.99 | $ | 2.21 | |||||||
Weighted average common shares outstanding—basic |
6,139,536 | 6,139,536 | 6,139,536 | 6,139,536 | 7,380,996 | |||||||||||||
Weighted average common shares outstanding—diluted |
6,249,366 | 6,139,536 | 6,251,316 | 6,314,358 | 7,686,072 | |||||||||||||
- (1)
- Discontinued
operations is presented net of provision (benefit) for income tax of $151, $299, $226, ($1,346) and $0 for the years ended December 31,
2007, 2008, 2009, 2010 and 2011, respectively.
- (2)
- Represents cost of ballot initiatives in Ohio and Arizona in 2008.
| |
Year Ended December 31, | |||||||||||||||||
|---|---|---|---|---|---|---|---|---|---|---|---|---|---|---|---|---|---|---|
(In thousands, except for store count)
|
2007 | 2008 | 2009 | 2010 | 2011 | |||||||||||||
Balance Sheet Data (at period end): |
||||||||||||||||||
Cash and cash equivalents |
$ | 25,020 | $ | 25,883 | $ | 27,959 | $ | 39,780 | $ | 65,635 | ||||||||
Finance receivables, net |
48,620 | 51,954 | 66,035 | 81,337 | 120,451 | |||||||||||||
Total assets |
301,412 | 266,922 | 280,476 | 310,644 | 515,547 | |||||||||||||
Total debt |
201,714 | 195,800 | 193,365 | 188,934 | 395,000 | |||||||||||||
Total stockholders' equity |
72,040 | 50,768 | 77,791 | 109,791 | 61,314 | |||||||||||||
Other Operating Data (unaudited): |
||||||||||||||||||
Stores in operation: |
||||||||||||||||||
Beginning of period |
211 | 256 | 252 | 264 | 282 | |||||||||||||
Acquired |
17 | — | 8 | 19 | 151 | |||||||||||||
Opened |
28 | 2 | 4 | 2 | 2 | |||||||||||||
Closed |
— | 6 | — | 3 | — | |||||||||||||
End of period |
256 | 252 | 264 | 282 | 435 | |||||||||||||
Capital Expenditures: |
||||||||||||||||||
Purchases of property and equipment, net |
$ | 12,298 | $ | 2,969 | $ | 2,769 | $ | 1,688 | $ | 4,261 | ||||||||
Store acquisition costs: |
||||||||||||||||||
Property and equipment |
957 | — | — | 1,144 | 7,235 | |||||||||||||
Intangible assets |
440 | — | — | 1,737 | 3,344 | |||||||||||||
Total capital expenditures |
$ | 13,695 | $ | 2,969 | $ | 2,769 | $ | 4,569 | $ | 14,840 | ||||||||
53
| |
Year Ended December 31, | ||||||||||||||||
|---|---|---|---|---|---|---|---|---|---|---|---|---|---|---|---|---|---|
(In thousands, except for averages, percentages or unless otherwise specified)
|
2007 | 2008 | 2009 | 2010 | 2011 | ||||||||||||
Check Cashing Data (unaudited): |
|||||||||||||||||
Face amount of checks cashed |
$ | 708,860 | $ | 821,475 | $ | 1,309,425 | $ | 1,442,501 | $ | 2,163,276 | |||||||
Face amount of average check |
$ | 418.01 | $ | 442.36 | $ | 432.08 | $ | 438.13 | $ | 444.26 | |||||||
Average fee per check |
$ | 13.76 | $ | 13.80 | $ | 17.51 | $ | 16.99 | $ | 14.95 | |||||||
Number of checks cashed |
1,698 | 1,857 | 3,029 | 3,292 | 4,869 | ||||||||||||
Returned Check Data (unaudited): |
|||||||||||||||||
Returned check expense |
$ | 2,006 | $ | 1,760 | $ | 3,058 | $ | 3,034 | $ | 5,085 | |||||||
Returned check expense as a percentage of face amount of checks cashed |
0.3 | % | 0.2 | % | 0.2 | % | 0.2 | % | 0.2 | % | |||||||
Short-Term Consumer Loan Data (unaudited): |
|||||||||||||||||
Loan volume (originations and refinancings) |
$ | 1,081,865 | $ | 1,116,869 | $ | 1,162,086 | $ | 1,237,163 | $ | 1,543,310 | |||||||
Average new loan size |
385.55 | 382.62 | 412.67 | 418.53 | 425.72 | ||||||||||||
Average new loan fee |
50.24 | 50.84 | 42.79 | 43.14 | 46.37 | ||||||||||||
Loan loss provision |
$ | 34,166 | $ | 33,849 | $ | 28,856 | $ | 27,560 | $ | 40,636 | |||||||
Loan loss provision as a percentage of loan volume |
3.2 | % | 3.0 | % | 2.5 | % | 2.2 | % | 2.6 | % | |||||||
Medium-Term Loan Operating Data (unaudited)(1): |
|||||||||||||||||
Principal outstanding |
$ | — | $ | 2,995 | $ | 3,109 | $ | 3,601 | $ | 12,174 | |||||||
Number of loans outstanding |
— | 7,525 | 9,365 | 10,275 | 20,818 | ||||||||||||
Average principal outstanding |
$ | — | $ | 397.98 | $ | 331.97 | $ | 350.47 | $ | 584.79 | |||||||
Average monthly percentage rate |
0 | % | 22.03 | % | 22.3 | % | 22.0 | % | 19.2 | % | |||||||
Allowance as a percentage of finance receivable |
— | 14.3 | % | 42.7 | % | 11.7 | % | 10.6 | % | ||||||||
Loan loss provision |
$ | — | $ | — | $ | 6,708 | $ | 5,267 | $ | 11,470 | |||||||
Title Loan Operating Data (unaudited): |
|||||||||||||||||
Principal outstanding |
$ | 2,205 | $ | 2,720 | $ | 6,047 | $ | 9,541 | $ | 17,334 | |||||||
Number of loans outstanding |
2,187 | 3,178 | 6,077 | 9,597 | 15,283 | ||||||||||||
Average principal outstanding |
$ | 1,008.42 | $ | 855.85 | $ | 995.00 | $ | 994.12 | $ | 1,134.20 | |||||||
Average monthly percentage rate |
16.06 | % | 15.8 | % | 16.0 | % | 13.8 | % | 13.3 | % | |||||||
Allowance as a percentage of finance receivable |
4.6 | % | 5.3 | % | 12.1 | % | 5.3 | % | 5.3 | % | |||||||
Loan loss provision |
$ | 854 | $ | 1,209 | $ | 2,970 | $ | 3,497 | $ | 5,463 | |||||||
Overall Company Data (unaudited): |
|||||||||||||||||
Total revenues |
$ | 173,856 | $ | 189,019 | $ | 202,683 | $ | 224,280 | $ | 306,934 | |||||||
Loan loss provisions |
37,026 | 36,818 | 41,592 | 39,358 | 62,654 | ||||||||||||
Other ancillary product provisions |
— | 726 | 1,871 | 958 | 2,697 | ||||||||||||
Total loan loss provision |
$ | 37,026 | $ | 37,544 | $ | 43,463 | $ | 40,316 | $ | 65,351 | |||||||
Total loan loss provision as a percentage of revenue |
21.3 | % | 19.9 | % | 21.4 | % | 18.0 | % | 21.3 | % | |||||||
- (1)
- Loan participations are grouped with medium-term loans in our consolidated financial statements included elsewhere in this prospectus, but are excluded from these calculations.
54
UNAUDITED PRO FORMA CONSOLIDATED FINANCIAL INFORMATION
The following unaudited pro forma consolidated financial information is based on the historical financial statements of CCFI, and CCCS, each included elsewhere in this prospectus, adjusted to give pro forma effect to the California Acquisition, the Illinois Acquisition, the senior notes offering, the establishment of our revolving credit facility and this offering. The unaudited pro forma consolidated statement of income for the year ended December 31, 2011 gives effect to the California Acquisition, the Illinois Acquisition, the senior notes offering, the establishment of our revolving credit facility and this offering as if they were each consummated on January 1, 2011, the first day of our most recently completed fiscal year.
Assumptions underlying the pro forma adjustments are described in the accompanying notes, which should be read in conjunction with this unaudited pro forma consolidated financial information. The pro forma adjustments described in the accompanying notes have been made based on available information and, in the opinion of management, are reasonable. The unaudited pro forma consolidated financial information should not be considered indicative of actual results that would have been achieved had these transactions occurred on the date indicated and do not purport to indicate results of operations as of any future date or for any future period. We cannot assure you that the assumptions used in the preparation of the unaudited pro forma consolidated financial information will prove to be correct. The unaudited pro forma consolidated financial information should be read together with the information set forth under the headings "Prospectus Summary—Overview", "Management's Discussion and Analysis of Financial Condition and Results of Operations", "Business", the historical financial statements of CCFI and CCCS and the notes thereto, and the other financial information included elsewhere in this prospectus.
The acquisition of CCCS by CCFI has been accounted for as a purchase in conformity with Accounting Standards Codification, or ASC, No. 805, Business Combinations, with intangible assets recorded in accordance with ASC No. 350, Intangibles-Goodwill and Other. The excess of the purchase price over the historical basis of the net assets to be acquired has been allocated in the accompanying pro forma condensed consolidated financial information based on management's best estimates of the fair values and certain assumptions that management believes are reasonable.
The pro forma adjustments related to the Illinois Acquisition are derived from unaudited internal financial information that was provided to us by the seller in the Illinois Acquisition. Thus, this information was not subject to our accounting controls and has not been reviewed by our independent accountants, and we cannot assure you that it is accurate.
55
Community Choice Financial Inc.
Unaudited Pro Forma Consolidated Statement of Income
for the Year Ended December 31, 2011
| |
CCFI 2011 |
California Acquisition Jan 2011 – April 2011 |
Illinois Acquisition Jan 2011 – March 2011 |
Acquisition Adjustments |
Adjustments for Senior Notes Offering |
Adjustments Related to this Offering |
Total 2011 |
||||||||||||||||
|---|---|---|---|---|---|---|---|---|---|---|---|---|---|---|---|---|---|---|---|---|---|---|---|
Revenue: |
|||||||||||||||||||||||
Finance Receivable Fees |
$ | 196,153 | $ | 10,498 | $ | 1,442 | $ | — | $ | — | $ | — | $ | 208,093 | |||||||||
Check Cashing Fees |
72,800 | 9,472 | — | — | — | — | 82,272 | ||||||||||||||||
Card Fees |
19,914 | 697 | — | — | — | — | 20,611 | ||||||||||||||||
Other |
18,067 | 3,667 | 17 | — | — | — | 21,751 | ||||||||||||||||
Total Revenue |
306,934 | 24,334 | 1,459 | — | — | — | 332,727 | ||||||||||||||||
Salaries and Benefits |
57,411 | 7,567 | 308 | — | — | — | 65,286 | ||||||||||||||||
Provision for Loan Losses |
65,351 | 2,468 | 13 | — | — | — | 67,832 | ||||||||||||||||
Occupancy |
21,216 | 2,907 | 84 | — | — | — | 24,207 | ||||||||||||||||
Depreciation and Amortization |
5,907 | 131 | 12 | — | — | — | 6,050 | ||||||||||||||||
Other |
35,515 | 1,953 | 185 | — | — | — | 37,653 | ||||||||||||||||
Total Branch Expenses |
185,400 | 15,026 | 602 | — | — | — | 201,028 | ||||||||||||||||
Branch Gross Profit |
121,534 | 9,308 | 857 | — | — | — | 131,699 | ||||||||||||||||
Corporate Expenses |
54,093 | 10,146 | — | (17,081 | )(a) | — | (1,648 | )(f) | 45,510 | ||||||||||||||
Depreciation and Amortization |
2,332 | 1,119 | — | (44 | )(b) | — | — | 3,407 | |||||||||||||||
Interest Expense, net |
34,334 | 2,248 | — | — | 8,558 | (d) | (4,434 | )(g) | 40,706 | ||||||||||||||
Goodwill Impairment |
— | 28,986 | — | — | — | — | 28,986 | ||||||||||||||||
Equity Investment Loss |
415 | — | — | — | — | — | 415 | ||||||||||||||||
Non-operating Income, mgmt fees |
(46 | ) | — | — | — | — | — | (46 | ) | ||||||||||||||
Income before taxes |
30,406 | (33,191 | ) | 857 | 17,125 | (8,558 | ) | 6,802 | 12,721 | ||||||||||||||
Provision for Income Taxes |
13,553 | (12,613 | ) | 326 | 4,509 | (3,252 | )(e) | 2,311 | (h) | 4,834 | |||||||||||||
Total Net Income |
16,853 | (20,578 | ) | 531 | 12,616 | (5,306 | ) | 1,022 | 7,887 | ||||||||||||||
Basic earnings per share |
$ | 2.30 | |||||||||||||||||||||
Diluted earnings per share |
$ | 2.21 | |||||||||||||||||||||
Pro forma basic earnings per share |
$ | .61 | |||||||||||||||||||||
Pro forma diluted earnings per share |
$ | .58 | |||||||||||||||||||||
Weighted average basic shares outstanding |
7,380,996 | ||||||||||||||||||||||
Weighted average diluted shares outstanding |
7,686,072 | ||||||||||||||||||||||
Pro forma weighted average basic shares outstanding |
13,163,132 | ||||||||||||||||||||||
Pro forma weighted average diluted shares outstanding |
13,790,573 | ||||||||||||||||||||||
56
Community Choice Financial Inc.
Notes to Unaudited Pro Forma Condensed Consolidated
Statement of Income for the Year Ended December 31, 2011
- (a)
- The
$17.1 million adjustment to corporate expenses consists of CCFI's $9.4 million of transaction expenses and CCCS's $7.7 million of
transaction expenses. The CCFI transaction expenses relate to the California Acquisition, Illinois Acquisition, the establishment of our revolving credit facility and the offering of our senior notes.
The CCCS transaction expenses consist of seller's costs, including equity holder's fees, merger costs, and bonuses and severance payments related to the California Acquisition.
- (b)
- Reflects
a decrease to depreciation and amortization based upon the estimate of the portion of the purchase price for the California Acquisition to be
allocated to the fair value of identifiable intangibles of $0.3 million. This is a result of the estimated identifiable intangibles acquired in connection with the California Acquisition being
lowered to an amount less than the amount historically recorded by CCCS as of December 31, 2010. Also reflects a charge to depreciation and amortization based upon the estimate of the portion
of the purchase price for the Illinois Acquisition to be allocated to the fair value of identifiable intangibles of $0.1 million.
- (c)
- Reflects
federal income tax provision estimated at 38% related to the pro forma adjustments for the California Acquisition and the Illinois Acquisition for
the year ended December 31, 2011 and normalization of income taxes paid by CCFI due to transaction expenses.
- (d)
- Reflects, for 2011, the additional interest expense in connection with our senior notes and our revolving credit facility at annual interest rates of 10.75% and 7.25% (at the alternative base rate as described under "Description of Certain Indebtedness"), respectively, in addition to the amortization of deferred financing fees of $2.1 million and commitment fees related to our revolving credit facility and our Alabama revolving credit facility.
57
The below table assumes that we paid down the $10 million borrowed under the revolving credit facility as of April 30, 2011.
| |
Interest Adjustment | |||||
|---|---|---|---|---|---|---|
Senior Notes Outstanding |
$ | 395,000 | ||||
Annual Interest Rate |
10.75 | % | ||||
Annual Interest on Senior Notes Outstanding |
$ | 42,463 | ||||
Revolving Credit Facilities |
||||||
Main Revolving Credit Facility |
||||||
Total Facility |
$ | 40,000 | ||||
Annual Interest Rate on Amount Drawn |
7.25 | % | ||||
Annual Commitment Fee on Undrawn Amount |
0.75 | % | ||||
Average Outstanding |
$ | 3,333 | ||||
Interest on Amount Drawn |
$ | 242 | ||||
Annual Commitment Fee on Undrawn Amount |
$ | 296 | ||||
Total Annual Interest on Main Revolving Credit Facility |
$ | 538 | ||||
Alabama Revolving Credit Facility |
||||||
Total Facility |
$ | 7,000 | ||||
Annual Interest Rate on Amount Drawn |
5.00 | % | ||||
Average Outstanding |
$ | — | ||||
Annual Interest on Amount Drawn |
$ | — | ||||
Commitment Fees |
$ | 20 | ||||
Total Annual Interest on Alabama Revolving Credit Facility |
$ | 20 | ||||
Annual Deferred Financing Costs |
$ | 2,119 | ||||
Total Pro Forma Interest Calculation |
$ | 45,140 | ||||
Interest Adjustment Calculation |
||||||
CCFI 2011 Actual Interest Expense |
$ | 34,334 | ||||
CCCS 2011 Actual Interest Expense |
$ | 2,248 | ||||
Total 2011 Actual Interest Paid |
$ | 36,582 | ||||
Pro Forma Interest Adjustment |
$ | 8,558 | ||||
- (e)
- Adjustment
reflects the tax effect of the additional interest expense at the estimated effective tax rate of 38%.
- (f)
- Reflects
the elimination of management fees paid by us to Diamond Castle of $1.3 million for the year ended December 31, 2011. Also reflects
the elimination of management fees paid by CCCS to Golden Gate Capital of $0.3 million for the period from January 1, 2011 through April 29, 2011.
- (g)
- Reflects
the decrease in interest expense of $4.246 million and amortization of $0.188 million in deferred financing fees after redeeming
$39.5 million aggregate principal amount of our senior notes from the proceeds of this offering.
- (h)
- Reflects the income tax provision estimated at 38% related to the elimination of management fees paid by us and CCCS to Diamond Castle and Golden Gate Capital, respectively, during 2011 and the reduction of interest expense noted in (g).
58
MANAGEMENT'S DISCUSSION AND ANALYSIS OF
FINANCIAL CONDITION AND RESULTS OF OPERATIONS
The following discussion contains management's discussion and analysis of our financial condition and results of operations and should be read in conjunction with the consolidated financial statements and the related notes included elsewhere in this prospectus. This discussion contains forward-looking statements and involves numerous risks and uncertainties, including, but not limited to, those described in the "Special Note Regarding Forward Looking Statements" and "Risk Factors" sections of this prospectus. Actual results may differ materially from those contained in any forward-looking statements.
Overview
We are a leading retail provider of alternative financial services to unbanked and underbanked consumers. Through our network of retail stores, we provide our customers a variety of financial products and services, including short-term consumer loans, medium-term loans, check cashing, prepaid debit cards, title loans and other services that address the specific needs of our individual customers. Through our retail-focused business model, which we refer to as our retail model, we strive to provide our customers with high-quality customer service and immediate access to retail financial services at competitive rates during convenient operating hours. As of December 31, 2011, we operated 435 retail storefront locations across 14 states.
Over each of the past three years, we increased revenue and Adjusted EBITDA, driven by both organic growth and acquisitions. Our retail business model consists of, among other things, a focus on customer service, incentive-based compensation structures, strategies to increase customer traffic, and an expanding product set to address a larger share of our customers' financial needs. Our overall revenue has expanded as we have executed on our retail model, which has increased incremental revenue from our existing store base, and added store count. We have limited capital expenditure requirements, and our primary store-level operating expenses are occupancy and labor. As part of our retail model, we strive to invest in premier locations and to develop a highly trained and motivated workforce, all with the aim of enhancing the customer's experience in our stores, generating increased store traffic and introducing our customers to our diversified set of products. We have achieved organic growth through increased market share and by expanding our customer relationships through our additional product offerings. Our measurement of comparable store sales growth as of December 31, 2011 includes stores which we operated for the full year of 2011 and which were open for the full year of 2010. As of December 31, 2011 we had 280 stores included in this measurement. These stores achieved comparable sales growth of 7.3% for the year ended December 31, 2011 as compared to the year ended December 31, 2010. Our acquisitions during 2011 included the addition of 10 stores in Illinois and 141 stores in California and Oregon. Our net income during the year ended December 31, 2011, declined as compared to the year ended December 31, 2010, as a result of incremental interest expense and transaction expenses associated with our acquisitions and our recapitalization discussed below under "—Recapitalization".
Factors Affecting Our Results of Operations
Expansion of our Retail Platform
We believe that our ability to execute on our retail model generates higher per store revenue and contribution to Adjusted EBITDA as compared to our publicly traded peer companies. Our results of operations are heavily impacted by the number of stores we operate and the degree to which we have integrated acquired stores into our operations. We have recently added stores primarily through acquisitions. The results of our internal customer surveys suggest that over 30% of our customers learn about our products and services and come to our stores as a result of a referral. Acquisitions allow us to leverage an established customer base, who continue to use the acquired stores and generate word-
59
of-mouth marketing as we implement our retail model at the stores, as a source of referrals. Acquisitions have also provided us an existing market presence which we have been able to build upon through expanding the acquired stores' product offerings. We have had success in deploying this model, as we were able to increase revenue for the year ended December 31, 2011 for our Michigan and Alabama acquired stores, which were acquired in August 2009 and March 2010, respectively, by 26.4% and 34.4%, respectively.
We have also grown through de novo store openings, which we have undertaken from time to time to increase our market penetration. Specifically, in 2010, following the Alabama Acquisition, we opened two de novo stores in that market to expand our brand presence and capture additional market share. In addition, in 2011 we opened two de novo stores: one in California and one in Ohio.
Our recent acquisitions include:
- •
- California Acquisition. On April 29, 2011, we acquired CCCS and its chain of 141 retail stores in California and Oregon. We undertook the California Acquisition as a means of gaining access to several key markets in California, thereby increasing our geographic diversity, and as a means of gaining additional product expertise, specifically related to CCCS's core check cashing competency. We plan to create additional value through the California Acquisition by increasing store profitability throughout CCCS's existing store chain through the execution of our retail model, the introduction of a superior prepaid debit card offering through our Insight program and a focus on growing title lending, medium-term lending, as well as by achieving additional economies of scale through our existing corporate infrastructure.
- •
- Illinois Acquisition. On March 21, 2011, we
acquired 10 stores in the Chicago metro area for a purchase price of $19.7 million. At the time of their acquisition, these stores offered only lending products. Since the Illinois Acquisition,
we have fully integrated their operations and have expanded the products and services offered in these stores to include our Insight prepaid card offering, money orders, bill payment services and
title lending, thereby further addressing the financial needs of our customers in the Chicago market.
- •
- Alabama Acquisition. In March 2010, we completed the
acquisition of a 19-store chain in Alabama for a purchase price of $15.9 million. Since the time of the acquisition we have enhanced store productivity and profitability through
focusing on customer traffic and branch cost containment. The per store contribution to our operating income from our Alabama stores has increased dramatically since the time of the acquisition.
- •
- Michigan Acquisition. In August 2009, we completed the
acquisition of eight stores in Michigan for a purchase price of $0.5 million. These stores were underperforming at the time of their acquisition and represented an opportunity for us to benefit
from our existing Michigan infrastructure to increase revenues and profitability at the acquired stores. Through implementing our retail model and focusing employees on customer service and revenue
growth, the per store contribution to our operating income from our acquired Michigan stores has grown substantially since the time of acquisition.
- •
- Insight Holding Company LLC Acquisition. In November 2011, we purchased a 22.5% interest in Insight Holding, which is the parent company of, among other entities, Insight, for which we are
We have fully integrated several aspects of CCCS's business and all integration efforts related to the California Acquisition were performed by CCFI employees and were expensed as incurred. We made investments in information technology to bring CCCS's information security, compliance and operational functionality in line with CCFI standards. We capitalized approximately $0.1 million in relation to these investments during 2011. Our results of operations for the year ended December 31, 2011 include the results of the stores acquired in the California Acquisition for the period beginning on April 29, 2011.
60
- •
- DFS Acquisition. On April 1, 2012 we acquired all of the equity interests of the DFS Companies. The purchase price was approximately $22 million, subject to a post-closing working capital adjustment. DFS offers short-term loans to consumers via the Internet under a state-licensed model in compliance with the applicable laws of the jurisdiction of its customers. Through our acquisition of DFS, we gain access to a scalable Internet-based revenue opportunity. We believe this additional retail channel will enable us to efficiently reach consumers not fully served by our existing retail locations. Our objective will be to accelerate the growth of DFS through incremental capital, application of retailing strategies and an expansion of its product offerings.
an agent of its prepaid card product. We believe this investment aligns our strategic interests and positions us to participate in the value creation at Insight.
In total, our store count increased by 151 stores during 2011 as a result of the California and Illinois Acquisitions. We did not close any stores during 2011 and opened two de novo stores. The chart below sets forth certain information regarding our stores for each of the past three years.
| |
2009 | 2010 | 2011 | ||||||||
|---|---|---|---|---|---|---|---|---|---|---|---|
# of Locations |
|||||||||||
Beginning of Period |
252 | 264 | 282 | ||||||||
Acquired |
8 | 19 | 151 | ||||||||
Opened |
4 | 2 | 2 | ||||||||
Closed |
— | 3 | — | ||||||||
End of Period |
264 | 282 | 435 | ||||||||
The following table provides the geographic composition of our locations as of December 31, 2010 and December 31, 2011:
| |
December 31, 2010 |
December 31, 2011 |
|||||
|---|---|---|---|---|---|---|---|
Alabama |
21 | 21 | |||||
Arizona |
43 | 43 | |||||
California |
17 | 156 | |||||
Florida |
10 | 10 | |||||
Indiana |
21 | 21 | |||||
Illinois |
— | 10 | |||||
Kansas |
6 | 6 | |||||
Kentucky |
13 | 13 | |||||
Michigan |
14 | 14 | |||||
Missouri |
7 | 7 | |||||
Ohio |
98 | 99 | |||||
Oregon |
— | 3 | |||||
Utah |
10 | 10 | |||||
Virginia |
22 | 22 | |||||
Total Locations |
282 | 435 | |||||
Overall Trends in Consumer Credit
Our revenues are influenced by trends in the overall market for consumer financial products and services. We believe, as a result of these current trends, our addressable market is growing. A study conducted by the FDIC published in 2009 indicates that 25.6% of U.S. households are either unbanked or underbanked, representing approximately 60 million adults. As traditional financial institutions
61
increase fees for consumer services, such as checking accounts and debit cards, and as traditional credit sources tighten credit standards as a result of economic and other market driven developments, consumers have looked elsewhere for less expensive and more convenient alternatives to meet their financial needs. According to a recent Federal Reserve Bank of New York report, total consumer credit outstanding has declined over $1.4 trillion since its peak in the third quarter of 2008. Since the adoption of the Credit Card Accountability, Responsibility and Disclosure Act of 2009, we believe that traditional credit card issuers have tightened their underwriting standards. This contraction in the supply of consumer credit has resulted in significant unmet demand for consumer loan products. We believe this shift has resulted in increased demand for our loan products, as consumers have had their traditional sources of consumer credit reduced or terminated.
Changes in Legislation
During the last few years, legislation that has required us to alter the manner in which we offer certain products and services has been introduced or adopted in a number of states. See "Business—Regulation and Compliance" for a discussion of the various regulatory regimes applicable to our business and certain recent legislative developments affecting our industry. Some of these legislative and regulatory changes may result in the discontinuation of certain operations, while others may result in less significant short-term or long-term changes, interruptions in revenues and lower operating margins. In order to address market, legislative and regulatory developments, we regularly refine our product offerings and develop new products and services to better serve our customers.
Recent developments include:
Virginia. In Virginia, as a result of changes in legislation in early 2009, we transitioned a significant portion of our customers from cash advance products to an open-ended line of credit.
Arizona. As a result of the expiration of the enabling statute for deferred presentment loans in Arizona in mid-2010, we transitioned customers from short-term consumer loans to other loan products, such as title loans and loans from third-party lending offerings, which may be delivered via prepaid debit cards.
Illinois. In Illinois, House Bill 537, which created an installment payday loan product with a term of not less than 112 days and not more than 180 days, went into effect on March 21, 2011. We believe the new statute provides legislative stability in the state and that our retail-oriented business model will prove successful with this product.
In certain states, either in compliance with law or through our following of best practices recommended by the Community Financial Services Association of America, or CFSA, we offer an extended payment plan for all borrowers. This extended payment plan is advertised to all customers where the program is offered, either via pamphlet or by being posted at the store at the time of the loan. This payment plan is available to all customers in these states upon request and is not contingent on the borrower's repayment status or further underwriting standards. The term is extended from an average of approximately 17 days to roughly four payments over eight weeks. If customers do not make these payments, then their held check is deposited. Loan receivables subject to these repayment plans represented $1.4 million of the $131.3 million of total receivables at December 31, 2011.
We believe that our ability to develop legal and financially viable products and services, as the regulatory environment evolves, is one of our competitive strengths.
New Product Expansion and Trends
We constantly seek to develop and offer new products in order to address the full range of our customers' financial needs. From 2009 to 2011, revenue from our title loan products has grown 62% on a compound annual basis. During 2011, title loan revenues increased 39% over 2010. In 2010, we introduced a new prepaid card offering to our customers. During 2011, prepaid debit card fees
62
increased 86% over 2010. Importantly, we believe the prepaid card solution we offer, specifically when coupled with direct deposit, can serve as a catalyst to a longer-term customer relationship.
In the first quarter of 2011, we piloted a new tax preparation offering which, in most states in which it was offered, was coupled with a loan product. Its impact on our 2011 financial results was not material, but the offering was well received by our customers, and we believe it represents an example of available avenues for growth in future years via new products. In addition, the acquisition of DFS has allowed us to expand our product offerings to the Internet. Internal surveys support our belief that our customers are interested in additional product offerings. Introducing new products into our markets has historically created profitable revenue expansion. In executing on our retail model, we expect to continue to expand our offerings to meet our customers' financial service needs.
Product Characteristics and Mix
As we introduce new products throughout our markets and expand our product offerings to meet our customers' needs, the characteristics of our overall loan portfolio shift to reflect the terms of these new products. Our various lending products have different terms, depending on the underlying type of loan product that is offered. Our title loan offerings tend to have longer maturities than our short-term consumer loan offerings, and though loans to a single customer may generate lower finance charges as a result of there being fewer origination events, their increased maturity can result in comparable overall revenue generation over the life of an individual loan. In addition, the shift in mix to more medium-term loans results in a higher loan loss reserve as a result of the nature of medium-term loans as compared to short-term loans. Recently, as we have emphasized our Insight prepaid debit card program, we have increased card fees from individual card purchases, load fees, and commissions related to card activity. We believe that our prepaid debit card revenue, together with the prepaid debit card direct deposit offering, have reduced some of our check cashing fees. We believe, however, that establishing our Insight prepaid debit card as a hub for our customers' financial service needs will lengthen the customer relationship and increase associated revenue over time.
Expenses
Historically, our operating expenses have primarily related to the operation of our stores, including salaries and benefits for employees, store occupancy costs, loan loss provisions, returns and cash shortages and depreciation of assets. We also incur corporate and other expenses on a company-wide basis, including interest expense and other financing costs related to our indebtedness, advertising, insurance, salaries, benefits, occupancy costs, professional expenses and management fees paid by us to Diamond Castle, which fees will be eliminated upon completion of this offering. Our organization is equipped with acquisition and integration capabilities. Most integration tasks are managed by CCFI employees, the cost of which is expensed as incurred. Acquisitions and integrations often result in moderate temporary increases in expenses related to travel, training and incremental pay for hourly employees involved in integration activities.
We view our compliance, collections and information technology groups as core competencies. We have invested in each of these areas and believe we will continue to benefit from increased economies of scale as we grow our business with additional future acquisitions. Our efficient corporate cost structure is evident as revenue has grown at a compound annual rate of 23.1% from 2009 to 2011 while corporate expenses have grown at a compound annual growth rate of 19.1% over the same periods and have decreased as a percentage of revenue from 15.6% in 2009 to 14.6% in 2011.
Recapitalization
Concurrent with the California Acquisition, we issued $395.0 million in senior notes, entered into a new four-year, $40 million revolving credit facility and amended our existing $7.0 million credit facility for our Alabama subsidiary. The proceeds from the senior notes offering, together with $10.0 million of
63
proceeds from our new revolving credit facility and $27.7 million of cash on hand were used to complete the California Acquisition, to retire our and CCCS's outstanding credit facility debt and to pay a dividend to our shareholders and pay bonuses to our management. We incurred $24.2 million in related fees and expenses in completing the California Acquisition and the financing related to our recapitalization, of which $15.6 million was directly attributable to other expenses incurred in connection with the financing and was capitalized accordingly. As a result of the increase in the amount of debt in our capital structure following the recapitalization, our interest expense has risen, impacting our results of operations and liquidity. See "Unaudited Pro Forma Consolidated Financial Information", "—Liquidity and Capital Resources", "—Contractual Obligations and Commitments" and "Description of Certain Indebtedness" for further detail.
Discontinued Operations
In December 2010, we discontinued our commercial check cashing business in Florida. The commercial check cashing business, which provided check cashing services to high-volume check cashers, required significant capital commitments and the underwriting of commercial customer risk. In 2010, we had a significant write-off of a customer receivable and discontinued these operations due to operational considerations. As a result of discontinuing these operations, we recorded a one-time after tax charge of approximately $2.2 million during 2010. This was an isolated business unit, and its closure had no impact on the rest of our Florida operations.
In August 2010, CCCS decided to close four stores in the state of Washington due primarily to a change in law in Washington that made the business unprofitable. As a result of the closures, CCCS incurred an after tax loss from discontinued operations of $0.5 million.
Critical Accounting Policies
Consistent with generally accepted accounting principles in the United States, our management makes certain estimates and assumptions to determine the reported amounts of assets, liabilities, revenue and expenses in the process of preparing our financial statements. These estimates and assumptions are based on the best information available to management at the time the estimates or assumptions are made. The most significant estimates made by our management, which management considers critical, include valuation of our net finance receivables, stock based compensation and goodwill and our determination for recording the amount of deferred income tax assets and liabilities, because these estimates and assumptions could change materially as a result of conditions both within and beyond management's control.
Section 107 of the JOBS Act provides that an "emerging growth company" can take advantage of the extended transition period provided in Section 7(a)(2)(B) of the Securities Act for complying with new or revised accounting standards. In other words, an "emerging growth company" can delay the adoption of certain accounting standards until those standards would otherwise apply to private companies. We are electing to not delay such adoption of new or revised accounting standards, and such election is irrevocable.
Management believes that among our significant accounting policies, the following involve a higher degree of judgment:
Finance Receivables, Net
Finance receivables consist of three categories of receivables, short-term consumer loans, medium-term loans and title loans.
Short-term consumer loan products provide customers with cash or a money order, typically ranging in size from $100 to $1,000, in exchange for a promissory note with a maturity generally 14 to 30 days with an agreement to defer the presentment of the customer's personal check for the aggregate amount of the advance plus fees. This form of lending is based on applicable laws and regulations
64
which vary by state. Statutes vary from providing fees of 15% to 20%, to providing interest at 25% per annum plus origination fees. The customers repay the cash advance by paying cash or allowing the check to be presented. For unsecured loans, the risk of repayment primarily relates to the customer's ability to repay the loans.
Medium-term loan products provide customers with cash, typically ranging from $100 to $2,501, in exchange for a promissory note with a maturity between three months and 24 months. These loans vary in their structure between the regulatory environments where they are offered. The loans are due in installments or provide for a line of credit with periodic monthly payments. In certain instances we also purchase loan participations in a third-party lender's loan portfolio that are classified as medium-term finance receivables.
Title loan products provide customers with cash, typically ranging from $750 to $2,500, in exchange for a promissory note with a maturity between 30 days and 24 months. The loan is secured with a lien on the customer's vehicle title. The risk characteristics of secured loans primarily depend on the markets in which we operate and the regulatory requirements of each market. Risks associated with secured financings relate to the ability of the borrower to repay the loan and the value of the collateral underlying the loan should the borrower default on its payments.
In some instances we maintain debt-purchasing arrangements with third-party lenders. We accrue for this obligation through management's estimation of anticipated purchases based on expected losses in the third-party lender's portfolio. This obligation is recorded as a current liability on our balance sheet.
Finance receivables, net, on the consolidated balance sheets as of December 31, 2009, 2010 and 2011 were approximately $66.0 million, $81.3 million and $120.5 million, respectively. The allowance for loan losses of $5.4 million, $3.4 million, and $5.6 million as of December 31, 2009, 2010 and 2011 represented 7.6%, 4.0% and 4.5% of finance receivables, net of unearned advance fees, respectively. Finance receivables, net as of December 31, 2009, 2010 and 2011 are as follows (in thousands):
| |
As of December 31, | ||||||||||
|---|---|---|---|---|---|---|---|---|---|---|---|
| |
2009 | 2010 | 2011 | ||||||||
Finance Receivables, net of unearned advance fees |
$ | 71,441 | $ | 84,694 | $ | 126,077 | |||||
Less: Allowance for loan losses |
5,406 | 3,357 | 5,626 | ||||||||
Finance Receivables, Net |
$ | 66,035 | $ | 81,337 | $ | 120,451 | |||||
Net loan charge-offs for the three years ended December 31, 2009, 2010 and 2011 were $37.3 million, $38.4 million and $55.3 million, respectively. The total changes to the allowance for loan losses for the years ended December 31, 2009, 2010 and 2011 were as follows (in thousands):
| |
Year Ended December 31, | |||||||||||
|---|---|---|---|---|---|---|---|---|---|---|---|---|
| |
2009 | 2010 | 2011 | |||||||||
Allowance for Loan Losses |
||||||||||||
Beginning of Year |
$ | 2,451 | $ | 5,406 | $ | 3,357 | ||||||
Provisions for Loan Losses |
40,255 | 36,324 | 57,569 | |||||||||
Charge-offs, net |
(37,300 | ) | (38,373 | ) | (55,300 | ) | ||||||
End of Year |
$ | 5,406 | $ | 3,357 | $ | 5,626 | ||||||
Allowance as Percentage of Finance Receivables, net of unearned advance fees |
7.6 | % | 4.0 | % | 4.5 | % | ||||||
The provision for loan losses for the years ended December 31, 2009 and 2010 also includes losses from returned items from check cashing of $3.0 million and $3.1 million, respectively, and card losses of $0.2 million for the year ended December 31, 2010. The provision for loan loss for the year ended
65
December 31, 2011 also includes losses from returned items from check cashing of $5.1 million, loss on tax loans of $0.4 million and card losses of $0.2 million.
Goodwill
Management evaluates all long-lived assets, including goodwill, for impairment annually as of December 31, or whenever events or changes in business circumstances indicate an asset might be impaired. Goodwill represents the excess of the cost of an acquisition over the fair value of the net assets at the date of the acquisition and the excess of purchase price over identified net assets acquired.
One of the methods that management employs in the review uses estimates of future cash flows from acquired assets. If the carrying value of goodwill or other intangible assets is considered impaired, an impairment charge is recorded for the amount by which the carrying value of the goodwill or intangible assets exceeds its fair value. Management believes that its estimates of future cash flows and fair value are reasonable. Changes in estimates of such cash flows and fair value, however, could impact the estimated value of goodwill.
There was no impairment loss charged to operations for goodwill during the years ended December 31, 2011 and December 31, 2010.
During the year ended December 31, 2011, goodwill increased by $117.0 million, due to the California and Illinois Acquisitions.
Income Taxes
We record income taxes as applicable under generally accepted accounting principles. Deferred tax assets and liabilities are determined based on differences between the financial reporting and tax basis of assets and liabilities and are measured using the enacted tax rates and laws that will be in effect when the differences are expected to reverse. A valuation allowance is recorded to reduce the deferred tax asset if it is more likely than not that some portion of the asset will not be realized.
Primarily as a result of Diamond Castle's acquisition of CheckSmart and Golden Gate Capital's acquisition of CCCS, both in 2006, we benefit from a tax shield created through the amortization of the goodwill resulting from those transactions. For tax purposes this goodwill amortizes over a 15-year period from the date of the acquisitions. This resulted in goodwill amortization of $21.0 million for the purposes of our 2011 federal income taxes. Although we have not yet finalized our 2011 tax return, we believe the tax shield of $21.0 million results in cash tax savings of approximately $8.3 million. We expect the corresponding goodwill amortization in 2012 to be $23.0 million, which, at an applicable federal and state tax rate of 38%, would result in cash tax savings of approximately $8.7 million (which amounts do not include goodwill from the DFS Acquisition or any other future acquisitions we may consummate, including the Florida Acquisition, each of which we expect would increase the amount of our goodwill amortization and cash tax savings for 2012 and future years). Under GAAP, our income tax expense for accounting purposes, however, does not reflect the impact of this deduction for the amortization of goodwill. This difference between our cash tax expense and our accrued income tax expense results in the creation of deferred income tax items on our balance sheet.
66
Results of Operations
The following table sets forth key operating data for our operations for the years ended December 31, 2009, 2010 and 2011 (dollars in thousands):
| |
Year Ended December 31, | |||||||||||||||||||
|---|---|---|---|---|---|---|---|---|---|---|---|---|---|---|---|---|---|---|---|---|
| |
2009 | Revenue % | 2010 | Revenue % | 2011 | Revenue % | ||||||||||||||
Total Revenues |
$ | 202,683 | 100 | % | $ | 224,280 | 100 | % | $ | 306,934 | 100 | % | ||||||||
Operating Expenses |
||||||||||||||||||||
Salaries and benefits |
34,343 | 16.9 | % | 38,759 | 17.3 | % | 57,411 | 18.7 | % | |||||||||||
Provision for losses |
43,463 | 21.4 | % | 40,316 | 18.0 | % | 65,351 | 21.3 | % | |||||||||||
Occupancy |
13,855 | 6.8 | % | 14,813 | 6.6 | % | 21,216 | 6.9 | % | |||||||||||
Depreciation and amortization (store-level) |
6,613 | 3.3 | % | 5,318 | 2.4 | % | 5,907 | 1.9 | % | |||||||||||
Other operating expenses |
22,652 | 11.2 | % | 27,994 | 12.5 | % | 35,515 | 11.6 | % | |||||||||||
Total Operating Expenses |
120,926 | 59.7 | % | 127,200 | 56.7 | % | 185,400 | 60.4 | % | |||||||||||
Income from Operations |
81,757 | 40.3 | % | 97,080 | 43.3 | % | 121,534 | 39.6 | % | |||||||||||
Corporate and other expenses |
||||||||||||||||||||
Corporate expenses |
30,513 | 15.1 | % | 32,710 | 14.6 | % | 43,730 | 14.2 | % | |||||||||||
Transaction expenses |
— | 0.0 | % | 237 | 0.1 | % | 9,351 | 3.0 | % | |||||||||||
Depreciation and amortization (corporate) |
568 | 0.3 | % | 1,222 | 0.5 | % | 2,332 | 0.8 | % | |||||||||||
Interest |
11,532 | 5.7 | % | 8,501 | 3.8 | % | 34,334 | 11.2 | % | |||||||||||
Income Tax Expense |
14,042 | 6.9 | % | 19,801 | 8.8 | % | 13,553 | 4.4 | % | |||||||||||
Total corporate and other expenses |
56,655 | 28.0 | % | 62,471 | 27.9 | % | 103,300 | 33.7 | % | |||||||||||
Net income before management fee and discontinued operations |
25,102 | 12.4 | % | 34,609 | 15.4 | % | 18,234 | 5.9 | % | |||||||||||
Sponsor Management Fee |
833 | 0.4 | % | 1,184 | 0.5 | % | 1,381 | 0.4 | % | |||||||||||
Discontinued Operations |
(368 | ) | (0.2 | )% | 2,196 | 1.0 | % | — | 0.0 | % | ||||||||||
Net Income |
24,637 | 12.2 | % | 31,229 | 13.9 | % | 16,853 | 5.5 | % | |||||||||||
67
Year Ended December 31, 2011 Compared to Year Ended December 31, 2010
Revenue
| |
Year Ended December 31, | ||||||||||||||||||
|---|---|---|---|---|---|---|---|---|---|---|---|---|---|---|---|---|---|---|---|
(dollars in thousands)
|
2010 | 2011 | Increase (Decrease) | 2010 | 2011 | ||||||||||||||
| |
|
|
|
(Percent) |
(Percentage of Revenue) |
||||||||||||||
Short-term Consumer Loans |
$ | 125,815 | $ | 163,327 | $ | 37,512 | 29.8 | % | 56.0 | % | 53.2 | % | |||||||
Medium-term Loans |
6,863 | 14,170 | 7,307 | 106.5 | % | 3.1 | % | 4.6 | % | ||||||||||
Check Cashing Fees |
55,930 | 72,800 | 16,870 | 30.2 | % | 24.9 | % | 23.7 | % | ||||||||||
Prepaid Debit Card Services |
10,731 | 19,914 | 9,183 | 85.6 | % | 4.8 | % | 6.5 | % | ||||||||||
Title Loans |
13,381 | 18,656 | 5,275 | 39.4 | % | 6.0 | % | 6.1 | % | ||||||||||
Other Income |
11,560 | 18,067 | 6,507 | 56.3 | % | 5.2 | % | 5.9 | % | ||||||||||
Total Revenue |
$ | 224,280 | $ | 306,934 | $ | 82,654 | 36.9 | % | 100.0 | % | 100.0 | % | |||||||
For 2011, total revenue increased by $82.7 million, or 36.9%, compared to 2010. We experienced organic revenue growth in all of the states in which we operated for the 2011 fiscal year, compared with 2010, with the exception of Arizona, where we adjusted our product mix during May 2010 to conform to new regulatory requirements. Revenue from the California Acquisition increased our overall revenue during 2011 by $55.3 million. The Illinois Acquisition, which closed March 21, 2011, contributed $5.1 million to the revenue mix during 2011. We benefitted in 2011 from a full year's contribution from the Alabama Acquisition.
Excluding Arizona for the effect of the regulatory change, and excluding the two acquisitions that closed during 2011, we achieved organic revenue growth of over 9.9% for the year.
Revenue generated from short-term consumer loan fees and interest for 2011 increased $37.5 million, or 29.8%, compared to 2010. We grew short-term consumer loan revenue as we integrated the California and Illinois Acquisitions and focused on growing the product organically within each of our other markets. The California Acquisition contributed $29.5 million to short-term consumer loan revenue from the close of the acquisition on April 29, 2011 through December 31, 2011. We achieved organic growth within each of our markets, excluding Arizona, during the 2011 fiscal year compared to 2010.
As we focus on meeting our customers' financial needs and building longer-term relationships with our customers, we have diversified our revenue mix and increased our medium-term loan offerings. This proactive approach has led to a shift in revenue mix from short-term loans to medium-term loans. Revenue generated from medium-term loans for 2011 increased $7.3 million, or 106.5%, compared to 2010. The California Acquisition contributed $1.3 million to medium-term loan revenue from the close of the acquisition on April 29, 2011, through December 31, 2011. Illinois, following the close of the Illinois Acquisition on March 21, 2011, also contributed to the overall growth in medium-term loan revenue by $4.9 million during 2011.
Revenue generated from check cashing for 2011 increased $16.9 million, or 30.2%, compared to 2010. The general decline in check cashing was offset by the California Acquisition and a full twelve months of check cashing revenue from the Alabama Acquisition. Although this continues to be an important offering for our company, representing 24% of our revenue, we continue to focus on leveraging check cashing to grow ancillary products and services, including prepaid debit cards.
Revenue from prepaid debit card services during 2011 increased by $9.2 million, or 85.6%, as customer demand for the prepaid card product offerings grew dramatically. The prepaid debit card products that we offer provide our customers with options, including direct deposit, online bill payment, electronic alerts and, in certain markets, access to a third-party loan, increasing customer contact and integrating our services as a central hub for all our customers' financial service needs. We transitioned
68
to Insight's prepaid debit card products in April 2010. In 2011, we actively promoted the cards to our customer base, increasing the number of active card accounts (defined as accounts with activity within the previous 90 days) from approximately 25,900 at the launch of the Insight prepaid card program, to approximately 141,000 in December 2011.
Following the Alabama Acquisition in 2010, we were able to successfully integrate our title loan product into the stores within that market. This successful integration in 2010 led to significant growth during 2011 compared to 2010. Additionally, the transition of customers in Arizona to title loans, following the regulatory change in May 2010, grew revenue significantly in that market as well. Overall, our other states contributed organic title loan revenue growth during 2011 versus 2010. The additional title loan revenue from the newly-acquired stores in California also contributed to the growth in title loans during 2011. Finally, we began to offer title loans to our customers in the Chicago area through the locations acquired in the Illinois Acquisition during the third quarter of 2011.
Operating Expenses
The following table sets forth certain information with respect to our operating expenses for the years ended December 31, 2011 and 2010.
| |
Year Ended December 31, | ||||||||||||||||||
|---|---|---|---|---|---|---|---|---|---|---|---|---|---|---|---|---|---|---|---|
(dollars in thousands)
|
2010 | 2011 | Increase (Decrease) | 2010 | 2011 | ||||||||||||||
| |
|
|
|
(Percent) |
(Percent of Revenue) |
||||||||||||||
Salaries and Benefits |
$ | 38,759 | $ | 57,411 | $ | 18,652 | 48.1 | % | 17.3 | % | 18.7 | % | |||||||
Provision for Loan Losses |
40,316 | 65,351 | 25,035 | 62.1 | % | 18.0 | % | 21.3 | % | ||||||||||
Occupancy |
14,813 | 21,216 | 6,403 | 43.2 | % | 6.6 | % | 6.9 | % | ||||||||||
Depreciation & Amortization (Store-level) |
5,318 | 5,907 | 589 | 11.1 | % | 2.4 | % | 1.9 | % | ||||||||||
Advertising & Marketing |
4,463 | 4,716 | 253 | 5.7 | % | 2.0 | % | 1.5 | % | ||||||||||
Bank Charges |
2,360 | 2,953 | 593 | 25.1 | % | 1.1 | % | 1.0 | % | ||||||||||
Store Supplies |
2,188 | 2,880 | 692 | 31.6 | % | 1.0 | % | 0.9 | % | ||||||||||
Collection Expenses |
2,334 | 2,665 | 331 | 14.2 | % | 1.0 | % | 0.9 | % | ||||||||||
Telecommunications |
2,232 | 3,788 | 1,556 | 69.7 | % | 1.0 | % | 1.2 | % | ||||||||||
Security |
996 | 1,895 | 899 | 90.3 | % | 0.4 | % | 0.6 | % | ||||||||||
License & Other Taxes |
793 | 1,339 | 546 | 68.9 | % | 0.4 | % | 0.4 | % | ||||||||||
Other Operating Expenses |
12,628 | 15,279 | 2,651 | 21.0 | % | 5.6 | % | 5.0 | % | ||||||||||
Total Operating Expenses |
127,200 | 185,400 | 58,200 | 45.8 | % | 56.7 | % | 60.4 | % | ||||||||||
Income from Operations |
$ | 97,080 | $ | 121,534 | $ | 24,454 | 25.2 | % | 43.3 | % | 39.6 | % | |||||||
Total operating expenses, which consist primarily of store-related expenses, increased by $58.2 million, or 45.8%, in 2011 as compared to 2010. This overall increase was due primarily to incremental store-level expenses from the 151 stores acquired through the California and Illinois Acquisitions and the full year of expenses from the Alabama Acquisition in 2011. As a percentage of revenue, salaries and benefits increased from 17.3% in 2010 to 18.7% in 2011. This was due largely to employee payroll attributable to the California and Illinois Acquisitions, as these locations were not as productive, with employee salaries resulting in a higher percentage of revenue.
Occupancy expenses for 2011 also increased from 2010 primarily due to an increase in the number of stores in operation from the California and Illinois Acquisitions, as well as the recognition of a full twelve months of expenses in 2011 from the Alabama Acquisition.
Provision for loan losses increased during 2011 compared to 2010, due primarily to increased volume as a result of the acquisitions and organic growth. Provision for loan losses increased as a
69
percentage of revenue primarily as a result of four factors: (1) the effect of new legislation within the Illinois market, as the state transitioned short-term loan consumers to a state-wide database; (2) the shift in mix to more medium-term loans during the fourth quarter and the higher reserves necessitated by those products; (3) our continued focus on market share expansion, particularly in the California market as we invest in developing new consumer lending relationships; and (4) a continuing weak economy, particularly within the customer demographics we serve, coupled with high gas prices, which creates a challenging collection environment.
Independent of the acquisitions, telecommunications expenses increased as long distance costs and the costs for other telephone services increased. Other operating expenses were impacted by the growing acceptance of debit and credit cards as a form of electronic repayment and the merchant processing costs which result, and an increase in customer incentive costs associated with transitioning customers into the prepaid card products that we offer and direct deposit.
Corporate and Other Expenses
| |
Year Ended December 31, | ||||||||||||||||||
|---|---|---|---|---|---|---|---|---|---|---|---|---|---|---|---|---|---|---|---|
(dollars in thousands)
|
2010 | 2011 | Increase (Decrease) | 2010 | 2011 | ||||||||||||||
| |
|
|
|
(Percent) |
(Percent of Revenue) |
||||||||||||||
Corporate Expenses |
$ | 32,710 | $ | 43,730 | $ | 11,020 | 33.7 | % | 14.6 | % | 14.2 | % | |||||||
Transaction Expenses |
237 | 9,351 | 9,114 | 3845.6 | % | 0.1 | % | 3.0 | % | ||||||||||
Depreciation & Amortization (Corporate) |
1,222 | 2,332 | 1,110 | 90.8 | % | 0.5 | % | 0.8 | % | ||||||||||
Sponsor Management Fee |
1,184 | 1,381 | 197 | 16.6 | % | 0.5 | % | 0.4 | % | ||||||||||
Discontinued Operations |
2,196 | — | (2,196 | ) | (100.0 | )% | 1.0 | % | 0.0 | % | |||||||||
Interest |
8,501 | 34,334 | 25,833 | 303.9 | % | 3.8 | % | 11.2 | % | ||||||||||
Income Tax Expense |
19,801 | 13,553 | (6,248 | ) | (31.6 | )% | 8.8 | % | 4.4 | % | |||||||||
Total Corporate and Other Expenses |
65,851 | 104,681 | 38,830 | 59.0 | % | 29.4 | % | 34.1 | % | ||||||||||
Corporate Expenses
Corporate expenses increased $11.0 million during 2011, or 33.7%, compared to 2010, reflecting costs incurred with respect to the integration of the acquired operations. Collection expenses at the corporate level increased as we adapted to a broader product set and consolidated the California Acquisition.
Additionally, to support our prepaid card product and pilot other initiatives, we built a call center during 2011. This investment results in an increase in corporate expenses related to payroll, telephone expenses and transactional expenses. We believe this investment will benefit us as we continue to expand the products and services we offer our customers.
Interest Expense, Net
Interest expense, net, increased to $34.3 million during 2011 compared to $8.5 million for 2010, or an increase of 303.9%, due to the issuance of our senior notes concurrent with the California Acquisition. See "—Contractual Obligations and Commitments".
70
Income Taxes
Income taxes during 2011 were $13.6 million, as compared to $19.8 million for the same period in 2010. Our annual effective income tax rates in 2011 and 2010 were 44.6% and 37.2%, respectively. The effective income tax rate for 2011 is elevated as the result of non-deductible transaction expenses.
Year Ended December 31, 2010 Compared to Year Ended December 31, 2009
Revenue
| |
Year Ended December 31, | ||||||||||||||||||
|---|---|---|---|---|---|---|---|---|---|---|---|---|---|---|---|---|---|---|---|
(dollars in thousands)
|
2009 | 2010 | Increase (Decrease) |
|
2009 | 2010 | |||||||||||||
| |
|
|
|
(Percent) |
(Percent of Revenue) |
||||||||||||||
Short-term Consumer Loans |
$ | 122,582 | $ | 125,815 | $ | 3,233 | 2.6 | % | 60.5 | % | 56.1 | % | |||||||
Medium-term Loans |
7,235 | 6,863 | (372 | ) | (5.1 | )% | 3.6 | % | 3.1 | % | |||||||||
Check Cashing Fees |
53,049 | 55,930 | 2,881 | 5.4 | % | 26.2 | % | 24.9 | % | ||||||||||
Prepaid Debit Card Services |
2,063 | 10,731 | 8,668 | 420.2 | % | 1.0 | % | 4.8 | % | ||||||||||
Title Loans |
7,140 | 13,381 | 6,241 | 87.4 | % | 3.5 | % | 6.0 | % | ||||||||||
Other Income |
10,614 | 11,560 | 946 | 8.9 | % | 5.2 | % | 5.2 | % | ||||||||||
Total Revenue |
$ | 202,683 | $ | 224,280 | $ | 21,597 | 10.7 | % | 100.0 | % | 100.0 | % | |||||||
In 2010, total revenue increased by $21.6 million, or 10.7%, compared to 2009. The increase in total revenue was due to both the Alabama Acquisition during the first quarter of 2010, and the follow-on opening of two additional stores in that market. We also achieved organic revenue growth in each state in which we operated in 2010, with the exceptions of Virginia and Arizona, where we adjusted our product mix during the year to conform to new regulatory requirements. We attribute our organic revenue growth in 2010 to favorable demographic trends that increased our target market as well as our successful penetration of our target market. We owned and operated 282 retail service locations as of December 31, 2010, compared to 264 stores as of December 31, 2009.
Revenue generated from short-term consumer loan fees and interest for 2010 increased $3.2 million, or 2.6%, compared to 2009. Revenue growth across most of our markets was offset by a decrease in lending revenue in Arizona as customers transitioned from short-term consumer loans to other products, such as title loans and prepaid debit cards, and in Virginia, where consumers were adapting to our line of credit offerings. Overall, revenue growth was driven by greater transaction volumes, attributable to successful market penetration, with the average fee per loan made remaining flat.
The development and introduction of title loans provided our customers with an alternative product to short-term consumer loans as we modified our product offerings in Arizona and Virginia. The increase in title loan fees of $6.2 million was primarily due to the migration of customers to this product within the Arizona and Virginia markets as well as a result of the Alabama Acquisition, where our acquired stores also offered title loans.
Revenue generated from check cashing for 2010 increased $2.9 million, or 5.4%, compared to 2009. The growth in check cashing from the Alabama Acquisition was offset by the negative impact of macroeconomic weakness and high unemployment in certain markets. Transaction volume growth in 2010 offset a slightly lower average check size, and the average fee per check cashed remained constant. Check cashing was also impacted by consumers' migration towards electronic payment options such as direct deposit.
Revenue from prepaid debit card services in 2010 increased by $8.7 million, or 420%, compared to 2009, as consumers grew increasingly accepting of the use of prepaid debit cards. Our penetration into the expanding market with Insight's prepaid debit card products, introduced in April 2010, was the primary driver of this revenue growth. In 2010, we actively promoted the benefits of the Insight prepaid debit card offering to our customer base, increasing the number of active card accounts (defined as
71
accounts with activity within the previous 90 days) from the beginning of our agreement with Insight in April 2010 to over 87,000 in December 2010.
Operating Expenses
The following table sets forth certain information with respect to our operating expenses for the years ended December 31, 2010 and 2009.
| |
Year Ended December 31, | ||||||||||||||||||
|---|---|---|---|---|---|---|---|---|---|---|---|---|---|---|---|---|---|---|---|
(dollars in thousands)
|
2009 | 2010 | Increase (Decrease) |
|
2009 | 2010 | |||||||||||||
| |
|
|
|
(Percent) |
(Percent of Revenue) |
||||||||||||||
Salaries and Benefits |
$ | 34,343 | $ | 38,759 | $ | 4,416 | 12.9 | % | 16.9 | % | 17.3 | % | |||||||
Provision for Loan Losses |
43,463 | 40,316 | (3,147 | ) | (7.2 | )% | 21.4 | % | 18.0 | % | |||||||||
Occupancy |
13,855 | 14,813 | 958 | 6.9 | % | 6.8 | % | 6.6 | % | ||||||||||
Depreciation & Amortization (Store-level) |
6,613 | 5,318 | (1,295 | ) | (19.6 | )% | 3.3 | % | 2.4 | % | |||||||||
Advertising & Marketing |
4,437 | 4,463 | 26 | 0.6 | % | 2.2 | % | 2.0 | % | ||||||||||
Bank Charges |
2,166 | 2,360 | 194 | 9.0 | % | 1.1 | % | 1.1 | % | ||||||||||
Store Supplies |
1,756 | 2,188 | 432 | 24.6 | % | 0.9 | % | 1.0 | % | ||||||||||
Collection Expenses |
1,709 | 2,334 | 625 | 36.6 | % | 0.8 | % | 1.0 | % | ||||||||||
Telecommunications |
1,888 | 2,232 | 344 | 18.2 | % | 0.9 | % | 1.0 | % | ||||||||||
Security |
846 | 996 | 150 | 17.7 | % | 0.4 | % | 0.4 | % | ||||||||||
License & Other Taxes |
678 | 793 | 115 | 17.0 | % | 0.3 | % | 0.4 | % | ||||||||||
Other Operating Expenses |
9,172 | 12,628 | 3,456 | 37.7 | % | 4.5 | % | 5.6 | % | ||||||||||
Total Operating Expenses |
120,926 | 127,200 | 6,274 | 5.2 | % | 59.7 | % | 56.7 | % | ||||||||||
Income from Operations |
$ | 81,757 | $ | 97,080 | $ | 15,323 | 18.7 | % | 40.3 | % | 43.3 | % | |||||||
Total operating expenses, which consist primarily of store-related expenses, increased by $6.3 million, or 5.2%, in 2010 from 2009, but decreased as a percentage of revenue from 59.7% in 2009 to 56.7% in 2010, primarily as a result of a decrease in our provision for loan losses in 2010 as compared to 2009. Expenses for loan loss provisions declined as we benefitted from a restructuring of our Virginia line of credit products to better align with customer needs.
Salaries and benefits and occupancy expenses for 2010 increased from 2009 due to an increase in the number of stores in operation.
Security expense increased as a result of the greater number of stores in operation. Bank charges increased due to increased transaction volume. The increase in licenses and other taxes were primarily related to our new products. The increase in collections and other operating expenses reflected the incremental costs associated with new product development and implementation as we adapted to different regulatory requirements, the increase in number of stores under operation through the Alabama Acquisition and expansion in the products and services we offered our customers. Other operating expenses were impacted by an increase in merchant processing charges as a result of the increased frequency with which our customers use debit and credit cards as a form of electronic payment for our products and services. Income from operations expanded in 2010 to 43.3% of revenue versus 40.3% in 2009.
72
Corporate and Other Expenses
| |
Year Ended December 31, | ||||||||||||||||||
|---|---|---|---|---|---|---|---|---|---|---|---|---|---|---|---|---|---|---|---|
(dollars in thousands)
|
2009 | 2010 | Increase (Decrease) |
|
2009 | 2010 | |||||||||||||
| |
|
|
|
(Percent) |
(Percent of Revenue) |
||||||||||||||
Corporate Expenses |
$ | 30,513 | $ | 32,710 | $ | 2,197 | 7.2 | % | 15.1 | % | 14.6 | % | |||||||
Transaction Expenses |
— | 237 | 237 | 100.0 | % | — | 0.1 | % | |||||||||||
Depreciation & Amortization (Corporate) |
568 | 1,222 | 654 | 115.1 | % | 0.3 | % | 0.5 | % | ||||||||||
Sponsor Management Fee |
833 | 1,184 | 351 | 42.1 | % | 0.4 | % | 0.5 | % | ||||||||||
Discontinued Operations |
(368 | ) | 2,196 | 2,564 | (696.7 | )% | (0.2 | )% | 1.0 | % | |||||||||
Interest |
11,532 | 8,501 | (3,031 | ) | (26.3 | )% | 5.7 | % | 3.8 | % | |||||||||
Income Tax Expense |
14,042 | 19,801 | 5,759 | 41.0 | % | 6.9 | % | 8.8 | % | ||||||||||
Total Corporate and Other Expenses |
57,120 | 65,851 | 8,731 | 15.3 | % | 28.2 | % | 29.4 | % | ||||||||||
Corporate Expenses
Administrative expenses increased $2.2 million in 2010, or 7.2%, compared to 2009, primarily due to increased expense related to compliance, technology and additional personnel associated with new product introductions and an increased number of store locations. We also paid a management fee of $1.2 million to Diamond Castle in 2010, an increase of $0.4 million compared to 2009, as a result of the Alabama Acquisition and the associated increase in company-wide EBITDA. In 2010, we exited our commercial check cashing business in Florida and recognized a one-time discontinued operations expense of $2.2 million, net of tax benefits.
Interest Expense, Net
Interest expense, net, decreased to $8.5 million in 2010 compared to $11.5 million in 2009, or a decrease of 26.3%, due to reductions in the variable interest rates under our existing term loan facilities.
Income Taxes
A tax provision of $19.8 million was recorded for income taxes for 2010, as compared to $14.0 million for 2009. Our annual effective income tax rate for 2010 was 37.2%, net of provisions for discontinued operations. The annual effective income tax rate for 2009 was 36.7%.
Liquidity and Capital Resources
We have historically funded our liquidity needs through cash flow from operations and borrowing under our revolving credit facilities. We believe that cash flow from operations and available cash, together with available borrowings under our credit facilities and our net proceeds from this offering, will be adequate to meet our liquidity needs for the foreseeable future. Our future liquidity and future ability to fund capital expenditures, working capital and debt requirements will depend, however, upon our future financial performance, which is subject to many economic, commercial, financial and other factors that are beyond our control. If those factors significantly change, our business may not be able to generate sufficient cash flow from operations, and future borrowings may not be available to meet our liquidity needs. We anticipate that to the extent that we require additional liquidity as a result of these factors or in order to execute our strategy, our liquidity needs would be financed by additional indebtedness, equity financings, asset sales or a combination of the foregoing. We may be unable to obtain any such additional financing or consummate asset sales on reasonable terms or at all.
73
Cash Flow Analysis
The table below summarizes our cash flows for 2009, 2010 and 2011.
| |
Year Ended December 31, | |||||||||
|---|---|---|---|---|---|---|---|---|---|---|
(in thousands)
|
2009 | 2010 | 2011 | |||||||
Net Cash Provided by Operating Activities |
$ | 68,826 | $ | 82,369 | $ | 130,823 | ||||
Net Cash Used in Investing Activities |
(64,315 | ) | (54,950 | ) | (100,553 | ) | ||||
Net Cash Used in Financing Activities |
(2,435 | ) | (15,598 | ) | (4,415 | ) | ||||
Net Increase in Cash and Cash Equivalents |
2,076 | 11,821 | 25,855 | |||||||
Cash Flows from Operating Activities. During 2011, net cash provided by operating activities was $130.8 million compared to $82.4 million during the same period in 2010. Cash flows from operating activities increased primarily due to acquisitions, including the California Acquisition, and organic growth.
During 2010, net cash provided by operating activities was $82.4 million compared to $68.8 million in 2009. The improvement in cash flows from operating activities in 2010 compared to 2009 was due primarily to an increase in profits.
Cash Flows from Investing Activities. During 2011, net cash used in investing activities was $100.6 million compared to $55.0 million in 2010. The primary use of cash in 2011 was for $88.8 million in loan originations (while the corresponding loan loss provision is recorded within cash flows from operating activities). The California Acquisition provided $22.9 million of positive cash flow as a result of issuing common stock for that transaction. The Illinois Acquisition used $19.7 million from investing activities. In addition, $15.5 million was used for various purchases of equity investments and leasehold improvements and equipment.
During 2010, net cash used in investing activities was $55.0 million, of which $51.6 million was attributable to loans we made during the year. The acquisition of the 19 Alabama stores in 2010 was the largest investment activity outside of our loan portfolio during 2010. The other investing activities were primarily related to the purchase of computer equipment, the cost of remodeling existing stores, new store openings, and maintenance capital expenditures.
We funded the acquisition of DFS on April 1, 2012 with cash flow from operations.
Cash Flows from Financing Activities. Net cash used by financing activities during 2011 was $4.4 million. Positive cash flow was attributed to the issuance of $395 million aggregate principal amount of our senior notes. This was offset by $262.9 million in notes payable payments and a $120.6 million special dividend distribution. At the close of the recapitalization transaction consummated in connection with the California Acquisition, we borrowed $10 million under our revolving credit facility. We paid down the entirety of the amount drawn prior to the close of the second quarter of 2011. Net cash used in financing activities for 2010 was $15.6 million and was attributable to payments on long-term debt.
Net cash used in financing activities for the year ended December 31, 2010 was $15.6 million, compared to $2.4 million in 2009. In 2010, this included the repayment of a $5.0 million line of credit then had been provided by Diamond Castle and $11.0 million used for the extinguishment of other debt offset by contributions from non-controlling interest.
Financing Instruments—Restrictive Covenants
The indenture governing our senior notes contains certain covenants and events of default that are customary with respect to non-investment grade debt securities, including limitations on our ability to incur additional indebtedness, pay dividends on or make other distributions or repurchase our capital stock, make certain investments, enter into certain types of transactions with affiliates, create liens and sell certain assets or merge with or into other companies. The agreement governing our revolving credit
74
facility contains restrictive covenants that limit our ability to incur additional indebtedness, pay dividends on or make other distributions or repurchase our capital stock, make certain investments, enter into certain types of transactions with affiliates, create liens and sell certain assets or merge with or into other companies, in each case to the same extent as the indenture governing our senior notes. In addition, the agreement governing our revolving credit facility contains a consolidated total net leverage ratio covenant, which will be tested at the time of any borrowing under the facility and on a quarterly basis when any loans are outstanding. As of December 31, 2011, we were in compliance with these covenants. See "Description of Certain Indebtedness" for more information.
Capital Expenditures
Our business model requires relatively low maintenance capital expenditures. For the years ended December 31, 2009, 2010 and 2011, we spent $2.8 million, $1.7 million and $4.3 million, respectively, on capital expenditures excluding acquisitions. The increase in 2011 was primarily due to the investment we made in the branches acquired during 2011 as we upgraded locations. Capital expenditures for existing CCFI branches during these periods related primarily to the refreshing of certain existing stores, and maintenance and ongoing upgrades of our information systems. We expect that future capital expenditures, excluding acquisitions, will remain consistent with our historical experience on a per-store basis.
Seasonality
Our business is seasonal due to tax refunds received by our customers. Customers' cash tax refund checks primarily in the first calendar quarter of each year. In the first quarter, we traditionally have our strongest check cashing quarter. We typically see our loan portfolio decline in the first quarter as a result of the consumer liquidity created through the refund checks. Following the first quarter, we typically see our loan portfolio expand through the balance of the year with the third and fourth quarters showing the strongest loan demand due to the holiday season.
Contractual Obligations and Commitments
The table below summarizes our contractual obligations and commitments as of December 31, 2011:
| |
Total | 2012 | 2013 | 2014 | 2015 | Thereafter | |||||||||||||||
|---|---|---|---|---|---|---|---|---|---|---|---|---|---|---|---|---|---|---|---|---|---|
Operating Leases |
$ | 50,214 | $ | 17,337 | $ | 13,305 | $ | 9,598 | $ | 5,420 | $ | 4,554 | |||||||||
Senior Notes |
|||||||||||||||||||||
Principal |
395,000 | — | — | — | — | 395,000 | |||||||||||||||
Interest |
311,395 | 42,463 | 42,463 | 42,463 | 42,463 | 141,543 | |||||||||||||||
Total Senior Notes |
706,395 | 42,463 | 42,463 | 42,463 | 42,463 | 536,543 | |||||||||||||||
Borrowings under Revolving Credit Facility |
|||||||||||||||||||||
Principal |
— | — | — | — | — | — | |||||||||||||||
Interest(1) |
987 | 296 | 296 | 296 | 99 | — | |||||||||||||||
Total borrowings under Revolving Credit Facility |
987 | 296 | 296 | 296 | 99 | — | |||||||||||||||
Total |
$ | 757,596 | $ | 60,096 | $ | 56,064 | $ | 52,357 | $ | 47,982 | $ | 541,097 | |||||||||
- (1)
- Contractual interest obligations for the revolving credit facility includes cash payments we expect to make with respect to the undrawn line fee of 0.75% of the unused commitment under the revolving credit facility.
Existing Indebtedness. In connection with the California Acquisition, we issued $395 million aggregate principal amount of our senior notes, all of which remained outstanding as of December 31, 2011. The senior notes have an interest rate of 10.75% payable semi-annually and will mature on
75
May 1, 2019. The proceeds were used to refinance debt, pay fees and expenses, and to finance a dividend payment to shareholders.
Following the Alabama Acquisition, our Alabama subsidiary maintained the Alabama Facility, a $7.0 million revolving line of credit that was undrawn as of December 31, 2011.
Concurrent with the senior notes offering, we also entered into a four-year, $40 million revolving credit facility. The revolving credit facility has an interest rate of LIBOR plus 5.00%, will mature on May 1, 2019, and was undrawn as of December 31, 2011.
Management Payments. The table above does not reflect our contingent commitment to pay $5.2 million in aggregate payments to members of our management team. Such payments will become payable at the time that Diamond Castle receives aggregate net proceeds from sales of our common shares in this offering and any follow-on offering in excess of $9.7 million. These payments would become payable upon the consummation of this offering if the underwriters exercise their option to purchase additional shares in full. See "Compensation Discussion and Analysis—2012 Management Payments" for additional information.
Impact of Inflation
Our results of operations are not materially impacted by fluctuations in inflation.
Balance Sheet Variations
Several of the items on our balance sheet as of December 31, 2011 were impacted significantly by our acquisitions and our related recapitalization.
Cash and cash equivalents, accounts payable, accrued liabilities, money orders payable and revolving advances vary because of seasonal and day-to-day requirements resulting primarily from maintaining cash for cashing checks and making short-term consumer loans and title loans, and the receipt and remittance of cash from the sale of prepaid debit cards, wire transfers, money orders and the processing of bill payments.
Loan Portfolio
As of December 31, 2011, we offered loans in every state in which we operate. We have established a loan loss allowance in respect of our loans receivable at a level that our management believes to be adequate to absorb known or probable losses from loans made by us. Our policy for determining the loan loss allowance is based on historical experience, as well as our management's review and analysis of the payment and collection of the loans within prior periods. Our policy is to charge off accounts in accordance with policy. For short-term consumer loans, accounts are charged off when they become past due. For title loans which are 30 days in duration, accounts are charged off when they become 30 days past due on a contractual basis. For title loans which have terms ranging from 60 days to one year and medium-term loans which have a term of one year or less, accounts are charged off when accounts are 60 days past due on a contractual basis. For medium-term loans with a term more than one year, accounts are charged off when the accounts are 90 days past due. Charge-offs are applied as a reduction to the loan loss allowance and any recoveries of previously charged-off loans are applied as an increase to the loan loss allowance.
All loans and services, regardless of type, are made in accordance with state regulations, and, therefore, the terms of the loans and services may vary from state to state. Loan fees and interest include fees and interest received from loan customers. Advance fees on short-term consumer loans with terms between 14 to 30 days and title loans with terms up to 30 days are recognized as unearned finance charges at the time the loans are made. Advance fee income is recognized using the interest (actuarial) method over the term of each loan for our line-of-credit products. Advance fees on title loans with terms up to 24 months, and medium-term loans with terms up to 180 days are classified as unrecognized income at the time the loans are made.
76
As of December 31, 2009, 2010 and 2011, our finance receivables net of unearned advance fees were approximately $66.0 million, $81.3 million and $120.5 million, respectively.
Investee Companies
We have an equity investment in Latin Card. Prior to May 2011, the Company held a 57% ownership in Latin Card. In May 2011, our membership units were reduced to 49%. Effective May 2011, we recorded the investment in Latin Card under the equity method of accounting. As of December 31, 2011, our membership units were reduced to 39%.
We also have an equity investment in Insight Holding (the parent company of the program manager for the prepaid card offered through our subsidiaries). We recorded the 22.5% investment in Insight Holdings under the equity method of accounting effective November 2011.
Under our corporate policies, investee companies that are not consolidated, but over which we exercise significant influence, are accounted for under the equity method of accounting. Whether or not we exercise significant influence with respect to an investee depends on an evaluation of several factors including, among others, representation on the investee company's board of directors and ownership level, which is generally a 20% to 50% interest in the voting securities of the investee company. Under the equity method of accounting, an investee company's accounts are not reflected within our consolidated balance sheets and statements of income; however, our share of the earnings or losses of the investee company is reflected in the caption "Equity investment loss" in the consolidated statements of income. Our carrying value in an equity method investee company is reflected in the caption "Equity investments" in our consolidated balance sheets.
Off-Balance Sheet Arrangements
We did not have any off-balance sheet arrangements as of December 31, 2011.
Qualitative Disclosures about Market Risk
We are exposed to financial market risks, particularly with respect to changes in interest rates that might affect the costs of financing our borrowings under our revolving credit facilities. Given the anticipated short-term nature of expected borrowings under our revolving credit facilities, we do not expect that our interest rate risk will be substantial, nor do we currently anticipate a need to hedge such risk. We do not hold market risk sensitive instruments entered into for trading purposes, as defined by GAAP.
77
Company Overview
We are a leading retailer of alternative financial services to unbanked and underbanked consumers through a network of 435 retail storefronts across 14 states. We focus on providing a wide range of convenient consumer financial products and services to help customers manage their day-to-day financial needs, including short-term consumer loans, medium-term loans, title loans, check cashing, prepaid debit cards, money transfers, bill payments and money orders. Although the majority of our customers have banking relationships, we believe that our customers use our financial services because they are convenient, easy to understand and, in many instances, more affordable than available alternatives.
We strive to provide customers with unparalleled customer service in a safe, clean and welcoming environment. Our stores are located in highly visible, accessible locations that allow customers convenient and immediate access to our services. Our professional work environment combines high employee performance standards, incentive-based pay and a wide array of training programs to incentivize our employees to provide superior customer service. We believe that this approach has enabled us to build strong customer loyalty, putting us in a position to expand and continue to capitalize on our innovative product offerings. As a result of our focus on store selection and design and our efforts to provide consistent, high-quality customer service, we have achieved per store revenue and per store Adjusted EBITDA contribution levels that we believe substantially exceed our publicly traded peers. See "Certain Financial Measures and Other Information" for an explanation of how we calculate these metrics and "Prospectus Summary—Summary Historical Consolidated Financial Data" for a reconciliation of our net income to Adjusted EBITDA.
We serve the large and growing market of individuals who have limited or no access to traditional sources of consumer credit and financial services. A study conducted by the FDIC, published in 2009 indicates 25.6% of U.S. households are either unbanked or underbanked, representing approximately 60 million adults. As traditional financial institutions increase fees for consumer services, such as checking accounts and debit cards, and tighten credit standards as a result of economic and other market driven developments, consumers have looked elsewhere for less expensive and more convenient alternatives to meet their financial needs. According to a recent Federal Reserve Bank of New York report, total consumer credit outstanding has declined over $1.4 trillion since its peak in the third quarter of 2008. This contraction in the supply of consumer credit has resulted in significant unmet demand for consumer loan products.
For the year ended December 31, 2011, we generated $306.9 million in revenue, $16.9 million in net income and $86.8 million in Adjusted EBITDA. As of December 31, 2011, we had $515.5 million of total assets, and $61.3 million of stockholders' equity.
Our measurement of comparable store sales growth as of December 31, 2011 includes stores which we operated for the full year of 2011 and which were open for the full year of 2010. As of December 31, 2011 we had 280 stores included in this measurement. These stores achieved comparable sales growth of 7.3% for the year ended December 31, 2011 as compared to the year ended December 31, 2010.
Products and Services
We offer several convenient, fee-based services to meet the needs of our customers, including short-term consumer loans, medium-term loans, title loans, check cashing, prepaid debit cards, money transfers, bill payments, money orders, international and domestic prepaid phone cards, tax preparation, auto insurance, motor vehicle registration services and other ancillary retail financial services.
78
The following charts reflect the major categories of services that we currently offer and the revenues from these services for the year ended December 31, 2011 as well as the number of store locations we have in each state:
| Revenue by Product Group | Store Count by State | |
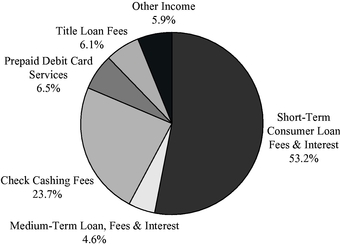
|
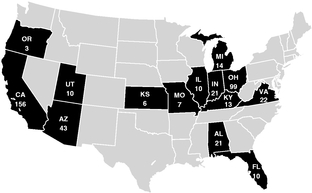
|
Consumer Loans. We offer a variety of consumer loan products and services. We believe that our customers find our consumer loan products and services to be convenient, transparent and lower-cost alternatives to other, more expensive short-term options, such as incurring returned item fees, credit card late fees, overdraft or overdraft protection fees, utility late payment, disconnect and reconnect fees and other charges imposed by other financing sources when they do not have sufficient funds to cover unexpected expenses or other needs. Our customers often have limited access to more traditional sources of consumer credit such as credit cards.
The specific consumer loan products we offer vary by location, but generally include the following types of loans:
Short-Term Consumer Loans. One of our primary products is a short-term, small-denomination consumer loan whereby a customer receives immediate cash, typically in exchange for a post-dated personal check or a pre-authorized debit from his or her bank account. We offer this product in 367 of our 435 stores. As the lender, we agree to defer deposit of the check or initiation of the debit from the customer's bank account until the mutually agreed upon due date, which typically falls on the customer's next payday. Principal amounts of our short-term consumer loans can be up to $1,000 and averaged approximately $426 during 2011. Fees charged vary from state to state, generally ranging from $8 to $15 per $100 borrowed. Our short-term consumer loan products are offered in the following 13 of the 14 states in which we operate stores: Alabama, California, Florida, Illinois, Indiana, Kansas, Kentucky, Michigan, Missouri, Ohio, Oregon, Utah and Virginia.
In order to receive a short-term consumer loan, a new customer must generally have a verifiable, primary phone number, be a full-time employee at the same job for greater than one month with verifiable monthly recurring income, have an open checking account with a positive balance, and possess a valid government issued identification and a copy of their most recent pay stub or bank statement.
We utilize extensive application controls to reduce risk of teller error, fraud and inappropriate use of our POS systems in order to authorize transactions. Once a new customer completes an initial application, our branch employees enter all customer information into our POS systems, which provide fully automated, immediate and validated loan application decisions to ensure consistent underwriting standards and compliance with state and federal lending regulations. The loan amount is determined
79
based upon the income level of the applicant, and the POS system automatically calculates fees, rates, payment amounts and due dates, further reducing risk of teller error and strengthening our compliance. In addition, before the lending decision is made, the branch employee refers to an internal database to ensure that the customer has no outstanding loans that are in default at any of our other locations, which would preclude the customer from obtaining additional loans and, where applicable, checks appropriate state wide databases.
Once all underwriting criteria are met and the loan is approved, in exchange for cash, the customer typically writes a check payable to us on the due date, in the amount of the loan plus the applicable fee and finance charges, or completes a pre-authorized debit authorization form, as part of the loan agreement, which authorizes us to debit their checking account on the due date. The transaction is entered into the POS system, at which time the branch employee provides a copy of the loan agreement and other necessary disclosures which are automatically printed from the POS system. After the customer has executed the agreements, branch employees distribute the loan proceeds to the customer and file all necessary paperwork.
Customers may repay outstanding loans through a variety of channels, including at the store, by phone or, where permissible by applicable state law, via debit or credit card. All transaction activity, including loan extensions and repayments, is automatically updated through the POS system.
The following table presents key operating data for our short-term consumer loan products.
| |
Year ended December 31, 2011 |
|||
|---|---|---|---|---|
Loan volume (in thousands) |
$ | 1,543,310 | ||
Number of loans (in thousands) |
3,625 | |||
Average originated loan size |
$ | 425.72 | ||
Average originated loan fee |
$ | 46.37 | ||
Loan loss provision as a percentage of loan volume |
2.6 | % | ||
Medium-term Loans. In meeting our customers' financial needs, we also offer a range of medium-term loans. Principal amounts of medium-term loans typically range from $100 to $2,501 and have maturities between three months and 24 months. These loans vary in their structure in order to conform to the specific regulatory requirements of the various jurisdictions in which they are offered. The loans may have an installment repayment plan or provide for a line of credit with periodic monthly payments. Whereas we measure short-term consumer loans on a transactional or volume basis, medium-term loans are monitored with portfolio-based metrics. The initial loan amount is typically larger than the loan amount under a short-term consumer loan and requires different underwriting parameters that are dependent upon the structure. The longer term nature of these products also necessitates a larger allowance for loan losses than is required to support our short-term consumer loans. We offer these loans in 164 of our 435 stores in the following three of the 14 states in which we operate stores: California, Illinois and Virginia.
80
The following table presents key operating data for our medium-term loan products.
| |
As of December 31, 2011 |
|||
|---|---|---|---|---|
Principal outstanding (in thousands)(1) |
$ | 12,174 | ||
Number of loans outstanding |
20,818 | |||
Average principal outstanding |
$ | 584.79 | ||
Average monthly percentage rate |
19.2 | % | ||
Allowance as a percentage of finance receivable |
10.6 | % | ||
- (1)
- Loan participations are grouped with medium-term loans in our consolidated financial statements included elsewhere in this prospectus, but excluded from this calculation.
Title Loans. Title loans are asset-based loans whereby the customer obtains cash using a vehicle as collateral. We offer this product in 243 of our 435 stores. The amount of funds made available is based on the vehicle's value, and our policies authorize loans based on the wholesale value of the vehicle typically in exchange for a first priority lien on the customer's otherwise unencumbered vehicle title. The customer receives the benefit of immediate cash and retains possession of the vehicle while the loan is outstanding. The outstanding principal amount of our title loans averaged approximately $1,134 as of December 31, 2011. Our title loans are offered in the following eight of the 14 states in which we operate stores: Alabama, Arizona, California, Illinois, Kansas, Missouri, Utah and Virginia, and we intend to introduce title loans in additional states in the future.
Our title loan process is actively managed to ensure consistent underwriting standards, compliance with state law, and a simple and expeditious transaction process. Prior to receiving a funded loan, each title loan customer must complete an application and sign a title loan agreement, which contains the terms of the title loan, including government mandated disclosures and provisions that summarize each party's rights and obligations in the event either party does not satisfy the agreement terms. Our POS system automatically calculates the APR and applicable fees and enters the information into the security agreement, promissory note and loan agreement forms.
While loan requirements vary by state, we typically require the following documentation as a condition for providing a title loan: proof of current state registration; clear title; a working home or mobile phone number; current bill, bank statement or lease agreement in the customer's name that includes the customer's address; a valid government issued identification; a completed title loan application; and a vehicle in drivable condition.
As part of the title loan application process, we calculate the rough wholesale value of the vehicle using Black Book USA values to determine the amount a customer is eligible to borrow.
The following table presents key operating data for our title loan products.
| |
As of December 31, 2011 |
|||
|---|---|---|---|---|
Principal outstanding (in thousands) |
$ | 17,334 | ||
Number of loans outstanding |
15,283 | |||
Average principal outstanding |
$ | 1,134.20 | ||
Average monthly percentage rate |
13.3 | % | ||
Allowance as a percentage of finance receivable |
5.3 | % | ||
Our consumer loan products are authorized by statute or rule in the various states in which we offer them and are subject to extensive regulation. The scope of that regulation, including the terms on which consumer loans may be made, varies by jurisdiction. The states in which we offer consumer loan products generally regulate the maximum allowable fees and other charges to consumers and the
81
maximum amount of the loan, maturity and renewal or extension terms of these consumer loans. Some of the states in which we operate impose limits on the number of loans a customer may have outstanding or on the amount of time that must elapse between loans. To comply with the laws and regulations of the states in which consumer loan products are offered at our stores, the terms of our consumer loan products must vary from state to state.
As of December 31, 2011, our gross receivable for short-term consumer loans, medium-term loans and title loans was approximately $131.3 million. At the end of each fiscal quarter, we analyze the loan loss provision and our loan loss allowance in order to determine whether our estimates of such allowance are adequate for each of our consumer loan products. Our analysis is based on our understanding of our past loan loss experience, current economic conditions, volume and growth of our loan portfolios, timing of maturity, as well as collections experience.
Consumer loan products, including short-term consumer loans, medium-term loans and title loans, accounted for 63.9% of our revenue for the year ended December 31, 2011.
Check Cashing. We offer check cashing services in 409 of our 435 stores. Prior to cashing a check, our customer service representatives verify the customer's identification and enter the payee's social security number and the payor's bank account information in our internal, proprietary databases, which match these fields to prior transactions in order to mitigate our risk of loss. Although we have established guidelines for approving check cashing transactions, we do not impose maximum check size restrictions. Subject to appropriate approvals, we accept all forms of checks, including payroll, government, tax refund, insurance, money order, cashiers' and personal checks. Our check cashing fees vary depending upon the amount and type of check cashed, applicable state regulations and local market conditions. Our check cashing services are offered in the following 13 of the 14 states in which we operate stores: Alabama, Arizona, California, Florida, Indiana, Kansas, Kentucky, Michigan, Missouri, Ohio, Oregon, Utah and Virginia.
The following table presents key operating data for our check cashing business.
| |
Year ended December 31, 2011 |
|||
|---|---|---|---|---|
Face amount of checks cashed (in thousands) |
$ | 2,163,276 | ||
Number of checks cashed (in thousands) |
4,869 | |||
Face amount of average check |
$ | 444.26 | ||
Average fee per check |
$ | 14.95 | ||
Fee as a percentage of average check size |
3.4 | % | ||
Returned check expense (% of face amount) |
0.2 | % | ||
Check cashing accounted for 23.7% of our revenue for the year ended December 31, 2011.
Prepaid Debit Card Services. One of our fastest growing businesses is the sale and servicing of prepaid debit cards, which we offer in 430 of our 435 stores. As an agent for a third-party debit card provider, we offer access to reloadable prepaid debit cards with a variety of enhanced features that provide our customers with a convenient and secure method of accessing their funds in a manner that meets their individual needs. The cards are provided by Insight, and our stores serve as distribution points where customers can purchase cards as well as load funds onto and withdraw funds from their cards. Customers can elect to receive check cashing proceeds on their cards without having to worry about security risks associated with carrying cash. The cards can be used at most places where MasterCard® or Visa® branded debit cards are accepted. These cards offer our customers the ability to direct deposit all or a portion of their payroll checks onto their cards, receive real-time wireless alerts for transactions and account balances, and utilize in-store and online bill payment services. In addition to these basic features available on all of the cards offered in our stores, we offer two additional card options with enhanced features. One of the enhanced feature cards provides, at the customer's option,
82
a lower-cost overdraft protection option compared to the typical overdraft fees charged by traditional banks. The other enhanced card option allows qualifying customers to receive loan proceeds from a state-licensed third-party lender directly onto their cards, which we believe is an innovative feature of these cards. This feature is currently offered in Arizona and certain stores in Ohio, and we may introduce this feature in additional states in the future.
Since we began offering Insight cards in April 2010, we have experienced substantial growth in our prepaid debit card business. Active Insight accounts, which we define as accounts reflecting any activity during the preceding 90 days, had grown to 140,970 as of December 31, 2011, an increase of over 62% from December 31, 2010. We are paid certain agent fees from Insight that are based on monthly card fees, overdraft charges, interchange fees and ATM access fees. In addition, we earn fees from the sale of prepaid debit cards and are required to pre-fund certain card activity when customers load funds onto their cards. Our pre-funding obligation arises as a result of the time lag between when customers load funds onto their cards in our stores and when funds are subsequently remitted to the banks that issue the cards. We also are required to pre-fund amounts in order to fund our obligation to purchase loan participations when our Arizona customers receive loan proceeds from a third-party lender onto their cards and in relation to negative card balances our customers may experience. The following table presents key operating data for our prepaid debit card services business as of December 31, 2011:
| |
As of December 31, 2011 |
|||
|---|---|---|---|---|
Active card holders in network (in thousands) |
141.0 | |||
Active direct deposit customers (in thousands) |
33.2 | |||
During 2011, our customers loaded approximately $683.8 million onto prepaid debit cards. Most of the increase in load volume from 2011 compared to 2010 is attributable to increased card sales, a focus on direct deposit activity and loan proceeds from third-party lenders that our customers elected to have loaded onto their prepaid debit cards through one of Insight's enhanced feature card offerings. One of our key operating goals is to convert our check cashing customers from cashing payroll checks to directly depositing their payroll checks onto prepaid debit cards offered in our stores, as we believe this increases customer activity and retention.
Prepaid debit card services accounted for 6.5% of our revenue for the year ended December 31, 2011.
Money Transfers. We are an agent for the transmission and receipt of wire transfers through the Western Union network, the largest wire transfer provider in the world. Through these networks, our customers can transfer funds electronically to any of approximately 485,000 Western Union agent locations worldwide in over 200 countries, including most of our stores. Western Union establishes the fees for this service and pays us a commission. We are also an agent for the transmission and receipt of wire transfers through the MoneyGram network in our Alabama locations. For the year ended December 31, 2011, we acted as an agent transferring $164.9 million.
Bill Payments. Our stores serve as payment locations for customers to pay their utility, telephone and other bills to third parties. Upon acceptance of the customer's bill payment, we remit the amount owed to the third party under an agreement with that payee (who credits the customer's account with the payee in the amount of such payment) and we either receive a service fee from the payee or collect a fee directly from the customer. Our bill pay agreements generally have a three-to-five year term and renew automatically unless written notice is provided by either party. We offer these services through relationships with third-party aggregators such as CheckFreePay and Western Union. These third-party aggregators have established relationships with additional third-party payees, which allow us to expand the network of payees for which customers are able to make bill payments in our stores. For the year
83
ended December 31, 2011, we processed approximately $25.2 million in bill payment transactions resulting in revenue of $0.8 million.
Money Orders. Depending on the location, we currently offer money orders issued by Western Union, Money-2-Go and Global Express in any amount up to $1,000 and Continental Express up to $500. These money orders are generally used by our customers for bill payments, rent payments and other disbursements. In our Ohio stores, loan proceeds are issued to our customers in the form of a money order issued by Global Express. We issued $602.6 million in money orders during 2011. We issued approximately 2.7 million money orders during 2011. We issue money orders for free to customers that are cashing a check or processing a loan and otherwise charge a $1.00 fee per money order. We remit the face amount of each money order sold to Western Union, Money-2-Go or Global Express, as applicable, together with any fees that we are contractually obligated to deliver to these vendors.
Other products and services accounted for 5.9% of our revenue for the year ended December 31, 2011.
Historical Acquisitions
California Acquisition. On April 29, 2011, we acquired CCCS, an alternative financial services business with similar product offerings as CheckSmart. CheckSmart, together with CCCS and certain other parties, executed an agreement and plan of merger, under which CCFI, a newly formed holding company, acquired all outstanding shares of both CheckSmart and CCCS. In connection with consummating the California Acquisition, we also issued $395 million in aggregate principal amount of our 10.75% senior secured notes due 2019, which we refer to as our senior notes, and entered into a $40 million senior secured revolving credit facility, which we refer to as our revolving credit facility. The net proceeds from the offering of the senior notes, together with the initial borrowings under our revolving credit facility and cash on hand, were used to retire $207.2 million of CheckSmart's outstanding debt and $74.1 million of CCCS's outstanding debt, pay a $120.6 million special dividend to our shareholders, and pay a $4.4 million bonus to management. The CheckSmart debt consisted of $20.1 million of debt outstanding under a first-lien secured revolving credit facility bearing interest at 4.75% per annum, $146.9 million of first-lien secured term loan debt bearing interest at 4.75% per annum, and $40.2 million of second-lien secured term loan debt bearing interest at 7.75% per annum. The CCCS debt consisted of $56.0 million of first-lien secured term loan debt bearing interest at 3.54% per annum and $18.1 million of second-lien secured term loan debt bearing interest at 7.52% per annum. The special dividend consisted of $72.6 million paid to Diamond Castle, $16.7 million paid to Golden Gate Capital, $20.2 million paid to other CCFI equity holders, and $11.1 million paid to other CCCS equity holders.
Other Acquisitions. Since August 2009, we have also acquired:
- •
- 10 stores in Illinois, which we acquired on March 21, 2011 in an asset purchase transaction.
- •
- 19 stores in Alabama, which we acquired in March 2010.
- •
- Eight stores in Michigan, which we acquired in August 2009.
Following these acquisitions, we have successfully integrated our expanded product offerings and retailing strategies at acquired stores. The stores acquired in the Alabama and Michigan Acquisitions, both owned and operated for the full year of 2011, experienced revenue growth in excess of 26% in 2011. We have invested significant resources in building a scalable company-wide platform in areas such as collections, call center operations, information technology, legal, compliance and accounting in order to quickly and successfully integrate acquired stores into our existing business.
84
Recent and Pending Acquisitions
We have recently completed one investment, one acquisition, and have one additional acquisition pending that we believe will allow us to further expand our product offerings and the locations in which we offer our products.
Insight Investment. We acquired a 22.5% stake in Insight Holding in November 2011. Insight Holding is the parent company of Insight Cards Services LLC, the program manager for the Insight Card that is offered through our retail locations.
DFS Acquisition. On April 1, 2012 we acquired all of the equity interests of the DFS Companies. The purchase price was approximately $22 million, subject to a post-closing working capital adjustment.
DFS offers short-term loans to consumers via the Internet under a state-licensed model in compliance with the applicable laws of the jurisdiction of its customers.
Currently, DFS offers loans, under a state-law based model, to residents of Alabama, Alaska, California, Delaware, Hawaii, Idaho, Kansas, Louisiana, Minnesota, Missouri, Nevada, North Dakota, Rhode Island, South Dakota, Utah, Washington, Wyoming, and Wisconsin, and operates as a Credit Access Business in Texas, through which it offers loans originated by an unaffiliated, third-party lender. In addition, DFS UK offers loans in the United Kingdom. DFS Canada does not currently offer any loans.
As of April 1, 2012, DFS had 76 employees, including part-time employees, primarily located at DFS's corporate headquarters in North Logan, Utah, which manages the loan underwriting, collections, information technology, and other aspects of the DFS business. Unless stated otherwise, information in this prospectus regarding our business does not give effect to the acquisition of DFS.
Through our acquisition of DFS, we gain access to a scalable Internet-based revenue opportunity. We believe this additional retail channel will enable us to efficiently reach consumers not fully served by our existing retail locations. Our objective will be to accelerate the growth of DFS through incremental capital, application of retailing strategies and an expansion of its product offerings.
For the year ended December 31, 2011, based on DFS's unaudited financial information provided to us by the seller, DFS reported revenues and EBITDA of approximately $22.7 million and $3.5 million, respectively.
Florida Acquisition. On April 22, 2012, we signed a definitive purchase agreement to acquire the assets of a retail consumer finance operator in the state of Florida. This retail consumer finance company operates over 30 stores in South Florida markets. The purchase price will be $45.5 million, subject to certain closing adjustments, and we expect to close this transaction in the second fiscal quarter of 2012, though our obligation to close is conditioned on completion of this offering. For 2011, based on unaudited financial information provided to us by the seller, the company reported revenues and EBITDA of approximately $20.5 million and $7.2 million, respectively. We believe this potential acquisition represents an attractive growth opportunity in what we view as a stable market. We believe we will be able to enhance the contribution of the acquired stores through a combination of implementing our prepaid card program and applying our retail strategies.
We remain in active dialogue with numerous potential acquisition targets. Our historic growth has included acquisitions, which have provided additional revenue through increasing the number of our retail locations, and growth from implementing our business plan and product offerings in newly acquired stores. We plan to continue to execute on this strategy in the future.
Industry Overview
We operate in a segment of the financial services industry that serves unbanked and underbanked consumers in need of convenient and immediate access to cash and other financial products and
85
services, often referred to as "alternative financial services". Our industry provides services to an estimated 60 million unbanked and underbanked consumers in the United States. Products and services offered by this industry segment include various types of short-term loans (including payday loans, title loans, small installment loans, internet loans and pawn loans), medium-term loans, check cashing, prepaid card products, rent-to-own products, bill payment services, tax preparation, money orders and money transfers. Consumers who use these services are often underserved by banks and other traditional financial institutions and referred to as "unbanked" or "underbanked" consumers.
We believe that consumers seek our industry's services for numerous reasons, including because they often:
- •
- prefer and trust the simplicity, transparency and convenience of our products;
- •
- may have a dislike or distrust of banks due to confusing and complicated fee structures that are not uncommon for
traditional bank products;
- •
- require access to financial services outside of normal banking hours;
- •
- have an immediate need for cash for sudden financial challenges and unexpected expenses;
- •
- have been rejected for or are unable to access traditional banking or other credit services;
- •
- seek an alternative to the high cost of bank overdraft fees, credit card and other late payment fees and utility late
payment, disconnect and reconnection fees; and
- •
- wish to avoid potential negative credit consequences of missed payments with traditional creditors.
Demand in our industry has been fueled by several demographic and socioeconomic trends, including an overall increase in the population and stagnant to declining growth in the household income for working-class individuals. In addition, many banks have reduced or eliminated services that working-class consumers require, due to the higher costs associated with serving these consumers and increased regulatory and compliance costs. The necessity for our products was highlighted by a recent paper from the NBER, which found that half of the Americans surveyed reported that it is unlikely that they would be able to gather $2,000 to cover a financial emergency, even if given a month to obtain funds. As a result of these trends, a significant number of retailers in other industries have begun to offer financial services to these consumers. The providers of these services are fragmented and range from specialty finance stores to retail stores in other industries that offer ancillary financial services.
We believe that the markets in which we operate are highly fragmented. Stephens estimates that short-term consumer lenders generated approximately $40.0 billion of domestic transaction volume in 2010 from approximately 19,500 storefronts and 150 online lenders. According to Stephens, only seven industry participants have more than 500 storefront locations, and the largest 15 operators account for less than 51% of the storefronts in the United States. FiSCA estimated that in 2007 there were approximately 13,000 check-cashing and other fee-based financial service locations in the United States that cashed approximately $58.0 billion in aggregate face amount of checks.
We anticipate consolidation within the industry will continue as a result of numerous factors, including:
- •
- economies of scale available to larger operators;
- •
- adoption of technology to better serve customers and control large store networks;
- •
- increased licensing, zoning and other regulatory requirements; and
- •
- the inability of smaller operators to form the alliances necessary to deliver new products and adapt to changes in the regulatory environment.
86
The prepaid debit card space is one of the most rapidly growing segments of our industry. Mercator's analysis of the prepaid debit card industry indicates that $28.6 billion was loaded onto general-purpose reloadable cards during 2009, a 47% growth rate from 2008, and estimates that the total general-purpose reloadable card market will grow at a compound annual growth rate of 63% from 2007 to 2013, reaching an estimated $201.9 billion in load volume by 2013. A March 2011 study conducted by Bretton Woods concluded that the opening of reloadable prepaid debit card accounts may surpass the opening of new checking accounts in the coming years as a result of the fact that prepaid debit cards, particularly when combined with direct deposit, will in many instances be less expensive for consumers than traditional checking accounts.
We take an active leadership role in numerous trade organizations that represent our industry's interests and promote best practices within the industry, including the Community Financial Services Association of America, FiSCA, the National Branded Prepaid Card Association and the American Association of Responsible Auto Lenders.
Our Strengths
We believe the following strengths differentiate us from our competitors in the marketplace and will enable us to maintain our position as a leading retailer in the alternative financial services industry.
Leading Market Position with Industry Leading Operating Metrics. We are one of the largest operators in our industry. We operate 435 stores across 14 states, in an industry that remains highly fragmented. As a result of our focus on store selection and design and our efforts to provide consistent, high-quality customer service, we have achieved per store revenue and per store Adjusted EBITDA contribution levels that we believe substantially exceed our publicly traded peers. For the year ended December 31, 2011, we generated revenue per store of over $795,000, with each store contributing, on average, more than $227,000 to Adjusted EBITDA. We estimate that these figures are approximately 1.7 to 3.2 times and 1.4 to 4.3 times, respectively, those of our publicly traded peers over the same period. For an explanation of how we calculate these figures, see "Certain Financial Measures and Other Information".
Proven History of Successful Acquisition Integration. We have invested significant resources in building a scalable company-wide platform in areas such as collections, call center operations, information technology, and legal and compliance, in order to successfully integrate acquired companies and stores into our business. This scalable infrastructure and proven acquisition platform has allowed us to integrate acquired businesses and stores efficiently and implement our unique retail focus to grow revenue. For example, we have been able to integrate our existing product offerings and customer service-oriented approach to significantly increase store-level revenues following the acquisition of 19 stores in the Alabama Acquisition and eight stores in the Michigan Acquisition. Our stores in the Michigan market experienced 26.4% revenue growth for the year ended December 31, 2011 as compared to the year ended December 31, 2010. Our stores in the Alabama market experienced 34.4% revenue growth for the year ended December 31, 2011 as compared to the same period in 2010. In both California and Illinois, we have introduced our enhanced service offerings following those acquisitions. Revenues from the stores acquired in the California Acquisition grew 9.8% during the fourth quarter of 2011 as compared to the fourth quarter of 2010. In the acquired Illinois stores, we have focused on growing customer count in 2011 following the implementation of a new lending statute in Illinois that resulted in a decline in revenue.
Best-in-Class Customer Service. We believe that our retailing competency and our focus on and reputation for superior customer service have been key drivers of our success. We seek to consistently deliver fast, professional service with courteous, personalized treatment designed to ensure that
87
customers feel valued and respected. Our superior customer service culture is primarily the result of the following:
- •
- Convenient store layout, locations and hours. Our stores
are generally designed to maximize customer traffic and privacy while minimizing customer wait time. Our stores typically have five to seven teller stations, which allow us to serve multiple customers
simultaneously and reduce customer wait time. We seek to place our stores in locations that are easily accessible, have ample parking and are in areas of high commercial traffic. We use highly visible
signage to attract customers and reinforce brand recognition. Our management believes that our stores are typically open longer hours than those of our publicly traded peers and that we have more
24-hour stores than any of our publicly traded peers. Our stores are typically open from 8 a.m. to 8 p.m., Monday through Saturday, and 11 a.m. to 5 p.m. on
Sunday, and 26 of our stores are open 24 hours per day.
- •
- Highly Trained and Long Tenured Employees. We dedicate significant resources to training and retaining our employees, resulting in what we believe is meaningfully lower employee turnover compared to our peers. Our branch employees are trained and incentivized to be efficient and helpful in meeting customer needs. We believe our approach promotes customer trust and, ultimately, customer loyalty. All of our district and regional managers have experience working in our stores, where they gained operational expertise and local market awareness, which we believe translates into the ability to make and implement appropriate strategic and operational decisions. We maintain an internal, centralized collections department that is staffed with personnel who specialize in collection activities. Our centralized collections model allows store-level employees to focus on customer service while leaving collections activities to dedicated and skilled professionals. We have designed an incentive-based compensation structure that we believe keeps our branch employees, managers and collections specialists properly motivated.
Diversified Revenue Mix. We operate a scalable business model with significant product and geographic diversification across our operating platform. Our diverse product offerings allow us to better serve our customers by providing a solution that fits their particular financial needs.
In 2011, newly piloted offerings included a revamped tax preparation service which, in most states in which it was offered, was coupled with a lending feature, and an automotive insurance product. In addition to product expansion, we have focused on channel expansion. During 2011, we expanded our call-center capabilities to enable direct-to-consumer marketing. The acquisition of DFS provides us with an Internet channel to serve customers.
Track Record of Flexible and Innovative Execution. Historically, we have proactively and successfully responded to legislative developments in the jurisdictions in which we operate and have continued to offer innovative products that meet our customers' financial needs. In states where the market has been impacted by disruptive legislative developments, we have generally been able to utilize our execution capabilities to modify and introduce products that comply with the applicable legislative frameworks but preserve, to the greatest extent possible, our financial performance. We have not exited any geographic markets as a result of regulatory changes, although we have ceased offering short-term loans to members of the U.S. military as a result of Department of Defense regulations and to residents of Arizona as a result of a change in the law in Arizona. Despite recent changes in the regulatory regimes in a number of the states in which we operate, from 2009 to 2011, we grew revenue and Adjusted EBITDA at compound annual growth rates of 23.1% and 21.3%, respectively.
Scalable IT Infrastructure and Compliance Focus. We have committed significant resources to develop a scalable technology platform capable of supporting significant growth. Our POS systems and collections and accounting systems interface with each other, allowing close monitoring of store performance and collections while also providing real-time reporting capabilities. Our IT infrastructure enables us to centrally control and implement changes to consumer loan agreement terms or
88
Truth-in-Lending disclosures required by statutory or regulatory developments. We utilize our scalable IT infrastructure with robust internal compliance systems and audit teams, which regularly evaluate each store to confirm strict adherence to applicable laws and regulations and test store-based systems that are in place to detect and prevent fraudulent activities. Our Chief Compliance and Technology Officer serves as an executive level officer and is actively involved in the process of developing new products and bringing them to market. The acquisition of DFS, an e-commerce company, provides us additional scalable IT competencies, including systematic risk-management tools, which can be applied across our business.
Experienced and Innovative Management Team. Our management team consists of individuals highly experienced in the short-term consumer loan, check cashing and prepaid debit card industries, as well as other financial and retail-based businesses. Ted Saunders, our Chief Executive Officer, who has been with us for 5 years and was promoted from Chief Financial Officer to Chief Executive Officer in 2008, has managed all areas of operations and finance during his tenure. Kyle Hanson, our President, has been with us for 13 years and was previously a District Manager, Regional Manager and then our Vice-President of Store Operations before assuming his current position. Our Chief Compliance and Technology Officer, Chad Streff, has been with us for 10 years. Michael Durbin, our Chief Financial Officer, joined us in 2008. Additionally, since its initial investment in 2006, Diamond Castle and its board designees have provided us with valuable operational and strategic experience and insight. Our Chairman, H. Eugene Lockhart, has substantial experience in retail financial services and card products and services, having previously served as President of the Global Retail Bank at Bank of America, President and Chief Executive Officer of MasterCard International and Chairman of NetSpend Corporation.
Growth Strategy
Our goal is to be the provider of choice for retail consumer finance products in each of the markets in which we operate. Our strategy is to capitalize on our competitive strengths to increase our revenues, profitability and cash flow through (1) advancing our retail strategies with innovative products and services, (2) executing on strategic accretive acquisitions and organic growth and (3) continuing to diversify through product, geographic and retail channel expansion.
Advancing our retail strategies with innovative products and services. We believe we achieve superior per store metrics by successfully executing customer-centric retailing. In striving to satisfy our customers' financial service needs, we continue to expand our product and service offerings. This expansion in products and services is evident in the growth of title loans, which represented 6.1% of revenue in 2011 versus only 3.5% in 2009, and in the growth of prepaid debit card products and services, which represented 6.5% of revenue in 2011 versus only 1.0% in 2009. The launch of prepaid debit card products in our stores, which offer an increasingly popular alternative to cash for our customers has been highly successful to date, and we anticipate positioning our card products as a central platform to address our customers' wide range of financial needs. In addition, during 2011, we successfully piloted a tax preparation service, which was coupled with a lending feature in most states in which it was offered, and began piloting an automotive insurance product. We intend to continue to evaluate and offer new products and services to meet the needs of our customers and to increase customer loyalty and our market share. We believe that our retailing expertise, together with our scalable infrastructure, provide us with the ability to innovate in product development by introducing new products or adapting and evolving current products and services to respond to consumer demand or potential regulatory changes.
Executing on strategic accretive acquisitions and organic growth. We believe that opportunistic and strategic accretive acquisitions of stores, loan portfolios and customer lists will allow us to continue to expand into new markets, increase our presence in existing markets and grow transaction volume in existing stores. CCCS is a recent example of an acquisition that we believe positions us for continued
89
growth. The combination of CCCS with CheckSmart provided us with a unique opportunity to expand our market presence in California through an established platform that shared many of CheckSmart's operating practices and philosophies, including a customer service-oriented retail business model, diverse product offerings, attractive and prominent real estate and comprehensive information technology infrastructure. We believe the California market offers a stable regulatory environment for our products and services, as California's enabling legislation has remained substantially unchanged since its passage 15 years ago. In combining CCCS's 114 Northern California stores with CheckSmart's existing 17 Northern California stores, we believe we are the alternative financial services market leader in Northern California by store count, with a combined population of approximately 14.3 million in the Northern California markets we serve. We have introduced elements of CheckSmart's retail model within CCCS's operations. In December of 2011, we completed the consolidation of the corporate headquarters facility to achieve operational efficiencies. Revenues from the stores acquired in the California Acquisition grew 9.8% during the fourth quarter of 2011 as compared to the fourth quarter of 2010. We also anticipate introducing certain other of our best practices at existing CCCS stores in order to enhance further the CCCS store base, particularly in the areas of consumer lending and prepaid debit card products. We believe that we will be able to further increase store volume in CCCS stores, bringing store-level performance closer to the performance we have historically experienced across the rest of our store portfolio.
The market in which we operate is fragmented. We believe compliance demands and competitive pressures will continue to encourage weaker competitors to exit the market. We intend to continue to expand our network of stores opportunistically through strategic acquisitions in our current markets, as well as in new domestic and, possibly, international markets. In the past, we have opportunistically acquired loan portfolios and customer lists from small competitors, and we will continue to evaluate these opportunities in the future as an efficient means of growing transaction volume in our existing stores and delivering our full suite of services to a broader customer base. We believe that our scalable infrastructure and acquisition platform enables us to successfully integrate and improve the operations of stores that we acquire. At the stores we acquired in Alabama and Michigan, we were able to substantially improve store level operating profit during the first year following each acquisition. For the year ended December 31, 2011, the revenues from the stores acquired through the Michigan and Alabama Acquisitions increased by more than 26% compared to the prior year. We intend to use our experience in implementing best practices to continue to improve the financial performance of acquired stores.
In select markets that we believe represent unique growth opportunities, we will continue to open new stores. These will typically be to fill-in markets, to improve our market presence or to pursue niche opportunities.
Continuing to diversify through product, geographic, and retail channel expansion. The segment of the market we serve is large and growing. The National Bureau of Economic Research reports that half of the Americans surveyed reported that it is unlikely they would be able to gather $2,000 to cover a financial emergency, even if given a month to obtain funds. We believe there is an opportunity to provide these potential customers with multiple financial products and services through the retail channel of their preference. At December 31, 2008, we operated through 252 retail branches in 11 states. At December 31, 2011, we operated through 435 retail branches in 14 states, serviced customers through a call center and delivered products through a prepaid card offered by Insight. Our objective is to continue to expand the products and services we offer this growing market segment as well as the geography and channels through which they are offered, as evidenced by our acquisition of the DFS Companies.
90
Our Customers
We serve a large and growing demographic group of customers by providing services to help them manage their day-to-day financial needs. Our customers often live "paycheck-to-paycheck" and, therefore, all or a substantial portion of their current income is expended to cover immediate living expenses.
Our customers are typically working-class, middle-income individuals. Based on third-party market surveys, we believe the following about our customers:
- •
- they typically have an annual household income between $20,000 and $50,000, with approximately one-sixth in
excess of $50,000;
- •
- over 70% are under the age of 45;
- •
- over 50% are between 25 and 44 years of age;
- •
- approximately half are male and half are female;
- •
- approximately half have attended at least some college;
- •
- over 95% have access to the Internet;
- •
- over 70% own a home computer;
- •
- over 55% have access to a computer in the workplace; and
- •
- approximately 75% have access to a checking account and choose to use our services as a means of managing their financial needs.
Our customers generally are unserved or underserved by the traditional banking system and choose alternative solutions to gain convenient and immediate access to cash, consumer loans, prepaid debit cards, money transfers, bill payments and money orders. We believe that our customers use our financial services because we provide them with a safe, welcoming environment and because they are quick, convenient and, in many instances, more affordable than available alternatives.
91
Store Locations and Operations
The following map illustrates the number and location of our stores in operation as of December 31, 2011.

We typically locate our stores in highly visible and accessible locations, such as shopping centers and free-standing buildings in high-traffic shopping areas. Other nearby retailers are typically grocery stores, restaurants, drug stores and discount stores. All of our stores are leased. Our stores, on average, occupy approximately 1,920 square feet. We are focused on increasing the customer's awareness of each of our brands by using uniform signage for each brand and store design at each location. We currently operate stores under the following brands:
- •
- CheckSmart;
- •
- Buckeye CheckSmart;
- •
- California Check Cashing Stores;
- •
- Express Consumer Loans;
- •
- First Cash Advance (pursuant to a license agreement that expires on December 31, 2016);
- •
- Cash 1;
- •
- Southwest Check Cashing;
- •
- Cash & Go;
- •
- First Virginia;
- •
- Buckeye Title Loan; and
- •
- Easy Money.
92
Our stores are typically open from 8 a.m. until 8 p.m. Monday through Saturday and 11 a.m. until 5 p.m. on Sunday, although some stores are closed on Sunday. Additionally, 26 of our stores are open 24 hours a day.
Our store development staff selects each new store location, negotiates leases, and supervises the construction of new stores and the remodeling of existing stores. In addition, it performs lease management and facility maintenance services for open stores. Since all of our stores are built within existing retail space, the customer area of each store is customized to meet the varying size and other requirements of each location while also giving it an appearance that is consistent with our other similarly branded stores.
We close stores for various reasons, including inadequate operating performance, lease expirations and shopping center closings. During 2008, 2009 and 2010, we closed or consolidated six, zero and three stores, respectively. We did not close any stores during 2011.
Advertising and Marketing
Our marketing efforts are designed to promote our product and service offerings, create customer loyalty, introduce new customers to our stores and create cross-selling opportunities. In our markets, we operate under several brands (including those of stores we have acquired) each with individually strong local reputations. In most of our markets, we utilize mass-media advertising, including flyers, direct mail, outdoor advertising, yellow pages and radio and television advertising. We also utilize point-of-purchase materials in our retail locations to implement in-store marketing programs and promotions. We generally implement special promotions to maximize certain seasonal revenue opportunities, including holidays and tax season. Additional local marketing initiatives include sponsorship and participation in local events and charity functions.
We develop our marketing strategies based in part on results from consumer research and data analysis and from insights gained from phantom-shopper programs. We are continuously testing new ways of communicating and promoting our products and services, which include direct mail, online advertising, text messaging, print advertising, telemarketing and enhanced bilingual communications.
Employees
As of December 31, 2011, we had 2,653 employees, including 2,371 store managers and service associates, 54 district managers, 11 regional managers, four regional vice presidents, 16 regional support personnel located in Alabama, 218 corporate employees located in Ohio and 13 corporate employees located in California.
We consider our employee relations to be good. Our employees are not covered by a collective bargaining agreement, and we have never experienced any organized work stoppage, strike, or labor dispute.
Human Resources
Our store operations have historically been organized into three regions, and since the California Acquisition we have added a fourth region. Each region has a regional vice president who reports to our Vice President of Operations and is responsible for the operations, administration, training and supervision of stores in his or her region. As of December 31, 2011, our four regional vice presidents were responsible for the operations of approximately 108 stores each. We have 54 district managers, each of whom reports to the regional manager or regional vice president for his or her region and is directly responsible for the general management of approximately eight stores within his or her territory. These district managers are responsible for hiring, scheduling, store operations, local marketing and employee relations. Each store manager reports to a district manager and has direct responsibility over his or her store's operations.
93
Each regional vice president is supported by the human resources department and training department, which coordinate recruiting, hiring and training (initial and on-going). Our corporate vice president of human resources has worked with us for over nineteen years, seventeen of which have been in a human resource function, and also has in-depth knowledge and experience with internal investigations and human resources compliance and is supported by a full-time human resource and benefits staff of six employees. We organize human resource learning sessions for field management on a monthly basis as well conducting on-going coaching and support for the district and regional management. Human resources sponsors on-going programs intended to prepare employees to advance to the next level of operations management. All human resource associates attend continuing education training sessions throughout the year.
Training
Customer service associates, store managers, district managers, regional managers and regional vice presidents must complete formal training programs. Those training programs include:
- •
- management training programs that cover employee hiring, progressive discipline, retention, sexual harassment,
compensation, equal employment opportunity compliance and leadership;
- •
- an annual operations conference, which is state specific, with all regional vice presidents, regional managers, district
managers and store managers, which covers topics such as customer service, loss reduction, safety and security, better delivery of services and compliance with legal and regulatory requirements, human
resources policies and procedures and leadership development;
- •
- the use of a web-based training tool, Bankers Edge, to augment our on-the-job
training, and effectively deliver and document our mandatory annual anti-money laundering and suspicious activity reporting training and testing;
- •
- new branch employee training which consists of online and on-the-job training with experienced
branch employees for a minimum of six weeks; and
- •
- multiple, annual, SmartTrack succession programs in place to identify and develop exceptional store, district and regional managers.
Our national training coordinator and director of auditing and loss prevention also coordinates on-going training for branch employees to review customer service, compliance, security and service-focused issues.
Hiring and Retention. District managers and experienced store managers are responsible for branch employee recruitment. To facilitate this process, we use multiple Internet-based automated recruitment systems for position placement advertising and pre-screening. We believe the automated recruitment systems allow us to identify employee characteristics and recruiting sources that can lead to long-term, successful employees.
Our branch employees undergo a criminal background check, a process whereby we confirm that the social security number provided by the prospective employee matches the name of the employee, a credit check (where permitted by law), prior employment verification, random drug screening and an interview process before employment. We maintain a compensation and career path program to provide employees with competitive pay rates and opportunities for advancement. We offer a complete and competitive benefits package to attract and retain employees.
Information Systems
We utilize a centralized management information system to support our customer service strategy and manage transaction risk, collections, internal controls, record keeping and compliance, and daily reporting functions. Our management system incorporates three commercial, off-the-shelf point-of-sale
94
systems customized to our specific use characteristics. These POS systems are complemented by two proprietary systems: Lookup, a web application that uses data from the enterprise reporting database to enable tellers to view a customer's transaction history and current collection status, and MyCard, a card activation program with Insight. We operate three POS systems in order to effectively manage our diverse product set with the most effective applications, and to manage acquired stores' legacy systems in the most efficient manner.
Our POS systems are licensed in all stores and record and monitor the details of every transaction, including the service type, amount, fees, employee, date/time, and actions taken, which allows us to provide our services in a standardized and efficient manner in compliance with applicable regulations. We believe these systems enable us to optimize our store operations to handle more volume than many of our competitors. Transaction data is posted to our accounting system daily.
We operate a wide area data communications network for our stores that has reduced customer waiting times, increased reliability and allows the implementation of new service enhancements. Each store runs Windows operating systems with a four to ten PC network that is connected to our corporate headquarters using a DSL, cable, or T1 connection.
Our corporate data center consists of approximately 40 database and application servers, configured for redundancy and high availability with two EMC storage area network devices, or SANs, with 44 terabytes of available storage. We recently entered into an agreement to build out and migrate our primary data processing off-site to a state-of-the-art facility. The existing data center at our headquarters will remain intact and will be used as a backup site for disaster recovery. This will maximize the availability of centralized systems, optimize up-time for store operations, and eliminate our corporate office as a single point of failure in case of disaster. We maintain and test a comprehensive disaster recovery plan for all critical host systems. We have also contracted with a disaster recovery facility to provide workspaces, computers, and connectivity to our data center for 100 employees in case our headquarters becomes unavailable due to disaster.
Our information technology department maintains a staff of 21 employees. Our development staff primarily focuses on designing and testing customizations to our third-party POS systems, reports, and system integration applications, as well as ongoing development of the management information systems infrastructure. Our information technology help desk staff provides assistance to our branch employees related to hardware/software troubleshooting, application support, and telecommunications.
Collections
If a check or electronic account debit is returned after deposit or initiation, the account is immediately charged off and collection procedures are initiated. If a title loan customer defaults (30 days for short-term title loans and 60 days for long-term title loans), the account is immediately charged off and collection procedures are initiated. Our collections procedures for consumer loans comply with, as applicable, the stricter of state regulation and best practices set forth by the CFSA. When a check or account debit is returned, all returned items are referred to the corporate office. They are entered into the collections system, and the store at which the customer initiated the transaction is notified of the return. We generally perfect our interest in secured loans at the time of the loan where allowed by law. Our collection procedures for title loans comply with state laws regarding notice, repossession and sale of secured collateral. Servers for the collections system are maintained in our data center, and collections activity is imported into our accounting system on a daily basis.
Once notified, the branch employees attempt to collect by calling the telephone number(s) the customer previously provided to inform them of the return. After a loan becomes two weeks overdue or two weeks after a cashed check is returned, the account is sent to the internal, centralized collections department. The collections department attempts to settle the account by sending letters and making phone calls to the customer. After 90 to 120 days, a consumer loan account may be sent to
95
a third-party collections agency and after 90 days, we may attempt repossession on vehicles securing title loans. Where repossession occurs, it is done by bonded and insured asset recovery firms. Should disposition of a vehicle securing a title loan happen, the sale is conducted in a commercially reasonable manner as required by applicable state law. The third-party collection agencies we engage are appropriately bonded and insured.
Because we maintain extensive customer information, any customer who has a delinquent account may not obtain another cash advance from us. We maintain a uniform policy, however, that if a customer returns to pay off a delinquent account, we will lend to that customer again.
Security
Employee safety is critical to us. Nearly all of our branch employees work behind bullet-resistant Plexiglas and reinforced partitions, and have security measures that include a time-delay equipped safe, an alarm system monitored by a third party, and personal panic buttons for each of our tellers. Many of our stores also have multi-camera DVR systems with remote access capability, teller area entry control, perimeter opening entry detection, and tracking of all employee movement in and out of secured areas. Training on security measures is part of each annual state meeting.
Our business requires our stores to maintain a significant supply of cash. We are therefore subject to the risk of cash shortages resulting from employee and non-employee theft, as well as employee errors. Although we have implemented various programs to reduce these risks and provide security for our facilities and employees, these risks cannot be eliminated. From 2009 through 2011, our uncollected cash shortages from employee errors and from theft were consistently less than 0.10% of revenue annually from continuing operations.
Our POS system allows management to detect cash shortages on a daily basis. In addition to other procedures, district managers and our internal audit staff conduct audits of each store's cash position and inventories on an unannounced, random basis. Professional armored carriers provide the daily transportation of currency for the majority of our stores. In addition, most stores electronically scan their check inventory to facilitate verification and record keeping.
Competition
The industry in which we operate is highly fragmented and very competitive. We believe the principal competitive factors in short-term consumer lending, title lending, check cashing and prepaid debit card services are location, customer service, fees and the transparency of fees, convenience, range of services offered, speed of service and confidentiality. We face intense competition and believe each of the markets in which we operate is becoming more competitive as these industries mature and consolidate. With respect to our short-term consumer lending business, we compete primarily with mono-line payday lending businesses, other check cashers and multi-line alternative financial service providers, pawn shops, rent-to-own businesses, banks and credit unions. With respect to our check cashing business, we compete with other check cashers and multi-line alternative financial service providers, grocery stores, convenience stores, banks, credit unions, and any other retailer that cashes checks, sells money orders, provides money transfer services or offers other similar financial services, including some big-box retailers. Some retailers cash checks without charging a fee under limited circumstances. With respect to our prepaid debit card services, we compete primarily with prepaid debit card issuers, other check cashers and multi-line alternative financial service providers, banks, credit unions, and any other retailer offering general purpose reloadable prepaid debit cards, including some big-box retailers. Some of our competitors, such as big-box retailers, have larger and more established customer bases and networks of existing stores and substantially greater financial, marketing and other resources than us.
96
Relationships with Key Vendors
Western Union / MoneyGram Agreements. We are party to a master Agency Agreement, dated December 30, 2011, with Western Union, which we refer to as the "Western Union Agreement". The Western Union Agreement is comprised of two parts. Under the first part of the Western Union Agreement, we act as an agent for the receipt and transmission of wire transfers of money through the Western Union money transfer system. Under the second part of the Western Union Agreement, we sell money orders that bear the Western Union logo at certain locations.
The initial term of the Western Union Agreement is five years, which automatically renews for an additional one-year term. Upon expiration of the one-year renewal term, the Western Union Agreement will continue in effect, subject to either party's right to terminate the agreement by giving the other party at least nine months prior written notice. Western Union paid us a signing bonus in connection with its execution of the Western Union Agreement. Upon the occurrence of certain events, we will be obligated to repay Western Union a portion of the signing bonus. Western Union is obligated to pay us new store incentive bonuses for each new and acquired location opened during the term of the agreement at which Western Union money transfer services are offered.
We earn commissions for each transmission and receipt of money through the Western Union network and MoneyGram Payment Systems Inc., or MoneyGram, transacted at a company-owned location. Those commissions equal a percentage of the fees charged by Western Union to consumers for Western Union services. Our total revenues from commissions for money transfer services during the years ended December 31, 2009, 2010 and 2011 was $0.9 million, $0.8 million and $3.8 million, respectively. Such revenue in 2010 and 2011 includes both commissions from Western Union and MoneyGram.
With respect to our Alabama locations, we are party to similar contracts with MoneyGram under which we act as an agent for the receipt and transmission of wire transfers of money through the MoneyGram money transfer system and our Alabama locations exclusively sell money orders that bear the MoneyGram logo.
The fee charged for money order sales is $1.00, or free for our check cashing customers. During the years ended December 31, 2009, 2010 and 2011, our revenues from such fees were $0.6 million, $0.5 million and $1.1 million, respectively. Such revenue includes both Western Union and Money-2-Go money orders.
Insight Agreements. In September 2009, we entered into Independent Agency Agreements with Insight in each state in which we operate, which were amended and restated in November 2011. Under each Independent Agency Agreement, our stores serve as distribution points where customers can purchase prepaid debit cards provided by Insight as well as load funds onto and withdraw funds from their cards. As compensation, we are paid certain agent fees from Insight, which are based on monthly card fees, overdraft charges, interchange fees and ATM access fees. In addition, we earn fees from the sale of prepaid debit cards provided by Insight. During the years ended December 31, 2009, 2010 and 2011, our revenues from fees paid pursuant to this agreement were $0.1 million, $9.9 million and $19.4 million, respectively. We are required to pre-fund certain card activity under this agreement with Insight.
In November 2011, we purchased a 22.5% interest in Insight Holding. We also agreed to make available to Insight Holding a revolving credit facility of $3,000,000. See "Certain Relationships and Related-Party Transactions—Insight Agent Agreements."
Third-Party Lender Agreements. In Arizona and to a much lesser extent in certain stores in Ohio, third-party licensed lenders, unaffiliated with us, offer our customers the ability to access a credit line with loan proceeds delivered via debit card. The customer may access their credit line in one of the following methods: (1) a card load, if and when the borrower seeks to make a debit card purchase but
97
has insufficient funds on the card; (2) a card load at the borrower's request in advance of a transaction; and (3) a check mailed to the borrower at his or her request. With respect to these credit lines, a subsidiary other than the subsidiary operating the store at which the debit cards are purchased has an agreement in place whereby it, in the case of Arizona, purchases an 85% participation interest in the third-party lender's portfolio or, in the case of the limited number of stores in Ohio, acquires defaulted loans.
Global Express Agreement. In November 2008, we entered into a Universal Trust Agreement with Global Express. Pursuant to the Universal Trust Agreement, we issued certain loan proceeds in the State of Ohio through Global Express in the form of money orders. We are required to compensate Global Express for the use of these money orders and must pre-fund certain amounts to mitigate Global Express's risk related to the outstanding money order. The initial term of the Universal Trust Agreement was two years, which automatically renewed for a second one-year term after the first renewal term expired in November 2011. At December 31, 2009, 2010 and 2011, we had $13.5 million, $8.0 million and $0 in pre-funding assets, respectively.
Regulation and Compliance
Our products and services are subject to extensive state, federal and local regulation. The regulation of the consumer financial services industry is intended primarily to protect consumers, detect illicit activity involving the use of cash, as well as provide operational guidelines to standardize business practices. Regulations commonly address allowable fees and charges related to consumer loan products, maximum loan duration and amounts, renewal policies, disclosures and reporting and documentation requirements.
We are subject to federal and state regulations that require disclosure of the principal terms of each transaction to every customer, prohibit misleading advertising, protect against discriminatory practices, and proscribe unfair, deceptive and abusive practices. We maintain legal and compliance departments to monitor new regulations as they are introduced at the federal, state, and local level and existing regulations as they are repealed, amended, and modified. Although we cannot assure you that we are in full compliance, we believe we are in substantial compliance with all material federal and state laws and regulations.
Our compliance committee, chaired by our Chief Compliance and Technology Officer, is comprised of several high-level executives who bring together knowledge from their respective areas of expertise. The committee is responsible for approving new or modified products and services after thorough review of applicable statutes and regulations. We place a strong emphasis from the top down on the importance of compliance, and require annual training for compliance committee members, all executives, and all operations employees.
Our compliance department consists of 25 employees, including our internal audit team. We have a staff of 15 internal auditors whose function is to monitor compliance by our branches with applicable federal and state laws and regulations as well as our internal policies and procedures. The internal auditors conduct periodic unannounced audits of our branches, typically spending one to two days in each branch reviewing customer files, reports, held checks, cash controls, and compliance with state specific legal requirements and disclosures. Upon completion of an audit, the auditor conducts an exit interview with the branch manager to discuss issues found during the review. As part of the internal audit program, reports for management regarding audit results are prepared to help identify compliance issues that need to be addressed and areas for further training. The compliance committee, through a compliance officer, reviews the internal audit program results, suggests procedural changes, and oversees the implementation of new compliance processes.
Six employees of our compliance department are dedicated to anti-money laundering compliance, form filing, suspicious activity monitoring, and, in the applicable states, statewide database
98
reconciliation. We have continually allocated increasing resources to these areas as we have grown and added new or modified products and services.
U.S. Federal Regulations
Title X of the Dodd-Frank Act establishes the CFPB, which became operational on July 21, 2011. Now that the CFPB has installed director Richard Cordray, it has regulatory, supervisory and enforcement powers over providers of consumer financial products and services, including explicit supervisory authority to examine and require registration of payday lenders. Recently, the CFPB has begun examinations of payday lenders and has informed us that it will be beginning an examination of us in late April 2012. Included in the powers afforded the CFPB is the authority to adopt rules describing specified acts and practices as being "unfair", "deceptive" or "abusive", and hence unlawful. While Dodd-Frank expressly provides that the CFPB has no authority to establish usury limits, some consumer advocacy groups have suggested that payday and title lending should be a regulatory priority and it is possible that at some time in the future the CFPB could propose and adopt rules making such lending materially less profitable, impractical or impossible. The CFPB could also adopt rules imposing new and potentially burdensome requirements and limitations with respect to our other lines of business.
In addition to Dodd-Frank's grant of regulatory powers to the CFPB, Dodd-Frank gives the CFPB authority to pursue administrative proceedings or litigation for violations of federal consumer financial laws (including the CFPB's own rules). In these proceedings, the CFPB can obtain cease and desist orders (which can include orders for restitution or rescission of contracts, as well as other kinds of affirmative relief) and monetary penalties ranging from $5,000 per day for ordinary violations of federal consumer financial laws to $25,000 per day for reckless violations and $1 million per day for knowing violations. Also, where a company has violated Title X of Dodd-Frank or CFPB regulations under Title X, Dodd-Frank empowers state attorneys general and state regulators to bring civil actions for the kind of cease and desist orders available to the CFPB (but not for civil penalties).
Federal law has effectively prohibited lenders from making certain short-term consumer loans to members of the U.S. military, active-duty reservists and National Guard, and their respective dependents since October 1, 2007. Under regulations promulgated by the U.S. Department of Defense to implement section 670 of the John Warner National Defense Act of 2007, otherwise known as the "Talent Amendment", certain short-term consumer loans, including payday loans with terms of 91 days or less and vehicle title loans with terms of 181 days or less, are subject to a 36 percent annual rate cap. As a result, we have ceased offering short-term consumer loans to these customers.
Federal law imposes additional requirements on us with respect to our short-term consumer lending. These requirements include disclosure requirements under the Truth-in-Lending Act ("TILA") and Regulation Z; notice and non-discrimination requirements under the Equal Credit Opportunity Act ("ECOA") and Regulation B; requirements with respect to electronic signatures and disclosures under the Electronic Signatures In Global And National Commerce Act ("ESIGN"); and requirements with respect to electronic payments under the Electronic Funds Transfer Act ("EFTA") and Regulation E. EFTA and Regulation E requirements also have an important impact on our prepaid debit card services business.
Under regulations of the U.S. Department of the Treasury (the "Treasury Department"), adopted under the Bank Secrecy Act of 1970 ("BSA"), we must report transactions involving currency in an amount greater than $10,000, and we must retain records for five years for purchases of monetary instruments for cash in amounts from $3,000 to $10,000. In general, every financial institution, including us, must report each deposit, withdrawal, exchange of currency or other payment or transfer, whether by, through or to the financial institution, that involves currency in an amount greater than $10,000. In addition, multiple currency transactions must be treated as single transactions if the financial institution has knowledge that the transactions are by, or on behalf of, any person and result in either cash in or
99
cash out totaling more than $10,000 during any one business day. We believe that our point-of-sale system and employee-training programs permit us to comply with these requirements.
The BSA also requires certain of our subsidiaries to register as a money services business with the Treasury Department. This registration is intended to enable governmental authorities to better enforce laws prohibiting money laundering and other illegal activities. We are registered as a money services business with the Treasury Department and must re-register with the Financial Crimes Enforcement Network of the Treasury Department ("FinCEN") by December 31 every other year. We must also maintain a list of names and addresses of, and other information about, our stores and must make that list available to any requesting law enforcement agency (through FinCEN). That store list must be updated at least annually. We do not believe compliance with these existing requirements has had or will have any material impact on our operations.
Federal anti-money-laundering laws make it a criminal offense to own or operate a money transmitting business without the appropriate state licenses, which we maintain where necessary. In addition, the USA PATRIOT Act of 2001 and its implementing federal regulations require us, as a "financial institution", to establish and maintain an anti-money-laundering program. Such a program must include: (1) internal policies, procedures and controls designed to identify and report money laundering; (2) a designated compliance officer; (3) an ongoing employee-training program; and (4) an independent audit function to test the program. Because of our compliance with other federal regulations having essentially similar purposes, we do not believe compliance with these requirements has had or will have any material impact on our operations.
In addition, federal regulations require us to report suspicious transactions involving at least $2,000 to FinCEN. The regulations generally describe three classes of reportable suspicious transactions—one or more related transactions that the money services business knows, suspects, or has reason to suspect (1) involve funds derived from illegal activity or are intended to hide or disguise such funds, (2) are designed to evade the requirements of the BSA or (3) appear to serve no business or lawful purpose. Because of our POS system and transaction monitoring systems, we do not believe compliance with the existing reporting requirement and the corresponding record-keeping requirements has had or will have any material impact on our operations.
The Office of Foreign Assets Control ("OFAC") publishes a list of individuals and companies owned or controlled by, or acting for or on behalf of, targeted countries. It also lists individuals, groups, and entities, such as terrorists and narcotics traffickers, designated under programs that are not country-specific. Collectively, such individuals and companies are called "Specially Designated Nationals". Their assets are blocked and we are generally prohibited from dealing with them. Because our POS system and transaction monitoring systems, we do not believe compliance with the existing reporting requirement and the corresponding record-keeping requirements of OFAC has had or will have any material impact on our operations.
The Gramm-Leach-Bliley Act of 1999 and its implementing federal regulations require us generally to protect the confidentiality of our customers' nonpublic personal information and to disclose to our customers our privacy policy and practices, including those regarding sharing customers' nonpublic personal information with affiliates and third parties. That disclosure must be made to customers at the time the customer relationship is established and at least annually thereafter.
U.S. State Regulation
Our business is regulated under a variety of state enabling statutes, including payday loan, deferred presentment, check cashing, money transmission, small loan and credit services organization state laws, among others. The scope of state regulation, including the fees and terms of our products and services, varies from state to state. Most states with laws that specifically regulate our products and services establish allowable fees and/or interest and other charges to consumers.
100
In addition, many states regulate the maximum amount of, minimum maturity of, and impose limits on the renewal or extension of, short-term consumer loans. The terms of our products and services vary from state to state in order to comply with the laws and regulations of the states in which we operate.
In some states, check cashing companies or money transmission agents are required to meet minimum bonding or capital requirements and are subject to record-keeping requirements and/or fee limits. We offer check cashing services in each of the states in which we operate that have licensing or fee regulations regarding check cashing, with the exception of Illinois and certain Virginia locations. We are licensed in each of the states or jurisdictions in which a license is currently required for us to operate as a check cashing company and/or money transmitter. To the extent these states have adopted ceilings on check cashing fees, those ceilings are in excess of or equal to the fees we charge.
In the event of serious or systemic violations of state law, we would be subject to a variety of regulatory and private sanctions. These could include license suspension or revocation; orders or injunctive relief, including judicial or administrative orders providing for restitution or other affirmative relief; and statutory penalties and damages. Depending upon the nature and scope of any violation, statutory penalties and damages could include fines for each violation and/or payments to borrowers equal to a multiple of the fees we charge and in some cases the principal amount loaned as well. Thus, violations of these laws could potentially have a material adverse effect on our results of operation and financial condition.
We do not utilize the so-called "choice of law" model of payday (or title) lending, where a lender attempts to make loans in one state under a contract clause calling for the application of another state's substantive laws. Rather, we attempt to comply in full with the substantive laws of the state where the store involved in an in-person loan transaction is located.
In the last several years, several states in which we operate, including Florida, Illinois, Indiana, Kentucky, Ohio and Virginia have enacted laws (or in the case of Arizona, allowed the deferred presentment law to expire) that have impacted our short-term consumer loan business by imposing new limitations or requirements or effectively prohibiting the loan products we offer. These laws have had varying impacts on our operations and revenue depending on the nature of the limitations and restrictions implemented.
Arizona. On July 2, 2010, the enabling statute under which we formerly provided short-term consumer loans in Arizona expired. As a result, we transitioned customers to other products, including title loans and the enhanced prepaid debit cards described above.
Illinois. In June 2010, the Illinois Legislature passed House Bill 537, which created an installment payday loan product with a term of not less than 112 days and not more than 180 days. The law imposes certain restrictions on loans made pursuant to the statute, including limits on the amount licensees can charge and other payment terms. The statute also establishes a database to track consumer loans made under the statute. This law became effective March 21, 2011.
Ohio. In May 2008, the Ohio Legislature passed House Bill 545, which repealed the statute under which various payday lenders had previously operated. The State of Ohio subsequently issued a referendum staying the effective date of House Bill 545 until November of 2008. As a result of this legislation, we established a new subsidiary (the "OMLA Licensee"), which began offering small denomination loans pursuant to the Ohio Mortgage Loan Act (the "OMLA"). Another subsidiary of ours continued to offer check cashing services, as it had for many years prior to the 2008 legislation. In our Ohio stores, OMLA loan proceeds are issued to borrowers by the OMLA Licensee in the form of a money order and borrowers are presented by our OMLA Licensee with a disclosure form advising them that they can cash the money order with our check cashing affiliate or that they can cash the money order elsewhere possibly at a lower fee or for no cost. Subsequent to the initiation of our OMLA lending, the Ohio Department of Commerce, Division of Financial Institutions (the "Ohio
101
Division") in the first quarter of 2010, issued a rule that purported to ban a company operating under the OMLA or any check cashing licensee affiliated with such company from charging a fee to cash checks or money orders issued by the company or its affiliate. That rule was first temporarily and then permanently enjoined by the Franklin County Court of Common Pleas. The Ohio Division agreed not to appeal that injunction and has not done so. For a more detailed discussion of this litigation, please see "—Legal Proceedings" below.
Virginia. In April 2008, the Virginia legislature amended Virginia's Payday Lending Act and substantially changed the terms for cash advance services in Virginia and severely restricted viable operations for short-term consumer lenders. The new legislation, among other things, (1) prohibited the offering of open ended unsecured lines of credit in the same place as a payday loan, (2) extended the time borrowers have to repay loans to twice their pay period, so that a customer who is paid weekly has two weeks to repay their loan, (3) changed the amount that lenders can charge to a simple annual interest rate of 36 percent plus a fee of as much as 20 percent of the loan amount, or $100 for a $500 loan, and an additional five dollar fee, (4) required the offer of an extended payment plan for defaulting borrowers, (5) imposed required cooling-off periods between loans, (6) instituted a statewide database and (7) prohibited borrowers from rolling over an existing loan and limited borrowers to one loan at a time. This legislation became effective on January 1, 2009. As a result, we discontinued originations of new lines of credit and draws on existing lines of credit in those locations offering our traditional short-term consumer loan product and opened four new locations under a separate brand to offer and service the unsecured line of credit product. Since that time, we have converted an additional ten locations to that separate brand.
We intend to continue, together with others in the short-term consumer loan industry, to inform and educate legislators and regulators and to oppose legislative or regulatory action that would prohibit or severely restrict short-term consumer loans. Nevertheless, if legislative or regulatory action with that effect were taken in states in which we have a significant number of stores, or at the federal level, that action could have a material adverse effect on our loan-related activities and revenues.
Regulating the DFS Companies
As a result of our acquisition of DFS, we are now offering loans to consumers over the Internet through the DFS Companies. In most cases, DFS's subsidiaries are licensed by the jurisdiction in which they offer loans. In the event the states does not have licensing requirements for entities that have no physical presence in the state, the loans are offered under DFS's home state license in Delaware. DFS offers loans to residents of Alabama, Alaska, California, Delaware, Hawaii, Idaho, Kansas, Louisiana, Minnesota, Missouri, Nevada, North Dakota, Rhode Island, South Dakota, Utah, Washington, Wyoming and Wisconsin. In addition, DFS operates as a credit access business in Texas, through which it offers loans originated by an unaffiliated third-party lender. DFS also offers loans in the United Kingdom through DFS UK and is able to offer loans through a Canadian entity, though it does not currently do so. While we have not previously offered loans in many of these jurisdictions, as a result of the acquisition of DFS, we are subject to the regulatory requirements of such jurisdictions.
In addition, DFS relies heavily on the use of lead generators or providers as a source of first-time borrowers. DFS conducts regular audits of these lead generators or providers in order to ensure that each utilizes appropriate privacy and other disclosures to prospective borrowers as to how and where the prospective borrower's personal, non-public information may be disclosed. In addition, DFS regularly audits their lead generators' and providers' compliance with their privacy and other disclosures made to prospective borrowers. The CFPB has indicated its intention to examine compliance with federal laws and regulations and to scrutinize the flow of non-public, private consumer information between lead generators and lead buyers, such as DFS. The use of such lead generators could subject us to additional regulatory cost and expense and, if DFS's ability to use lead generators
102
were to be impaired, DFS's business could be materially adversely affected and we may not realize the expected benefits of the acquisition of DFS.
Further, borrowers repay loans made by DFS in the United States through automated clearing house funds transfer authorizations. Borrowers repay loans made by DFS in the United Kingdom by way of authorizations to process the repayment charge to the borrower's debit card. The CFPB has indicated its intention to examine compliance with various federal laws and regulations and to scrutinize the electronic transfers of funds to repay certain small denomination loans. If DFS were to be restricted in its ability to rely on such funds transfers, its business could be materially adversely affected and we may not realize the expected benefits of acquiring DFS.
Properties
Our average store size is approximately 1,920 square feet. Our stores are typically located in strip shopping centers or free-standing buildings. All of our stores are leased, generally under leases providing for an initial term of three to five years with optional renewal terms of three to five years. Our corporate headquarters in Dublin, Ohio, a suburb of Columbus, currently occupies approximately 37,000 square feet under a lease that expires in 2017.
A substantial number of the stores acquired in connection with the California Acquisition were formerly gas stations at which leaking underground storage tanks required remediation when those operations were discontinued. Although this remediation is still ongoing at a small number of stores, we are not responsible for performing the work, nor has the remediation affected our business.
Legal Proceedings
We are involved from time to time in various legal proceedings incidental to the conduct of our business. Sometimes the legal proceedings instituted against us purport to be class actions or multiparty litigation. In most of these instances, we believe that these actions are subject to arbitration agreements and that the plaintiffs are compelled to arbitrate with us on an individual basis. We believe that none of our current legal proceedings will result in any material impact on our financial condition, results of operations or cash flows. In the event that a lawsuit purports to be a class action, the amount of damages for which we might be responsible is uncertain. In addition, any such amount would depend upon proof of the allegations and on the number of persons who constitute the class of affected plaintiffs. Although the legal proceeding described below did not result in a material impact on our financial condition, these proceedings are reflective of the type of proceeding that could have a material impact on our financial condition.
Ohio Third-Party Litigation
While we were not a named party in the case, we voluntarily joined in an agreement (the "Joinder Agreement") to be bound by the terms of the court's December 21, 2010, order in the case of Fast Cash of America, Inc., et al v. Ohio Department of Commerce and QC Financial Services, Inc. v. Ohio Department of Commerce (the "QC Case"). The initial portion of the QC Case was initiated by Fast Cash America and others in order to challenge Rule 1301:8-8-04(C)(5), or "Rule 1301", issued on May 1, 2010 by the Ohio Division, which purported to prevent check casher licensees from charging customers a fee to cash checks or money orders issued as proceeds of a small loan or mortgage lending transaction. Following our entry into the Joinder Agreement, Judge Charles Schneider of the Franklin County Court of Common Pleas issued a permanent injunction enjoining the Ohio Division from enforcing Rule 1301 on the grounds that Rule 1301 exceeded the Ohio Division's rule-making authority.
The second portion of the QC Case involved an appeal by QC Financial Services, Inc. ("QC") from the decision of the superintendent of the Ohio Division in an administrative proceeding brought against QC. In May 2009, QC, as well as many other licensees and registrants under the OMLA,
103
including us, received notices alleging violation of Ohio law arising from the licensee or registrant (or an affiliate of the licensee or registrant) charging a customer a fee to cash a loan proceeds check or money order issued at the same location by the licensee or registrant, even if the purchase of check cashing services was not a condition of the loan. The Ohio Division asserted that charging a fee in such circumstances constituted a statutorily impermissible additional fee for the loan or, alternatively, constituted the licensee or registrant engaging in another business, check cashing, that tends to conceal an evasion of the act under which the licensee is licensed or the registrant is registered and is therefore illegal. While the Ohio Division followed QC's notice of violation with a notice of hearing against QC, no such notice of hearing was ever issued against us, and the only hearing held on any of the notices of violation was that involving QC. QC initially prevailed in its hearing before the Ohio Division's hearing officer, who concluded that no violation of the law had occurred because the check cashing transaction took place separate from, and not as a condition to, the loan transaction and took place after the conclusion of the loan transaction. The superintendent of the Ohio Division, who has the power to accept or reject the hearing officer's report, elected to reject it and issued a cease and desist order to QC. Accordingly, the superintendent held that QC was in violation of Ohio law. QC appealed the superintendent's decision to Judge Schneider's court. Judge Schneider considered the administrative hearing record de novo, and on July 20, 2011, issued a decision reversing the Division's cease and desist order. The court's opinion reasoned that a secondary check cashing transaction is not a condition to the loan and is, therefore, not prohibited. The Ohio Division waived its right to appeal either Rule 1301 and/or the reversal of the cease and desist order. In addition to this waiver, the Ohio Division agreed to terminate and/or not commence any regulatory proceedings challenging the charging of fees on these secondary check cashing transactions. A change in statute nonetheless could result in check casher licensees, including us, no longer being able to charge customers a fee to cash checks or money orders issued as proceeds of a small loan or mortgage lending transaction at the same office. In addition, the waivers by the Ohio Division do not bind private litigants, who remain free to initiate lawsuits, including putative class actions, based on the same or similar theories.
California Settlement
Five of our former employees have filed two separate class action suits against us alleging that our employees in California were not provided minimum benefits and/or paid in accordance with the California wage order requirements regarding meal periods and rest breaks and alleging various other claims under California law and therefore had not been paid all wages owed to them. In January 2011, we negotiated a settlement agreement with the plaintiffs in one case, subject to the conditions that the settlement is ultimately approved by the California Superior Court and that the other pending case is consolidated with the first case in which we already entered into the settlement agreement. The conditions were satisfied and on December 21, 2011, the presiding judge gave final approval to the settlement. The maximum amount payable to the class pursuant to the settlement agreement was approximately $0.8 million, for which we reserved $0.9 million based on the expected volume of claims and expected fees and expenses. The actual amount we disbursed in satisfaction of the settlement agreement was $0.64 million.
Corporate History
Our predecessor, CheckSmart, a Delaware corporation, was formed in April 2006 upon the acquisition by Diamond Castle of a majority stake in CheckSmart. Since CheckSmart's formation, at which time we had 179 stores, we have continually expanded our business of providing consumer financial products and services. We acquired eight stores in Michigan in August 2009, 19 stores in Alabama in March 2010, and 10 stores in Illinois in March 2011. Community Choice Financial Inc. was formed on April 6, 2011 under the laws of the State of Ohio by the shareholders of CheckSmart to be the holding company of Checksmart and to acquire the ownership interests of CCCS, which had 141 stores at the time of acquisition, primarily in California. As of December 31, 2011, we owned and operated a network of 435 stores across 14 states.
104
Executive officers and directors
The following table sets forth information with respect to our directors and executive officers as of April 25, 2012.
Name
|
Age | Office and Position | |||
|---|---|---|---|---|---|
| William E. Saunders, Jr. | 38 | Chief Executive Officer and Director | |||
| Kyle Hanson | 36 | President | |||
| Chad Streff | 52 | Chief Technology Officer, Chief Compliance Officer and Senior Vice President | |||
| Michael Durbin | 43 | Senior Vice President, Chief Financial Officer and Treasurer | |||
| Bridgette Roman | 49 | Senior Vice President, Secretary and General Counsel | |||
| H. Eugene Lockhart | 62 | Chairman of the Board of Directors | |||
| Andrew Rush | 54 | Director | |||
| Lee A. Wright | 40 | Director | |||
| David M. Wittels | 47 | Director | |||
| Michael Langer | 35 | Director | |||
| Felix Lo | 33 | Director | |||
| Eugene Schutt | 58 | Director | |||
William E. Saunders, Jr. became our Chief Executive Officer in and has served as a Director since June 2008. Mr. Saunders served as our Chief Financial Officer from March 2006 to June 2008. Prior to joining CheckSmart, Mr. Saunders was a Vice President for Stephens Inc., an investment bank, from 2004 to 2006 and, prior to that, was an associate at Houlihan Lokey, an investment bank, SunTrust Equitable Securities, an investment bank, and Arthur Andersen, an accounting firm. Mr. Saunders currently serves as an advisory board member of Insight, to which the Company serves as an agent in offering Insight's prepaid debit card products and in which the Company owns a 22.5% ownership interest. Mr. Saunders holds a B.S. in Business with Special Attainment in Accounting and Commerce from Washington & Lee University. Mr. Saunders brings extensive investment banking, finance, merger & acquisition, management, and strategic experience to our board of directors.
Kyle Hanson became our President in May 2008. Mr. Hanson served as our Director of Store Operations from August 2005 to February 2008 and then as our Vice President of Store Operations from February 2008 to May 2008. From December 1997 through July 2005, Mr. Hanson worked in various operational capacities for CheckSmart, including as a store manager and a district and regional manager. Mr. Hanson previously served on the advisory board of Insight, to which the Company serves as an agent in offering Insight's prepaid debit card products. Mr. Hanson holds a B.S. in Communications from Ohio University.
Chad Streff became our Chief Technology Officer and Chief Compliance Officer in 2011 and served as our Chief Operating Officer, Senior Vice President and Secretary from 2006 to 2010. Prior to joining CheckSmart, Mr. Streff was President of Streff and Associates, Inc. from 1992 to 2002 and was manager of IT consulting with a regional accounting firm from 1985 to 1992. Mr. Streff holds a B.S. in accounting and pre-law and a Minor in Computer Science from Ohio University.
Michael Durbin became our Chief Financial Officer and Treasurer and a Senior Vice President effective December 31, 2010. From June 2008 to December 2010, Mr. Durbin was a Managing Director at Servius Capital LP, an investment banking firm based in Atlanta, Georgia, and during that time Mr. Durbin served as Interim Chief Financial Officer of CheckSmart. From July 1995 to June 2008, Mr. Durbin was a Senior Vice President at National City Bank, located in Cleveland, Ohio, where his principal business was corporate banking with a specialization in retail and retail financial services. Mr. Durbin holds a B.S.B.A. summa cum laude from Ohio University and an M.B.A. from Fisher College of Business at The Ohio State University.
105
Bridgette Roman became our Senior Vice President and Secretary in January 2011. Ms. Roman has served as our General Counsel since October 2006. Before Ms. Roman became our Senior Vice President and Secretary, Ms. Roman served as our Vice President and Assistant Secretary from June 2008 to December 2010. Prior to joining CheckSmart in October 2006, Ms. Roman was Senior Corporate Counsel at Cooper Tire & Rubber Company, a global tire manufacturer. From 1995 to 2004, Ms. Roman was a litigation partner with the law firm of Schottenstein, Zox & Dunn and from 1988 to 1995 was an associate with the same firm. Ms. Roman holds a B.A. in Political Science from The Ohio State University and a J.D. from Duquesne University, School of Law.
H. Eugene Lockhart became a director in May 2006. Beginning in 2005, Mr. Lockhart served as Chairman of Diamond Castle's Financial Institutions Investment practice until April 2011. Before joining Diamond Castle in 2005 as Chairman of its Financial Institutions Investment practice, Mr. Lockhart became Venture Partner for Oak Investment Partners, a venture capital firm. Mr. Lockhart has worked in a senior executive role at several organizations, including from 1993 to 1997 as President and Chief Executive Officer of MasterCard International, as Chief Executive Officer of Midland Bank plc (from 1986 to 1993), as President of the Global Retail Bank of Bank of America (from 1997 to 1999) and as President of Consumer Services at AT&T. Mr. Lockhart was, until January 2010, also Chairman of NetSpend Corporation and is Chairman of Argus Information and Advisory Services LLC. He is also a director of Vesta Corporation, IMS Health Inc., RadioShack Corp., Huron Consulting Group Inc. and Asset Acceptance Corp. Mr. Lockhart is a former Director of RJR Nabisco Holdings, First Republic Bank and LendingTree, Inc. Mr. Lockhart holds a B.S. from the University of Virginia and an M.B.A. from The Darden School at the University of Virginia. Mr. Lockhart has held many significant positions in the financial services industry, has experience on public company audit and compliance committees, and brings extensive expertise in strategic planning to our board of directors.
Andrew Rush became a director in May 2006. Mr. Rush has many years of experience as a private equity investor. Mr. Rush is a co-founder and Senior Managing Director at Diamond Castle, a position he has held since 2004. Before serving as a Senior Managing Director at Diamond Castle, Mr. Rush was a Managing Director for DLJ Merchant Banking Partners, which he joined in 1989. Mr. Rush is a Director of Alterra Capital Holdings, Limited and Suture Express, Inc. and a former Director of AXIS Capital Holdings Limited, Nextel Partners, Inc., neuf telecom S.A. and several other companies. Mr. Rush holds a B.A., magna cum laude, from Wesleyan University, a J.D., cum laude, from the University of Pennsylvania and an M.B.A. with distinction from The Wharton School of the University of Pennsylvania. Because Mr. Rush has extensive experience in investing in financial services companies and has served on many corporate boards, we believe he brings significant and valuable experience to our board of directors.
Lee A. Wright became a director in May 2006. Mr. Wright is also a Senior Managing Director at Diamond Castle, which he joined in 2005. From 2000 to 2005, Mr. Wright was a Director at DLJ Merchant Banking Partners, a private equity firm. Mr. Wright previously worked at CSFB Private Equity (1996 to 2000) as a Vice President and Associate and was an analyst in CSFB's Investment Banking division (1994 to 1996). Mr. Wright is a Director of Professional Directional Holdings, Inc. (since 2010) and Adhesion Holdings, Inc. (since 2008) and a former Director of U.S. Express Leasing, Inc. and Frontier Drilling ASA. Mr. Wright holds a B.S., magna cum laude, from Washington & Lee University. Mr. Wright has an extensive history of investing in financial services companies and brings significant experience to our board of directors.
David M. Wittels became a director in November 2010. Mr. Wittels is also a Senior Managing Director at Diamond Castle, a position Mr. Wittels has held since 2004. Before serving as Senior Managing Director, Mr. Wittels was a Managing Director for DLJ Merchant Banking Partners, which he joined in 1986. Mr. Wittels is a former Chairman of the Board of Arcade Holding Corp. (from 1999 to 2004) and a former Director of several companies, including Wilson Greatbatch Technologies, Inc. (1997 to 2002), Katz Media Group Inc. (1994 to 1997), Mueller Group Inc. (1999 to 2004), Advanstar
106
Holdings Corp. (2000 to 2004), Jostens Inc. (2003 to 2004), Ziff Davis Holdings, Inc (2000 to 2006). Mr. Wittels holds a B.S., summa cum laude, from The Wharton School of the University of Pennsylvania. Mr. Wittels' knowledge of investment management and his public company experience bring valuable skills to our board of directors.
Michael Langer became a director in May 2006. Mr. Langer is also a Principal at Diamond Castle, which he joined in 2005. Prior to joining Diamond Castle, Mr. Langer worked at DLJ Merchant Banking Partners and, prior to that, was an Associate at Leonard Green & Partners and an Analyst in the Investment Banking division at Deutsche Bank from 1998 to 2000. Since 2007, Mr. Langer has been a Director of Managed Health Care Associates, Inc. and Suture Express, Inc. Mr. Langer is also a steering committee member of the New York City Chapter of the Milken Institute Young Leader's Circle. Mr. Langer holds a B.S., magna cum laude from Boston College, where he graduated Beta Gamma Sigma, and an M.B.A. with Honors from The Wharton School of the University of Pennsylvania. Mr. Langer brings significant investment banking and business analytic experience to our board of directors.
Felix Lo became a director in April 2011. Mr. Lo is also a Principal at Golden Gate Capital, a private equity firm which he joined in 2004. From 2003 to 2004, Mr. Lo was an investment professional at Bain Capital, a private investment firm, and, prior to that, was a consultant at Bain & Company (from 2001 to 2003). Mr. Lo also serves as a director of Lantiq Holdco Sarl, which he joined in 2010, and Vistec Semiconductor Systems Holdings Ltd., which he joined in 2010. Mr. Lo holds an A.B. in Public Policy from Brown University. Mr. Lo's extensive history of investing in a broad range of growth companies brings valuable strategic experience to our board of directors.
Eugene R. Schutt became a director in February 2012. Since 2009, Mr. Schutt has served as Associate Dean of Development in the College and Graduate School of Arts & Sciences at the University of Virginia. Prior to joining the University of Virginia, Mr. Schutt had more than 30 years of business experience in financial services, most recently as Chairman, President and Chief Executive Officer of Citicorp Trust Bank, a Citigroup company. From 1992 until 1999, he was president of Avco Financial Services Inc., a branch-based multi-national consumer finance enterprise and from 1984 until 1991, he was president of Pratt Industries Inc. He began his career with the Philadelphia National Bank and spent nearly a decade managing two Asia/Pacific subsidiaries. Mr. Schutt is a 20-year member of the World Presidents' Organization and has served on the boards of the American Financial Services Association and the Financial Services Roundtable's Housing Policy Council. He holds a B.A. in Economics from the University of Virginia. Mr. Schutt's extensive background in consumer financial services and his significant leadership experience bring valuable expertise to our board of directors.
Director Independence
Our board of directors has determined that each of Mr. Lockhart and Mr. Schutt is an "independent" director within the meaning of the applicable rules of the SEC and the Nasdaq Marketplace Rules.
Board Committees
On July 29, 2011, our board of directors created the following standing committees: the Audit Committee, the Compensation Committee, and the Nominating and Corporate Governance Committee. These committees are described below. We intend to comply with the requirements of the Sarbanes-Oxley Act and the Nasdaq Marketplace Rules, which require that a majority of the directors on each of our Audit Committee, Compensation Committee and Nominating and Governance Committee will be independent within 90 days of the date of this prospectus, and all of whom will be independent within one year of the date of this prospectus.
107
Audit Committee
Our Audit Committee is expected to consist of Mr. Lockhart, as Chairman, and Messrs. Schutt and Wright as of the consummation of this offering. The Audit Committee, among other things, will oversee our accounting practices and processes, system of internal controls, independent auditor relationships, financial statement audits and audit and financial reporting processes. The members of our Audit Committee are expected to be independent within the meaning of the Nasdaq Marketplace Rules within the timeframes required by such rules and listing standards. Each of the committee members is financially literate within the requirements of the Nasdaq Marketplace Rules and Mr. Lockhart is an audit committee financial expert within the meaning of the applicable rules of the SEC.
Compensation Committee
Our Compensation Committee is expected to consist of Mr. Lockhart, as Chairman, and Messrs. Schutt and Wright as of the consummation of this offering. Our Compensation Committee reviews and recommends policy relating to compensation and benefits of our directors and executive officers, including evaluating executive officer performance, reviewing and approving executive officer compensation, reviewing director compensation, making recommendations to our board of directors with respect to the approval, adoption and amendment of incentive compensation plans, administering equity-based incentive compensation and other plans and reviewing executive officer employment agreements and severance arrangements. The members of our Compensation Committee are expected to be independent within the meaning of the Nasdaq Marketplace Rules within the timeframes required by such rules.
Nominating and Governance Committee
Our Nominating and Governance committee is expected to consist of Mr. Lockhart, as Chairman, and Messrs. Saunders and Schutt as of the consummation of this offering. The Nominating and Governance committee's responsibilities include, among other things (a) responsibility for establishing our corporate governance guidelines, (b) overseeing our board of director's operations and effectiveness and (c) identifying, screening and recommending qualified candidates to serve on our board of directors. The members of our Nominating and Governance Committee are expected to be independent within the meaning of the Nasdaq Marketplace Rules within the timeframes required by such rules.
Compensation Committee Interlocks and Insider Participation
Our Compensation Committee is expected to consist of Mr. Lockhart, as Chairman, and Messrs. Schutt and Wright as of the consummation of this offering. None of these individuals has ever been an officer or employee of ours or any of our subsidiaries. None of our executive officers serves or have served as a member of the compensation committee or other board committee performing equivalent functions of any entity that has one or more executive officers serving as one of our directors or on our Compensation Committee. During 2011, Messrs. Lockhart and Wright served as the members of the Compensation Committee of CheckSmart and as the members of the CCFI Compensation Committee. Neither of Messrs. Lockhart and Wright was ever an officer or employee of either CheckSmart or CCFI or had any related person transactions with either CheckSmart or CCFI, and there were no relationships described under Item 407(e)(4)(iii) of Regulation S-K that existed during 2011.
Code of Ethics
Prior to the consummation of this offering, we will adopt a written Code of Business Conduct and Ethics applicable to all officers, other employees and directors that will become effective upon completion of this offering. We intend to post the full text of our Code of Business Conduct and Ethics
108
on our website at www.ccfi.com promptly following the completion of this offering. We intend to disclose future amendments to certain provisions of our Code of Business Conduct and Ethics or waivers of such provisions applicable to any director, principal executive officer, principal financial officer, principal accounting officer or controller, or persons performing similar functions, on our website identified above. The information on or accessible through our website is not a part of this prospectus.
Corporate Governance Guidelines
Prior to the consummation of this offering, we will adopt Corporate Governance Guidelines to assist us with the proper management and governance of the activities of our board of directors. A complete copy of the Corporate Governance Guidelines will be available prior to the consummation of this offering on our website at www.ccfi.com. Our Corporate Governance Guidelines are expected to cover, among other topics:
- •
- director independence;
- •
- board structure and composition;
- •
- board member nomination and eligibility requirements;
- •
- board leadership and executive sessions;
- •
- limitations on other board and committee service;
- •
- committees of the board;
- •
- director responsibilities;
- •
- board and committee resources, including access to officers and employees;
- •
- director compensation;
- •
- director orientation and ongoing education;
- •
- succession planning; and
- •
- board and committee self evaluations.
Review and Approval of Related-Party Transactions
Following the consummation of this offering, our Audit Committee will be responsible for the review and approval of all related-party transactions required to be disclosed to the public under SEC rules. This procedure will be contained in the written charter of our Audit Committee. In addition, we will maintain a written Code of Ethics that will require all employees, including our officers, to disclose to the Audit Committee any material relationship or transaction that could reasonably be expected to give rise to a personal conflict of interest. Related-party transactions will be reviewed and approved by the Audit Committee on a case-by-case basis.
Compensation Discussion and Analysis
This Compensation Discussion and Analysis discusses the material aspects of the compensation program that applied to our executive team for 2011. This discussion includes a description of the principles underlying our executive compensation policies and our most important executive compensation decisions for 2011, and provides our analysis of those policies and decisions. This Compensation Discussion and Analysis also gives perspective to the information we present in the compensation tables and related footnotes and narratives below. We have also provided certain information about how we expect our executive compensation program to operate following this
109
offering. All stock amounts described in this Compensation Discussion and Analysis and the following compensation tables, footnotes and narratives reflect our May 2012 six-for-one stock split.
As more fully described below, the Compensation Committee currently makes, and will continue to make, all compensation decisions for CCFI's executive officers, including the following executive officers named in the 2011 Summary Compensation Table below, which officers we refer to as the named executive officers:
- •
- William E. Saunders, Jr.—Chief Executive Officer;
- •
- Kyle F. Hanson—President;
- •
- Chad M. Streff—Senior Vice President, Chief Compliance Officer and Chief Technology Officer;
- •
- Michael Durbin—Senior Vice President, Chief Financial Officer and Treasurer; and
- •
- Bridgette C. Roman—Senior Vice President, General Counsel and Secretary.
Prior to the formation of CCFI on April 6, 2011, the Compensation Committee of CheckSmart Financial Holdings Corporation, which we refer to as the CheckSmart Committee, made the executive compensation decisions for the named executive officers. After CCFI was formed, CCFI's board of directors made executive compensation decisions for the named executive officers until July 29, 2011, when CCFI's board of directors formally appointed the Compensation Committee. The actual payment of compensation for 2011 was made by, and the payment of compensation for 2012 and beyond is expected to be made by, CheckSmart Financial LLC, an indirect subsidiary of CCFI.
Executive Summary
Company Background
We are a leading retailer of alternative financial services to unbanked and underbanked consumers through a network of retail stores across 14 states. We focus on providing a wide range of convenient consumer financial products and services to help customers manage their day-to-day financial needs, including short-term consumer loans, medium-term loans, title loans, check cashing, prepaid debit cards, money transfers, bill payments and money orders. Although the majority of our customers have banking relationships, we believe that our customers use our financial services because they are convenient, easy to understand, and in many instances, more affordable than available alternatives.
We strive to provide customers with unparalleled customer service in a safe, clean and welcoming environment. Our stores are located in highly visible, accessible locations that allow customers convenient and immediate access to our services. Our professional work environment combines high employee performance standards, incentive-based pay and a wide array of training programs to incentivize our employees to provide superior customer service. We believe that this approach has enabled us to build strong customer loyalty, putting us in a position to expand and continue to capitalize on our innovative product offerings.
On April 29, 2011, we acquired CCCS, an alternative financial services business with similar product offerings as our predecessor, CheckSmart. CheckSmart, together with CCCS and certain other parties, executed an agreement and plan of merger, under which CCFI, a newly formed holding company, acquired all outstanding shares of both CheckSmart and CCCS. CheckSmart is our predecessor for accounting purposes and for compensation disclosure purposes.
110
Key 2011 Compensation Decisions and Actions
The following is a summary of our key compensation decisions and actions for 2011:
- •
- We established base salary levels consistent with increased performance expectations related to significant 2011
transaction activity, including, but not limited to, a merger, a bond offering and the filing of the company's Registration Statement on Form S-1;
- •
- We paid special discretionary bonuses to our named executive officers to recognize their individual efforts for 2011,
including helping close a merger and a bond offering;
- •
- We paid each of our named executive officers a portion of a cash retention bonus opportunity that was earned based on
personal achievement of qualitative performance goals with the aim of helping us retain these critical officers as our business continued to restructure and transform;
- •
- Each of our named executive officers was awarded a portion of his or her target annual cash bonus opportunity based on the
Compensation Committee's subjective evaluation of company and individual 2011 performance, as well as our achievement of our EBITDA performance goal at 115.3% of target; and
- •
- We did not award any equity incentive compensation to any of our named executive officers during 2011, but our outstanding equity awards were automatically adjusted as a result of our April 2011 merger transaction.
Executive Compensation Philosophy & Objectives
Beginning in July 2011, the Compensation Committee became responsible for establishing and administering our policies governing the compensation for our named executive officers. The Compensation Committee is composed entirely of non-employee directors.
The Compensation Committee believes that named executive officer compensation packages should incorporate an appropriate balance of fixed versus variable compensation—as well as cash-based compensation versus share-based compensation—and reward performance that is measured against established goals that correspond to our short-term and long-term business plan and objectives. CCFI's ongoing named executive officer compensation program is designed to achieve the following objectives:
- •
- Attract and retain talented and experienced executives in the highly competitive and dynamic financial services industry;
- •
- Motivate and reward executives whose knowledge, skills and performance are critical to our success;
- •
- Align the interests of our executives and shareholders by motivating executives to increase shareholder value and
rewarding executives when shareholder value increases, but doing so in a manner that does not encourage executives to take unreasonable risks that could threaten our viability;
- •
- Provide a competitive compensation package that emphasizes pay for performance, and in which total compensation is
primarily determined by company and individual results and the creation of shareholder value;
- •
- Ensure fairness among the named executive officers by recognizing the relative contributions each executive makes to our
success;
- •
- Foster a shared commitment among executives by coordinating their company and individual goals;
and
- •
- Compensate our executives to manage our business to meet our long-range objectives.
111
The CheckSmart Committee was motivated by this same philosophy and these same objectives when making compensation decisions prior to CCFI's formation and the Compensation Committee's assumption of its responsibilities.
Our Compensation Practices
The Compensation Committee meets outside the presence of all of our executive officers, including the named executive officers, to consider appropriate compensation for our Chief Executive Officer, whom we refer to as our CEO. The Compensation Committee is expected to analyze annually our CEO's performance and determine his base salary, annual cash bonuses and long-term equity incentive awards based on its assessment of his performance. For compensation decisions regarding all other named executive officers, the Compensation Committee meets outside the presence of all executive officers except our CEO. The Compensation Committee engaged Frederic W. Cook & Co., Inc. ("Cook") as a compensation consultant for approximately three weeks during August 2011, but discontinued this relationship in search of a consultant that would have a better fit with the Compensation Committee. Cook's brief engagement by the Compensation Committee had no material impact on our executive compensation either for 2011 or 2012. The Compensation Committee engaged Meridian Compensation Partners, LLC later in 2011, but their advice and assistance was limited to development of our 2012 compensation program, including 2012 equity grants.
Our CEO is expected to review annually each other named executive officer's performance with the Compensation Committee and make recommendations to the Compensation Committee with respect to the appropriate base salary, annual cash bonuses and the grants of long-term equity incentive awards for all executive officers, excluding himself. Based on these recommendations from our CEO and the other considerations discussed below, the Compensation Committee reviews and approves the annual compensation packages of our executive officers other than our CEO.
The annual performance reviews of our executive officers will be considered by the Compensation Committee when making decisions on setting base salaries, cash bonuses and grants of long-term equity incentive awards. When making decisions on setting base salaries, cash bonuses and initial grants of long-term equity incentive awards for new executive officers, the Compensation Committee is expected to consider the importance of the position to us, the past salary history of the executive officer and the contributions to be made by the executive officer to us. For 2011 compensation decisions, the CheckSmart Committee and the Compensation Committee used this process and these same inputs for considering and setting compensation for our named executive officers, which resulted in the named executive officers earning the following distribution of fixed and variable compensation:
Named Executive Officer
|
% Fixed Compensation | % Variable Compensation | |||||
|---|---|---|---|---|---|---|---|
Mr. Saunders |
19.7 | 80.3 | |||||
Mr. Durbin |
50.8 | 49.2 | |||||
Mr. Hanson |
30.6 | 69.4 | |||||
Mr. Streff |
31.7 | 68.3 | |||||
Ms. Roman |
35.4 | 64.6 | |||||
The CheckSmart Committee used, for the period prior to April 29, 2011, and the Compensation Committee has used since April 29, 2011, and expects to use going forward, the following principles to guide specific decisions regarding executive compensation:
Provide compensation opportunities that are competitive in the marketplace.
To attract and retain executives with the ability and the experience necessary to lead us and deliver strong performance to our shareholders, we strive to provide a total compensation package that is competitive with total compensation provided by other private and public companies in our industry. In 2011, we did not specifically benchmark our compensation levels against a defined peer group.
112
However, we do consider competitive market pay data to be relevant to our compensation decisions, as it allows our decision-makers to obtain a general understanding of current compensation practices. To this end, our management team gathered competitive market compensation information from the following sources:
- •
- Data in proxy statements and other filings from public financial services companies that we believe are comparable to us
based on revenue (ranging from $188 million to $1.3 billion) and market capitalization (ranging from $65 million to $1.6 billion). To provide context, our 2011 revenue was
$306.9 million;
- •
- Informal reviews of comparably sized public and private companies (measured generally by the revenue and market
capitalization ranges described above); and
- •
- Informal reviews of salaries posted on executive search websites.
We utilize this data not to base, justify or establish particular compensation levels, but rather to assess the overall competitiveness of our compensation packages. Our goal is to ensure that our executives are compensated at levels that are generally commensurate to what they could achieve at similarly situated companies in our industry and in comparable executive positions in other industries. For each executive officer, we consider this general understanding in concert with the following more important factors:
- •
- Our business need for the executive's skills;
- •
- The contributions that the executive has made or we believe will make to our success;
- •
- The transferability of the executive's managerial skills to other potential employers;
- •
- The relevance of the executive's experience to other potential employers, particularly in the payments industry;
and
- •
- The readiness of the executive to assume a more significant role with another potential employer.
Require performance goals to be achieved in order for each named executive officer's target incentive pay level to be earned.
Our named executive officer compensation program emphasizes pay for performance, which to us means paying performance-based compensation to reward the achievement of financial and strategic goals that enhance shareholder value. Performance is measured based on achievement of company and individual executive performance goals. The performance goals for the company are established by our board of directors, and individual performance measures are established by the Compensation Committee (and by our CEO in the case of each named executive officer other than the CEO) so that achievement of the goals is not assured for a given year. Achieving pay for performance therefore requires strong company performance and significant individual performance effort on the part of our executives.
Offer comprehensive benefits package to all full-time employees.
We provide a competitive benefits package to all full-time employees, which package includes health and welfare benefits, such as medical, dental, vision care, disability insurance, life insurance benefits, and potential participation in a 401(k) savings plan. These benefits are provided to support our employees' basic health and welfare needs and to provide them with tax efficient ways to save cash compensation for retirement.
113
Provide fair and equitable compensation.
We provide a total compensation program that we believe is and will be perceived by both our executives and our shareholders as fair and equitable. In addition to using market pay information to develop a general understanding of current compensation practices and considering individual circumstances related to each executive, we also consider the pay of each named executive officer relative to each other named executive officer and relative to other members of our management team. We have designed the total compensation programs for our named executive officers to be consistent with those for our executive management team as a whole.
For 2011, in addition to the principles described above, the CheckSmart Committee and the Compensation Committee utilized performance-based retention bonuses to help retain our named executive officers during the ongoing transformation of our business model, which is described above under "Prospectus Summary—Growth Strategy." These retention bonuses were also tied to the named executive officers' performance. We emphasized our pay for performance philosophy by measuring performance for these retention bonuses based on achievement of certain qualitative milestones by each named executive officer that were structured so that their achievement of the milestones was not assured for 2011. We also provided our named executive officers with annual cash bonus opportunities based on the Compensation Committee's subjective evaluation of 2011 company and individual performance, including our achievement of our 2011 EBITDA target. Both the retention bonuses and the annual cash bonuses are described further below.
Analysis of 2011 Executive Compensation Decisions and Actions
For the fiscal year ended December 31, 2011, the total compensation opportunity for our named executive officers was comprised of the following components:
- •
- base salary;
- •
- one or more discretionary bonuses;
- •
- performance-based retention bonuses and annual cash bonuses; and
- •
- retirement & health savings contributions through the 401(k) plan and health savings accounts and executive perquisites.
2011 Base Salary
A clear objective of our executive compensation program has been, and is, to pay a base salary that is competitive (based on a general understanding of the data and survey elements discussed above) and geared toward retaining our named executive officers. The 2011 base salaries of the named executive officers were set in light of their employment agreements with us. Although these base salaries were mutually agreed upon by the named executive officers and by us, the base salary amounts were, in each case, primarily determined based on the CheckSmart Committee's review of the named executive officers' job responsibilities and historical individual contributions to the company, with particular scrutiny given to overall company financial performance during the prior year, the individuals' performance during the prior year and the individuals' expected goals and objectives for the current year.
Our named executive officers' employment agreements set forth their 2011 base salaries. Mr. Durbin, however, did not enter into an employment agreement until January 1, 2011, the day after he became one of our employees. Mr. Durbin had previously served the company in a consultant capacity. His transition to full-time employment accounts for the sizeable increase in his base salary from 2010 to 2011. To determine 2011 base salaries, the CheckSmart Committee and board of directors reviewed the accomplishments and contributions made by the CEO. In addition, the CEO reviewed with the CheckSmart Committee the accomplishments and contributions made by each of the named executive officers under his direct and indirect supervision and provided his proposed base salary changes. After discussing the performance of each named executive officer and reviewing the recommendations made by the Executive Chairman and the CEO, and based upon the CheckSmart
114
Committee's individual review and analysis of the competitive market compensation information described above as a check on its salary decisions, the CheckSmart Committee approved the following base salary changes (or new base salary for Mr. Durbin) for 2011:
Named Executive Officer
|
2010 Base Salary | 2011 Base Salary | % Increase | |||||||
|---|---|---|---|---|---|---|---|---|---|---|
Mr. Saunders |
$ | 500,000 | $ | 600,000 | 20.0 | % | ||||
Mr. Durbin |
$ | 175,000 | $ | 375,000 | 114.3 | % | ||||
Mr. Hanson |
$ | 350,000 | $ | 450,000 | 28.5 | % | ||||
Mr. Streff |
$ | 330,000 | $ | 375,000 | 13.6 | % | ||||
Ms. Roman |
$ | 220,000 | $ | 275,000 | 25.0 | % | ||||
We expect that the Compensation Committee will determine future base salaries for our named executive officers in December of each year based on its review of job responsibilities and individual contributions during the prior year, with particular reference to the following considerations:
- •
- overall company financial performance during the prior year;
- •
- the individual performance of each named executive officer during the prior year;
- •
- the individual goals and objectives for each named executive officer for the current year; and
- •
- if relevant, compensation paid by a previous employer.
For 2012, the Compensation Committee established the following base salaries for the named executive officers:
Named Executive Officer
|
2011 Base Salary | 2012 Base Salary | % Increase | |||||||
|---|---|---|---|---|---|---|---|---|---|---|
Mr. Saunders |
$ | 600,000 | $ | 650,000 | 8.3 | % | ||||
Mr. Durbin |
$ | 375,000 | $ | 375,000 | 0.0 | % | ||||
Mr. Hanson |
$ | 450,000 | $ | 450,000 | 0.0 | % | ||||
Mr. Streff |
$ | 375,000 | $ | 375,000 | 0.0 | % | ||||
Ms. Roman |
$ | 275,000 | $ | 275,000 | 0.0 | % | ||||
Special Discretionary Bonuses
During 2011, the Compensation Committee awarded our named executive officers certain special discretionary bonuses to recognize their efforts in helping close the April 2011 merger in which we acquired CCCS and formed CCFI. These bonuses were also awarded in recognition of our named executive officers' efforts in completing our 2011 bond offering. The Compensation Committee determined the specific amount of each named executive officer's discretionary bonus based on its subjective determination of the officer's contribution in connection with the merger and the bond offering. In addition, Ms. Roman received a discretionary bonus of $18,750 upon the commencement of her employment agreement in April 2011. The following special discretionary bonuses were awarded and paid in 2011.
Named Executive Officer
|
Special Discretionary Bonus | |||
|---|---|---|---|---|
Mr. Saunders |
$ | 2,105,623 | ||
Mr. Durbin |
$ | 250,000 | ||
Mr. Hanson |
$ | 1,002,370 | ||
Mr. Streff |
$ | 776,039 | ||
Ms. Roman |
$ | 394,379 | ||
Performance-Based Retention Bonuses
Our named executive officers were eligible to earn two different types of cash bonus compensation for 2011. We refer to the first type as a retention bonus. This award was provided by us to help retain our named executive officers as our business continued to restructure and transform and to incentivize the named executive officers to achieve pre-established and broad-based qualitative performance goals, which we refer to as their milestones. Under these awards, each of the named executive officers (except
115
for Ms. Roman) was eligible to receive his retention bonus opportunity, payable in four equal cash installments on each of March 31, June 30, September 30 and December 31, 2011 if he remained our employee on the relevant date and achieved his milestones, as determined prior to each payout. Ms. Roman, under her employment agreement, received a payment of $18,750 at the time of commencement of her employment agreement; she was eligible to receive her retention bonus opportunity, payable in three equal cash installments on each of June 30, September 30 and December 30, 2011 if she remained our employee on the relevant date and achieved her milestones, as determined prior to each payout. For 2011, the retention bonus opportunities were equal to the following amounts, which were negotiated at arm's length between us and the named executive officers when entering into their employment agreements:
Named Executive Officer
|
2011 Retention Bonus | |||
|---|---|---|---|---|
Mr. Saunders |
$ | 400,000 | ||
Mr. Durbin |
$ | 100,000 | ||
Mr. Hanson |
$ | 100,000 | ||
Mr. Streff |
$ | 100,000 | ||
Ms. Roman |
$ | 56,250 | ||
The CheckSmart Committee communicated the applicable milestones to each named executive officers in his or her employment agreement. The milestones were specifically designed by the Compensation Committee to be broad based and qualitative achievements rather than narrows quantitative objectives. The following chart describes the milestones upon which the retention bonuses were based for each of the named executive officers for 2011:
Named Executive Officer
|
2011 Milestones for Retention Bonuses | |
|---|---|---|
| Mr. Saunders | • Leadership in new product development |
|
| Mr. Durbin | • Finance and accounting achievements
|
|
| Mr. Hanson | • Departmental and employee oversight achievements
|
|
| Mr. Streff | • Information technology achievements
|
116
Named Executive Officer
|
2011 Milestones for Retention Bonuses | |
|---|---|---|
| Ms. Roman | • Legal, compliance and corporate governance achievements
|
To determine payouts for the 2011 performance-based retention bonuses, the Compensation Committee subjectively evaluated the degree to which each of the named executive officers had achieved his or her milestones as of each of March 31, June 30, September 30 and December 31, 2011 (or as of June 30, September 30 and December 30, 2011, in the case of Ms. Roman). As of each of these dates, the Compensation Committee subjectively determined whether the named executive officer had performed through that measurement date in a sufficient manner to earn the available portion of the performance-based retention bonus. Bonuses were earned by each named executive officer for the first, second and fourth quarters of 2011, as determined by the Compensation Committee, for achievement of their milestones. The amounts actually earned by the named executive officers for 2011 under their retention bonuses are included in the 2011 Summary Compensation Table below under the "Non-Equity Incentive Plan Compensation" column.
Named Executive Officer
|
Actual 2011 Retention Bonus Payout | |||
|---|---|---|---|---|
Mr. Saunders |
$ | 300,000 | ||
Mr. Durbin |
$ | 75,000 | ||
Mr. Hanson |
$ | 75,000 | ||
Mr. Streff |
$ | 75,000 | ||
Ms. Roman |
$ | 37,500 | ||
Annual Cash Bonuses
In late 2010, the CheckSmart Committee, in consultation with our board of directors, approved an annual cash bonus program for the CEO and the other named executive officers, which program was incorporated into each of the named executive officers' employment agreements for 2011 based on arm's length negotiations of target award amounts. This was our second type of cash bonus compensation for 2011. These annual cash bonus opportunities were intended to provide a financial incentive to executives at the senior vice president level and above to drive long-term growth and recurring profitability for the company. Payout of an annual cash bonus was determined on a subjective, discretionary basis by the Compensation Committee after 2011 based on its evaluation of 2011 performance, and required each named executive officer to be employed by us at the time of payout in 2012.
Under our 2011 annual cash bonus program, each of the named executive officers were assigned the following target annual cash bonus opportunities based on the terms of their applicable 2011 employment agreement:
Named Executive Officer
|
Target 2011 Annual Cash Bonus | 2011 Annual Cash Bonus Payout | |||||
|---|---|---|---|---|---|---|---|
Mr. Saunders |
$ | 300,000 | $ | 300,000 | |||
Mr. Durbin |
$ | 125,000 | $ | 50,000 | |||
Mr. Hanson |
$ | 175,000 | $ | 200,000 | |||
Mr. Streff |
$ | 125,000 | $ | 50,000 | |||
Ms. Roman |
$ | 75,000 | $ | 43,750 | |||
Payout of the annual cash bonuses was determined by the Compensation Committee's subjective determination of 2011 performance, including our achievement of an EBITDA performance target set
117
by the CheckSmart Committee for 2011 and each officer's personal contributions to our business for 2011, as evaluated by the Compensation Committee. Fees paid by us pursuant to an advisory services agreement entered into by CheckSmart in 2006 were deducted in calculating net income for purposes of the EBITDA calculation. The EBITDA performance target was chosen by the CheckSmart Committee because it subjectively determined that this performance metric was an appropriate measure of overall corporate performance for a company of our size and in a growth mode similar to ours during 2011. For 2011, the performance target was $75.8 million. Actual performance against the target was $86.8 million, which resulted in our achievement of this goal. The Compensation Committee also determined to pay Mr. Hanson an additional $25,000 above his target annual bonus opportunity as a result of their evaluation that Mr. Hanson had taken on a larger amount of responsibility in his position for 2011 and had performed above expectation for 2011, and due to his personal contribution to the success of completing the April 2011 merger.
The Compensation Committee reviewed and approved the final annual cash bonus payouts in February 2012.
The annual cash bonuses paid to the named executive officers for 2011 are set forth below in the 2011 Summary Compensation Table under the "Bonus" column. We believe that the annual cash bonuses actually paid to the named executive officers for 2011 achieved our executive compensation objectives, compare favorably to the cash bonuses paid by other financial services companies and were consistent with our emphasis on pay for performance.
For 2012, the Compensation Committee has developed a new annual cash incentive program to replace the quarterly retention bonuses and the 2011 annual cash bonus program described above. We expect to discuss this new annual cash incentive program more in subsequent SEC filings once this offering is complete.
Long-Term Equity Incentive Compensation
Our long-term equity incentive compensation has historically been in the form of either stock options to acquire our common shares or stock appreciation rights. The value of both the stock options and stock appreciation rights awarded are dependent upon the value of our common shares. The Compensation Committee and management believe that, given our stage of development, stock options and stock appreciation rights are the appropriate primary vehicle to provide long-term incentive compensation to the named executive officers. Other types of long-term equity incentive awards may be considered in the future as a market for our common shares develops and our business strategy evolves.
In past years, long-term equity incentive awards have been periodically awarded to executives, including the named executive officers, as part of their total compensation package. The CheckSmart Committee historically considered these awards to be consistent with our pay-for-performance principles and a useful method of aligning the interests of the executives with the interests of our shareholders. Except for one grant of stock options to Mr. Durbin on December 31, 2010, we have not granted long-term equity incentive awards since December 31, 2008 due to our primary focus on retention efforts and short-term business stability.
In November 2011, the Compensation Committee recommended, and in February 2012, the board of directors approved the following equity awards under the 2011 Plan for our named executive officers (giving effect to our May 2012 six-for-one stock split): Mr. Saunders, stock options for 86,454 shares and 14,400 restricted stock units; Mr. Durbin, stock options for 31,962 shares and 5,346 restricted stock units; Mr. Hanson, stock options for 60,162 shares and 10,038 restricted stock units; Mr. Streff, stock options for 31,962 shares and 5,346 restricted stock units; and Ms. Roman, stock options for 35,070 shares. These stock options were granted with an exercise price of $19.95 per share and generally vest ratably in equal one-third increments over the first three years following the grant date, or upon the officer's termination without cause or for good reason in connection with a change in control (as such terms are defined in the applicable option award agreement). These restricted stock units will be settled in shares and generally vest in three equal annual installments beginning on February 14, 2013 if
118
the officer remains continuously employed by us or one of our subsidiaries through each such vesting date.
In April 2012, our board of directors determined that the exercise price of $19.95 per share for the February 2012 grants of stock options to our named executive officers had been established at a level that was significantly greater than the fair market value of our common shares as of the date of grant, based on the independent valuation that was performed by a third-party valuation firm in connection with this offering. In order to preserve the long-term incentive value of these stock option grants, the Compensation Committee and our board of directors determined to lower the exercise price for these stock options to $ per share, which is the initial public offering price per share for our common shares in this offering, effective on the date on which the initial public offering price for this offering was determined. This repricing was conditioned on this offering being consummated within 10 business days after such date and no later than December 31, 2012. Holders of these stock options were not required to consent to this repricing, as the repricing was not adverse to their interests. In taking this action, the Compensation Committee and our board of directors determined that the new exercise price for these stock options represented the fair market value of our common shares as of the date of this prospectus.
The award of future equity awards will be made based upon the Compensation Committee's review and recommendation to the board of directors of the amount of each award to be granted to each named executive officer and the board of director's approval of each award. Long-term equity incentive awards have historically been made pursuant to our 2006 Management Equity Incentive Plan, which has been amended and restated as our 2011 Management Equity Incentive Plan, which we refer to as the 2011 Plan.
We expect that any future long-term equity incentive grants to the named executive officers will be made pursuant to the 2011 Plan and will generally fall into two categories: time-based option and stock appreciation rights and performance-based option and stock appreciation rights, as further described below:
- •
- Time-based stock option and stock appreciation rights will be
earned on the basis of continued service to us and will generally vest over three years. We believe this retention period will be adequate for these types of awards.
- •
- Performance-based stock option and stock appreciation rights will be
earned on the basis of the company reaching certain annual targets based on EBITDA. We believe this performance metric is appropriate for measuring the overall corporate performance of a company of
our size and in a growth mode similar to ours.
- •
- Other Vesting Triggers may include a change in control.
As of March 28, 2012, giving effect to our May 2012 six-for-one stock split, 2,941,746 shares of common stock had been authorized and reserved for issuance under the 2011 Plan. As of March 28, 2012, also giving effect to our May 2012 six-for-one stock split, awards covering 1,612,128 shares had been granted under the 2011 Plan and 1,329,618 shares of common stock were available for award purposes.
Stock options are expected to provide the named executive officers with the right to purchase our common shares at a fixed exercise price under the 2011 Plan. Stock appreciation rights are expected to provide the named executive officers with the right to receive the spread between a fixed base price for the award and the fair market value of our common shares at the time of exercise. Except as described above regarding the February 2012 awards, the exercise price for each stock option and the base price for each stock appreciation right granted prior to this offering was based on the fair market value of our common shares on or near the grant date as determined by our board of directors in consultation with a valuation consultant. Following our initial public offering, any options granted are expected to have an exercise price equal to the fair market value of our common shares on the date of grant, and any stock appreciation rights granted are expected to have a base price equal to the fair market value of our common shares on the date of grant, in each case, where the fair market value is expected to be
119
the closing market price of one of our common shares as reported by the applicable national stock exchange or quotation system on which the shares may be listed or quoted on the date of grant.
The determination of the number of stock options or other awards to be granted to a named executive officer in the future is expected to be made based on performance relative to the individual's contribution to financial and strategic objectives, the individual's base salary and target bonus amount and the market pay levels for the named executive officer.
Generally, no consideration is given to a named executive officer's share holdings or previous stock options in determining the number of stock options or other awards to be granted to him or her for a particular year. The Compensation Committee believes that the named executive officers should be fairly compensated each year relative to market pay levels, as described above, and relative to our other executive officers. Moreover, we believe that a long-term incentive compensation program will further our significant emphasis on pay-for-performance compensation because executives will realize increased value from their equity awards when they achieve goals that increase shareholder value.
Other Benefits
Retirement savings opportunities
All employees, including our named executive officers and subject to certain age and length-of-service requirements, may participate in our standard tax-qualified defined contribution (401(k)) plan, which we refer to as our 401(k) Plan. Generally, each employee may make pre-tax contributions of up to 100% of their eligible earnings up to the current Internal Revenue Service annual pre-tax contribution limits. We provide the 401(k) Plan to help employees save some amount of their cash compensation for retirement in a tax efficient manner. We also make matching contributions equal to 100% of the first 3%, and 50% of the next 2%, of the eligible earnings that an employee contributes to the 401(k) Plan. We provide this matching contribution because it is a customary compensation feature that we must offer to compete for employees.
Health and welfare benefits
All full-time employees, including our named executive officers, may participate in our health and welfare benefit programs, including medical, dental and vision care coverage, health savings accounts, disability insurance and life insurance, which we offer as a customary practice to help them provide for their basic life and health needs.
Certain Executive Perquisites
For 2011, we provided our named executive officers with certain executive perquisites and personal benefits, which we use to attract and retain our executive talent. These perquisites and personal benefits included a $11,400 automobile allowance for Messrs. Saunders, Hanson, Streff and Durbin, employer matching contributions to a health savings account for Messrs. Saunders, Hanson and Durbin and Ms. Roman, rollover of accrued vacation value to a health savings account for Messrs. Saunders, Hanson and Streff, personal use of company-owned or company-leased aircraft for Messrs. Saunders and Hanson, personal trainer expenses for Messrs. Saunders, Hanson and Streff, and company-paid life insurance premiums for the benefit of Mr. Hanson. For more information about these perquisites and personal benefits, see the "2011 Summary Compensation Table" and its related footnotes below.
Under the terms of Mr. Saunders's 2011 employment agreement amendment, we have agreed to provide Mr. Saunders with up to $25,000 of direct operating cost for personal use of company-owned or company-leased aircraft, and Mr. Saunders may designate additional passengers as seating permits on company-owned or company-leased aircraft, all as in accordance with the company's applicable policy. During 2011, the value of Mr. Saunders usage, and the value of Mr. Hanson's usage (based on Mr. Saunders' designation), was $10,254 and $1,479, respectively.
In 2011, we adopted a company policy applicable to business and personal use of company-owned, leased or chartered aircraft, which we refer to as company aircraft for purposes of describing this policy. Under this policy, Mr. Saunders' use of company aircraft is subject to the terms of any
120
employment agreement with us or, if outside the parameters of such employment agreement, approval by the Chairman of the board. Use of company aircraft by the other named executive officers is subject to approval by Mr. Saunders and is subject to the terms of the policy. Company aircraft or personal aircraft may be used by the named executive officers (except Mr. Saunders) for commuting approved by Mr. Saunders and by Mr. Saunders, subject to the terms of any employment agreement he has entered into with us and, if outside of those parameters, approval by the Chairman of our board of directors. Under the policy, spousal or significant other travel may be permitted on company aircraft, in which case Mr. Saunders or the board may approve reimbursement of the spouse or significant other's travel expenses and may approve a tax gross-up for the respective named executive officer with respect to any compensation resulting from such travel.
Share Ownership Guidelines
Share ownership guidelines have not been implemented by the CheckSmart Committee or the Compensation Committee for our named executive officers. We have chosen not to require pre-specified levels of share ownership given the limited market for our shares. We will continue to periodically review best practices and re-evaluate our position with respect to share ownership guidelines.
Tax Deductibility of Executive Compensation
Limitations on deductibility of compensation may occur under Section 162(m) of the Internal Revenue Code of 1986, as amended, which generally limits the tax deductibility of compensation paid by a public company to its CEO and certain other highly compensated executive officers to $1 million in the year the compensation becomes taxable to the executive officer. There is an exception to the limit on deductibility for performance-based compensation that meets certain requirements. The Compensation Committee generally considers the deductibility of compensation when making its compensation decisions.
2012 Executive Compensation, Benefit and Severance Program
At the end of 2011, our employment agreements with Messrs. Saunders, Hanson and Streff and Ms. Roman expired pursuant to their terms. Our employment agreement with Mr. Durbin runs through December 31, 2013. Instead of entering into new employment agreements or renewing the employment agreements with these named executive officers, our board adopted our 2012 Executive Compensation, Benefit and Severance Program, which we refer to as our 2012 Program. The 2012 Program was revised in April 2012 to make conforming changes and changes to ensure that it complies with Section 409A of the Internal Revenue Code. The 2012 Program establishes the primary elements of our ongoing executive compensation arrangements with these named executive officers, including base salary levels, annual cash incentive opportunities, perquisites and other personal benefits, health and welfare program participation, retirement program participation and severance arrangements for a number of different termination scenarios, including after a change in control. The 2012 Program first entered into effect for Messrs. Saunders, Hanson and Streff and Ms. Roman on January 1, 2012. We expect that Mr. Durbin's compensation arrangement with us will also be governed by this program after the termination of his current employment agreement.
The 2012 Program provides that Mr. Saunders will determine the general duties of the other named executive officers and provides that the named executive officers' annual base salaries will be determined by the Compensation Committee. Each named executive officer is eligible to participate in a performance-based annual bonus at the following percentage of his or her respective base salary: Mr. Saunders, 100%; Mr. Durbin, 60%; Mr. Hanson, 61%; Mr. Streff, 60%; and Ms. Roman, 55%. The performance-based annual bonus will be earned based on the relative achievement of the goals and objectives established by, for Mr. Saunders, the Chairman of the Compensation Committee and, for the other named executive officers, Mr. Saunders; it is not intended that the Compensation Committee will take an active role in establishing these goals and objectives. Each named executive officer is entitled to business and professional expense reimbursement and perquisites offered by us, which perquisites may
121
include eligibility under our aircraft policy, personal training expenses, health savings account payments and an automobile allowance. The named executive officers also participate under the 2012 Program in our benefit plans, including our 401(k) plan, and Mr. Saunders receives payment for certain life insurance premiums. The 2012 Program also sets forth the procedure by which an officer may be terminated, and provides for certain payments and benefits upon termination described immediately below.
Termination by us without cause, or resignation by named executive officer for good reason. The 2012 Program provides that if we terminate a named executive officer's employment without cause, or if a named executive officer resigns for good reason (defined below), the named executive officer is entitled to receive the following payments and continued benefits for the length of the base salary payment period:
- •
- Mr. Saunders: two times his annual base salary payable over a two-year
period;
- •
- Mr. Hanson: one and one-half times his annual base salary payable over a
one-and-one-half-year period; and
- •
- Messrs. Streff and Durbin and Ms. Roman: one times his or her base salary payable over a one-year period.
In addition, upon any such termination, each named executive officer is entitled to receive payments related to accrued and unpaid base salary and vacation pay through the termination date and any annual bonus that has been earned for the year in which the termination occurs. All of the above payments and continued benefits are subject to the execution by the named executive officer of a non-competition agreement and general release of claims with us.
"Cause" is generally defined under the 2012 Program as:
- •
- material failure to perform the duties or responsibilities reasonably assigned to the named executive officer (subject to
a 20-day cure period) or the performance of such duties in a grossly negligent manner or the commission of an act of willful misconduct;
- •
- failure or refusal to comply, on a timely basis, with any lawful direction or instruction of our board of directors or the
CEO;
- •
- the commission of an act of fraud, embezzlement, misappropriation of funds, breach of fiduciary duty or an act of
dishonesty against the company;
- •
- the conviction of the named executive officer, or the entry of a plea of nolo
contendere or guilty by the named executive officer, to a felony; or
- •
- habitual drug addiction or intoxication.
"Good reason" generally arises under the 2012 Program upon a reduction in the named executive officer's base salary, the non-timely payment of the officer's base salary or annual bonus or benefits, the company's breach of the 2012 Program's provisions, or a material reduction in the officer's duties or responsibilities, in each case subject to a 20-day cure period.
Termination by us without cause, or resignation by named executive officer for good reason, coupled with a change in control. Each named executive officer will receive the following enhanced severance payments and continued benefits for the length of the base salary payment period in the event that he or she is terminated without cause or resigns within 180 days before or two years after a change in control:
- •
- Messrs. Saunders and Hanson: three times his annual base salary payable over a three-year period;
and
- •
- Messrs. Streff and Durbin and Ms. Roman: two times his or her base salary payable over a two-year period.
In addition, upon any such termination, each named executive officer is entitled to receive payments related to accrued and unpaid base salary and vacation pay through the termination date and a pro rata annual bonus for the year in which the termination occurs. All of the above payments and
122
continued benefits are subject to the execution by the named executive officer of a non-competition agreement and general release of claims with us.
"Change in control" is generally defined under the 2012 Program as:
- •
- the sale, lease or transfer of all or substantially all of our assets to other than our current shareholders, their
affiliates or our management; or
- •
- the acquisition by any person or group of 50% or more of our total voting stock (or of the total voting stock of any parent of the company) unless in connection with an initial public offering.
Termination by us for cause or resignation by named executive officer for other than good reason. We are not obligated to make any cash payment or provide any continued benefits to our named executive officers if their employment was terminated by us for cause or by the named executive officer without good reason, other than the payment of accrued and unpaid base salary and vacation pay through the termination date.
Termination upon death. In the event of termination due to death, we are obligated to pay the named executive officer's accrued and unpaid base salary, vacation pay and annual bonus through the termination date and pay premiums at the employee rate for continued health and welfare benefits to the executive's spouse and dependents for twelve months.
Termination upon disability. In the event of termination due to disability, we are obligated to pay the named executive officer's accrued and unpaid base salary and vacation pay through the termination date, and benefits, pay the annual bonus otherwise earned for the year in which the termination occurred and pay his or her annual base salary and premiums at the employee rate for continued health and welfare benefits until the earlier of (1) six months following termination or (2) the date on which the named executive officer becomes entitled to long-term disability benefits under our applicable plan or program.
2012 Management Payments
In connection with this offering (and any potential follow-on offering), if Diamond Castle receives more than $9.7 million in aggregate net proceeds from sales of our common shares, our board of directors has unanimously authorized us to pay a total amount of $5.2 million in cash to our management team, including our named executive officers. In those circumstances, our board of directors will determine the amount of Mr. Saunders' payment (which will not exceed 41% of the aggregate amount of the management payment), Mr. Durbin will receive $500,000, and, with respect to the remaining payment recipients, Mr. Saunders will (in consultation with the Compensation Committee) identify such recipients and determine the allocation of the remainder of the $5.2 million to such recipients. This payment to Mr. Durbin will satisfy our obligation under his employment agreement to pay him a one-time change in control bonus of $500,000 under certain circumstances described below under "Summary of Compensation—2011 Potential Payments Upon Termination or Change in Control—Additional arrangements". These cash payments are expected to be made no later than 30 days after the completion of the applicable offering (or, in the case of Mr. Durbin, no later than five days after the completion of the applicable offering).
Compensation-Related Risk Analysis
During the fourth quarter of 2011, a team consisting of members of our management, including members from our internal legal, accounting, finance and human resources departments, along with our external legal counsel, engaged in a subjective review of our compensation policies and practices that apply to all of our employees. This review was designed to evaluate, consider and analyze the extent to which, if any, our compensation policies and practices might create risks for the company. This review also was focused on the variable and incentive elements of our executive compensation programs, as well as any policies and practices that could mitigate or balance any risks introduced by such elements. These team members are regularly exposed to information about our policies and practices as they relate to company-wide compensation programs and the potential creation of any risks that are likely to have a material adverse
123
impact on the company. We did not find that any of our compensation policies and practices for our employees create any risks that are reasonably likely to have a material adverse effect on the company. The results of the review were reviewed and independently considered by the Compensation Committee.
Summary of Compensation
The following table sets forth certain information with respect to compensation paid for the year ended December 31, 2011 by us (or our indirect subsidiary CheckSmart Financial LLC) to our CEO, our CFO and our three other most-highly compensated executive officers.
2011 Summary Compensation Table
Name and Principal Position
|
Year | Salary ($)(1) |
Bonus ($)(2) |
Stock Awards ($) |
Option Awards ($) |
Non- Equity Incentive Plan Compensation ($)(3) |
Change in Pension Value and Nonqualified Defined Compensation Earnings ($) |
All Other Compensation ($)(4) |
Total ($) |
||||||||||||||||||||
|---|---|---|---|---|---|---|---|---|---|---|---|---|---|---|---|---|---|---|---|---|---|---|---|---|---|---|---|---|---|
William E. Saunders, Jr., |
2011 | 622,727 | 2,405,623 | — | — | 300,000 | — | 39,907 | 3,368,257 | ||||||||||||||||||||
Chief Executive Officer |
|||||||||||||||||||||||||||||
Michael Durbin, |
2011 | 375,000 | 300,000 | — | — | 75,000 | — | 12,240 | 762,240 | ||||||||||||||||||||
Senior Vice President, Chief Financial Officer and Treasurer |
|||||||||||||||||||||||||||||
Kyle F. Hanson, |
2011 | 467,045 | 1,202,370 | — | — | 75,000 | — | 96,911 | 1,841,326 | ||||||||||||||||||||
President |
|||||||||||||||||||||||||||||
Chad M. Streff, |
2011 | 389,205 | 826,039 | — | — | 75,000 | — | 28,903 | 1,319,147 | ||||||||||||||||||||
Senior Vice President, Chief Compliance Officer and Chief Technology Officer |
|||||||||||||||||||||||||||||
Bridgette C. Roman, |
2011 | 261,667 | 456,879 | — | — | 37,500 | — | 9,133 | 765,179 | ||||||||||||||||||||
Senior Vice President, General Counsel and Secretary |
|||||||||||||||||||||||||||||
- (1)
- The
amounts reported in this column include $22,727, $17,045, $14,205 and $417 paid in lieu of accrued vacation to Messrs. Saunders, Hanson and
Streff and Ms. Roman, respectively.
- (2)
- The
amounts reported in this column represent the special discretionary bonuses, Ms. Roman's employment agreement bonus and the annual cash bonuses paid to
our named executive officers for 2011. For more information about the special discretionary bonuses, see "Compensation Discussion and Analysis—Analysis of 2011 Executive Compensation
Decisions and Actions—Special Discretionary Bonuses". For more information about the bonus paid to Ms. Roman at the time of commencement of her employment agreement, see
"Compensation Discussion and Analysis—Analysis of 2011 Executive Compensation Decisions and Actions—Performance-Based Retention Bonuses". For more information about the annual
cash bonuses paid to the named executive officers, see "Compensation Discussion and Analysis—Analysis of 2011 Executive Compensation Decisions and Actions—Annual Cash Bonuses".
- (3)
- The
amount reported in this column represents the retention bonus earned by each named executive officer for 2011. For more information about the retention
bonuses, see "Compensation Discussion and Analysis—Analysis of 2011 Executive Compensation Decisions and Actions—Performance-Based Retention Bonuses".
- (4)
- The amounts reported in this column include: for Mr. Saunders, an automobile allowance, an employer matching contribution to the 401(k) Plan, an employer matching contribution and rollover of accrued vacation value to a health savings account, personal trainer expenses and personal aircraft usage; for Mr. Hanson, an automobile allowance, an employer matching contribution to the 401(k) Plan, an employer matching contribution and rollover of accrued vacation value to a health savings account, personal trainer expenses, personal aircraft usage and $65,779 of company-paid life insurance premium expenses; for Mr. Streff, an automobile allowance, an employer matching contribution to the 401(k) Plan, rollover of accrued vacation value to a health savings account and personal trainer expenses; for Mr. Durbin, an automobile allowance and employer matching contribution to a health savings account; and for Ms. Roman, an employer matching contribution to the 401(k) Plan and an employer matching contribution to a health savings account. None of the amounts reported in this column, if not a perquisite or personal benefit, exceeds $10,000 or, if a perquisite or personal benefit, exceeds the greater of $25,000 or 10% of the total amount of perquisites and personal benefits for the officer, except as provided in this footnote.
124
2011 Grants of Plan-Based Awards Table
| Name | Estimated Possible Payouts Under Non-Equity Incentive Plan Awards | |||||||||
|---|---|---|---|---|---|---|---|---|---|---|
| |
Threshold ($) |
Target ($) |
Maximum ($) |
|||||||
Mr. Saunders |
— | 400,000 | (1) | — | ||||||
Mr. Durbin |
— |
100,000 |
(1) |
— |
||||||
Mr. Hanson |
— |
100,000 |
(1) |
— |
||||||
Mr. Streff |
— |
100,000 |
(1) |
— |
||||||
Ms. Roman |
— |
56,250 |
(1) |
— |
||||||
- (1)
- These amounts represents the performance-based retention bonus opportunities for our named executive officers for 2011. The CheckSmart Committee and Compensation Committee had discretion under this award to reduce payouts to zero based on the named executive officers' achievement of their milestones. As a result, there was no threshold payout level for this award, and the target level served as the maximum payout level for this award. For more information about the performance-based incentive awards, see "Compensation Discussion and Analysis—Analysis of 2011 Executive Compensation Decisions and Actions—Performance-Based Retention Bonuses".
As discussed above under "Compensation Discussion and Analysis—Analysis of 2011 Executive Compensation Decisions and Actions—Long-Term Equity Incentive Compensation," we did not make any new equity awards to our named executive officers in 2011. Pursuant to the April 2011 merger agreement, however, the named executive officers' outstanding CheckSmart Financial Holdings Corporation stock options and stock appreciation rights were automatically adjusted pursuant to the terms of the 2006 Plan as a result of the merger. As a result of this adjustment, these awards now relate to CCFI shares, the number of shares to which most of these awards relate has been adjusted, and the exercise prices for most of these options and the base prices for most of these stock appreciation rights have been modified, in each case to reflect the merger (and our May 2012 six-for-one stock split). There was, however, no incremental fair value, computed in accordance with Financial Accounting Standards Board Accounting Standards Codification Topic 718, for the adjusted equity awards. As a result, and pursuant to Instruction 7 to Regulation S-K Item 402(d), the adjusted equity awards are not disclosed in the "2011 Grants of Plan-Based Awards Table" because the adjustments occurred through the pre-existing mechanisms in the 2006 Plan and the awards themselves. For more information on these awards, as adjusted, please see the "Outstanding Equity Awards at 2011 Fiscal Year-End Table" below.
Employment Agreements
For 2011, we were a party to management employment agreements with each of our named executive officers. Each of these agreements provided for certain severance payments. These arrangements were designed to help ensure the retention of our senior executive team. The material
125
details of each named executive officer's employment agreement in effect as of December 30, 2011 are described below:
Named Executive Officer
|
Expiration Date(1) |
2011 Base Salary Under Agreement |
2011 Annual Cash Bonus Opportunity Under Agreement |
2011 Performance- Based Retention Bonus Opportunity Under Agreement(2) |
2011 Employment Agreement Bonus Payment(3) |
Severance Payments and Benefits Under Certain Circumstances? |
||||||||||
|---|---|---|---|---|---|---|---|---|---|---|---|---|---|---|---|---|
Mr. Saunders |
December 31, 2011 | $ | 600,000 | $ | 300,000 | $ | 400,000 | N/A | Yes | |||||||
Mr. Durbin |
December 31, 2013 | $ | 375,000 | $ | 125,000 | $ | 100,000 | N/A | Yes | |||||||
Mr. Hanson |
December 31, 2011 | $ | 450,000 | $ | 175,000 | $ | 100,000 | N/A | Yes | |||||||
Mr. Streff |
December 31, 2011 | $ | 375,000 | $ | 125,000 | $ | 100,000 | N/A | Yes | |||||||
Ms. Roman |
December 31, 2011 | $ | 275,000 | $ | 75,000 | $ | 56,250 | $ | 18,750 | Yes | ||||||
- (1)
- Each
of these agreements, except with respect to Mr. Durbin, terminated on December 31, 2011. For 2012 and beyond, Messrs. Saunders,
Hanson and Streff and Ms. Roman are covered by our 2012 Executive Compensation, Benefit and Severance Program.
- (2)
- These
amounts represent the performance-based retention bonus opportunities for our named executive officers for 2011.
- (3)
- This amount represents a bonus paid to Ms. Roman on the commencement of her 2011 employment agreement.
At the end of 2011, the employment agreements with Messrs. Saunders, Hanson and Streff and Ms. Roman expired pursuant to their terms. We did not enter into new employment agreements with these named executive officers, but instead implemented our 2012 Executive Compensation, Benefit and Severance Program, which was designed to establish the terms and conditions for our named executive officers' compensatory arrangements with us (including severance and indemnification arrangements) without the need for individual bilateral employment agreements.
Mr. Saunders
In 2006, we entered into an employment agreement with Mr. Saunders, which employment agreement was amended in 2008 and 2009, and further amended on January 1, 2011. The employment agreement expired on December 31, 2011. Mr. Saunders's employment agreement specified his duties and responsibilities, his base salary for 2011 and his annual cash bonus target for 2011. The employment agreement also described Mr. Saunders's other compensation arrangements, including his participation in company benefit plans and his entitlement to equity awards and a performance-based retention bonus opportunity in 2011 based on his achievement of individual milestones. Mr. Saunders was also entitled to an annual perquisite of $25,000 in personal use of company-owned or company-leased aircraft (including the ability to designate additional passengers as seating permits on company-owned or company-leased aircraft), plus other perquisites offered by us. In the event that Mr. Saunders's employment with us had been terminated, he would have been entitled under the employment agreement to certain benefits and payments. Those benefits and payments are further described below under "2011 Potential Payments Upon Termination or Change in Control".
Messrs. Hanson and Streff and Ms. Roman
In 2006, we entered into employment agreements with each of Messrs. Hanson and Streff, which employment agreements were amended in 2008 and further amended on January 1, 2011. We also entered into a new employment agreement with Ms. Roman on April 1, 2011 to replace her prior agreement, which we entered into with her in 2008. The employment agreements for Messrs. Hanson and Streff and Ms. Roman expired on December 31, 2011, but were in effect during 2011. The employment agreements specify each executive's duties and responsibilities, his or her base salary for 2011 and subsequent years and his or her annual cash bonus target for 2011 and subsequent years. The
126
employment agreements also describe each executive's other compensation arrangements, including his or her participation in company benefit plans and his or her entitlement to equity awards and a performance-based retention bonus opportunity in 2011 and subsequent years based on his or her achievement of individual milestones. Each executive is also entitled to perquisites offered by us. In the event that any of the executives' employment with us is terminated, he or she will be entitled under his or her employment agreement to certain benefits and payments. These benefits and payments are further described below under "2011 Potential Payments Upon Termination or Change in Control".
Mr. Durbin
We entered into an employment agreement with Mr. Durbin on January 1, 2011. The employment agreement currently runs through December 31, 2013, subject to automatic one-year renewals absent 90 days' prior written notice of non-extension provided by the board of directors or by Mr. Durbin. The terms of Mr. Durbin's employment agreement are otherwise substantially similar to those described above for Messrs. Hanson and Streff and Ms. Roman.
Outstanding Equity Awards at 2011 Fiscal Year-End Table
| |
Option Awards(1) | ||||||||||||||||||
|---|---|---|---|---|---|---|---|---|---|---|---|---|---|---|---|---|---|---|---|
| Name | Grant Date | Number of Securities Underlying Unexercised Options (#) Exercisable |
Number of Securities Underlying Unexercised Options (#) Unexercisable |
Equity Incentive Plan Awards: Number of Securities Underlying Unexercised Unearned Options (#)(2) |
Option Exercise Price ($) |
Option Expiration Date |
|||||||||||||
Mr. Saunders |
12/31/2008 | 175,008 | — | — | 6.00 | 12/31/2018 | |||||||||||||
|
12/31/2008 | — | — | 175,008 | 6.00 | 12/31/2018 | |||||||||||||
Mr. Durbin |
12/31/2010 |
— |
— |
252,600 |
8.27 |
4/30/2016 |
|||||||||||||
Mr. Hanson |
5/9/2006 |
68,310 |
— |
13,662 |
8.81 |
5/9/2016 |
|||||||||||||
|
6/4/2007 | 20,484 | — | — | 10.53 | 6/4/2017 | |||||||||||||
|
12/31/2008 | 75,000 | — | — | 6.00 | 12/31/2018 | |||||||||||||
|
12/31/2008 | — | — | 75,000 | 6.00 | 12/31/2018 | |||||||||||||
Mr. Streff |
5/9/2006 |
136,608 |
— |
27,342 |
8.81 |
5/9/2016 |
|||||||||||||
|
12/31/2008 | 64,500 | — | — | 6.00 | 12/31/2018 | |||||||||||||
|
12/31/2008 | — | — | 64,500 | 6.00 | 12/31/2018 | |||||||||||||
Ms. Roman |
12/31/2008 |
— |
— |
12,000 |
6.00 |
12/31/2018 |
|||||||||||||
- (1)
- As
discussed above under "Compensation Discussion and Analysis—Analysis of 2011 Executive Compensation Decisions and
Actions—Long-Term Equity Incentive Compensation," these stock option and stock appreciation rights have been automatically adjusted pursuant to the terms of the 2006 Plan as a
result of the April 2011 merger. As a result of this adjustment, these awards now relate to CCFI shares, the number of shares to which most of these awards relate has been adjusted, and the exercise
prices for most of these options and the base prices for most of these stock appreciation rights have been modified, in each case to reflect the occurrence of the merger (and our May 2012
six-for-one stock split).
- (2)
- These amounts represent performance-based stock options or stock appreciation rights that will vest if Diamond Castle recoups its investment in this offering or upon a change in control. We expect these options or stock appreciation rights will vest upon consummation of this offering.
127
2006 Management Equity Incentive Plan and 2011 Management Equity Incentive Plan
In 2006, we adopted the 2006 Plan as our omnibus equity plan (we also amended the 2006 Plan in July 2007). Under the 2006 Plan, we were permitted to grant stock options, stock appreciation rights, restricted shares and restricted stock units (including dividend equivalent rights in conjunction with any award) to employees and consultants to help attract and retain key personnel and provide incentives to participants. The 2006 Plan was administered by our board of directors. During 2011, we did not grant any equity awards. As described in "Compensation Discussion and Analysis" above, the 2006 Plan was amended and restated as our 2011 Plan, which we expect will be utilized in substantially the same manner as the 2006 Plan.
2011 Option Exercises and Shares Vested
None of our named executive officers exercised any stock options and none of our named executive officers had restricted shares that vested during 2011.
2011 Pension Benefits
We do not maintain any defined benefit plans or other plans with specified retirement benefits in which our named executive officers participate.
2011 Nonqualified Deferred Compensation
We do not maintain any nonqualified deferred compensation plans in which our named executive officers participate.
2011 Potential Payments Upon Termination or Change in Control
During 2011, we were a party to certain arrangements effective for 2011 that required us to provide compensation and other benefits to the named executive officers in the event of a termination of their employment or a change in control of the company. The following paragraphs describe the potential payments and benefits payable upon such termination or change in control for each named executive officer at December 30, 2011. Although our employment agreements with Messrs. Saunders, Hanson and Streff and Ms. Roman expired as of December 31, 2011, each of these named executive officers is eligible for payments in the event of a termination of their employment or a change in control of the company under the 2012 Executive Compensation, Benefit and Severance Program.
Termination by us without cause, or termination by named executive officer for good reason
We were a party to employment agreements with our named executive officers during 2011. These agreements with Messrs. Saunders, Hanson and Streff and Ms. Roman expired on December 31, 2011, but the agreement with Mr. Durbin remains in effect through December 31, 2013. Our management employment agreements provided that if we terminated a named executive officer's employment without cause, or if a named executive officer terminated his or her employment for good reason, the named executive officer was entitled to receive the following payments and benefits (less applicable withholding taxes):
- •
- with respect to Mr. Saunders, one year of his annual base salary following the date of termination, plus his annual
cash bonus that he otherwise would have earned for the year in which the termination occurred;
- •
- with respect to Messrs. Durbin, Hanson and Streff and Ms. Roman, his or her annual base salary for the longer of (1) the remainder of the year in which the termination occurs or (2) 90 days following the date of termination, plus any annual cash bonus that he or she otherwise would have earned for the year in which the termination occurred; and
128
- •
- any accrued but unpaid portion, as of the date of termination, of his or her performance-based retention bonus opportunity.
In addition, upon any such termination, all named executive officers were entitled to receive payments related to accrued and unpaid expenses, base salary and vacation pay, benefits and a continuation of all health and welfare benefits described above under "Compensation Disclosure and Analysis" for the period of time they were receiving base salary continuation payments.
These payments and benefits were subject to the execution of a general release by the named executive officers and were subject to covenants not to compete with us, covenants not to solicit our employees and covenants not to solicit our customers or suppliers, in each case for a period of up to one year following termination and, in the case of Ms. Roman, subject to certain exceptions based on Ohio law applicable to attorneys.
"Cause" was generally defined under the management employment agreements to include:
- •
- the conviction or entry of a plea of nolo contendere or guilty to a
felony;
- •
- a material violation of such named executive officer's employment agreement that is not cured within a 20-day
cure period following notice of such violation;
- •
- the commission of an act of fraud, embezzlement, misappropriation, breach of fiduciary duty or an act of dishonesty
against the company;
- •
- the failure to perform such named executive officer's duties or the performance of such duties in a grossly negligent
manner or the commission of an act of willful misconduct; or
- •
- habitual drug addiction or intoxication.
"Good reason" was generally defined under the management employment agreements to include a reduction in the executive's base salary or non-timely payment of base salary or an earned annual cash incentive award, a material reduction in the executive's responsibilities, in each case subject to a cure period, or the requirement that the executive relocate his or her principal place of employment more than 20 miles. It was also defined in the employment agreements for Messrs. Durbin and Saunders and Ms. Roman as including a violation of the employment agreement by us, subject to a cure period.
Termination by us for cause or by named executive officer for other than good reason, death or disability
At December 30, 2011 we were not obligated to make any cash payment or provide any benefit to our named executive officers if their employment was terminated by us for cause or by the named executive officer without good reason, other than the payment of accrued and unpaid base salary, vacation pay, annual cash bonus, expenses and benefits.
Termination upon death
In the event of termination due to death, at December 30, 2011 we were obligated to pay the named executive officer's accrued and unpaid expenses, base salary, vacation pay, annual cash bonus and benefits, pay a pro-rata portion of the executive's annual cash bonus for the year in which the termination occurred, pay the accrued and unpaid performance-based retention bonus, and provide continued health and welfare benefits to the executive's spouse and dependents for twelve months.
Termination upon disability
In the event of termination due to disability, at December 30, 2011 we were obligated to pay the named executive officer's accrued and unpaid expenses, base salary, vacation pay, and benefits, pay the annual cash bonus otherwise earned for the year in which the termination occurred, pay his or her
129
annual base salary and provide continued health and welfare benefits until the later (in the case of Mr. Saunders) and earlier (in the case of the other named executive officers) of (1) six months or (2) the date on which the named executive officer becomes entitled to long-term disability benefits under the applicable plan or program, and pay the accrued and unpaid performance-based retention bonus.
Additional arrangements
Under his employment agreement, Mr. Durbin was and remains entitled to receive a one-time change in control bonus of $500,000 if (1) we experience a change in control, (2) Mr. Durbin remains employed with us through the date of the change in control and (3) Diamond Castle recoups its investment in the company. Additionally, under the terms of the unvested equity awards described above in the "Outstanding Equity Awards at 2011 Fiscal Year-End Table", these performance-based stock option or stock appreciation rights will vest if Diamond Castle recoups its investment at a specified level as a result of this offering or a change in control.
Tabular disclosure
Based on a hypothetical termination and/or change in control occurring on December 30, 2011, the following table describes the potential payments and benefits our named executive officers would have received upon such termination or change in control under the terms of their employment agreements in effect on December 30, 2011.
Potential Payments Upon Termination of Employment and/or a Change in Control Table
| Name | Benefits and Payments | Involuntary Termination Without Cause / Resignation for Good Reason ($)(1) |
Involuntary Termination For Cause / Resignation Without Good Reason ($)(1) |
Termination Due to Death ($)(1) |
Termination Due to Disability ($)(2) |
Additional Payment Upon Change in Control ($)(3) |
||||||||||||
|---|---|---|---|---|---|---|---|---|---|---|---|---|---|---|---|---|---|---|
William E. Saunders, Jr. |
||||||||||||||||||
|
Salary Continuation | 600,000 | 0 | 0 | 300,000 | 0 | ||||||||||||
|
Annual Cash Bonus | 0 | 0 | 0 | 0 | 0 | ||||||||||||
|
Retention Bonus | 0 | 0 | 0 | 0 | 0 | ||||||||||||
|
Health and Welfare Benefits Continuation |
7,228 | 0 | 7,228 | 3,614 | 0 | ||||||||||||
|
Equity Vesting | 0 | 0 | 0 | 0 | 1,403,564 | ||||||||||||
Total |
607,228 | 0 | 7,228 | 303,614 | 1,403,564 | |||||||||||||
Michael Durbin |
||||||||||||||||||
|
Salary Continuation | 92,466 | 0 | 0 | 187,500 | 0 | ||||||||||||
|
Change in Control Bonus | 0 | 0 | 0 | 0 | 500,000 | ||||||||||||
|
Annual Cash Bonus | 0 | 0 | 0 | 0 | 0 | ||||||||||||
|
Retention Bonus | 0 | 0 | 0 | 0 | 0 | ||||||||||||
|
Health and Welfare Benefits Continuation |
2,594 | (4) | 0 | 10,519 | 5,259 | 0 | |||||||||||
|
Equity Vesting | 0 | 0 | 0 | 0 | 1,452,450 | ||||||||||||
Total |
95,060 | 0 | 10,519 | 192,759 | 1,952,450 | |||||||||||||
Kyle F. Hanson |
||||||||||||||||||
|
Salary Continuation | 110,959 | 0 | 0 | 225,000 | 0 | ||||||||||||
|
Annual Cash Bonus | 0 | 0 | 0 | 0 | 0 | ||||||||||||
|
Retention Bonus | 0 | 0 | 0 | 0 | 0 | ||||||||||||
|
Health and Welfare Benefits Continuation |
2,484 | (4) | 0 | 10,073 | 5,037 | 0 | |||||||||||
|
Equity Vesting | 0 | 0 | 0 | 0 | 672,679 | ||||||||||||
Total |
113,443 | 0 | 10,073 | 230,037 | 672,679 | |||||||||||||
130
| Name | Benefits and Payments | Involuntary Termination Without Cause / Resignation for Good Reason ($)(1) |
Involuntary Termination For Cause / Resignation Without Good Reason ($)(1) |
Termination Due to Death ($)(1) |
Termination Due to Disability ($)(2) |
Additional Payment Upon Change in Control ($)(3) |
||||||||||||
|---|---|---|---|---|---|---|---|---|---|---|---|---|---|---|---|---|---|---|
Chad M. Streff |
||||||||||||||||||
|
Salary Continuation | 92,466 | 0 | 0 | 187,500 | 0 | ||||||||||||
|
Annual Cash Bonus | 0 | 0 | 0 | 0 | 0 | ||||||||||||
|
Retention Bonus | 0 | 0 | 0 | 0 | 0 | ||||||||||||
|
Health and Welfare Benefits Continuation |
0 | (4) | 0 | 0 | 0 | 0 | |||||||||||
|
Equity Vesting | 0 | 0 | 0 | 0 | 659,742 | ||||||||||||
Total |
92,466 | 0 | 0 | 187,500 | 659,742 | |||||||||||||
Bridgette C. Roman |
||||||||||||||||||
|
Salary Continuation | 67,808 | 0 | 0 | 137,500 | 0 | ||||||||||||
|
Annual Cash Bonus | 0 | 0 | 0 | 0 | 0 | ||||||||||||
|
Retention Bonus | 0 | 0 | 0 | 0 | 0 | ||||||||||||
|
Health and Welfare Benefits Continuation |
1,782 | (4) | 0 | 7,228 | 3,614 | 0 | |||||||||||
|
Equity Vesting | 0 | 0 | 0 | 0 | 96,240 | ||||||||||||
Total |
69,590 | 0 | 7,228 | 141,114 | 96,240 | |||||||||||||
- (1)
- Assumes
that all accrued base salary and vacation pay, expenses and benefits through December 30, 2011 have been paid as of December 30, 2011,
and that all annual cash bonuses and performance-based retention bonuses for 2011 have been earned and paid for 2011 as of December 30, 2011. Also assumes that Ms. Roman is not entitled
to any vested deferred compensation.
- (2)
- Assumes
that continued health and welfare benefits are provided for six months.
- (3)
- The
values reported as equity vesting in this column represent the assumed value for each named executive officer of the vesting of his or her unvested
equity awards described above in the "Outstanding Equity Awards at 2011 Fiscal Year-End Table" upon a change in control occurring on December 30, 2011. These values represent the
product of (A) the spread between the exercise price for his or her unvested equity awards and an assumed value for our common shares on December 30, 2011 of $14.02 per share (based on a
recent valuation) and (B) the number of common shares subject to the accelerated award.
- (4)
- Assumes that continued health and welfare benefits are provided for 90 days.
Director Compensation
During 2011, H. Eugene Lockhart, Lee Wright, James Frauenberg, Sr., Michael Langer, Felix Lo, Andrew Rush and David Wittels served as our non-employee directors. None of these non-employee directors received compensation from us for their service on our board of directors.
131
PRINCIPAL AND SELLING SHAREHOLDERS
The following table sets forth certain information as of April 20, 2012 regarding the beneficial ownership of our outstanding common equity, by:
- •
- each person or entity known by us to beneficially own more than 5% of our outstanding common shares;
- •
- each of our directors and named executive officers;
- •
- selling shareholders; and
- •
- all of our directors and executive officers as a group.
Beneficial ownership of shares is determined under rules of the SEC and generally includes any shares over which a person exercises sole or shared voting or investment power. In computing the number of shares beneficially owned by a person and the percentage ownership of that person, common shares subject to options held by that person that are currently exercisable or exercisable within 60 days of April 20, 2012 are deemed outstanding. These shares, however, are not deemed outstanding for the purposes of computing the percentage ownership of any other person. Except as indicated in the footnotes to this table and as provided pursuant to applicable community property laws, the shareholders named in the table have sole voting and investment power with respect to the shares set forth opposite each shareholder's name. Unless otherwise indicated, the address for each of the persons listed below is: c/o Community Choice Financial Inc., 7001 Post Road, Suite 200, Dublin, Ohio 43016.
| |
|
|
|
|
Number of Shares Sold in this Offering (if the underwriters exercise their option to purchase additional shares in full) |
|
|
|||||||
|---|---|---|---|---|---|---|---|---|---|---|---|---|---|---|
| |
Shares Beneficially Owned Prior to This Offering | Shares Beneficially Owned After This Offering (assuming no exercise of underwriters' option to purchase additional shares) |
Shares Beneficially Owned After This Offering (assuming the underwriters exercise their option to purchase additional shares in full) |
|||||||||||
Name and Address of Beneficial Owner
|
Number | Percentage | Number | Percentage | Number | Percentage | ||||||||
5% Shareholders |
||||||||||||||
California Check Cashing Stores, Inc.(1) |
447,162 | 5.6% | 447,162 | 2.4% | 83,031 | 364,131 | 1.9% | |||||||
Diamond Castle Holdings(2) |
4,806,000 | 60.2 | 4,806,000 | 25.8 | 892,401 | 3,913,599 | 20.8 | |||||||
Funds managed by Golden Gate Capital(3) |
1,178,214 | 14.8 | 1,178,214 | 6.3 | 218,777 | 959,437 | 5.1 | |||||||
James H. Frauenberg 1998 Trust(4) |
835,800 | 10.5 | 835,800 | 4.5 | 155,196 | 680,604 | 3.6 | |||||||
Executive Officers and Directors |
||||||||||||||
William E. Saunders, Jr.(5) |
489,552 | 5.9 | 489,552 | 2.6 | — | 489,552 | 2.6 | |||||||
Kyle Hanson(6) |
252,456 | 3.1 | 252,456 | 1.3 | — | 252,456 | 1.3 | |||||||
Chad Streff(7) |
316,944 | 3.8 | 316,944 | 1.7 | — | 316,944 | 1.7 | |||||||
Michael Durbin(8) |
252,600 | 3.1 | 252,600 | 1.3 | — | 252,600 | 1.3 | |||||||
Bridgette Roman(9) |
12,000 | * | 12,000 | * | 1,273 | 10,727 | * | |||||||
H. Eugene Lockhart |
— | — | — | — | — | — | — | |||||||
Lee A. Wright |
— | — | — | — | — | — | — | |||||||
Michael Langer |
— | — | — | — | — | — | — | |||||||
Felix Lo |
— | — | — | — | — | — | — | |||||||
Andrew Rush |
— | — | — | — | — | — | — | |||||||
Eugene Schutt |
— | — | — | — | — | — | — | |||||||
David M. Wittels |
— | — | — | — | — | — | — | |||||||
All executive officers and directors as a group (12 individuals) |
1,323,552 | 14.5 | 1,323,552 | 6.7 | 1,273 | 1,322,279 | 6.6 | |||||||
Other Selling Shareholders |
||||||||||||||
Greyson Eves(10) |
29,484 | * | 29,484 | * | 1,898 | 27,586 | * | |||||||
Pagle Helterbrand(11) |
29,484 | * | 29,484 | * | 1,898 | 27,586 | * | |||||||
Robert Grieser(12) |
12,000 | * | 12,000 | * | 1,273 | 10,727 | * | |||||||
California Check Cashing Stores II, Inc.(13) |
67,098 | * | 67,098 | * | 12,459 | 54,639 | * | |||||||
California Check Cashing Stores IV, Inc.(14) |
149,526 | 1.9 | 149,526 | * | 27,765 | 121,761 | * | |||||||
James H. Frauenberg Desc. Trust(15) |
42,000 | * | 42,000 | * | 7,799 | 34,201 | * | |||||||
All selling shareholders as a group (11 entities) |
7,608,768 | 94.3 | 7,608,768 | 40.6 | 1,403,770 | 6,204,998 | 32.8 | |||||||
- *
- Represents less than 1%
132
- (1)
- Jonathan
Eager is the sole officer and director of California Check Cashing Stores, Inc. The sole shareholder of California Check Cashing
Stores, Inc. is the Jonathan B. Eager Family Trust (a revocable trust), of which Mr. Eager is a trustor, trustee and beneficiary, with the authority to act individually, and accordingly
Mr. Eager may be deemed to have beneficial ownership of the shares. The address for California Check Cashing Stores, Inc. is c/o Jonathan Eager, P.O. Box 11162, Oakland,
California 94611.
- (2)
- Includes
(a) 3,451,056 common shares held by Diamond Castle Partners IV L.P., or DCP IV, of which DCP IV GP L.P. is the general
partner (DCP IV GP-GP, L.L.C. is the general partner of DCP IV GP, L.P.), (b) 1,308,600 common shares held by Diamond Castle Partners
IV-A, L.P., or DCP IV-A, of which DCP IV GP L.P. is the general partner (DCP IV GP-GP, L.L.C. is the general partner of DCP
IV GP, L.P.),and (c) 46,344 common shares held by Deal Leaders Fund, L.P., or DLF, of which DCP IV GP L.P. is the general partner (DCP
IV GP-GP, L.L.C. is the general partner of DCP IV GP, L.P.). The manner in which the investments of DCP IV, DCP IV-A and DLF are held, and any decisions
concerning their ultimate disposition, are subject to the control of an investment committee consisting of certain partners of Diamond Castle: Ari Benacerraf, Michael Ranger, Andrew Rush, and David
Wittels. The investment committee is appointed by DCP IV GP, L.P. The investment committee has voting and investment power with respect to the common shares owned by DCP IV, DCP
IV-A, and DLF. The address of DCP IV, DCP IV-A, and DLF is 280 Park Avenue, Floor 25E, New York, New York 10017.
- (3)
- Includes
(a) 994,500 shares held by Golden Gate Capital Investment Fund II, L.P., (b) 61,800 shares held by Golden Gate Capital
Investment Fund II-A, L.P., (c) 24,798 shares held by Golden Gate Capital Investment Fund II (AI), L.P., (d) 1,542 shares held by Golden Gate Capital Investment
Fund II-A (AI), L.P., (e) 24,516 shares held by Golden Gate Capital Associates II-QP, L.L.C., (f) 390 shares held by Golden Gate Capital Associates
II-AI, L.L.C., (g) 11,670 shares held by CCG AV, L.L.C.—Series A, (h) 39,540 shares held by CCG AV, L.L.C.—Series C, (i) 11,490
shares held by CCG AV, L.L.C.—Series G, and (j) 7,968 shares held by CCG AV, L.L.C.—Series I (the entities listed in clauses (a) through
(j) above, the "Golden Gate Capital Entities"), each of which are funds managed by Golden Gate Capital. Golden Gate Capital may be deemed to be the beneficial owner of the shares owned by the
Golden Gate Capital Entities, but disclaims beneficial ownership pursuant to the rules under the Exchange Act. Felix Lo does not beneficially own any of the securities owned by the Golden Gate Capital
Entities. The address for the Golden Gate Capital Entities is c/o Golden Gate Private Equity, Inc., One Embarcadero Center, Ste. 3900, San Francisco, California 94111.
- (4)
- James
H. Frauenberg is the sole trustee of the trust which has sole voting and investment power over the shares, and accordingly Mr. Frauenberg may
be deemed to have beneficial ownership of the shares. The address for the James H. Frauenberg 1998 Trust is c/o James Frauenberg, 1310 Old Stickney Point Rd., Unit EP2, Sarasota, Florida 34242.
- (5)
- Includes
350,016 shares issuable upon exercise of options, all of which will be vested within 60 days of April 20, 2012.
- (6)
- Includes
252,456 shares issuable upon exercise of options, all of which will be vested within 60 days of April 20, 2012.
- (7)
- Includes
292,944 shares issuable upon exercise of options, all of which will be vested within 60 days of April 20, 2012.
- (8)
- Includes
252,600 shares issuable upon exercise of options, all of which will be vested within 60 days of April 20, 2012.
- (9)
- Includes
12,000 shares issuable upon exercise of options, all of which will be vested within 60 days of April 20, 2012.
- (10)
- Includes
29,484 shares issuable upon exercise of options, all of which will be vested within 60 days of April 20, 2012.
- (11)
- Includes
29,484 shares issuable upon exercise of options, all of which will be vested within 60 days of April 20, 2012.
- (12)
- Includes
12,000 shares issuable upon exercise of options, all of which will be vested within 60 days of April 20, 2012.
- (13)
- Mark
Tavill is the sole officer and director of California Check Cashing Stores II, Inc. The sole shareholder of that company is the M P
Tavill Revocable Trust, of which Mr. Tavill is a trustor, trustee and beneficiary, with the authority to act individually, and accordingly, Mr. Tavill may be deemed to have beneficial
ownership of the shares. The address for California Check Cashing Stores II, Inc. is c/o Mark Tavill, 6816 Stanley Avenue, Carmichael, CA 95608-3956.
- (14)
- Richard
Lake is the sole officer and director of California Check Cashing Stores IV, Inc. The shareholders of California Check Cashing Stores
IV, Inc. are as follows: Richard Lake (80%), Lance Solomon (15%), Rebecca Fox (2.5%) and Michael Rae (2.5%). The address for California Check Cashing Stores IV, Inc. is 4681 Fernway
Drive, North Port, FL 34288.
- (15)
- James H. Frauenberg II is the sole trustee of the trust, which has sole voting and investment power over the shares, and accordingly Mr. Frauenberg II may be deemed to have beneficial ownership of the shares.
133
CERTAIN RELATIONSHIPS AND RELATED-PARTY TRANSACTIONS
Advisory Services and Monitoring Agreement
Upon closing of the California Acquisition and related transactions in April 2011, we, along with CheckSmart and CCCS, entered into an Advisory Services and Monitoring Agreement with Diamond Castle and Golden Gate Capital, which together own approximately 75% of our outstanding common shares prior to the consummation of this offering. The Advisory Services and Monitoring Agreement will terminate upon the closing of this offering. Pursuant to this agreement, Diamond Castle and Golden Gate Capital provide us with various financial advisory and other services. Under this agreement, we paid Diamond Castle an initial fee of $3.8 million in consideration of the advisory services they provided in connection with the California Acquisition and related transactions and we will pay Diamond Castle and Golden Gate Capital (or any of their respective designees to our board of directors) a quarterly fee on the first day of each calendar quarter, which is equal to the greater of $150,000 or 25% multiplied by 1.5% of our average EBITDA for the previous 12-month period ending on the last day of the quarter immediately preceding the date the quarterly fee is due. We are also required under the agreement to pay Diamond Castle and Golden Gate Capital (or any of their respective designees to our board of directors) 1% of the total value (as determined on the basis set forth in the agreement) of any acquisition or merger by us, any sale of the equity or assets of our company, any sale or recapitalization or restructuring of equity or debt securities by our company and any other similar transaction. These fees will be apportioned 78% to Diamond Castle and 22% to Golden Gate Capital unless certain specified changes in ownership percentages occur. Diamond Castle and Golden Gate Capital are also entitled to reimbursement from us for reasonable fees incurred in connection with the provision of services the agreement contemplates. The term of the Advisory Services and Monitoring Agreement is for five years and will automatically renew on each anniversary so that the term is five years from the date of such renewal. The Advisory Services and Monitoring Agreement may be terminated by the joint written approval of Diamond Castle and Golden Gate Capital at any time prior to the consummation of an initial public offering and shall terminate automatically with respect to each of Diamond Castle and Golden Gate Capital if their respective equity ownership in our company falls below a certain specified percentage. For the years ended December 31, 2011, 2010 and 2009, we paid Diamond Castle fees of $1.4 million, $1.2 million and $0.8 million, respectively, and CCCS paid Golden Gate fees of $0.8 million for each of these periods.
When the Advisory Services and Monitoring Agreement is automatically terminated as a result of this offering, we will pay Diamond Castle and Golden Gate Capital (or any of their designees), at the time of such termination, a cash lump-sum termination fee equal to $5.8 million, which is the net present value of the amount of the aggregate quarterly fees that otherwise would have been payable from us to Diamond Castle or Golden Gate, as the case may be, from the date of such termination until April 2016, calculated using an agreed upon discount rate.
Insight Agent Agreements
In connection with offering prepaid debit card services, we entered into agent agreements with Insight, the provider of our prepaid debit card products. Insight is a wholly owned subsidiary of Insight Holding. William Saunders, our Chief Executive Officer and a director, serves as an advisory board member of Insight Holding and Mr. Hanson, our President, previously served in such a capacity. Prior to November 2011, both Mr. Hanson and Mr. Saunders owned minority interests in Insight Holding equalling approximately 15% of the total equity thereof. In November 2011, the Company purchased Mr. Saunders' and Mr. Hanson's interests, along with those of other Insight Holding unit holders, and acquired a minority 22.5% ownership stake in Insight Holding. The Company paid a total of $11.25 million to acquire this ownership interest (with each of Mr. Saunders and Mr. Hanson receiving $3.75 million), a price that was established based on arms-length negotiations and, in the Company's view, represents a reasonable, fair market value. The agent agreements between us and Insight were
134
also negotiated on an arm's length basis with terms that our management believes are standard for the market. During the year ended December 31, 2011, 2010 and 2009, our revenues from fees paid pursuant to this agreement were $19.7 million, $9.9 million and $0.1 million, respectively.
Registration Rights
Our shareholders have certain registration rights under the Shareholders Agreement. For a description of these registration rights, see "Description of Capital Stock—Registration Rights".
Corporate Office and Certain Branches
The property at which our corporate office is located is owned and operated by affiliates of Mr. Frauenberg, Mr. Streff and Michael Lenhart, an affiliate of certain of our shareholders. Certain properties where our branches are located are owned and operated by affiliates of Mr. Frauenberg and Mr. Lenhart. Rent paid to these related parties was $1.8 million, $1.8 million and $1.7 million for the years ended December 31, 2011, 2010 and 2009, respectively.
Line of Credit
On December 31, 2008, we entered into a $5.0 million line of credit with Diamond Castle. The line of credit bears interest at 20% and matured in February 2011. Interest expense and unused line fees recognized on this borrowing totaled $0.1 million, $0.3 million, and $0.3 million for the years ended December 31, 2011, 2010 and 2009, respectively.
135
DESCRIPTION OF CERTAIN INDEBTEDNESS
The following is a summary of the key terms of the agreements governing our material indebtedness that will be outstanding after the completion of this offering. The following summary is not a complete description of all of the terms of the agreements governing our indebtedness.
Revolving Credit Facility
Our revolving credit facility provides for revolving credit financings of up to $40.0 million and matures April 29, 2015.
Interest Rates and Fees. At our option, loans under our revolving credit facility bear interest at LIBOR plus 5.00% per annum or an alternative base rate (determined to be the greatest of the prime rate, the federal funds effective rate plus 0.5% or LIBOR plus 1%) plus 4.00% per annum.
In addition, we pay a commitment fee of 0.75% of the undrawn portion of our revolving credit facility, together with customary letter of credit fees.
Guarantees and Security. All obligations under our revolving credit facility are our primary obligation and are guaranteed jointly and severally by each of our restricted subsidiaries. All obligations under our revolving credit facility, and the guarantees of those obligations, together with certain hedging obligations owed to lenders and affiliates of lenders under the revolving credit facility, are secured by substantially all of our assets and the guarantors on a first-priority basis (except with respect to the certain collateral securing the Alabama revolving credit facility, as described below). A collateral agreement governs all arrangements in respect of the collateral, including the application of proceeds from enforcement actions taken against the collateral, first to repay obligations to our lenders under the revolving credit facility (and certain associated hedging obligations) prior to making any payments to the holders of our senior notes.
Restrictive Covenants and Other Matters. Our revolving credit facility restricts our ability to, among other things:
- •
- incur, assume or permit to exist additional indebtedness or guarantees;
- •
- incur liens;
- •
- engage in mergers, amalgamations, consolidations, liquidations or dissolutions;
- •
- make investments, loans or acquisitions;
- •
- engage in asset sales;
- •
- engage in sale-leaseback transactions;
- •
- engage in derivative transactions;
- •
- pay dividends, make distributions or redeem or repurchase capital stock;
- •
- prepay, redeem or purchase certain indebtedness, including the senior notes;
- •
- enter into agreements or arrangements that block dividends or payments from subsidiaries or contain restrictions on the
pledge of assets;
- •
- amend or otherwise alter terms of certain material documents;
- •
- engage in transactions with affiliates; and
- •
- make capital expenditures.
136
Our revolving credit facility also contains customary representations and warranties and customary affirmative covenants as well as a covenant requiring us to maintain a leverage ratio, defined as consolidated total indebtedness less excess cash, divided by EBITDA for the trailing twelve months, not to exceed 5.0 to 1 as of the end of each quarter when loans under the facility are outstanding. In calculating the leverage ratio, we calculate EBITDA and excess cash, which were $98.4 million and $43.3 million, respectively, for the twelve months ended and as of December 31, 2011, pursuant to the terms of our revolving credit facility. EBITDA is calculated under our revolving credit facility in substantially the same manner as Pro Forma Adjusted EBITDA is calculated as set forth under the heading "Prospectus Summary—Summary Unaudited Pro Forma Consolidated Financial Information". However, EBITDA, as calculated under our revolving credit facility, does not include an add-back for $678,000 of lease adjustments, which is included in the calculation of Pro Forma Adjusted EBITDA, but includes $946,000 of additional corporate allocations in connection with the integration of CCCS, which are excluded from the calculation of Pro Forma Adjusted EBITDA. Excess cash under our revolving credit facility is an amount equal to our and our restricted subsidiaries' cash and cash equivalents minus (i) funds in accounts used for taxes or payments to employees and other fiduciary funds and (ii) an amount equal to the product of $50,000 multiplied by the number of stores we own and operate. Though we did not have any loans outstanding as of such time, our leverage ratio as of December 31, 2011 was 3.6 to 1. Our revolving credit facility also includes customary events of defaults, including certain changes of control. If such an event of default occurs, the lenders under our revolving credit facility would be entitled to take various actions, including the acceleration of amounts due thereunder and all actions permitted to be taken by a secured creditor (subject to the terms of the collateral agreement).
Alabama Facility
In connection with the offering of our senior notes, we amended and restated the credit agreement governing our Alabama subsidiary's existing revolving credit facility, which we refer to as the Alabama Facility, to allow our Alabama subsidiary to provide a guarantee of and security with respect to our obligations under the senior notes and our revolving credit facility and to allow our Alabama subsidiary to make certain distributions in accordance with the indenture governing the senior notes.
Size and Maturity. The Alabama Facility provides a revolving credit commitment of up to $7.0 million. As of December 31, 2011, our Alabama subsidiary did not have any borrowings outstanding under the Alabama Facility. The Alabama Facility matures on July 31, 2013.
Interest Rates and Fees. Loans drawn under the Alabama Facility bear interest at Republic Bank of Chicago's prime rate plus 1.0% per annum, with a 5.00% floor.
Security. All obligations under the Alabama Facility, are secured on a first-priority basis by the assets of our Alabama subsidiary, and our senior notes and our revolving credit agreement are secured on a second-priority basis by the same collateral. An intercreditor agreement governs the lien priority with respect to this shared collateral.
Restrictive Covenants. The Alabama Facility restricts our Alabama subsidiary's ability to incur additional indebtedness, contingent liabilities and liens, make distributions to its equity holders and enter into certain merger and asset sale transactions. The Alabama Facility also requires our Alabama subsidiary to maintain certain financial ratios in order to draw under the facility as well as to maintain a minimum level of current asset coverage as compared to the amount of loans outstanding. The amended and restated Alabama Facility allows our Alabama subsidiary to pay quarterly distributions to the owners of its equity interests to the extent its quarterly earnings exceed the amount of capital expenditures made and changes in net working capital, in each case, during the applicable quarter.
137
Senior Notes
In April 2011, we completed an offering of $395 million in aggregate principal amount of our 10.75% senior secured notes due 2019, which we refer to as the senior notes. The senior notes bear interest at 10.75% per annum, payable semi-annually, and will mature in May 2019.
The senior notes are our senior secured obligations, rank senior in right of payment to all our future debt that is expressly subordinated in right of payment to the senior notes, and rank equally in right of payment with all our existing and future liabilities that are not so subordinated, including our obligations under our revolving credit facility. The senior notes are guaranteed by each of our restricted subsidiaries that existed on the issue date of the senior notes and any future restricted subsidiaries that guarantee indebtedness of the issuer of the senior notes or indebtedness of any other subsidiary guarantor. Each of the guarantees ranks senior in right of payment to all of the applicable subsidiary guarantor's future debt that is expressly subordinated in right of payment to such guarantee, and ranks equally in right of payment with all of such subsidiary guarantor's existing and future liabilities that are not so subordinated, including the applicable subsidiary guarantor's guarantee of our obligations under our revolving credit facility.
The senior notes and the related guarantees are secured on a first-priority basis along with our obligations under our revolving credit facility by substantially all of our and the subsidiary guarantors' assets, subject to certain exceptions and permitted liens, including liens securing the Alabama Facility. In the event of enforcement of the liens securing the senior notes and the related guarantees, the proceeds thereof will first be applied to repay obligations under our revolving credit facility. The senior notes and the related guarantees are structurally subordinated to all existing and future liabilities (including trade payables) and preferred shares of any of our subsidiaries that do not guarantee the senior notes, and effectively senior to our and the subsidiary guarantors' indebtedness that is unsecured or that is secured by junior liens to the extent of the value of the collateral securing the senior notes and the related guarantees (after giving effect to permitted liens and the application of proceeds to repay obligations under our revolving credit facility).
Prior to May 1, 2015, we may redeem some or all of the senior notes at a redemption price equal to 100% of the principal amount plus accrued and unpaid interest, if any, to the redemption date, plus an applicable "make whole" premium amount. We may redeem the senior notes for a price of 105.375% beginning on May 1, 2015, 102.688% beginning on May 1, 2016 and 100% beginning on May 1, 2017, in each case, plus accrued and unpaid interest. Prior to May 1, 2014, we may also redeem up to 35% of the aggregate principal amount of the senior notes with the net proceeds from certain equity offerings. During each 12-month period commencing on the issue date of the senior notes and ending on or prior to May 1, 2015, we may also redeem up to 10% of the aggregate principal amount of the senior notes, at a price equal to 103% of the aggregate principal amount of the senior notes being redeemed, plus accrued and unpaid interest, if any. Upon the occurrence of certain events constituting a change of control, we may be required to make an offer to repurchase the senior notes at a price equal to 101% of their principal amount, plus accrued and unpaid interest, if any.
The indenture governing the senior notes contains covenants that limit our and our restricted subsidiaries' ability to, among other things, incur additional indebtedness, issue preferred shares, pay dividends, redeem debt, make certain loans or investments, enter into agreements to restrict distributions from subsidiaries, sell assets, incur liens, and consolidate or merge with another entity.
138
General
The following is a summary of the rights of our capital stock, certain provisions of our articles of incorporation and our code of regulations that will be effective upon the completion of this offering, and certain provisions of applicable law. For more detailed information, please see our articles of incorporation and code of regulations, which are filed as exhibits to the registration statement of which this prospectus is a part.
Authorized Capitalization
Immediately following the completion of this offering, our authorized capital stock will consist of shares, with a par value of $0.01 per share, of which:
- •
- 300,000,000 shares will be designated as common shares; and
- •
- 3,000,000 shares will be designated as preferred shares.
Common Shares
Following the completion of this offering, each outstanding common share will be entitled to one vote on all matters submitted to a vote of shareholders. Pursuant to our articles of incorporation, holders of our common shares will not have the right to cumulate votes in elections of directors. Subject to preferences that may be applicable to any outstanding preferred shares, holders of our common shares will be entitled to receive ratably such dividends as may be declared from time to time by our board of directors out of legally available funds. For additional information, see "Dividend Policy". In the event of our liquidation, dissolution or winding up, holders of common shares will be entitled to share ratably in all assets remaining after payment of liabilities and any amounts due to the holders of preferred shares. Holders of our common shares will have no preemptive, conversion or subscription rights. No redemption or sinking fund provisions will apply to our common shares. All common shares to be outstanding upon completion of this offering will be fully paid and non-assessable.
Preferred Shares
Our articles of incorporation authorize our board of directors, without shareholder approval, to designate and issue up to 3,000,000 preferred shares in one or more series and to fix the rights, preferences, privileges and restrictions granted to or imposed upon each such series of preferred shares, including voting rights, dividend rights, conversion rights, terms of redemption, liquidation preference, sinking fund terms, subscription rights and the number of shares constituting any series or the designation of a series. Our board of directors can issue, without shareholder approval, preferred shares with voting and conversion rights that could adversely affect the voting power of the holders of common shares and reduce the likelihood that such holders will receive dividend payments or payments upon liquidation. Such issuance could have the effect of decreasing the market price of the common shares. The issuance of preferred shares or even the ability to issue preferred shares could also have the effect of delaying, deterring or preventing a change of control or other corporate action. Immediately after the completion of this offering, no preferred shares will be outstanding, and we currently have no plans to issue any preferred shares.
Registration Rights
Our shareholders have certain registration right under the Shareholders Agreement, dated as of April 29, 2011, among us and our shareholders. Diamond Castle has demand registration rights with respect to the common shares it owns. Golden Gate Capital has demand registration rights with respect
139
to the common shares it owns upon the earlier of (i) six months after Diamond Castle consummates a demand registration and (ii) one year after the consummation of an initial public offering of our common shares. We are not obligated to effect (a) more than five demand registrations by Diamond Castle, (b) more than two demand registrations by Golden Gate Capital, (c) any demand registration unless the aggregate gross proceeds expected to received from the sale of the securities requested to be included by all registering shareholders in such demand registration are at least $50 million (unless such securities identified in the demand registration constitute all remaining securities held by the requesting shareholder) or (d) more than one demand registration during any six-month period. We may postpone the filing of a registration statement for up to 90 days no more than twice and for no more than 120 days in the aggregate in any twelve-month period if our board of directors determines in good faith that the filing would be materially detrimental to us or our ability to effect a proposed material acquisition, disposition, financing, reorganization, recapitalization or similar transaction.
If we register any securities for public sale, our shareholders have piggyback registration rights under the Shareholders Agreement to include their shares in the registration, subject to specified exceptions. We must pay all expenses, except for underwriters' discounts and selling commissions, incurred in connection with the exercise of these piggyback registration rights.
Anti-Takeover Effects of Our Articles of Incorporation and Code of Regulations and Ohio Law
Articles of Incorporation and Code of Regulations
Certain provisions of our articles of incorporation and code of regulations could have anti-takeover effects. These provisions are intended to enhance the likelihood of continuity and stability in the composition of our corporate policies formulated by our board of directors. In addition, these provisions also are intended to ensure that our board of directors will have sufficient time to act in what our board of directors believes to be in the best interests of us and our shareholders. These provisions also are designed to reduce our vulnerability to an unsolicited proposal for our takeover that does not contemplate the acquisition of all of our outstanding shares or an unsolicited proposal for the restructuring or sale of all or part of us. These provisions are also intended to discourage certain tactics that may be used in proxy fights. However, these provisions could delay or frustrate the removal of incumbent directors or the assumption of control of us by the holder of a large block of common shares, and could also discourage or make more difficult a merger, tender offer, or proxy contest, even if such event would be favorable to the interests of our shareholders.
Special Meetings
Our code of regulations provide that special meetings of the shareholders may be called only upon the written request of not less than 25% of the combined voting power of the voting shares, upon the request of a majority of the board of directors by action at a meeting or a majority of the incumbent directors acting without a meeting, upon the request of the chairman of the board, the chief executive officer or the president, or, in case of the president's death, absence or disability, the vice president, if any, authorized to exercise the authority of the president. These provisions may have the effect of deferring, delaying or discouraging hostile takeovers or changes in control or management of our company.
Advance Notice Requirements for Shareholder Proposals and Director Nominees
Our code of regulations will establish an advance notice procedure for our shareholders to make nominations of candidates for election as directors or to bring other business before an annual meeting of our shareholders. The shareholder notice procedure will provide that only shareholder nominees to the board of directors who are nominated by a shareholder who is entitled to vote on such election and who has given timely written notice to our Secretary prior to the meeting at which directors are to be
140
elected, will be eligible for election as our directors. The shareholder notice procedure will also provide that at an annual meeting of our shareholders, only such business proposed by a shareholder to be acted upon may be conducted as has been brought before the meeting by a shareholder who is entitled to vote on such business and who has given timely written notice to our Secretary of such shareholder's intention to bring such business before such meeting. Under the shareholder notice procedure, if a shareholder desires to submit a proposal or nominate persons for election as directors at an annual meeting, the shareholder must submit written notice to us in accordance with the requirements set forth in our code of regulations. This provision may have the effect of precluding the conduct of certain business at a meeting if the proper notice is not timely provided and may also discourage or deter a potential acquirer from conducting a solicitation of proxies to elect the acquirer's own slate of directors or otherwise attempting to obtain control of us.
Removal; Filling Vacancies
Our code of regulations will authorize our board of directors to fill any vacancies that occur in our board of directors. A director so elected by our board of directors to fill a vacancy or a newly created directorship holds office until his successor is elected and qualified or until the director's earlier death, resignation, removal, disqualification or otherwise. Our code of regulations will also provide that directors may be removed only for cause or, without assigning any cause, by the vote of the holders of not less than a majority of the voting power. The effect of these provisions is to limit shareholder ability to remove incumbent directors and simultaneously gain control of our board of directors by filling the vacancies created by such removal with its or their own nominees.
Authorized but Unissued Shares
Our authorized but unissued common shares and preferred shares will be available for future issuance without shareholder approval. We may use additional shares for a variety of corporate purposes, including future public offerings to raise additional capital, corporate acquisitions and employee benefit plans. The existence of authorized but unissued common shares and preferred shares could render more difficult or discourage an attempt to obtain control of us by means of a proxy context, tender offer, merger or otherwise.
Indemnification
We include in our code of regulations provisions to indemnify our directors and officers to the fullest extent permitted by the Ohio Revised Code. We believe that these provisions are necessary to attract and retain qualified persons as directors and officers. We have obtained insurance that insures our directors and officers against certain losses and which insures us against our obligations to indemnify the directors and officers.
Control Share Acquisitions
After the completion of this offering, we will be an issuing public company subject to Section 1701.831 of the Ohio Revised Code, known as the "Ohio Control Share Acquisition Statute". This statute provides that certain notice and informational filings and special shareholder meeting and voting procedures must be followed prior to any person's acquisition of our shares that would entitle the acquirer, directly or indirectly, alone or acting with others, to exercise or direct the voting power of the company in the election of directors within any of the following ranges: (1) one-fifth or more but less than one-third of that voting power, (2) one-third or more but less than a majority of that voting power or (3) a majority or more of that voting power. Under the statute, a control share acquisition must be approved at a special meeting of the shareholders, at which a quorum is present, by at least a majority of the voting power of the company in the election of directors represented at the meeting and by the holders of at least a majority of the portion of the voting power excluding the voting power
141
of certain "interested shares". Interested shares include shares owned by the acquirer, by officers elected or appointed by our directors and by our directors who also are our employees.
Merger Moratorium Statute
As an issuing public company, we also will be subject to Chapter 1704 of the Ohio Revised Code, known as the "Merger Moratorium Statute". This statute prohibits certain transactions if they involve both us and a person that is an "interested shareholder" (or anyone affiliated or associated with an "interested shareholder"), unless the board of directors has approved, prior to the person becoming an interested shareholder, either the transaction or the acquisition of shares pursuant to which the person became an interested shareholder. An interested shareholder is any person who is the beneficial owner of a sufficient number of shares to allow such person, directly or indirectly, alone or acting with others, to exercise or direct the exercise of 10% of the voting power of the company in the election of directors. The prohibition imposed on a person by Chapter 1704 is absolute for at least three years from the interested shareholder's acquisition date and continues indefinitely thereafter unless (1) the acquisition of shares pursuant to which the person became an interested shareholder received the prior approval of our board of directors, (2) the Chapter 1704 transaction is approved by the holders of shares entitled to exercise at least two-thirds of the voting power of the company (which our articles of incorporation have reduced to a majority of our voting power) in the election of directors, including shares representing at least a majority of voting shares that are not beneficially owned by an interested shareholder or an affiliate or associate of an interested shareholder or (3) the Chapter 1704 transaction satisfies statutory conditions relating to the fairness of the consideration to be received by our shareholders.
Amendment of Articles of Incorporation
Except as otherwise provided by law or our articles of incorporation, our articles of incorporation may be amended at a duly convened meeting of our shareholders held for such purpose by the affirmative vote of the holders of shares entitling them to exercise not less than a majority of the voting power of the Company on such proposal, unless otherwise expressly required by statute, and by the affirmative vote of shares of any particular class that is required by our articles of incorporation or by statute.
Amendment of Code of Regulations
Except as otherwise provided by law, our articles of incorporation or our code of regulations, our code of regulations may be amended at a duly convened meeting of shareholders held for such purpose, by the affirmative vote of the holders of shares entitling them to exercise not less than a majority of the voting power of the company on such proposal, or without a meeting by the written consent of the holders of shares entitling them to exercise not less than a majority of the voting power of the company on such proposal. In addition, unless a provision of the Ohio Revised Code reserves such authority to our shareholders, our code of regulations may be amended, or new code of regulations may be adopted, by our directors; provided, however, that the foregoing shall not divest our shareholders of the power, or limit the shareholders' power, to amend our code of regulations or adopt a new code of regulations.
Transfer Agent and Registrar
We have appointed Continental Stock Transfer & Trust Company as the transfer agent and registrar for our common shares.
Listing
We have applied to list our common shares on The Nasdaq Global Market under the symbol "CCFI".
142
SHARES ELIGIBLE FOR FUTURE SALE
Until the consummation of this offering, there will be no market for our common shares. We can make no predictions as to the effect, if any, that sales of common shares or the availability of common shares for sale will have on the market price of our common shares prevailing from time to time. Nevertheless, sales of significant amounts of our common shares in the public market, or the perception that such sales may occur, could adversely affect prevailing market prices.
If permitted under our current and future agreements, including agreements governing our debt, we may issue common shares from time to time as consideration for acquisitions, investments or other transactions. In the event any such acquisition, investment or other transaction is significant, the number of shares that we may issue may be significant, which may have an adverse effect on the market price of our common shares. In addition, we may also grant registration rights covering those common shares issued in connection with any such acquisition, investment or other transaction.
Sale of Restricted Shares
After giving effect to this offering, we will have 18,648,203 common shares outstanding, assuming no exercise of the underwriters' overallotment option. The 10,666,667 common shares being sold in this offering will be freely tradeable without restriction under the Securities Act, except for any such shares that may be held or acquired by an "affiliate" of ours, as that term is defined in Rule 144 promulgated under the Securities Act, which shares will be subject to the volume limitations and other restrictions of Rule 144 described below. The remaining 7,981,536 common shares held by our existing shareholders upon completion of this offering, other than those subject to the underwriters' option to purchase additional shares to the extent it is exercised, will be "restricted securities" as that phrase is defined in Rule 144, and may not be resold, in the absence of registration under the Securities Act, except pursuant to an exemption from such registration, including the exemption provided by Rule 144 under the Securities Act, which rule is summarized below. All of these restricted securities will be subject to the lock-up agreements described below.
Beginning 180 days after the date of this prospectus, subject to certain exceptions, common shares that are subject to lock-up agreements will be eligible for sale pursuant to the holding period requirements and, in the case of our affiliates, the volume limitations, imposed by Rule 144. See "Underwriting".
Rule 144
In general, under Rule 144, as currently in effect, once we have been subject to public company reporting requirements for at least 90 days, a person who is not deemed to have been one of our affiliates for purposes of the Securities Act at any time during the three months preceding a sale and who has beneficially owned the shares proposed to be sold for at least six months, including the holding period of any prior owner other than our affiliates, is entitled to sell those shares without complying with the manner of sale, volume limitation or notice provisions of Rule 144, subject to compliance with the public information requirements of Rule 144. If such a person has beneficially owned the shares proposed to be sold for at least one year, including the holding period of any prior owner other than our affiliates, then that person is entitled to sell those shares under Rule 144 without complying with any of the other requirements of Rule 144.
In general, under Rule 144, as currently in effect, our affiliates or persons selling shares on behalf of our affiliates who have beneficially owned the shares proposed to be sold for at least six months are
143
entitled to sell upon expiration of the lock-up agreements described below, within any three-month period, a number of shares that does not exceed the greater of:
- •
- 1% of the number of common shares then outstanding, which will equal 186,482 shares immediately after this offering;
or
- •
- the average weekly trading volume of common shares during the four calendar weeks preceding the filing of a notice on Form 144 with respect to that sale.
Sales under Rule 144 by our affiliates or persons selling shares on behalf of our affiliates are also subject to certain manner of sale provisions and notice requirements and to the availability of current public information about us.
Lock-up Agreements
Notwithstanding the foregoing, we, our executive officers, directors and our existing shareholders and option holders have agreed not to offer, sell, contract to sell, pledge or otherwise dispose of, directly or indirectly, any common shares or securities convertible into or exchangeable or exercisable for our common shares for a period of 180 days after the date of this prospectus subject to certain exceptions, without the prior written consent of Credit Suisse Securities (USA) LLC, on behalf of the underwriters. This lock-up period may be extended in certain circumstances. See "Underwriting".
Registration Rights
The current holders of our common shares will be entitled to various rights with respect to the registration of these shares under the Securities Act, including the shares that may be offered by the selling shareholders in this offering in connection with any exercise of the underwriters' overallotment option. Registration of these shares under the Securities Act would result in these shares becoming fully tradable without restriction under the Securities Act immediately upon the effectiveness of the registration. See "Description of Capital Stock—Registration Rights" for additional information.
144
MATERIAL U.S. FEDERAL INCOME TAX CONSIDERATIONS
APPLICABLE TO NON-U.S. HOLDERS
The following is a summary of the material U.S. federal income tax considerations related to the purchase, ownership and disposition of our common shares by non-U.S. holders (as defined below) of our common shares, but does not purport to be a complete analysis of all the potential tax considerations relating thereto. This summary is based upon the provisions of the Internal Revenue Code of 1986, as amended, or the Code, the applicable U.S. federal income tax regulations promulgated or proposed under the Code, which we refer to as the Treasury Regulations, current administrative rulings and practice and judicial decisions, all as of the date hereof. These authorities are subject to change and differing interpretations at any time, possibly with retroactive effect, which could result in U.S. federal income tax consequences different from those set forth below. This summary is applicable only to non-U.S. holders (as defined below) who purchased shares in this offering and hold our common shares as a capital asset for U.S. federal income tax purposes. We have not sought any ruling from the Internal Revenue Service, or the IRS, with respect to the statements made and the conclusions reached in the following summary, and there can be no assurance that the IRS would not assert, or that a court would not sustain, a position contrary to such statements and conclusions.
This summary also does not address any possible applicability of any U.S. federal tax other than the income tax, including but not limited to the U.S. federal estate tax or gift tax, U.S. alternative minimum tax, or the tax considerations arising under the laws of any non-U.S., state or local jurisdiction. In addition, this discussion does not address tax considerations applicable to an investor's particular circumstances or to investors that may be subject to special tax rules, including, without limitation:
- •
- banks, financial institutions, insurance companies, brokers and certain dealers and traders;
- •
- persons who hold our common shares as part of a position in a hedging or constructive sale transaction, "straddle",
"conversion" or other integrated transaction for tax purposes;
- •
- investors subject to the alternative minimum tax;
- •
- "controlled foreign corporations" and "passive foreign investment companies";
- •
- persons who are partnerships or other pass-through entities or investors therein; and
- •
- certain former citizens or expatriates of the United States.
THIS SUMMARY OF UNITED STATES FEDERAL INCOME TAX CONSIDERATIONS IS FOR GENERAL INFORMATION ONLY AND IS NOT LEGAL OR TAX ADVICE. YOU ARE URGED TO CONSULT YOUR TAX ADVISOR WITH RESPECT TO THE APPLICATION OF THE U.S. FEDERAL INCOME TAX LAWS TO YOUR PARTICULAR SITUATION, AS WELL AS ANY TAX CONSEQUENCES OF THE PURCHASE, OWNERSHIP AND DISPOSITION OF OUR COMMON SHARES ARISING UNDER THE U.S. FEDERAL ESTATE OR GIFT TAX RULES, THE U.S. ALTERNATIVE MINIMUM TAX RULES, OR UNDER THE LAWS OF ANY STATE, LOCAL, NON- U.S. OR OTHER TAXING JURISDICTION OR UNDER ANY APPLICABLE TAX TREATY.
Non-U.S. holder defined
For purposes of this discussion, you are a non-U.S. holder if you are a beneficial holder of our common shares and, for U.S. federal income tax purposes, are neither a "United States holder" nor a partnership (or an entity or arrangement treated as a partnership for U.S. federal income tax purposes). A "United States holder" is:
- •
- an individual citizen or resident of the United States;
145
- •
- a corporation or other entity taxable as a corporation for U.S. federal income tax purposes that is created or organized
in or under the laws of the United States, any state thereof or the District of Columbia;
- •
- an estate whose income is subject to U.S. federal income tax regardless of its source; or
- •
- a trust if it (1) is subject to the primary supervision of a court within the United States and one or more United States persons have the authority to control all substantial decisions of the trust or (2) has a valid election in effect under applicable Treasury Regulations to be treated as a United States person.
If a partnership, including any entity or arrangement treated as a partnership for U.S. federal income tax purposes, is a holder of our common shares, then the tax treatment of a partner in such partnership generally will depend upon the status of the partner and the activities of the partnership. Persons who are partners of a partnership holding our common shares should consult their own tax advisors concerning the tax consequences of holding and disposing of our common shares.
Distributions
Following this offering, we do not intend to make any distributions on our common shares. However, if we do make distributions on our common shares, other than certain pro rata distributions of common shares, then those payments would constitute dividends for U.S. federal income tax purposes to the extent payable from our current or accumulated earnings and profits, as determined under U.S. federal income tax principles, as of the end of the taxable year of the distribution. To the extent those distributions exceed both our current and our accumulated earnings and profits, such distributions would first constitute a non-taxable return of capital, which would reduce your tax basis in your common shares, but not below zero, and thereafter would be treated as gain from the sale of shares. See the discussion under "—Gain on the sale or taxable disposition of common shares" below.
Any dividend on our common shares paid to you generally will be subject to U.S. withholding tax at a rate of 30% of the gross amount of the dividend, subject to any exemption or lower rate as may be specified by an applicable tax treaty, unless the dividends are effectively connected with the conduct by you of a trade or business within the United States. We may withhold 30% of either (i) the gross amount of the entire distribution, even if the amount of the distribution is greater than the amount constituting a dividend once determined, as described above or (ii) the amount of the distribution we project will be a dividend, based upon a reasonable estimate of both our current and our accumulated earnings and profits for the taxable year in which the distribution is made, in each case as provided for in the Treasury Regulations. If it is subsequently determined that the amount of tax withheld exceeds the amount of withholding tax applicable to the portion of the distribution constituting a dividend, then you may obtain a refund of any such excess amounts if you timely file an appropriate claim for refund with the IRS.
In order to receive a reduced rate of or an exemption from withholding tax under an income tax treaty, you are required (i) to satisfy certain certification requirements, which may be met by providing us or our agent with an IRS Form W-8BEN (or other applicable form) certifying, under penalty of perjury, as to your qualification for the reduced rate or exemption and that you are not a United States person or (ii) if you hold our common shares through certain non-U.S. intermediaries, to satisfy the relevant certification requirements of the Treasury Regulations. Special certification and other requirements apply to certain non-U.S. holders that are partnerships or other pass-through entities.
Dividends received by you that are effectively connected with your conduct of a U.S. trade or business (and, if provided for in an applicable income tax treaty, are attributable to a permanent establishment or, in the case of an individual, a fixed base maintained by you in the United States) are not subject to withholding tax, provided that you satisfy certain certification requirements, which may
146
be met by providing us or our agent with an IRS Form W-8ECI (or other applicable form) properly certifying, under penalty of perjury, such exemption. Such effectively connected dividends, although not subject to withholding tax, generally are subject to U.S. federal income tax and are taxed at the same graduated rates applicable to United States persons, net of certain deductions and credits. In addition, if you are a corporate non-U.S. holder receiving effectively connected dividends, your earnings and profits for the taxable year that are effectively connected with your conduct of a U.S. trade or business may also be subject to a branch profits tax at a rate of 30% or such lower rate as may be specified by an applicable tax treaty.
If you are eligible for a reduced rate of or an exemption from withholding tax pursuant to an income tax treaty, then you may obtain a refund of any excess amounts withheld if you timely file an appropriate claim for refund with the IRS.
Gain on the sale or taxable disposition of common shares
Subject to the discussion regarding backup withholding below, you generally will not be subject to U.S. federal income or withholding tax on any gain realized upon the sale or other taxable disposition of our common shares unless:
- •
- that gain is effectively connected with your conduct of a U.S. trade or business and, if required by an applicable income
tax treaty, is attributable to a permanent establishment (or, in the case of an individual, a fixed base) maintained by you in the United States;
- •
- you are a nonresident alien individual who is present in the United States for a period or periods aggregating
183 days or more during the calendar year in which the sale or disposition occurs and certain other conditions are met; or
- •
- our common shares constitute a U.S. real property interest by reason of our status as a "United States real property holding corporation" for U.S. federal income tax purposes, which we refer to as a USRPHC, at any time within the shorter of the five-year period preceding the disposition or your holding period for our common shares.
If you are a non-U.S. holder described in the first bullet above, you generally will be required to pay tax on the net gain derived from the sale or disposition under regular graduated U.S. federal income tax rates, as if you were a United States person, except as otherwise required by an applicable income tax treaty. In addition, corporate non-U.S. holders described in the first bullet above may be subject to an additional branch profits tax at a 30% rate, subject to any exemption or lower rate as may be specified by an applicable tax treaty.
If you are an individual non-U.S. holder described in the second bullet above, you will be subject to tax at a gross rate of 30% on the amount by which your capital gains allocable to U.S. sources, including gain from the sale or other disposition of our common shares, exceed capital losses allocable to U.S. sources, except as otherwise provided in an applicable income tax treaty.
We believe that we are not currently and will not become a USRPHC. However, because the determination of whether we are a USRPHC depends on the fair market value of our U.S. real property interests relative to the sum of the fair market value of our worldwide real property interests and our other assets used or held for use in a trade or business, there can be no assurance that we will not become a USRPHC in the future. Even if we become a USRPHC, however, so long as our common shares are regularly traded on an established securities market, our common shares held by you will be treated as a U.S. real property interest (and gain or loss from the disposition of such interest will be subject to U.S. federal income tax as effectively connected gain or loss) only if you actually or constructively hold more than 5% of such regularly traded common shares at any time within the shorter of the five-year period preceding the disposition or your holding period for the common shares. If you are a non-U.S. holder who may own more than 5% of our common shares, you
147
are encouraged to consult your tax advisor with respect to the U.S. tax consequences of a disposition of our common shares.
Backup withholding and information reporting
We will, where required, report to the IRS and to you the amount of dividends, if any, paid to you on our common shares, your name and address and the amount of tax withheld, if any. Pursuant to tax treaties or other agreements, the IRS may make its reports available to tax authorities in your country of residence.
Payments of dividends made to you generally will be subject to backup withholding unless you establish an exemption, for example by properly certifying your non-U.S. status on a Form W-8BEN or another appropriate version of IRS Form W-8. Notwithstanding the foregoing, backup withholding generally will apply if either we or our paying agent has actual knowledge, or reason to know, that you are a United States person that is not an exempt recipient or that the conditions of any other exemption are not, in fact, satisfied.
Information reporting and, depending on the circumstances, backup withholding will apply to the proceeds of a sale of our common shares within the United States or conducted through certain U.S.-related financial intermediaries, unless you certify under penalty of perjury as to your non-U.S. person status or you otherwise establish an exemption (and neither we nor the paying agent has actual knowledge or reason to know that you are a United States person or that the conditions of any other exemptions are not, in fact, satisfied).
Backup withholding is not an additional tax. Amounts withheld from payments to non-U.S. holders under the backup withholding rules will be allowed as a credit against the holder's U.S. federal income tax liability and may entitle the holder to a refund, provided that the required information is furnished to the IRS in a timely manner.
Recent legislation
The recently enacted Hiring Incentives to Restore Employment Act (the "HIRE Act"), which was signed into law on March 18, 2010, modifies some of the rules described above, including with respect to certification requirements and information reporting, for certain shares held through a "foreign financial institution" or "non-financial foreign entity". Under this legislation, the relevant withholding agent generally may be required to withhold 30% of any dividends and the proceeds of a sale or other disposition of our common shares paid to (i) a foreign financial institution unless such foreign financial institution agrees to verify, report and disclose its U.S. account holders and meets certain other requirements or (ii) a non-financial foreign entity that is the beneficial owner of the payment unless such entity certifies that it does not have any substantial U.S. owners or provides the name, address and taxpayer identification number of each substantial U.S. owner and such entity meets certain other requirements. Although these withholding and reporting requirements generally may apply to payments made after December 31, 2012, the Internal Revenue Service has issued a notice, and the U.S. Treasury Department has released proposed regulations, indicating that any withholding obligations will begin on or after January 1, 2014, with respect to dividends, and January 1, 2015, with respect to gross proceeds. Congress delegated broad authority to the U.S. Treasury Department to promulgate regulations to implement the new withholding and reporting regime. It cannot be predicted whether the proposed regulations will be finalized in their current form, and, therefore, whether or how any regulations promulgated by the U.S. Treasury Department in final form pursuant to this broad delegation of regulatory authority will affect holders of our shares. Prospective investors are urged to consult their own tax advisors regarding the HIRE Act and legislative proposals that may be relevant to their investment in our shares.
148
Under the terms and subject to the conditions contained in an underwriting agreement dated , we have agreed to sell to the underwriters named below, for whom Credit Suisse Securities (USA) LLC is acting as representative, the following respective numbers of common shares:
Underwriter
|
Number of Shares |
||
|---|---|---|---|
Credit Suisse Securities (USA) LLC |
|||
Jefferies & Company, Inc. |
|||
Stephens Inc. |
|||
JMP Securities LLC |
|||
William Blair & Company, L.L.C. |
|||
Total |
10,666,667 | ||
The underwriting agreement provides that the underwriters are obligated to purchase all the common shares in the offering if any are purchased, other than those shares covered by the overallotment option described below. The underwriting agreement also provides that if an underwriter defaults, the purchase commitments of non-defaulting underwriters may be increased or the offering may be terminated.
We and the selling shareholders have granted to the underwriters a 30-day option to purchase up to an aggregate of 1,600,000 additional outstanding shares from us and the selling shareholders at the initial public offering price less the underwriting discounts. The option may be exercised only to cover any overallotments of common shares.
The underwriters propose to offer the common shares initially at the public offering price on the cover page of this prospectus and to selling group members at that price less a selling concession of $ per share. The underwriters and selling group members may allow a discount of $ per share on sales to other broker/dealers. After the initial public offering the representative may change the public offering price and concession and discount to broker/dealers.
The following table summarizes the compensation and estimated expenses we and the selling shareholders will pay:
| |
Per Share | Total | |||||||||||
|---|---|---|---|---|---|---|---|---|---|---|---|---|---|
| |
Without Over-allotment |
With Over-allotment |
Without Over-allotment |
With Over-allotment |
|||||||||
Underwriting Discounts and Commissions paid by us |
$ | $ | $ | $ | |||||||||
Expenses payable by us |
$ | $ | $ | $ | |||||||||
Underwriting Discounts and Commissions paid by selling shareholders |
$ | $ | $ | $ | |||||||||
Expenses payable by the selling shareholders |
$ | $ | $ | $ | |||||||||
The representative has informed us that it does not expect sales to accounts over which the underwriters have discretionary authority to exceed 5% of the number of common shares being offered.
We have agreed that we will not, subject to certain exceptions, offer, sell, contract to sell, pledge or otherwise dispose of, directly or indirectly, or file with the SEC a registration statement under the Securities Act relating to, any of our common shares or securities convertible into or exchangeable or exercisable for any common shares, or publicly disclose the intention to make any offer, sale, pledge, disposition or filing, without the prior written consent of Credit Suisse Securities (USA) LLC, for a period of 180 days after the date of this prospectus. However, in the event that either (1) during the last 17 days of the "lock-up" period, we release earnings results or material news or a material event relating to us occurs or (2) prior to the expiration of the "lock-up" period, we announce that we will
149
release earnings results during the 16-day period beginning on the last day of the "lock-up" period, then in either case the expiration of the "lock-up" will be extended until the expiration of the 18-day period beginning on the date of the release of the earnings results or the occurrence of the material news or event, as applicable, unless Credit Suisse Securities (USA) LLC waives, in writing, such an extension.
The selling shareholders, our executive officers, directors and all of our remaining security holders have agreed that they will not offer, sell, contract to sell, pledge or otherwise dispose of, directly or indirectly, any common shares or securities convertible into or exchangeable or exercisable for any common shares, enter into a transaction that would have the same effect, or enter into any swap, hedge or other arrangement that transfers, in whole or in part, any of the economic consequences of ownership of our common shares, whether any of these transactions are to be settled by delivery of our common shares or other securities, in cash or otherwise, or publicly disclose the intention to make any offer, sale, pledge or disposition, or to enter into any transaction, swap, hedge or other arrangement, without, in each case, the prior written consent of Credit Suisse Securities (USA) LLC for a period of 180 days after the date of this prospectus. However, in the event that either (1) during the last 17 days of the 'lock-up" period, we release earnings results or material news or a material event relating to us occurs or (2) prior to the expiration of the "lock-up" period, we announce that we will release earnings results during the 16-day period beginning on the last day of the "lock-up" period, then in either case the expiration of the "lock-up" will be extended until the expiration of the 18-day period beginning on the date of the release of the earnings results or the occurrence of the material news or event, as applicable, unless Credit Suisse Securities (USA) LLC waives, in writing, such an extension.
We and the selling shareholders have agreed to indemnify the underwriters against liabilities under the Securities Act, or contribute to payments that the underwriters may be required to make in that respect.
We have applied to list the common shares on The Nasdaq Stock Market under the symbol "CCFI".
Prior to this offering, there has been no public market for our common shares. The initial public offering price will be determined by negotiations among us, the selling shareholders and the Representative and will not necessarily reflect the market price of the common shares following this offering. The principal factors that will be considered in determining the initial public offering price will include:
- •
- the information presented in this prospectus and otherwise available to the underwriters;
- •
- the history of, and prospects for, the industry in which we will compete;
- •
- the ability of our management;
- •
- the prospects for our future earnings;
- •
- the present state of our development and our current financial condition;
- •
- the general condition of the securities markets at the time of the offering; and
- •
- the recent market prices of, and the demand for, publicly traded common shares of generally comparable companies.
We cannot assure you that the initial public offering price will correspond to the price at which the common shares will trade in the public market subsequent to this offering or that an active trading market for the common shares will develop and continue after this offering.
In connection with the offering the underwriters may engage in stabilizing transactions, overallotment transactions, syndicate covering transactions and penalty bids in accordance with Regulation M under the Exchange Act.
- •
- Stabilizing transactions permit bids to purchase the underlying security so long as the stabilizing bids do not exceed a specified maximum.
150
- •
- Overallotments involve sales by the underwriters of shares in excess of the number of shares the underwriters are
obligated to purchase, which creates a syndicate short position. The short position may be either a covered short position or a naked short position. In a covered short position, the number of shares
over-allotted by the underwriters is not greater than the number of shares that they may purchase in the overallotment option. In a naked short position, the number of shares involved is
greater than the number of shares in the overallotment option. The underwriters may close out any covered short position by either exercising their overallotment option and/or purchasing shares in the
open market.
- •
- Syndicate covering transactions involve purchases of the common shares in the open market after the distribution has been
completed in order to cover syndicate short positions. In determining the source of shares to close out the short position, the underwriters will consider, among other things, the price of shares
available for purchase in the open market as compared to the price at which they may purchase shares through the overallotment option. If the underwriters sell more shares than could be covered by the
overallotment option, a naked short position, the position can only be closed out by buying shares in the open market. A naked short position is more likely to be created if the underwriters are
concerned that there could be downward pressure on the price of the shares in the open market after pricing that could adversely affect investors who purchase in the offering.
- •
- Penalty bids permit the representative to reclaim a selling concession from a syndicate member when the common shares originally sold by the syndicate member is purchased in a stabilizing or syndicate covering transaction to cover syndicate short positions.
These stabilizing transactions, syndicate covering transactions and penalty bids may have the effect of raising or maintaining the market price of our common shares or preventing or retarding a decline in the market price of the common shares. As a result the price of our common shares may be higher than the price that might otherwise exist in the open market. These transactions may be effected on The Nasdaq Stock Market if commenced, may be discontinued at any time.
A prospectus in electronic format may be made available on the web sites maintained by one or more of the underwriters, or selling group members, if any, participating in this offering and one or more of the underwriters participating in this offering may distribute prospectuses electronically. The representative may agree to allocate a number of shares to underwriters and selling group members for sale to their online brokerage account holders. Internet distributions will be allocated by the underwriters and selling group members that will make internet distributions on the same basis as other allocations.
Other Relationships
Some of the underwriters and their affiliates have engaged in, and may in the future engage in, investment banking and other commercial dealings in the ordinary course of business with us or our affiliates. They have received, or may in the future receive, customary fees and commissions for these transactions. In particular, affiliates of Credit Suisse Securities (USA) LLC and Jefferies & Company, Inc. are lenders, and an affiliate of Credit Suisse Securities (USA) LLC is administrative agent, under our revolving credit facility. Additionally, Credit Suisse Securities (USA) LLC, Jefferies & Company, Inc. and Stephens Inc. were the initial purchasers of our senior notes. We have been advised that certain of the underwriters or their affiliates own a portion of our senior notes and, as a result, will receive a portion of the proceeds from this offering.
In addition, in the ordinary course of their business activities, the underwriters and their affiliates may make or hold a broad array of investments and actively trade debt and equity securities (or related derivative securities) and financial instruments (including bank loans) for their own account and for the accounts of their customers. Such investments and securities activities may involve securities and/or instruments of ours or our affiliates. The underwriters and their affiliates may also make investment
151
recommendations and/or publish or express independent research views in respect of such securities or financial instruments and may hold, or recommend to clients that they acquire, long and/or short positions in such securities and instruments.
European Economic Area
In relation to each Member State of the European Economic Area which has implemented the Prospectus Directive (each, a "Relevant Member State"), with effect from and including the date on which the Prospectus Directive is implemented in that Relevant Member State (the "Relevant Implementation Date") our common shares will not be offered to the public in that Relevant Member State prior to the publication of a prospectus in relation to the common shares which has been approved by the competent authority in that Relevant Member State or, where appropriate, approved in another Relevant Member State and notified to the competent authority in that Relevant Member State, all in accordance with the Prospectus Directive, except that, with effect from and including the Relevant Implementation Date, an offer of common shares may be made to the public in that Relevant Member State at any time:
- •
- to any legal entity which is a qualified investor as defined in the Prospectus Directive;
- •
- to fewer than 100 or, if the Relevant Member State has implemented the relevant provision of the 2010 PD Amending
Directive, 150, natural or legal persons (other than qualified investors as defined in the Prospectus Directive), as permitted under the Prospectus Directive, subject to obtaining the prior consent of
the manager for any such offer; or
- •
- in any other circumstances which do not require the publication by the Issuer of a prospectus pursuant to Article 3(2) of the Prospectus Directive.
For the purposes of this provision, the expression an "offer of common shares to the public" in relation to any shares in any Relevant Member State means the communication in any form and by any means of sufficient information on the terms of the offer and the common shares to be offered so as to enable an investor to decide to purchase or subscribe the common shares, as the same may be varied in that Relevant Member State by any measure implementing the Prospectus Directive in that Relevant Member State and the expression "Prospectus Directive" means Directive 2003/71/EC (and amendments thereto, including the 2010 PD Amending Directive, to the extent implemented in the Relevant Member State), and includes any relevant implementing measure in each Relevant Member State and the expression "2010 PD Amending Directive" means Directive 2010/73/EU.
Notice to Investors in the United Kingdom
Our common shares may not be offered or sold and will not be offered or sold to any persons in the United Kingdom other than persons whose ordinary activities involve them in acquiring, holding, managing or disposing of investments (as principal or as agent) for the purposes of their businesses and in compliance with all applicable provisions of the Financial Services and Markets Act 2000 ("FSMA") with respect to anything done in relation to our common shares in, from or otherwise involving the United Kingdom.
In addition, each underwriter:
- •
- has only communicated or caused to be communicated and will only communicate or cause to be communicated an invitation or
inducement to engage in investment activity (within the meaning of section 21 of FSMA) to persons who have professional experience in matters relating to investments falling within
Article 19(5) of the Financial Services and Markets Act of 2000 (Financial Promotion) Order 2005 or in circumstances in which section 21 of FSMA does not apply to the company;
and
- •
- has complied with, and will comply with all applicable provisions of FSMA with respect to anything done by it in relation to the common shares in, from or otherwise involving the United Kingdom.
152
Certain legal matters in connection with the sale of the common shares offered hereby will be passed upon for us by Jones Day. The underwriters have been represented by Cravath, Swaine & Moore LLP.
The consolidated financial statements of Community Choice Financial Inc. and Subsidiaries appearing in this prospectus and registration statement have been audited by McGladrey LLP (formerly McGladrey & Pullen, LLP), an independent registered public accounting firm, as stated in their report appearing elsewhere herein, which report expresses an unqualified opinion, and are included in reliance upon such report and upon the authority of such firm as experts in accounting and auditing.
The consolidated financial statements of CCCS Corporate Holdings, Inc. and Subsidiaries appearing in this prospectus and registration statement have been audited by McGladrey LLP (formerly McGladrey & Pullen, LLP), an independent certified public accounting firm, as stated in their report appearing elsewhere herein, which report expresses an unqualified opinion, and are included in reliance upon such report and upon the authority of such firm as experts in accounting and auditing.
WHERE YOU CAN FIND MORE INFORMATION
We have filed with the SEC a registration statement on Form S-1 under the Securities Act that registers our common shares to be sold in this offering. This prospectus, filed as a part of the registration statement, does not contain all of the information set forth in the registration statement and exhibits and schedules, certain parts of which are omitted in accordance with the rules and regulations of the SEC. For further information about us and the common shares to be sold in this offering, please refer to the registration statement. Statements contained in this prospectus as to the contents of any agreement or any other document referred to are not necessarily complete and, in each instance, we refer you to the copy of the agreement or other document filed as an exhibit to the registration statement. Each of these statements is qualified in all respects by this reference.
You may read and copy the registration statement and the exhibits and schedules to the registration statement at the public reference room maintained by the SEC at 100 F Street, N.E., Washington, D.C. 20549. Please call the SEC at 1-800-SEC-0330 for further information regarding the public reference room. You may also obtain copies of all or part of the registration statement by mail from the Public Reference Section of the SEC at prescribed rates.
The SEC also maintains a website that contains reports, proxy and information statements and other information about issuers, including our company, that file electronically with the SEC. The address of that website is www.sec.gov.
Upon completion of this offering, we will be subject to the information reporting requirements of the Exchange Act and we will be required to file reports, proxy statements and other information with the SEC. We intend to furnish our shareholders with annual reports containing consolidated financial statements certified by an independent public accounting firm.
153
INDEX TO CONSOLIDATED FINANCIAL STATEMENTS
F-1

Report of Independent Registered Public Accounting Firm
To
the Board of Directors and Stockholders
Community Choice Financial Inc. and Subsidiaries
We have audited the accompanying consolidated balance sheets of Community Choice Financial Inc. and Subsidiaries (formerly CheckSmart Financial Holding Corp. and Subsidiaries) as of December 31, 2011 and 2010, and the related consolidated statements of income, stockholders' equity, and cash flows for the years then ended December 31, 2011, 2010, and 2009. These financial statements are the responsibility of the Company's management. Our responsibility is to express an opinion on these financial statements based on our audits.
We conducted our audits in accordance with the standards of the Public Company Accounting Oversight Board (United States). Those standards require that we plan and perform the audit to obtain reasonable assurance about whether the financial statements are free of material misstatement. The Company is not required to have, nor were we engaged to perform an audit of its internal control over financial reporting. Our audits included consideration of internal control over financial reporting as a basis for designing audit procedures that are appropriate in the circumstances, but not for the purpose of expressing an opinion on the effectiveness of the Company's internal control over financial reporting. Accordingly, we express no such opinion. An audit also includes examining, on a test basis, evidence supporting the amounts and disclosures in the financial statements, assessing the accounting principles used and significant estimates made by management, as well as evaluating the overall financial statement presentation. We believe that our audits provide a reasonable basis for our opinion.
In our opinion, the consolidated financial statements referred to above present fairly, in all material respects, the financial position of Community Choice Financial Inc. and Subsidiaries (formerly CheckSmart Financial Holding Corp. and Subsidiaries) as of December 31, 2011 and 2010, and the results of its operations and its cash flows for the years ended December 31, 2011, 2010, and 2009, in conformity with U.S. generally accepted accounting principles.
/s/ McGladrey LLP
Raleigh, North Carolina
March 29, 2012, except for Note 23 as to which the date is May 7, 2012.
F-2
Community Choice Financial Inc. and Subsidiaries
Consolidated Balance Sheets
December 31, 2011 and 2010
(In thousands, except per share data)
| |
2011 | 2010 | |||||
|---|---|---|---|---|---|---|---|
Assets |
|||||||
Current Assets |
|||||||
Cash and cash equivalents |
$ | 65,635 | $ | 39,780 | |||
Finance receivables, net |
120,451 | 81,337 | |||||
Short-term investments, certificates of deposit |
1,110 | 1,814 | |||||
Prepaid money orders |
— | 8,030 | |||||
Card related pre-funding and receivables |
12,910 | 11,094 | |||||
Other current assets |
5,719 | 3,627 | |||||
Deferred tax asset, net |
1,766 | 2,147 | |||||
Total current assets |
207,591 | 147,829 | |||||
Noncurrent Assets |
|||||||
Leasehold improvements and equipment, net |
19,661 | 15,155 | |||||
Goodwill and other identified intangibles |
259,541 | 140,480 | |||||
Security deposits |
1,591 | 1,130 | |||||
Equity method investments |
11,109 | — | |||||
Deferred tax asset, net |
1,475 | 4,865 | |||||
Deferred debt issuance costs |
14,579 | 1,185 | |||||
Total assets |
$ | 515,547 | $ | 310,644 | |||
Liabilities and Stockholders' Equity |
|||||||
Current Liabilities |
|||||||
Notes payable |
$ | — | $ | 17,573 | |||
Deferred revenue |
2,654 | 714 | |||||
Accrued interest |
7,153 | 339 | |||||
Money orders payable |
18,340 | 4,049 | |||||
Accounts payable and accrued liabilities |
20,474 | 6,458 | |||||
Total current liabilities |
48,621 | 29,133 | |||||
Noncurrent Liabilities |
|||||||
Notes payable |
395,000 | 171,361 | |||||
Deferred revenue |
10,612 | 359 | |||||
Total liabilities |
454,233 | 200,853 | |||||
Commitments and Contingencies |
|||||||
Stockholders' Equity |
|||||||
Preferred stock, par value $.01 per share, 3,000 shares authorized, no shares issued and outstanding |
— | — | |||||
Common stock, par value $.01 per share, 300,000 and 7,200 authorized shares at December 31, 2011 and 2010, 7,982 and 6,140 outstanding shares at December 31, 2011 and 2010 |
80 | 61 | |||||
Additional paid-in capital |
113,250 | 57,972 | |||||
Retained earnings (deficit) |
(52,016 | ) | 51,577 | ||||
Non-controlling interests |
— | 181 | |||||
Total stockholders' equity |
61,314 | 109,791 | |||||
Total liabilities and stockholders' equity |
$ | 515,547 | $ | 310,644 | |||
See Notes to Consolidated Financial Statements.
F-3
Community Choice Financial Inc. and Subsidiaries
Consolidated Statements of Income
Years Ended December 31, 2011, 2010, and 2009
(In thousands, except per share data)
| |
2011 | 2010 | 2009 | |||||||
|---|---|---|---|---|---|---|---|---|---|---|
Revenues: |
||||||||||
Finance receivable fees |
$ | 196,153 | $ | 146,059 | $ | 136,957 | ||||
Check cashing fees |
72,800 | 55,930 | 53,049 | |||||||
Card fees |
19,914 | 10,731 | 2,063 | |||||||
Other |
18,067 | 11,560 | 10,614 | |||||||
Total revenues |
306,934 | 224,280 | 202,683 | |||||||
Branch expenses: |
||||||||||
Salaries and benefits |
57,411 | 38,759 | 34,343 | |||||||
Provision for loan losses |
65,351 | 40,316 | 43,463 | |||||||
Occupancy |
21,216 | 14,813 | 13,855 | |||||||
Depreciation and amortization |
5,907 | 5,318 | 6,613 | |||||||
Other |
35,515 | 27,994 | 22,652 | |||||||
Total branch expenses |
185,400 | 127,200 | 120,926 | |||||||
Branch gross profit |
121,534 | 97,080 | 81,757 | |||||||
Corporate expenses |
44,742 | 33,940 | 31,518 | |||||||
Transaction expenses |
9,351 | 237 | — | |||||||
Depreciation and amortization |
2,332 | 1,222 | 568 | |||||||
Interest expense, net |
34,334 | 8,501 | 11,532 | |||||||
Loss on equity method investments |
415 | — | — | |||||||
Nonoperating income, related party management fees |
(46 | ) | (46 | ) | (172 | ) | ||||
Income before income taxes and discontinued operations |
30,406 | 53,226 | 38,311 | |||||||
Provision for income taxes |
13,553 |
19,801 |
14,042 |
|||||||
Income from continuing operations |
16,853 | 33,425 | 24,269 | |||||||
Discontinued operations (net of provision (benefit) for income tax of $0, ($1,346), and $226) |
— |
(2,196 |
) |
368 |
||||||
Net income |
16,853 | 31,229 | 24,637 | |||||||
Net loss attributable to non-controlling interests |
(120 | ) | (252 | ) | — | |||||
Net income attributable to controlling interests |
$ | 16,973 | $ | 31,481 | $ | 24,637 | ||||
Earnings per share—basic |
||||||||||
Operating income available to controlling interests—per share |
$ | 2.30 | $ | 5.49 | $ | 3.95 | ||||
Discontinued operations—per share |
— | (.36 | ) | 0.06 | ||||||
Net income available to controlling interests—per share |
$ | 2.30 | $ | 5.13 | $ | 4.01 | ||||
Earnings per share—diluted |
||||||||||
Operating income available to controlling interests—per share |
$ | 2.21 | $ | 5.33 | $ | 3.88 | ||||
Discontinued operations—per share |
— | (.34 | ) | 0.06 | ||||||
Net income available to controlling interests—per share |
$ | 2.21 | $ | 4.99 | $ | 3.94 | ||||
Weighted average common shares outstanding—basic |
7,380,996 | 6,139,536 | 6,139,536 | |||||||
Weighted average common shares outstanding—diluted |
7,686,072 | 6,314,358 | 6,251,316 | |||||||
See Notes to Consolidated Financial Statements.
F-4
Consolidated Statements of Stockholders' Equity
Years Ended December 31, 2011, 2010, and 2009
(Dollars in thousands)
| |
|
|
|
|
|
Accumulated Other Comprehensive Income (Loss) |
|
|
|||||||||||||||||
|---|---|---|---|---|---|---|---|---|---|---|---|---|---|---|---|---|---|---|---|---|---|---|---|---|---|
| |
Common Stock | |
|
|
|
|
|||||||||||||||||||
| |
Additional Paid-In Capital |
Retained Earnings (Deficit) |
Non-Controlling Interest |
Comprehensive Income |
|
||||||||||||||||||||
| |
Shares | Amount | Total | ||||||||||||||||||||||
Balance, December 31, 2008 |
6,139,536 | $ | 61 | $ | 56,577 | $ | (4,541 | ) | $ | — | $ | (1,329 | ) | $ | — | $ | 50,768 | ||||||||
Stock-based compensation expense |
— | — | 1,057 | — | — | — | — | 1,057 | |||||||||||||||||
Net income |
— | — | — | 24,637 | — | — | 24,637 | 24,637 | |||||||||||||||||
Unrealized gain on derivative instruments, net of tax, $815 |
— | — | — | — | — | 1,329 | 1,329 | 1,329 | |||||||||||||||||
Comprehensive income for the year ended December 31, 2009 |
$ | 25,966 | |||||||||||||||||||||||
Balance, December 31, 2009 |
6,139,536 | 61 | 57,634 | 20,096 | — | — | 77,791 | ||||||||||||||||||
Stock-based compensation expense |
— | — | 338 | — | — | — | — | 338 | |||||||||||||||||
Net income (loss) |
— | — | — | 31,481 | (252 | ) | — | 31,229 | 31,229 | ||||||||||||||||
Non-controlling interests conversion elimination |
— | — | — | — | 433 | — | — | 433 | |||||||||||||||||
Comprehensive income for the year ended December 31, 2010 |
$ | 31,229 | |||||||||||||||||||||||
Balance, December 31, 2010 |
6,139,536 | 61 | 57,972 | 51,577 | 181 | — | 109,791 | ||||||||||||||||||
Stock-based compensation expense |
— | — | 105 | — | — | — | — | 105 | |||||||||||||||||
Issuance of common stock for merger |
1,842,000 | 19 | 55,173 | — | — | — | — | 55,192 | |||||||||||||||||
Net income (loss) |
— | — | — | 16,973 | (120 | ) | — | 16,853 | 16,853 | ||||||||||||||||
Non-controlling interests conversion elimination |
— | — | — | — | (61 | ) | — | — | (61 | ) | |||||||||||||||
Dividend distribution |
— | — | — | (120,566 | ) | — | — | — | (120,566 | ) | |||||||||||||||
Comprehensive income for the year ended December 31, 2011 |
$ | 16,853 | |||||||||||||||||||||||
Balance, December 31, 2011 |
7,981,536 | $ | 80 | $ | 113,250 | $ | (52,016 | ) | $ | — | $ | — | $ | 61,314 | |||||||||||
See Notes to Consolidated Financial Statements.
F-5
Community Choice Financial Inc. and Subsidiaries
Consolidated Statements of Cash Flows
Years Ended December 31, 2011, 2010, and 2009
(In thousands)
| |
2011 | 2010 | 2009 | |||||||
|---|---|---|---|---|---|---|---|---|---|---|
Cash flows from operating activities |
||||||||||
Net income |
$ | 16,853 | $ | 31,229 | $ | 24,637 | ||||
Adjustments to reconcile net income to net cash provided by operating activities: |
||||||||||
Provision for loan losses |
65,351 | 40,316 | 43,463 | |||||||
Loss on disposal of assets |
34 | — | 361 | |||||||
Loss on equity method investments |
415 | — | — | |||||||
Depreciation |
6,956 | 6,206 | 7,206 | |||||||
Amortization of deferred financing cost |
2,598 | 882 | 958 | |||||||
Amortization of intangibles |
1,283 | 577 | 361 | |||||||
Deferred income taxes |
4,732 | 7,680 | 4,397 | |||||||
Stock-based compensation |
105 | 338 | 1,057 | |||||||
Changes in assets and liabilities: |
||||||||||
Deferred loan origination costs |
(120 | ) | (6 | ) | (32 | ) | ||||
Related party receivables |
— | 7 | 178 | |||||||
Prepaid money orders |
8,030 | 5,523 | (2,086 | ) | ||||||
Card related pre-funding and receivables |
(1,816 | ) | (10,434 | ) | (660 | ) | ||||
Other assets |
(1,378 | ) | 865 | (2,123 | ) | |||||
Deferred revenue |
7,654 | (619 | ) | (700 | ) | |||||
Accrued interest |
6,814 | 228 | (726 | ) | ||||||
Money orders payable |
14,291 | (4,059 | ) | — | ||||||
Accounts payable and accrued expenses |
(979 | ) | 3,636 | (7,465 | ) | |||||
Net cash provided by operating activities |
130,823 | 82,369 | 68,826 | |||||||
Cash flows from investing activities |
||||||||||
Net receivables originated |
(88,773 | ) | (51,617 | ) | (57,011 | ) | ||||
Net acquired assets, net of cash |
3,027 | (3,381 | ) | (484 | ) | |||||
Sale (purchase) of short-term investments |
704 | 1,736 | (3,550 | ) | ||||||
Purchase of equity investments |
(3,750 | ) | — | — | ||||||
Purchase of equity investments from related party |
(7,500 | ) | — | — | ||||||
Purchase of leasehold improvements and equipment |
(4,261 | ) | (1,688 | ) | (2,769 | ) | ||||
Purchase of finance receivables |
— | — | (501 | ) | ||||||
Net cash used in investing activities |
(100,553 | ) | (54,950 | ) | (64,315 | ) | ||||
Cash flows from financing activities |
||||||||||
Net payments on lines of credit |
— | (5,000 | ) | — | ||||||
Proceeds from notes payable |
395,000 | — | — | |||||||
Contributions for non-controlling interest |
— | 433 | — | |||||||
Debt issuance costs |
(15,992 | ) | — | (2,435 | ) | |||||
Net payments of long-term debt |
(262,857 | ) | (11,031 | ) | — | |||||
Dividend distribution |
(120,566 | ) | — | — | ||||||
Net cash used in financing activities |
(4,415 | ) | (15,598 | ) | (2,435 | ) | ||||
Net increase in cash and cash equivalents |
25,855 | 11,821 | 2,076 | |||||||
Cash and cash equivalents: |
||||||||||
Beginning |
39,780 | 27,959 | 25,883 | |||||||
Ending |
$ | 65,635 | $ | 39,780 | $ | 27,959 | ||||
F-6
Community Choice Financial Inc. and Subsidiaries
Consolidated Statements of Cash Flows (Continued)
Years Ended December 31, 2011, 2010, and 2009
(In thousands)
| |
2011 | 2010 | 2009 | |||||||
|---|---|---|---|---|---|---|---|---|---|---|
Supplemental Disclosures of Cash Flow Information |
||||||||||
Cash payments for: |
||||||||||
Interest |
$ | 24,913 | $ | 7,340 | $ | 11,375 | ||||
Income taxes, net of refunds |
$ | 3,770 | $ | 14,366 | $ | 15,817 | ||||
Supplemental Schedule of Noncash Investing and Financing Activities |
||||||||||
Acquisitions (Note 14): |
||||||||||
Purchase price |
$ | 74,917 | $ | 15,900 | $ | 484 | ||||
Fair value of finance receivables acquired |
$ | 15,572 | $ | 3,995 | $ | — | ||||
Fair value of cash acquired |
22,892 | 12,602 | — | |||||||
Fair value of other current assets acquired |
1,510 | 122 | — | |||||||
Fair value of other tangible assets acquired, principally property and equipment |
7,235 | 1,144 | — | |||||||
Fair value of liabilities assumed |
(92,754 | ) | (15,013 | ) | — | |||||
Fair value of other intangible assets acquired, principally non-compete |
3,344 | 1,737 | 160 | |||||||
Cost in excess of net assets acquired |
117,249 | 11,396 | 324 | |||||||
|
75,048 | 15,983 | 484 | |||||||
Less cash acquired |
(22,892 | ) | (12,602 | ) | — | |||||
Fair value of common stock issued for acquired assets |
(55,192 | ) | — | — | ||||||
|
$ | (3,036 | ) | $ | 3,381 | $ | 484 | |||
See Notes to Consolidated Financial Statements
F-7
Community Choice Financial Inc. and Subsidiaries
Notes to Consolidated Financial Statements
(Dollars in thousands, except per share data)
Note 1. Ownership, Nature of Business, and Significant Accounting Policies
Nature of business: Community Choice Financial Inc. (together with its consolidated subsidiaries, "CCFI" or "the Company") was formed on April 6, 2011 under the laws of the State of Ohio by the shareholders of Checksmart Financial Holdings Inc. (together with its consolidated subsidiaries, "Checksmart") to be the holding company of Checksmart Financial Holdings Corp. and to acquire the ownership interests of CCCS Corporate Holdings, Inc. (together with its consolidated subsidiaries, "CCCS") through a merger. The contribution of equity from Checksmart to CCFI is considered to be a merger of entities under common control and as result does not change the basis in accounting. CCFI acquired CCCS through a merger on April 29, 2011 and the acquisition of CCCS has been treated as a business combination. As of December 31, 2011, the Company operated 435 stores in 14 states.
The Company is primarily engaged in the business of providing consumers check cashing and short-term consumer loans. Through a network of retail stores, the Company provides customers a variety of financial products and services, including short-term consumer loans, check cashing, prepaid debit cards, title loans, medium term loans and other services that address the specific needs of its individual customers.
A summary of the Company's significant accounting policies follows:
Basis of consolidation: The accompanying consolidated financial statements include the accounts of Community Choice Financial Inc. and its subsidiaries. All significant intercompany accounts and transactions have been eliminated in consolidation.
Reclassifications: Certain amounts reported in the 2010 and 2009 consolidated financial statements have been reclassified to conform to classifications presented in the 2011 consolidated financial statements, without affecting the previously reported net income or stockholders' equity.
Use of estimates: The preparation of financial statements in conformity with accounting principles generally accepted in the United States of America requires management to make estimates and assumptions that affect the reported amounts of assets and liabilities and disclosure of contingent assets and liabilities at the date of the financial statements and the reported amounts of revenue and expenses during the reporting period. Actual results could differ from those estimates. Material estimates that are particularly susceptible to change relate to the determination of the allowance for loan losses, the valuation of goodwill, the valuation of equity investments, the value of stock based compensation and the valuation of deferred tax assets and liabilities.
Business Segment: FASB Accounting Standards Codification ("ASC") Topic 280 requires that a public enterprise report a measure of segment profit or loss, certain specific revenue and expense items, segment assets, information about the way operating segments were determined and other items. The Company reports operating segments in accordance with FASB ASC Topic 280. Operating segments are components of an enterprise about which separate financial information is available that is evaluated regularly by the chief operating decision maker in determining how to allocate resources and assess performance. For purposes of disclosures required by ASC 280, the Company operates in one segment, retail financial services.
Revenue recognition: All of the Company's branch transactions are processed through its point-of-sale systems. These transactions include check cashing, bill payment, money transfer, money order sales, and other miscellaneous products and services. The full amount of the check
F-8
Community Choice Financial Inc. and Subsidiaries
Notes to Consolidated Financial Statements (Continued)
(Dollars in thousands, except per share data)
Note 1. Ownership, Nature of Business, and Significant Accounting Policies (Continued)
cashing fee is recognized as revenue at the time of the transaction. The Company acts in an agency capacity regarding bill payment services, money transfers, card products, and money orders offered and sold at its branches. The Company records the net amount retained as revenue because the supplier is the primary obligor in the arrangement, the amount earned by the Company is fixed, and the supplier is determined to have the ultimate credit risk. Fees and direct costs incurred for the origination of finance receivables are deferred and amortized over the loan period using the interest method.
Advance fees on short-term consumer loans with terms between 14 and 30 days, title loans with terms up to 30 days and certain medium-term consumer loans with terms between 112 days and 180 days are recognized using the interest (actuarial) method over the term of each loan.
Title loans with terms between 30 days and 24 months, certain medium-term consumer loans with terms of up to 24 months, lines of credit, and loan participations are interest-bearing. Interest and fee income is recognized using the interest (actuarial) method.
As a result of the Company's charge-off policies, accounts are charged-off between 1 and 90 days past due rather than being placed in nonaccrual status.
Cash and cash equivalents: Cash and cash equivalents include cash on hand and short-term investments with original maturities of three months or less. At times, the Company may maintain deposits with banks in amounts in excess of federal depository insurance limits, but believes any such amounts do not represent significant credit risk.
Finance receivables: Finance receivables consist of three categories of receivables, short-term consumer loans, title loans, and medium-term loans.
Short-term consumer loan products provide customers with cash or a money order, typically ranging in size from $.1 to $1, in exchange for a promissory note with a maturity generally 14 to 30 days with an agreement to defer the presentment of the customer's personal check for the aggregate amount of the advance plus fees. This form of lending is based on applicable laws and regulations which vary by state. Statutes vary from providing fees of 15% to 20%, to providing interest at 25% per annum plus origination fees. The customers repay the cash advance by paying cash or allowing the check to be presented. For unsecured loans, the risk of repayment primarily relates to the customer's ability to repay the loans.
Medium-term loans provide customers with cash, typically ranging from $.1 to $2.5 in exchange for a promissory note with a maturity between three months and 24 months. These loans vary in their structure between the regulatory environments where they are offered. The loans are due in installments or provide for a line of credit with periodic monthly payments. In certain instances the Company also purchases loan participations in a third-party lender's loan portfolio which are classified as medium-term finance receivables.
Title loan products provide customers with cash, typically ranging in size from $.75 to $2.5, in exchange for a promissory note with a maturity between 30 days and 24 months. The loan is secured with a lien on the customer's vehicle title. The risk characteristics of secured loans primarily depend on the markets in which the Company operates and the regulatory requirements of each market. Risks associated with secured financings relate to the ability of the borrower to
F-9
Community Choice Financial Inc. and Subsidiaries
Notes to Consolidated Financial Statements (Continued)
(Dollars in thousands, except per share data)
Note 1. Ownership, Nature of Business, and Significant Accounting Policies (Continued)
repay its loans and the value of the collateral underlying the loan should the borrower default on its payments.
Short-term investments, certificates of deposit: Short-term investments consist of certificates of deposit with original maturities of more than three months. Short-term investments are recorded at the carrying value, which approximates fair value and interest is recognized as earned.
Allowance for loan losses: Provisions for loan losses are charged to income in amounts sufficient to cover estimated losses in the loan portfolio. The factors used in assessing the overall adequacy of the allowance and the resulting provision for loan losses for finance receivables include an evaluation by product by market based on historical loan loss experience, overall portfolio quality, current economic conditions that may affect the borrower's ability to pay and management's judgment. While management uses the best information available to make its evaluation, future adjustments to the allowance may be necessary if there are significant changes in economic conditions.
For short-term consumer loans, accounts are charged off when they become past due. The Company's policy dictates that, where a customer has provided a check for presentment upon the maturity of a loan, if the customer has not paid off the loan by the due date, the Company will deposit the customer's check or draft the customer's bank account for the amount due. If the check or draft is returned as uncollected, all accrued fees and outstanding principal are charged-off as uncollectible.
For medium-term loans which have a term of one year or less the Company's policy requires that balances be charged off when accounts are 60 days past due on a contractual basis. For medium-term loans which have an initial maturity of greater than one year, the Company's policy requires that balances be charged off when accounts are 90 days past due on a contractual basis.
For title loans that are 30 days in duration the Company's policy requires that balances be charged off when accounts are 30 days past due on a contractual basis. For title loans that have terms ranging from 60 days to one year, the Company's policy dictates that balances be charged off when accounts are 60 days past due on a contractual basis. For title loans that have terms of greater than 1 year, the Company's policy requires that balances be charged off when accounts are 90 days past due on a contractual basis. The Company charges off 24 month installment loans when they are 90 days past due.
Recoveries of amounts previously charged off are recorded as income in the period in which they are received.
During 2011, the Company introduced additional medium-term loan products, which resulted in a higher proportion of medium-term products in the Company's overall loan portfolio. Effective December 31, 2011, the Company modified its charge-off policies to align the policy with the contractual term of certain title loans and medium-term consumer loans. Prior to this date, all loans were charged-off when the loan became contractually past due. Based on additional information and analysis of current customer payment trends, management determined that the likelihood of receiving payment from a customer greatly diminishes when no payment has been received for 30 days on loans with a term of 30 days, 60 days on loans with a term of 60 days to 12 months, and 90 days for loans with terms greater than 12 months. The net effect of this change
F-10
Community Choice Financial Inc. and Subsidiaries
Notes to Consolidated Financial Statements (Continued)
(Dollars in thousands, except per share data)
Note 1. Ownership, Nature of Business, and Significant Accounting Policies (Continued)
in estimate for the year ended December 31, 2011 was a $53 increase to finance receivables and a $53 decrease to the provision for loan losses, equal to $0.01 per average common share outstanding.
Loans may be charged off earlier than the Company's policy based upon management's review of information for each delinquent or impaired loan. Loan participations are charged off after they become 30 days past due on a contractual basis.
In some instances, the Company may have debt-buying arrangements with third-party lenders. The Company accrues for this obligation through management's estimation of anticipated purchases based on expected losses in the lender's portfolio. This obligation is recorded as a current liability on the Company's consolidated balance sheet.
Card related pre-funding and receivables: The Company acts as an agent for an entity marketing prepaid debit cards. Pursuant to the Company's agreement, the Company is required to pre-fund certain card activity; the Company is also the beneficiary of certain receivables resulting from its card sales which relate to the commissions earned from this entity payable according to negotiated terms.
Leasehold improvements and equipment: Leasehold improvements and equipment are carried at cost. Depreciation is provided principally by straight-line methods over the estimated useful lives of the assets or the lease term, whichever is shorter.
The useful lives of leasehold improvements and equipment by class are as follows:
| |
Years | |
|---|---|---|
Furniture and fixtures |
5 | |
Leasehold improvements |
3 - 15 | |
Equipment |
5 - 7 | |
Vehicles |
5 |
Deferred loan origination costs: Direct costs incurred for the origination of loans, which consist mainly of employee-related costs, are deferred and amortized to loan fee income over the contractual lives of the loans using the interest method. Unamortized amounts are recognized in income at the time that loans are paid in full.
Goodwill and other intangibles: Goodwill, or cost in excess of fair value of net assets of the companies acquired, is recorded at its carrying value and is periodically evaluated for impairment. The Company tests the carrying value of goodwill and other intangible assets annually as of December 31 or when the events and circumstances warrant such a review. One of the methods for this review is performed using estimates of future cash flows. If the carrying value of goodwill or other intangible assets is considered impaired, an impairment charge is recorded for the amount by which the carrying value of the goodwill or intangible assets exceeds its fair value. Based upon the annual impairment testing performed by the Company, management has determined that goodwill is not impaired. Changes in estimates of cash flows and fair value, however, could affect the evaluation.
F-11
Community Choice Financial Inc. and Subsidiaries
Notes to Consolidated Financial Statements (Continued)
(Dollars in thousands, except per share data)
Note 1. Ownership, Nature of Business, and Significant Accounting Policies (Continued)
The Company's other intangible assets consists of non-compete agreements, customer lists and trade names. The amounts recorded for non-compete agreements, customer lists and trade names are amortized using the straight-line method over five years. Amortization expense for the years ended December 31, 2011, 2010 and 2009 were $1,283, $399 and $361, respectively.
Equity Method of Accounting of Investment in Latin Card Strategy and Insight Holding Company: The Company has an equity investment in Latin Card Strategy, LLC ("Latin Card"). Prior to May 2011, the Company had consolidated Latin Card based on a 57% ownership interest in Latin Card. In May 2011, the Company's membership units were reduced to 49% based on members' arrangement and Latin Card was deconsolidated. The Company, effective May 2011, recorded an investment in Latin Card under the equity method of accounting. As of December 31, 2011, the Company's membership units were reduced to 39% based on the members' agreement.
The Company also has an equity investment in Insight Holding Company, LLC (the parent company of the program manager for the prepaid card offered through CCFI's subsidiaries) ("Insight Holdings"). The Company has recorded the 22.5% investment in Insight Holdings under the equity method of accounting effective November 2011.
Investee companies that are not consolidated, but over which the Company exercises significant influence, are accounted for under the equity method of accounting in accordance with ASC 323-10. Whether or not the Company exercises significant influence with respect to an investee depends on an evaluation of several factors including, among others, representation on the investee company's board of directors and ownership level, which is generally a 20% to 50% interest in the voting securities of the investee company. Under the equity method of accounting, an investee company's accounts are not reflected within the Company's consolidated balance sheets and statements of income; however, the Company's share of the earnings or losses of the investee company is reflected in the caption "Equity investment loss" in the consolidated statements of income. The Company's carrying value in an equity method Investee company is reflected in the caption "Equity investments" in the Company's consolidated balance sheets.
Deferred debt issuance costs: Deferred debt issuance costs are amortized on the interest method of accounting over the life of the related note payable agreement. Amortization is included as a component of interest expense in the consolidated statements of income.
Deferred revenue: The Company's deferred revenue is comprised of an upfront fee received under an agency agreement to offer wire transfer services at the Company's branches. The deferred revenue is recognized over the contract period on a straight-line basis.
Deferred rent: The Company leases premises under agreements which provide for periodic increases over the lease term. Accordingly, timing differences between the amount paid for rent and the amount expensed are recorded as deferred rent in the accompanying consolidated balance sheets. In 2011, an expense and liability of $678 has been recorded for deferred rent as it relates to escalation of rent payments.
Advertising costs: Costs incurred for producing and communicating advertising are charged to operations when incurred or the first time advertising takes place. Advertising expense was $4,013, $3,961 and $4,181 for the years ended December 31, 2011, 2010 and 2009, respectively.
F-12
Community Choice Financial Inc. and Subsidiaries
Notes to Consolidated Financial Statements (Continued)
(Dollars in thousands, except per share data)
Note 1. Ownership, Nature of Business, and Significant Accounting Policies (Continued)
Branch expenses: The direct costs incurred in operating the Company's branches have been classified as branch expenses. Branch expenses include salaries and benefits of branch employees, loan losses, rent and other occupancy costs, depreciation and amortization of branch property and equipment, armored services and security costs, and other costs incurred by the branches. The district and regional managers' salaries are included in corporate expenses.
Preopening costs: New store preopening costs are expensed when incurred.
Impairment of long-lived assets: The Company evaluates all long-lived assets for impairment whenever events or changes in circumstances indicate that the carrying amounts may not be recoverable. Impairment is recognized when the carrying amount of these assets cannot be recovered by the undiscounted net cash flows they will generate.
Income taxes: Deferred income taxes are recorded to reflect the tax consequences in future years of differences between the tax basis of assets and liabilities and their financial reporting amounts, based on enacted tax laws and statutory tax rates applicable to the periods in which the differences are expected to affect taxable income. Valuation allowances are established when necessary to reduce deferred tax assets to the amounts expected to be realized. Income tax expense represents the tax obligations and the change in deferred tax assets and liabilities.
The Company has adopted the accounting standard on accounting for uncertainty in income taxes, which addresses the determination of whether tax benefits claimed or expected to be claimed on a tax return should be recorded in the financial statements. Under this guidance, the Company may recognize the tax benefit from an uncertain tax position only if it is more-likely-than-not that the tax position will be sustained on examination by taxing authorities, based on the technical merits of the position. The tax benefits recognized in the financial statements from such a position are measured based on the largest benefit that has greater than 50% likelihood of being realized upon ultimate settlement. The guidance on accounting for uncertainty in income taxes also addresses de-recognition, classification, interest and penalties on income taxes, and accounting in interim periods. Interest and penalties on income taxes will be charged to income tax expense.
Net income per common share: Basic earnings per share is computed using the weighted average number of shares outstanding during the period, while diluted earnings per share is calculated to reflect the potential dilution that occurs related to the issuance of capital stock under stock options and stock appreciation rights. The difference between basic and diluted earnings per share relates solely to the effect of capital stock options and stock appreciation rights.
For purposes of determining the amount of net income available to common shareholders, net income is adjusted for any non-controlling interest during periods in which the Company held a non-controlling interest, defined as an ownership percentage of greater than 50% but less than 100%, that is consolidated within the Company's financial statements.
Transaction Expenses: Transaction expenses consist of costs directly associated with acquisitions, which are primarily bonus earnings, transaction advisory fees paid to the majority shareholder, and professional services, which are included in the non-branch expenses section to determine income before income taxes and discontinued operations on the consolidated statements of income.
F-13
Community Choice Financial Inc. and Subsidiaries
Notes to Consolidated Financial Statements (Continued)
(Dollars in thousands, except per share data)
Note 1. Ownership, Nature of Business, and Significant Accounting Policies (Continued)
Additionally, the Company has deferred legal and other transaction expenses related to a planned initial public offering ("IPO") with the expectation that such expenses will be accounted for as a reduction of capital paid in excess of par. These deferred expenses totaling $1,361 at December 31, 2011 are included in other current assets on the consolidated balance sheet. Should the IPO not occur, these deferred expenses will be charged to income.
Governmental regulation: The Company is subject to various state and federal laws and regulations, which are subject to change and which may impose significant costs or limitations on the way the Company conducts or expands its business. Certain limitations include among other things imposed limits on fee rates and other charges, the number of loans to a customer, a cooling off period, the number of permitted rollovers and required licensing and qualification. Changes in Ohio laws have caused the Company to begin offering consumer loans in the state of Ohio under the Ohio Mortgage Loan Act. The law under which the Company provides short-term loans in Arizona terminated in June 2010. The Company converted the Arizona customers to title loan and card based products.
Although states provide the primary regulatory framework under which the Company offers payday cash advance services and consumer loans, certain federal laws also impact the business. The Company's payday cash advance services and consumer loans are subject to federal laws and regulations, including the Truth-in-Lending Act ("TILA"), the Equal Credit Opportunity Act ("ECOA"), the Fair Credit Reporting Act ("FCRA"), the Fair Debt Collection Practices Act ("FDCPA"), the Gramm-Leach-Bliley Act ("GLBA"), the Bank Secrecy Act, the Money Laundering Control Act of 1986, the Money Laundering Suppression Act of 1994, and the Uniting and Strengthening America by Providing Appropriate Tools Required to Intercept and Obstruct Terrorism Act (the "PATRIOT Act") and the regulations promulgated for each. Among other things, these laws require disclosure of the principal terms of each transaction to every customer, prohibit misleading advertising, protect against discriminatory lending practices, proscribe unfair credit practices and prohibit creditors from discriminating against credit applicants on the basis of race, sex, age or marital status. The GLBA and its implementing regulations generally require the Company to protect the confidentiality of its customers' nonpublic personal information and to disclose to the Company's customers its privacy policy and practices.
At the federal level, in July 2010, the Dodd-Frank Act was signed into law. Among other things, this act created the Consumer Financial Protection Bureau ("CFPB") which will have authority to regulate companies that provide consumer financial services. The CFPB became operative in July of 2011. On January 4, 2012, President Obama appointed Richard Cordray as Director of the Consumer Financial Protection Bureau. With this appointment, the CFPB now has the power and authority to oversee non-bank financial institutions as was provided for in the Dodd-Frank Act.
Derivative financial instruments: All derivatives are recognized on the consolidated balance sheets at their fair value. On the date the derivative contract is entered into, the Company designates the derivative as a hedge of a forecasted transaction or of the variability of cash flows to be received or paid related to a recognized asset or liability "cash-flow" hedge. Changes in the fair value of a derivative that is highly effective as, and that is designated and qualifies as, a cash-flow hedge are recorded in other comprehensive income, until earnings are affected by the variability of cash flows (e.g., when periodic settlements on a variable-rate asset or liability are recorded in earnings).
F-14
Community Choice Financial Inc. and Subsidiaries
Notes to Consolidated Financial Statements (Continued)
(Dollars in thousands, except per share data)
Note 1. Ownership, Nature of Business, and Significant Accounting Policies (Continued)
- •
- Level 1—Quoted prices (unadjusted) in active markets for identical assets or liabilities.
- •
- Level 2—Inputs other than quoted prices that are observable for assets and liabilities, either directly
or indirectly. These inputs include quoted prices for similar assets or liabilities in active markets and quoted prices for identical or similar assets or liabilities in markets that are less
attractive.
- •
- Level 3—Unobservable inputs for assets and liabilities reflecting the reporting entity's own assumptions.
The Company formally documents all relationships between hedging instruments and hedged items, as well as its risk-management objective and strategy for undertaking various hedged transactions. This process includes linking all derivatives that are designated as cash-flow hedges to specific assets and liabilities on the balance sheet or forecasted transactions. The Company also formally assesses, both at the hedge's inception and on an ongoing basis, whether the derivatives that are used in hedging transactions are highly effective in offsetting changes in cash flows of hedged items. When it is determined that a derivative is not highly effective as a hedge or that it has ceased to be a highly effective hedge, the Company discontinues hedge accounting prospectively, as discussed below.
The Company discontinues hedge accounting prospectively when: (1) it is determined that the derivative is no longer effective in offsetting changes in the cash flows of a hedged item (including forecasted transactions); (2) the derivative expires or is sold, terminated, or exercised; (3) the derivative is no longer considered to be designated as a hedge instrument, because it is unlikely that a forecasted transaction will occur; or (4) management determines that designation of the derivative as a hedge instrument is no longer appropriate.
When hedge accounting is discontinued because it is probable that a forecasted transaction will not occur, the derivative will continue to be carried on the balance sheet at its fair value, and gains and losses that were accumulated in other comprehensive income will be recognized immediately in earnings. In all other situations in which hedge accounting is discontinued, the derivative will be carried at its fair value on the balance sheet, with subsequent changes in its fair value recognized in current-period earnings.
Comprehensive income: The Company's comprehensive income is comprised of net income and the change in the fair value of the interest rate swap.
Fair value of financial instruments: Financial assets and liabilities measured at fair value are grouped in three levels. The levels prioritize the inputs used to measure the fair value of the assets or liabilities. These levels are:
The Company follows the provisions of the ASC 820-10. ASC 820-10 applies to all assets and liabilities that are being measured and reported on a fair value basis. ASC 820-10 requires disclosure that establishes a framework for measuring fair value within generally accepted accounting principles and expands disclosure about fair value measurements. This standard enables a reader of consolidated financial statements to assess the inputs used to develop those measurements by establishing a hierarchy for ranking the quality and reliability of the information used to determine fair values. The standard requires that assets and liabilities carried at fair value be classified and disclosed in one of the three categories.
F-15
Community Choice Financial Inc. and Subsidiaries
Notes to Consolidated Financial Statements (Continued)
(Dollars in thousands, except per share data)
Note 1. Ownership, Nature of Business, and Significant Accounting Policies (Continued)
In determining the appropriate levels, the Company performed a detailed analysis of the assets and liabilities that are subject to ASC 820-10. At each reporting period, all assets and liabilities for which the fair value measurement is based on significant unobservable inputs are classified as Level 3.
The Company's financial instruments consist primarily of cash and cash equivalents, finance receivables, accounts payable, and notes payable. For all such instruments, other than the notes payable at December 31, 2011, the carrying amounts in the Consolidated Financial Statements approximate their fair values. Our finance receivables are short term in nature and originated at prevailing market rates.
The fair value of notes payable at December 31, 2010 is estimated as being equal to the carrying value exhibited on our balance sheet at that time. There was no publicly available trading data available on those notes and the notes were subsequently paid off in full on April 29, 2011. The fair value of the notes payable at December 31, 2011 is determined based on the market yield on trades of the notes at the end of that reporting period. The estimated fair values of the Company's financial instruments are as follows:
| |
December 31, 2011 | December 31, 2010 | |||||||||||
|---|---|---|---|---|---|---|---|---|---|---|---|---|---|
| |
Carrying Amount |
Fair Value | Carrying Amount |
Fair Value | |||||||||
Cash and cash equivalents |
$ | 65,635 | $ | 65,635 | $ | 39,780 | $ | 39,780 | |||||
Finance receivables |
120,451 | 120,451 | 81,337 | 81,337 | |||||||||
Short-term investments, certificates of deposit |
1,110 | 1,110 | 1,814 | 1,814 | |||||||||
Notes payable |
395,000 | 389,075 | 188,934 | 188,934 | |||||||||
Change in accounting estimate: During 2009, the estimated useful lives of certain leasehold improvements and equipment were changed in recognition of the current estimated useful life of these assets. The effect of this change in accounting estimate was to decrease net income for 2009 by approximately $3,600.
Recent Accounting Pronouncements: In July 2010, the FASB issued Accounting Standard Update ("ASU") No. 2010-20, Receivables (Topic 310): Disclosures about the Credit Quality of Financing Receivables and the Allowance for Credit Losses ("ASU No. 2010-20"). The ASU amends FASB Accounting Standards Codification Topic 310, Receivables, to improve the disclosures that an entity provides about the credit quality of its financing receivables and the related allowance for credit losses. As a result of these amendments, an entity is required to disaggregate, by portfolio segment or class of financing receivable, certain existing disclosures and provide certain new disclosures about its financing receivables and related allowance for credit losses. For public entities, the disclosures as of the end of a reporting period are effective for interim and annual reporting periods ending on or after December 15, 2010. The disclosures about activity that occurs during a reporting period are effective for interim and annual reporting periods beginning on or after December 15, 2010. The disclosures about the credit quality of the Company's receivables required by the ASU are in Note 2-Allowance for Doubtful Accounts and Accrual for Third-Party Lender Losses. As this ASU amends only the disclosure requirements for loans and the allowance for credit losses, the adoption of ASU No. 2010-20 did not have a significant impact on the Company's financial statements.
F-16
Community Choice Financial Inc. and Subsidiaries
Notes to Consolidated Financial Statements (Continued)
(Dollars in thousands, except per share data)
Note 1. Ownership, Nature of Business, and Significant Accounting Policies (Continued)
In December 2010, the FASB issued ASU No. 2010-29, Business Combinations (Topic 805): Disclosure of Supplementary Pro Forma Information for Business Combinations. This standard update clarifies that, when presenting comparative financial statements, SEC registrants should disclose revenue and earnings of the combined entity as though the current period business combinations had occurred as of the beginning of the comparable prior annual reporting period only. The update also expands the supplemental pro forma disclosures to include a description of the nature and amount of material, nonrecurring pro forma adjustments directly attributable to the business combination included in the reported pro forma revenue and earnings. ASU 2010-29 is effective prospectively for material (either on an individual or aggregate basis) business combinations entered into in fiscal years beginning on or after December 15, 2010 with early adoption permitted. The disclosures about the Pro Forma Information for Business Combinations required by the ASU are in Note 9—Business Combinations. As this ASU amends only the disclosure requirement for business combinations, the adoption of ASU No. 2010-29 did not have a significant impact on the Company's financial statements.
In April 2011, the FASB issued ASU No. 2011-02, Receivables (Topic 310): A Creditor's Determination of Whether a Restructuring Is a Troubled Debt Restructuring. The ASU clarifies which loan modifications constitute troubled debt restructurings. It is intended to assist creditors in determining whether a modification of the terms of a receivable meets the criteria to be considered a troubled debt restructuring, both for purposes of recording an impairment loss and for disclosure of troubled debt restructurings. This ASU is effective for interim and annual periods beginning on or after June 15, 2011, and applies retrospectively to restructurings occurring on or after the beginning of the fiscal year of adoption. The adoption of this guidance did not have a material impact on the Company's financial statements.
In May 2011, the FASB issued ASU 2011-04, Fair Value Measurement (Topic 820): Amendments to Achieve Common Fair Value Measurement and Disclosure Requirements in U.S. GAAP and IFRSs. This ASU establishes common requirements for measuring fair value and for disclosing information about fair value measurements in accordance with US GAAP and International Financial Reporting Standards ("IFRS"). This ASU is effective for fiscal years and interim periods beginning after December 15, 2011. The adoption of this guidance is not expected to have a material impact on the Company's financial statements.
In September 2011, the FASB issued ASU No. 2011-08 Intangibles—Goodwill and Other (Topic 350): Testing Goodwill for Impairment. This ASU permits an entity to first assess qualitative factors to determine whether it is more likely than not that the fair value of a reporting unit is less than its carrying amount as a basis for determining whether it is necessary to perform the two-step goodwill impairment test described in Topic 350. Under ASU 2011-08, the two-step goodwill impairment test is not required unless the more-likely-than-not threshold is met. For public entities, the amendments in ASU 2011-08 are effective for annual and interim goodwill impairment tests performed for fiscal years beginning after December 15, 2011, with early adoption permitted. The Company plans to adopt this guidance on January 1, 2012. The adoption of ASU 2011-08 is not expected to have a material impact on the Company's financial statements.
Subsequent events: The Company has evaluated its subsequent events (events occurring after December 31, 2011) through the original issuance date of March 29, 2012, and through May 7, 2012 for subsequent events disclosed in Note 23.
F-17
Community Choice Financial Inc. and Subsidiaries
Notes to Consolidated Financial Statements (Continued)
(Dollars in thousands, except per share data)
Note 2. Finance Receivables, Credit Quality Information and Allowance for Loan Losses
Finance receivables represent amounts due from customers for advances at December 31, 2011 and 2010 consisted of the following:
| |
2011 | 2010 | |||||
|---|---|---|---|---|---|---|---|
Short-term consumer loans |
$ | 91,460 | $ | 67,897 | |||
Medium-term loans |
19,044 | 8,423 | |||||
Title loans |
20,800 | 11,855 | |||||
Gross receivables |
131,304 | 88,175 | |||||
Unearned advance fees, net of deferred loan origination costs |
(5,227 | ) | (3,481 | ) | |||
Finance receivables before allowance for loan losses |
126,077 | 84,694 | |||||
Allowance for loan losses |
(5,626 | ) | (3,357 | ) | |||
Finance receivables, net |
$ | 120,451 | $ | 81,337 | |||
Changes in the allowance for the loan losses by product type for the year ended December 31, 2011 are as follows:
| |
Balance 1/1/2011 |
Provision | Charge-Offs | Recoveries | Balance 12/31/2011 |
Finance Receivables 12/31/2011 |
Allowance as a percentage of receivable |
|||||||||||||||
|---|---|---|---|---|---|---|---|---|---|---|---|---|---|---|---|---|---|---|---|---|---|---|
Short-term consumer loans |
$ | 1,746 | $ | 40,636 | $ | (144,934 | ) | $ | 105,056 | $ | 2,504 | $ | 91,460 | 2.74 | % | |||||||
Medium-term loans |
987 | 11,470 | (13,553 | ) | 3,114 | 2,018 | 19,044 | 10.60 | % | |||||||||||||
Title loans |
624 | 5,463 | (7,670 | ) | 2,687 | 1,104 | 20,800 | 5.31 | % | |||||||||||||
|
$ | 3,357 | $ | 57,569 | $ | (166,157 | ) | $ | 110,857 | $ | 5,626 | $ | 131,304 | 4.28 | % | |||||||
The provision for loan losses for the year ended December 31, 2011 also includes card losses of $208, losses on tax loans of $432, and losses from returned items from check cashing of $5,085.
Changes in the allowance for the loan losses by product type for the year ended December 31, 2010 are as follows:
| |
Balance 1/1/2010 |
Provision | Charge-Offs | Recoveries | Balance 12/31/2010 |
Finance Receivables 12/31/2010 |
Allowance as a percentage of receivable |
|||||||||||||||
|---|---|---|---|---|---|---|---|---|---|---|---|---|---|---|---|---|---|---|---|---|---|---|
Short-term consumer loans |
$ | 3,240 | $ | 27,560 | $ | (84,279 | ) | $ | 55,225 | $ | 1,746 | $ | 67,897 | 2.57 | % | |||||||
Medium-term loans |
1,683 | 5,267 | (8,318 | ) | 2,355 | 987 | 8,423 | 11.72 | % | |||||||||||||
Title loans |
483 | 3,497 | (25,040 | ) | 21,684 | 624 | 11,855 | 5.26 | % | |||||||||||||
|
$ | 5,406 | $ | 36,324 | $ | (117,637 | ) | $ | 79,264 | $ | 3,357 | $ | 88,175 | 3.81 | % | |||||||
The provision for losses for the year ended December 31, 2010 also includes losses from returned items from check cashing of $3,034 and card losses of $193.
F-18
Community Choice Financial Inc. and Subsidiaries
Notes to Consolidated Financial Statements (Continued)
(Dollars in thousands, except per share data)
Note 2. Finance Receivables, Credit Quality Information and Allowance for Loan Losses (Continued)
Changes in the allowance for loan losses for the year ended December 31, 2009 is as follows:
| |
2009 | |||
|---|---|---|---|---|
Balance, beginning of period |
$ | 2,451 | ||
Provision for loan losses |
40,255 | |||
Charge-offs, net |
(37,300 | ) | ||
Balance, end of period |
$ | 5,406 | ||
The provision for losses for the year ended December 31, 2009 also includes losses from returned items from check cashing of $3,058.
Changes in the accrual for third-party lender losses for the years ended December 31, 2011, 2010, and 2009 were as follows:
| |
2011 | 2010 | 2009 | |||||||
|---|---|---|---|---|---|---|---|---|---|---|
Balance, beginning of period |
$ | 110 | $ | 150 | $ | — | ||||
Provision for loan losses |
2,057 | 765 | 150 | |||||||
Charge-offs, net |
(2,010 | ) | (805 | ) | — | |||||
Balance, end of period |
$ | 157 | $ | 110 | $ | 150 | ||||
The Company considers the near term repayment performance of finance receivables as its primary credit quality indicator. The Company typically does not perform credit checks through consumer reporting agencies. If a third-party lender provides the advance, the applicable third-party lender decides whether to approve the cash advance and establishes all of the underwriting criteria and terms, conditions, and features of the customer agreements. The aging of receivables at December 31, 2011 and 2010 are as follows (in thousands):
| |
2011 | 2010 | |||||||||||
|---|---|---|---|---|---|---|---|---|---|---|---|---|---|
Current finance receivables |
$ | 126,814 | 96.6 | % | $ | 86,544 | 98.2 | % | |||||
Past due finance receivables (1 - 30 days) |
|||||||||||||
Short-term consumer loans |
293 | 0.2 | % | — | — | ||||||||
Medium-term loans |
1,481 | 1.1 | % | 754 | 0.9 | % | |||||||
Title loans |
1,897 | 1.4 | % | 877 | 1.0 | % | |||||||
Total past due finance receivables (1 - 30 days) |
3,671 | 2.8 | % | 1,631 | 1.8 | % | |||||||
Past due finance receivables (31 - 60 days) |
|||||||||||||
Short-term consumer loans |
— | 0.0 | % | — | — | ||||||||
Medium-term loans |
289 | 0.2 | % | — | — | ||||||||
Title loans |
395 | 0.3 | % | — | — | ||||||||
Total past due finance receivables (31 - 60 days) |
684 | 0.5 | % | — | — | ||||||||
Past due finance receivables (61 - 90 days) |
|||||||||||||
Short-term consumer loans |
— | 0.0 | % | — | — | ||||||||
Medium-term loans |
52 | 0.0 | % | — | — | ||||||||
Title loans |
83 | 0.1 | % | — | — | ||||||||
Total past due finance receivables (61 - 90 days) |
135 | 0.1 | % | — | — | ||||||||
Total delinquent |
4,490 | 3.4 | % | 1,631 | 1.8 | % | |||||||
|
$ | 131,304 | 100.0 | % | $ | 88,175 | 100.0 | % | |||||
F-19
Community Choice Financial Inc. and Subsidiaries
Notes to Consolidated Financial Statements (Continued)
(Dollars in thousands, except per share data)
Note 3. Related Party Transactions and Balances
On May 1, 2006, the Company entered into an Advisory Services and Monitoring Agreement with an affiliate of the majority stockholder. A quarterly fee is paid in consideration for ongoing management and other advisory services provided to the Company and its subsidiaries in the greater amount of a) $150 or b) 25% multiplied by 1.5% of the EBITDA for the previous twelve-month period. This agreement was amended to include total fees paid pursuant to this agreement for the years ended December 31, 2011, 2010 and 2009 totaling $1,381, $1,184 and $833, respectively. In addition, certain advisory fees were paid in conjunction with acquisition transactions. The Company paid $3,994 in transaction advisory fees to the majority shareholder during the year ended December 31, 2011 of which $1,600 was capitalized as deferred debt issuance costs. This agreement was amended to include the former majority shareholder of CCCS when the merger occurred.
The Company has a management agreement with a related party in which the Company receives management fee revenue on a monthly basis for providing certain accounting functions to these parties. For the years ended December 31, 2011, 2010 and 2009, management fee revenue from related parties totaled $46, $46 and $172, respectively. The Company's payroll department provides payroll administration for a related party. The related company is charged actual costs for payroll services.
At December 31, 2010, the Company had $4 recorded as receivables from stockholders and other related entities.
The Company's senior management has access to use an aircraft owned by a related party. The Company rents the aircraft from this related party and all personal use of the aircraft is reimbursed to the Company. Total rent paid to these related parties for usage of the aircraft totaled $93, $94 and $54 for the years ended December 31, 2011, 2010 and 2009, respectively.
The corporate office and certain branches of the Company are owned and operated by related parties and leased from the related party. Rent paid to the related parties was $1,801, $1,810 and $1,772 for the years ended December 31, 2011, 2010 and 2009, respectively.
Certain members of management had a noncontrolling, minority interest in Insight Holdings until November 2011 when the Company purchased a 22.5% interest in Insight Holdings. The interest was purchased from the owners of Insight Holdings, two of which are management of the Company. The total purchase price of the 22.5% was $11,250, of which $7,500 was purchased from the management of the Company. The percentage purchased from management was 67% of the total membership interests purchased by the Company. As of December 31, 2011 and 2010, the Company, as an agent for the card program managing company, had made net prepayments of $12,910 and $11,094, respectively, to the card program managing company for various items related to a product offering of the Company. The Company agreed to make available to Insight Holdings a revolving credit facility of $3,000.
On December 31, 2008 the Company entered into a $5,000 line of credit with the Company's majority shareholder. The interest associated with the line of credit was 20% and matured in February 2011. Interest expense and unused line fees recognized on this borrowing totaled $25, $255 and $305 for the years ended December 31, 2011, 2010 and 2009, respectively.
F-20
Community Choice Financial Inc. and Subsidiaries
Notes to Consolidated Financial Statements (Continued)
(Dollars in thousands, except per share data)
Note 4. Leasehold Improvements and Equipment
At December 31, 2011 and 2010, leasehold improvements and equipment consisted of the following:
| |
2011 | 2010 | |||||
|---|---|---|---|---|---|---|---|
Furniture & fixtures |
$ | 18,839 | $ | 15,596 | |||
Leasehold improvements |
30,681 | 25,201 | |||||
Equipment |
7,887 | 5,758 | |||||
Vehicles |
607 | 22 | |||||
Assets acquired not yet placed in service |
438 | 454 | |||||
|
58,452 | 47,031 | |||||
Less accumulated depreciation |
(38,791 | ) | (31,876 | ) | |||
|
$ | 19,661 | $ | 15,155 | |||
Note 5. Goodwill and Other Intangible Assets
The following table summarizes goodwill and other intangible assets as of December 31, 2011 and 2010:
| |
2011 | 2010 | |||||
|---|---|---|---|---|---|---|---|
Goodwill |
$ | 255,953 | $ | 138,963 | |||
Other intangible assets: |
|||||||
Non-compete agreements |
1,260 | 1,178 | |||||
Trade names |
2,102 | 242 | |||||
Customer lists |
226 | 97 | |||||
|
$ | 259,541 | $ | 140,480 | |||
The changes in the carrying amount of goodwill are summarized as follows:
Balance at December 31, 2009 |
$ | 129,649 | ||
Acquisition of Insight Capital, LLC |
11,396 | |||
Effect of tax benefits |
(2,082 | ) | ||
Balance at December 31, 2010 |
138,963 | |||
Acquisition of CCCS Corporate Holdings, Inc. and CCCS Corporate Holdings, LLC |
101,628 | |||
Acquisition of Illinois stores |
17,444 | |||
Effect of tax benefits |
(2,082 | ) | ||
Balance at December 31, 2011 |
$ | 255,953 | ||
F-21
Community Choice Financial Inc. and Subsidiaries
Notes to Consolidated Financial Statements (Continued)
(Dollars in thousands, except per share data)
Note 5. Goodwill and Other Intangible Assets (Continued)
Other intangible assets are summarized as follows:
| |
December 31, 2011 | December 31, 2010 | |||||||||||||||||
|---|---|---|---|---|---|---|---|---|---|---|---|---|---|---|---|---|---|---|---|
| |
Gross Carrying Amount |
Accumulated Amortization |
Net Carrying Amount |
Gross Carrying Amount |
Accumulated Amortization |
Net Carrying Amount |
|||||||||||||
Non-compete agreements |
$ | 2,506 | $ | (1,246 | ) | $ | 1,260 | $ | 1,560 | $ | (382 | ) | $ | 1,178 | |||||
Trade names |
2,606 | (504 | ) | 2,102 | 391 | (149 | ) | 242 | |||||||||||
Customer lists |
293 | (67 | ) | 226 | 110 | (13 | ) | 97 | |||||||||||
Total |
$ | 5,405 | $ | (1,817 | ) | $ | 3,588 | $ | 2,061 | $ | (544 | ) | $ | 1,517 | |||||
The Company conducted its annual test for impairment of goodwill as of December 31, 2011, which resulted in no impairment of goodwill. The methodology for determining the fair value was a combination of quoted market prices, prices of comparable businesses, discounted cash flows and other valuation techniques.
The amount of tax goodwill at the acquisition date of the Company in 2006 exceeded the reported amount of goodwill for financial statement reporting purposes by approximately $50,965. The total estimated effect of the tax benefit attributable to tax goodwill in excess of the amount reported in these financial statements was approximately $31,237 which will reduce financial statement goodwill each year as the tax benefits are recognized. This benefit will be recognized over a 15-year period from the date of acquisition by recording deferred income tax expense and reducing the carrying amount of goodwill as those tax benefits occur. The tax benefit for each of the years ended December 31, 2011, 2010 and 2009 was $2,082. The effect of the tax benefits for each subsequent year is expected to be $2,082 and will result in future reductions to the carrying amount of goodwill.
The amount of book goodwill at the acquisition date of CCCS exceeded the amount of tax goodwill by approximately $46,907. Differences arising for tax deductible goodwill will result in recognition of deferred tax liabilities.
Amortization expense on specifically identifiable intangibles for the next 5 years is estimated to be:
Year Ending December 31,
|
Amount | |||
|---|---|---|---|---|
2012 |
$ | 1,134 | ||
2013 |
858 | |||
2014 |
858 | |||
2015 |
571 | |||
2016 |
167 | |||
|
$ | 3,588 | ||
Total intangible amortization expense for the years ended December 31, 2011, 2010 and 2009 was $1,283, $399 and $361, respectively.
F-22
Community Choice Financial Inc. and Subsidiaries
Notes to Consolidated Financial Statements (Continued)
(Dollars in thousands, except per share data)
Note 6. Pledged Assets and Debt
Debt at December 31, 2011 and 2010 consisted of the following:
| |
2011 | 2010 | |||||
|---|---|---|---|---|---|---|---|
First lien term loan, secured, LIBOR plus 2.75%, collateralized by all Company assets, quarterly principal payments of $400 and excess cash payments as defined in the agreeement, paid in full April 2011 |
$ | — | $ | 146,361 | |||
Second lien term loan, secured, LIBOR plus 5.50%, collateralized by all Company assets, paid in full April 2011 |
— | 40,000 | |||||
Note payable, unsecured, 10% interest only payments, paid in full April 2011 |
— | 2,573 | |||||
$7,000 Revolving credit, secured, prime plus 1.00% with 5.00% floor, due July 2013, collateralized by all of Insight Capital, LLC's assets |
— | — | |||||
$40,000 Revolving credit, secured, interest rate as defined below, collateralized by all Company assets |
— | — | |||||
$395,000 Senior Note payable, 10.75%, collateralized by all Company assets, semi-annual interest payments with with principal due April 2019 |
395,000 | — | |||||
|
395,000 | 188,934 | |||||
Less current maturities |
— | 17,573 | |||||
Long-term portion |
$ | 395,000 | $ | 171,361 | |||
The 4-year, $40,000 revolving credit facility, at the Company's option, bears interest at either (a) LIBOR plus a margin of 5% or (b) an alternative base rate (determined as the greatest of the prime rate, the federal funds effective rate plus 0.5% or 1-month LIBOR plus 1%) plus a margin of 4%, and will mature on April 29, 2015. The Company selected the alternate base rate option for advances under this credit facility during 2011.
The 3-month LIBOR rate at December 31, 2011 and 2010 was 0.53% and 0.31%, respectively, and the prime rate was 3.25% at December 31, 2011 and 2010.
Note 7. Agency Agreements
On June 14, 2007, the Company entered into an agency agreement with Western Union whereby the Company facilitates wire transfers and money orders via Western Union's network. The initial term of this agreement was a period of 5 years. Under this agreement, the Company receives a commission for each transfer conducted. During the years ended December 31, 2011, 2010 and 2009, the total amount of commissions earned related to the agreement totaled $3,823, $817 and $917, respectively.
Under the Western Union Agreement, the Company received approximately $3,500 in upfront bonuses at the inception of the agreement related to expected future business volumes. During the years ended December 31, 2011, 2010 and 2009, the total amount of revenue recognized related to bonuses under the Western Union Agreement was $1,398, $714 and $700, respectively. The total deferred revenue related to these bonuses and other incentive bonuses as of December 31, 2011 and 2010, was $-0- and $1,073, respectively, and is included in other current and noncurrent liabilities in the accompanying consolidated balance sheets.
A new agency agreement with Western Union was signed effective January 1, 2012 which superseded the existing agreement. The Company received a $13,200 bonus offset by the remaining
F-23
Community Choice Financial Inc. and Subsidiaries
Notes to Consolidated Financial Statements (Continued)
(Dollars in thousands, except per share data)
Note 7. Agency Agreements (Continued)
unamortized deferred revenue on the prior contract as of December 31, 2011. Should the Company close a location, discontinue service at an existing location, or terminate the agreement at any time during the initial term, a prorated portion of this signing bonus must be repaid. In addition, the Company is also entitled to receive certain incentive bonuses, not to exceed $500 for the duration of the agreement, related to new Western Union service locations opened or acquired or certain performance goals met during the term of the agreement.
No revenue associated with the new contract was recognized in 2011. The total deferred revenue for all contracts as of December 31, 2011 and 2010 was $13,266 and $1,073, respectively.
The Company also entered into an agency agreement with another vendor whereby the Company facilitates prepaid debit card services. During the years ended December 31, 2011, 2010 and 2009, the total amount of fees earned related to the agreement totaled $-0-, $879 and $1,937, respectively. The agreement was cancelled during 2010. CCCS also had an agency agreement with the same vendor that was cancelled in 2011. Fees earned related to the agreement post-acquisition were $222 for the year ended 2011.
The Company entered into an agency agreement with an entity which is a prepaid debit card program manager during 2009. During the years ended December 31, 2011, 2010 and 2009, the total amount of fees earned related to the agreement totaled $19,427, $9,853 and $126, respectively. At December 31, 2011 and 2010 the Company had $12,910 and $11,094, respectively in card related pre-funding and receivables on its balance sheet associated with this agreement.
In November 2008, the Company entered into an agency agreement with an additional money order provider. Through this agreement the Company issues certain loan proceeds in the state of Ohio via a third-party money order provider. Under this agreement the Company is responsible for compensating for the use of the money orders and is also required to pre-fund certain amounts to mitigate the risk exposure of the third-party money order company related to the outstanding and projected outstanding money orders. At December 31, 2011 and 2010 the Company had $-0- and $8,030 in pre-funding assets, respectively.
Note 8. Accounts Payable and Accrued Liabilities
Accounts payable and accrued liabilities at December 31, 2011 and 2010 consisted of the following:
| |
2011 | 2010 | |||||
|---|---|---|---|---|---|---|---|
Accounts payable |
$ | 808 | $ | 1,048 | |||
Accrued payroll and benefits |
4,175 | 1,929 | |||||
Compensated absences |
1,042 | 596 | |||||
Wire transfers payable |
3,848 | 692 | |||||
Accrual for third-party losses |
157 | 110 | |||||
Income taxes payable |
1,908 | — | |||||
Other |
8,536 | 2,083 | |||||
|
$ | 20,474 | $ | 6,458 | |||
F-24
Community Choice Financial Inc. and Subsidiaries
Notes to Consolidated Financial Statements (Continued)
(Dollars in thousands, except per share data)
Note 9. Lease Commitments and Total Rental Expense
The Company leases its facilities under various noncancelable agreements, which require various minimum annual rentals. Certain of the leases also require the payment of normal maintenance on the properties. The total minimum rental commitment at December 31, 2011, is due as follows:
Year Ending December 31,
|
Amount | |||
|---|---|---|---|---|
2012 |
$ | 17,337 | ||
2013 |
13,305 | |||
2014 |
9,598 | |||
2015 |
5,420 | |||
2016 |
2,658 | |||
Thereafter |
1,896 | |||
Total minimum lease payments |
$ | 50,214 | ||
Rental expense totaled $22,281, $15,624 and $14,825 for the years ended December 31, 2011, 2010 and 2009, respectively.
Note 10. Bonus Agreements
The Company pays a discretionary bonus or other bonuses as defined in agreements to employees based on performance. For the years ended December 31, 2011, 2010 and 2009, the bonus expense related to these agreements totaled $1,521, $1,650 and $1,000, respectively. The Company also paid transaction related bonuses to certain employees totaling $4,400 during the year ended December 31, 2011.
Note 11. Concentrations of Credit Risks
The Company's portfolio of finance receivables is with customers living in fourteen states and consequently such customers' ability to honor their contracts may be affected by economic conditions in these areas. Additionally, the Company is subject to regulation by federal and state governments that affect the products and services provided by the Company. To the extent that laws and regulations are passed that affect the Company's ability to offer loans or similar products in any of the states in which it operates, the Company's financial position could be adversely affected. As an example, the law under which the Company provided short-term consumer loans in Arizona terminated in June 2010. The Company was able to transition customers in Arizona to title loans and loans offered by a third party.
F-25
Community Choice Financial Inc. and Subsidiaries
Notes to Consolidated Financial Statements (Continued)
(Dollars in thousands, except per share data)
Note 11. Concentrations of Credit Risks (Continued)
The following table summarizes the allocation of the portfolio balance by state at December 31, 2011 and 2010:
| |
December 31, 2011 | December 31, 2010 | |||||||||||
|---|---|---|---|---|---|---|---|---|---|---|---|---|---|
State
|
Balance Outstanding |
Percentage of Total Outstanding |
Balance Outstanding |
Percentage of Total Outstanding |
|||||||||
Alabama |
$ | 11,865 | 9.0 | % | $ | 9,175 | 10.4 | % | |||||
Arizona |
13,226 | 10.1 | 9,896 | 11.2 | |||||||||
California |
28,404 | 21.6 | 4,548 | 5.2 | |||||||||
Florida |
2,027 | 1.5 | 1,818 | 2.1 | |||||||||
Illinois |
2,707 | 2.1 | — | — | |||||||||
Indiana |
5,149 | 3.9 | 4,594 | 5.2 | |||||||||
Kansas |
1,789 | 1.4 | 1,329 | 1.5 | |||||||||
Kentucky |
3,019 | 2.3 | 2,648 | 3.0 | |||||||||
Michigan |
3,395 | 2.6 | 2,465 | 2.8 | |||||||||
Missouri |
1,867 | 1.4 | 1,390 | 1.6 | |||||||||
Ohio |
43,434 | 33.1 | 39,238 | 44.5 | |||||||||
Oregon |
1,029 | 0.8 | — | — | |||||||||
Utah |
4,204 | 3.2 | 3,559 | 4.0 | |||||||||
Virginia |
9,189 | 7.0 | 7,515 | 8.5 | |||||||||
Total |
$ | 131,304 | 100.0 | % | $ | 88,175 | 100.0 | % | |||||
Note 12. Contingencies
Recently, the Company settled a lawsuit which included class allegations. A $640 settlement related to this class action suit is fully accrued and recorded in accounts payable and accrued liabilities on the Company's consolidated balance sheet.
Additionally, from time-to-time the Company is a defendant in various lawsuits and administrative proceedings wherein certain amounts are claimed or violations of law or regulations are asserted. In the opinion of the Company's management, these claims are without substantial merit and should not result in judgments which in the aggregate would have a material adverse effect on the Company's financial statements.
Note 13. Employee Benefit Plan
The Company has established a salary deferral plan under Section 401(k) of the Internal Revenue Code. The plan allows eligible employees to defer a portion of their compensation. Such deferrals accumulate on a tax deferred basis until the employee withdraws the funds. The Company has elected to match 100 percent of the employee contributions not exceeding 3 percent of compensation, plus 50 percent of the employee contributions exceeding 3 percent but not to exceed 5 percent of compensation. Total expense recorded for the Company's match was $1,064, $710 and $579 for the years ended December 31, 2011, 2010 and 2009.
The plan also provides a profit sharing component where the Company can make a discretionary contribution to the plan, which is allocated based on the compensation of eligible employees. No discretionary contributions were made for 2011, 2010 or 2009.
F-26
Community Choice Financial Inc. and Subsidiaries
Notes to Consolidated Financial Statements (Continued)
(Dollars in thousands, except per share data)
Note 14. Business Combinations
In April 2011, Community Choice Financial Inc., a newly formed holding company, and CheckSmart Financial Holdings Corp., together with CCCS Corporate Holdings, Inc. and CCCS Holdings, LLC entities located in the western United States and certain other parties executed an Agreement and Plan of Merger pursuant to which CCFI acquired all outstanding shares of both CheckSmart Financial Holdings Corp. and CCCS. The Combination was structured as a stock-for-stock transaction, in which the equity holders of each of CheckSmart and CCCS agreed to contribute the equity of the separate companies to CCFI in exchange for shares of the combined company. As a result of the transaction, the former equity holders of CheckSmart Financial Holdings Corp. and CCCS own approximately 77% and 23% of CCFI, respectively.
In connection with the above transaction, Community Choice Financial Inc. issued $395,000 10.75% senior secured notes due 2019 ("notes"). The notes have an interest rate of 10.75% payable semi-annually and will mature on May 1, 2019. The proceeds were used to refinance existing debt, pay fees and expenses, and to finance a special dividend to shareholders and bonuses to management. The special dividend included $120,566 paid to its shareholders and the amount of management bonuses was $4,400.
In April 2011, the Company also entered into a four-year, $40,000 revolving credit facility concurrent with the notes offering. The revolving credit facility, at the Company's option, bears interest at either (a) LIBOR plus a margin of 5% or (b) and alternative base rate (determined as the greatest of the prime rate, the federal funds effective rate plus 0.5% of 1-month LIBOR plus 1%) plus a margin of 4% and will mature on April 29, 2015.
Also concurrent with the notes offering, Insight Capital, LLC, a Company subsidiary, entered into a $7,000 revolving credit facility. The facility expires July 31, 2013 and is collateralized by all of Insight's assets. The interest rate is prime plus 1%.
Transaction expenses incurred include both direct and indirect costs associated with merger and acquisition costs.
All assets of the Company are pledged as collateral on the notes and primary revolving credit facility. The agreements contain various restrictions, including maintaining certain financial ratios and certain other restrictions.
The fair value of the 1,842,000 shares issued as consideration paid for CCCS was determined based on a combination of the income approach, using a discounted cash flow model, and a market approach, which considers comparable companies and transactions. Under the income approach, the discounted cash flow model determines fair value based on the present value of estimated future cash flows over a specific projection period and a residual value related to future cash flows beyond the projection period. Both values are discounted using a rate which reflects the Company's best estimate of the weighted average cost of capital of a market participant, and is adjusted for appropriate risk factors. Under the market approach, valuation multiples are derived based on a selection of comparable companies and acquisition transactions, and applied to projected operating data to arrive at an indication of fair value.
F-27
Community Choice Financial Inc. and Subsidiaries
Notes to Consolidated Financial Statements (Continued)
(Dollars in thousands, except per share data)
Note 14. Business Combinations (Continued)
The following table summarizes the estimated fair value of assets acquired and liabilities assumed at the date of acquisition. The recognized amount of identifiable assets acquired and liabilities assumed have been adjusted for year-end adjustments to the acquired company's opening balance sheet.
Fair value of total consideration transferred |
$ | 55,192 | ||
Acquisition-related costs |
$ | 3,530 | ||
Recognized amounts of identifiable assets acquired and liabilities assumed |
||||
Cash and cash equivalents |
$ | 22,892 | ||
Finance receivables |
13,660 | |||
Prepaid expenses and other assets |
1,480 | |||
Leasehold improvements and equipment |
7,161 | |||
Identifiable intangible assets |
2,948 | |||
Note payable |
(73,923 | ) | ||
Other liabilities |
(20,654 | ) | ||
Total indentifiable net assets |
(46,436 | ) | ||
Goodwill |
101,628 | |||
|
$ | 55,192 | ||
The amounts of revenue and branch gross profit of CCCS included in the consolidated income statement from the acquisition date to the year ending December 31, 2011, were $55,363 and $24,747.
On March 21, 2011, the Company acquired ten loan stores in Illinois in an asset purchase. The purchase price was $19,725 in cash consideration. The purchase price was negotiated based upon a multiple of prior financial results and perceived opportunities. The results of operations have been included in the consolidated financial statements since the date of the acquisition. The following table summarizes the estimated fair value of assets acquired at the date of acquisition. The recognized amount of identifiable assets acquired and liabilities assumed have been adjusted for year-end adjustments to the acquired company's opening balance sheet.
Fair value of total consideration transferred, cash |
$ | 19,725 | ||
Acquisition-related costs |
$ | 85 | ||
Recognized amounts of identifiable assets acquired |
||||
Finance receivables |
$ | 1,912 | ||
Security deposits and other current assets |
30 | |||
Leasehold improvements and equipment |
74 | |||
Identifiable intangible assets |
265 | |||
Total indentifiable net assets |
2,281 | |||
Goodwill |
17,444 | |||
|
$ | 19,725 | ||
F-28
Community Choice Financial Inc. and Subsidiaries
Notes to Consolidated Financial Statements (Continued)
(Dollars in thousands, except per share data)
Note 14. Business Combinations (Continued)
The amounts of revenue and branch gross profits of Illinois included in the consolidated income statement from the acquisition date to the year ending December 31, 2011, were $5,108 and $809.
On February 28, 2010, the Company entered into a Membership Interest Purchase Agreement in which the Company acquired all membership interest of Insight Capital, LLC for $15,900 in cash consideration. This entity represents the Company's Alabama stores. The purchase price was negotiated based upon a multiple of prior financial results and perceived opportunities. The acquisition was paid for through cash plus assumed liabilities. The results of operations have been included in the consolidated financial statements since the date of the acquisition. The following table summarizes the estimated fair value of assets acquired and liabilities assumed at the date of acquisition.
Fair value of total consideration transferred, cash |
$ | 15,900 | ||
Acquisition-related costs |
$ | 237 | ||
Recognized amounts of identifiable assets acquired and liabilities assumed |
||||
Cash and cash equivalents |
$ | 12,602 | ||
Finance receivables |
3,995 | |||
Prepaid expenses and other current assets |
122 | |||
Leasehold improvements and equipment |
1,144 | |||
Identifiable intangible assets |
1,654 | |||
Note payable |
(2,600 | ) | ||
Line of credit |
(9,000 | ) | ||
Other liabilities |
(3,413 | ) | ||
Total indentifiable net assets |
4,504 | |||
Goodwill |
11,396 | |||
|
$ | 15,900 | ||
The amounts of revenue and branch gross profit of Insight Capital, LLC included in the consolidated income statement from the acquisition date to the year ending December 31, 2010, were $18,766 and $8,249.
The unaudited pro forma revenue and earnings for the years ended December 31, 2011 and 2010 presented below is based upon combined financial statements of the acquisitions above and does not reflect any operating efficiencies or cost savings from the integration of these assets into our business.
| |
2011 | 2010 | |||||
|---|---|---|---|---|---|---|---|
Total revenue |
$ | 332,727 | $ | 310,357 | |||
Net income from continuing operations |
$ | 4,260 | $ | 28,074 | |||
Note 15. Interest Rate Swaps
The Company maintained an interest-rate risk-management strategy that used derivative instruments to minimize significant, unanticipated earnings fluctuations caused by interest-rate volatility.
F-29
Community Choice Financial Inc. and Subsidiaries
Notes to Consolidated Financial Statements (Continued)
(Dollars in thousands, except per share data)
Note 15. Interest Rate Swaps (Continued)
In June 2006, the Company entered into an interest rate swap agreement related to their borrowings on their term loan. These swaps were utilized to manage interest rate exposures and were designated as highly effective cash flow hedges. The differential to be paid or received on all swap agreements is accrued as interest rates change and is recognized over the lives of the agreements in interest expense. The swap agreement expired in June 2009 and had a fixed rate of 5.55%. The notional amount was $100,000. Included in accumulated other comprehensive income is a gain of approximately $-0-, $-0- and $2,143 relating to the fair value of the swap agreements as of December 31, 2011, 2010 and 2009, respectively. These fair values were made utilizing inputs other than quoted prices that are observable (Level 2).
Note 16. Stock-Based Compensation
On May 1, 2006, the Company adopted the 2006 Management Equity Incentive Plan (the "Plan") pursuant to which the Company's Board of Directors, or a duly-authorized committee thereof, may grant stock options, restricted stock, restricted stock units and stock appreciation rights to employees and consultants of the Company or its subsidiaries. CCFI amended the plan to increase the number of shares and to convert the number of shares in the 2006 plan to the 2011 plan. Options that have been granted under the Plan have been granted at an exercise price equal to (or greater than) the stock's fair market value at the date of the grant, with terms of 10 years and vesting generally over four to five years or on the occurrence of a liquidity event. On April 19, 2011, CCFI adopted the "Plan" to be effective as of April 29, 2011. The maximum number of shares that may be subject to awards under the Plan is 1,555,746 as of December 31, 2011.
The Company recognizes compensation costs in the financial statements for all share-based payments granted on or after May 1, 2006 based on the grant date fair value estimated. No options were outstanding prior to May 1, 2006.
The Plan allows for awards based on time, performance and market conditions. Compensation expense for awards based on time is expensed on a straight-line basis over the service period. Compensation expense for performance awards are recognized using the graded vesting method. Compensation expense for market conditions such as those conditioned on either a liquidity event condition or a specified performance condition have not been recognized and will be recognized upon consummation of the relevant market condition. At December 31, 2011, there were a total of 312,768 additional shares available for grant under the Plan.
The fair value of the option award is estimated on the date of grant using a lattice-based option valuation model. Because lattice-based option valuation models incorporate ranges of assumptions for inputs, those ranges are disclosed. Expected volatilities are based on the historical volatility of the stock of comparable public companies. The Company uses historical data to estimate option exercise and employee termination within the valuation model; separate groups of employees that have similar historical exercise behavior are considered separately for valuation purposes. The expected term of options granted is derived from the output of the option valuation model and represents the period of time that options granted are expected to be outstanding. The risk-free rate for periods within the contractual life of the option is based on the U.S. Treasury yield curve in effect at the time of grant.
F-30
Community Choice Financial Inc. and Subsidiaries
Notes to Consolidated Financial Statements (Continued)
(Dollars in thousands, except per share data)
Note 16. Stock-Based Compensation (Continued)
The weighted average assumptions used by the Company for option grants in 2011, 2010, and 2009 are illustrated in the following table:
| |
2011 | 2010 | 2009 | |||||||
|---|---|---|---|---|---|---|---|---|---|---|
Risk-free interest rate |
0.17 | % | 0.31 | % | 1.00 | % | ||||
Dividend yield |
0.00 | % | 0.00 | % | 0.00 | % | ||||
Expected volatility |
35.00 | % | 41.90 | % | 52.00 | % | ||||
Expected life (years) |
0.75 | 1.25 | 1.25 | |||||||
Weighted average fair value of options granted |
$ | 7.72 | $ | 3.02 | $ | — | ||||
Weighted average fair value of stock appreciation rights granted |
$ | 7.41 | $ | — | $ | — | ||||
For the years ended December 31, 2011, 2010 and 2009, the Company recorded stock-based compensation costs in the amount of $105, $388 and $1,057, respectively. As of December 31, 2011, 2010 and 2009, unrecognized stock-based compensation costs to be recognized over future periods approximated $3,095, $3,400 and $3,700, respectively. At December 31, 2011, this amount is expected to be recognized as expense over a weighted-average period of 1 year. The total income tax benefit recognized in the income statement for the share-based compensation arrangements was $-0-, $125 and $391 for December 31, 2011, 2010 and 2009, respectively.
Stock option activity for the year ended December 31, 2011 is as follows (these amounts have not been rounded in thousands):
| |
Shares | Weighted-Average Exercise Price (actual per share price) |
Weighted-Average Remaining Contractual Term |
Aggregate Intrinsic Value (thousands) |
|||||||||
|---|---|---|---|---|---|---|---|---|---|---|---|---|---|
Outstanding at December 31, 2010 |
944,628 | $ | 9.71 | 6.8 | N/A | ||||||||
Granted |
950,034 | 7.14 | N/A | ||||||||||
Exercised |
— | — | N/A | ||||||||||
Forfeited or expired |
944,628 | 9.71 | N/A | ||||||||||
Outstanding at December 31, 2011 |
950,034 | 7.14 | 7.2 | N/A | |||||||||
Exercisable at December 31, 2011 |
379,788 | $ | 7.23 | 6.3 | $ | 6,677 | |||||||
Vested or expected to vest at December 31, 2011 |
379,788 | $ | 7.23 | 6.3 | $ | 6,677 | |||||||
F-31
Community Choice Financial Inc. and Subsidiaries
Notes to Consolidated Financial Statements (Continued)
(Dollars in thousands, except per share data)
Note 16. Stock-Based Compensation (Continued)
Stock appreciation rights activity for the year ended December 31, 2011 is as follows (these amounts have not been rounded into thousands):
| |
Shares | Weighted-Average Exercise Price (actual per share price) |
Weighted-Average Remaining Contractual Term |
Aggregate Intrinsic Value (thousands) |
|||||||||
|---|---|---|---|---|---|---|---|---|---|---|---|---|---|
Outstanding at December 31, 2010 |
268,536 | — | 6.1 | N/A | |||||||||
Granted |
292,944 | — | N/A | ||||||||||
Exercised |
— | — | N/A | ||||||||||
Forfeited or expired |
268,536 | — | N/A | ||||||||||
Outstanding at December 31, 2011 |
292,944 | — | 5.5 | N/A | |||||||||
Exercisable at December 31, 2011 |
201,108 | — | 5.2 | $ | 3,401 | ||||||||
Vested or expected to vest at December 31, 2011 |
201,108 | — | 5.2 | $ | 3,401 | ||||||||
As previously described, the Company modified the Plan. As of December 31, 2011, there are 570,270 un-vested stock-options with a Weighted-Average Fair Value at Grant Date of $2.81 and 91,836 un-vested stock appreciation rights with a Weighted-Average Fair Value at Grant Date of $5.09 respectively.
Other information related to Stock Option activity for the years ended December 31, 2011, 2010, and 2009:
| |
2011 | 2010 | 2009 | |||||||
|---|---|---|---|---|---|---|---|---|---|---|
Total fair value of options vested |
$ | 5,324 | $ | 6,472 | $ | 4,388 | ||||
Total intrinsic value of options exercised |
— | — | — | |||||||
Other information related to Stock Appreciation activity for the years ended December 31, 2011, 2010, and 2009:
| |
2011 | 2010 | 2009 | |||||||
|---|---|---|---|---|---|---|---|---|---|---|
Total fair value of SARs vested |
$ | 2,819 | $ | 2,730 | $ | 1,735 | ||||
Total intrinsic value of SARs exercised |
— | — | — | |||||||
Note 17. Income Taxes
Community Choice Financial Inc. and Subsidiaries file a consolidated federal income tax return. The Company files consolidated or separate state income tax returns as permitted by the individual states in which it operates. The effective tax rate for the years ended December 31, 2011, 2010 and 2009 exceeds the statutory rate primarily due to certain acquisition costs that are deductible for financial statement reporting purposes but not deductible for tax purposes. The Company had no liability recorded for unrecognized tax benefits at December 31, 2011 and 2010.
F-32
Community Choice Financial Inc. and Subsidiaries
Notes to Consolidated Financial Statements (Continued)
(Dollars in thousands, except per share data)
Note 17. Income Taxes (Continued)
On August 1, 2011, the Company was advised that the Internal Revenue Service had completed the examination of the Company's federal income tax returns for 2008. The income tax assessment was not material to the Company's consolidated financial statements.
Net deferred tax assets consist of the following components as of December 31, 2011:
| |
Deferred Tax Assets | Deferred Tax Liabilities | |||||||||||
|---|---|---|---|---|---|---|---|---|---|---|---|---|---|
| |
Current | Noncurrent | Current | Noncurrent | |||||||||
Allowance for credit losses |
$ | 2,218 | $ | — | $ | — | $ | — | |||||
Goodwill |
— | — | 1,289 | 3,410 | |||||||||
Accrued expenses |
309 | — | — | — | |||||||||
Depreciable assets |
— | 2,767 | — | — | |||||||||
Intangible asset |
— | 979 | — | 810 | |||||||||
Stock based compensation |
— | 1,014 | — | — | |||||||||
Deferred revenue |
496 | 935 | — | — | |||||||||
Other |
32 | — | — | — | |||||||||
|
$ | 3,055 | $ | 5,695 | $ | 1,289 | $ | 4,220 | |||||
Net deferred tax assets consist of the following components as of December 31, 2010:
| |
Deferred Tax Assets | Deferred Tax Liabilities | |||||||||||
|---|---|---|---|---|---|---|---|---|---|---|---|---|---|
| |
Current | Noncurrent | Current | Noncurrent | |||||||||
Allowance for credit losses |
$ | 1,735 | $ | — | $ | — | $ | — | |||||
Goodwill |
— | 1,191 | — | — | |||||||||
Accrued expenses |
192 | — | — | — | |||||||||
Depreciable assets |
— | 1,624 | — | — | |||||||||
Intangible asset |
— | 874 | — | — | |||||||||
Stock based compensation |
— | 974 | — | — | |||||||||
Deferred revenue |
205 | 202 | — | — | |||||||||
Other |
15 | — | — | — | |||||||||
|
$ | 2,147 | $ | 4,865 | $ | — | $ | — | |||||
The net deferred tax assets and (liabilities) are classified in the consolidated balance sheet as follows:
| |
2011 | 2010 | |||||
|---|---|---|---|---|---|---|---|
Current deferred tax asset |
$ | 3,055 | $ | 2,147 | |||
Noncurrent deferred tax asset |
5,695 | 4,865 | |||||
Current deferred tax liability |
(1,289 | ) | — | ||||
Noncurrent deferred tax liability |
(4,220 | ) | — | ||||
|
$ | 3,241 | $ | 7,012 | |||
F-33
Community Choice Financial Inc. and Subsidiaries
Notes to Consolidated Financial Statements (Continued)
(Dollars in thousands, except per share data)
Note 17. Income Taxes (Continued)
The provision for income taxes charged to operations for the years ended December 31, 2011, 2010 and 2009 consists of the following:
| |
2011 | 2010 | 2009 | |||||||
|---|---|---|---|---|---|---|---|---|---|---|
Current tax expense |
$ | 8,821 | $ | 10,775 | $ | 9,871 | ||||
Deferred tax expense |
2,650 | 5,598 | 2,315 | |||||||
Benefit applied to reduce goodwill |
2,082 | 2,082 | 2,082 | |||||||
|
$ | 13,553 | $ | 18,455 | $ | 14,268 | ||||
Income tax expense (benefit) has been allocated as follows:
| |
2011 | 2010 | 2009 | |||||||
|---|---|---|---|---|---|---|---|---|---|---|
Continuing operations |
$ | 13,553 | $ | 19,801 | $ | 14,042 | ||||
Discontinued operations |
— | (1,346 | ) | 226 | ||||||
|
$ | 13,553 | $ | 18,455 | $ | 14,268 | ||||
The Company's tax basis goodwill exceeds the amount recorded for financial reporting purposes. The accounting for deferred income taxes prohibits immediate recognition of a deferred tax asset created by tax goodwill in excess of book goodwill. The recognition of the tax benefits are required to be recognized when the excess tax goodwill is amortized and deducted on the Company's income tax return. This deduction will occur over the next 15 years from the acquisition date. The benefit for that tax deduction is recognized consistent with the initial recognition of an acquired tax benefit, which requires this amount to be applied as a reduction of goodwill. For reporting purposes, the amount of the tax deduction and the tax benefit attributable to the tax deduction is referred to as "the benefit applied to reduce goodwill" and will be recorded as additional income tax expense in these financial statements and will reduce the carrying amount of goodwill. The total amount of tax amortization of goodwill for the original purchase in 2006, amounted to approximately $14,600 in 2011, 2010 and 2009, respectively.
The reconciliation between income tax expense for financial statement purposes and the amount computed by applying the statutory federal income tax rate of 35% to pretax income before extraordinary item for the years ended December 31, 2011, 2010 and 2009 is as follows:
| |
2011 | 2010 | 2009 | |||||||
|---|---|---|---|---|---|---|---|---|---|---|
Federal tax expense at statutory rate |
$ | 10,642 | $ | 17,389 | $ | 13,617 | ||||
Increase (decrease) in income taxes resulting from: |
||||||||||
State income taxes, net of federal tax benefit |
721 | 1,317 | 1,026 | |||||||
Nondeductible expenses and other items |
2,190 | (251 | ) | (375 | ) | |||||
|
$ | 13,553 | $ | 18,455 | $ | 14,268 | ||||
Community Choice Financial Inc. and Subsidiaries are subject to taxation by the United States and various state jurisdictions. The federal tax return as filed by CheckSmart Financial Holdings Corp. for its 2008 tax year and the certain state tax returns for its 2008 year and forward remain open to examination by tax authorities.
F-34
Community Choice Financial Inc. and Subsidiaries
Notes to Consolidated Financial Statements (Continued)
(Dollars in thousands, except per share data)
Note 18. Net income per common share (actual number of shares disclosed)
Basic net income per common share is computed by dividing net income available to common stockholders by the weighted average number of common shares outstanding for the period. Diluted net income per common share is computed by dividing net income available to common stockholders, increased by the weighted average number of outstanding common shares and incremental shares that may be issued in future periods related to outstanding stock options and stock appreciation rights, if dilutive. When calculating incremental shares related to outstanding stock options and stock appreciation rights, the Company applies the treasury stock method. The treasury stock method assumes that proceeds, consisting of the amount the employee must pay on exercise, compensation cost attributed to future services and not yet recognized, and excess tax benefits that would be credited to additional paid-in capital on exercise of the stock options, are used to repurchase outstanding shares at the average market price for the period. The treasury stock method is applied only to share grants for which the effect is dilutive.
The following table sets forth the computation of basic and diluted earnings per share for the years ended December 31, 2011, 2010 and 2009:
| |
2011 | 2010 | 2009 | |||||||
|---|---|---|---|---|---|---|---|---|---|---|
Income from continuing operations as reported |
$ | 16,853 | $ | 33,425 | $ | 24,269 | ||||
add net loss attributable to non-controlling interests |
120 | 252 | — | |||||||
Numerator for basic and diluted earnings per share—operating income available to common shareholders |
16,973 | 33,677 | 24,269 | |||||||
Discontinued operations |
— | (2,196 | ) | 368 | ||||||
Numerator for basic and diluted earnings per share—net income available to common shareholders |
$ | 16,973 | $ | 31,481 | $ | 24,637 | ||||
The following is a reconciliation of the outstanding shares utilized in the computation of earnings per common share for the years ended December 31, 2011, 2010 and 2009:
| |
2011 | 2010 | 2009 | |||||||
|---|---|---|---|---|---|---|---|---|---|---|
Weighted-average shares outstanding—basic |
7,380,996 | 6,139,536 | 6,139,536 | |||||||
Effect of dilutive options and stock appreciation rights to purchase common stock |
305,076 | 174,822 | 111,780 | |||||||
As adjusted for diluted calculation |
7,686,072 | 6,314,358 | 6,251,316 | |||||||
Effective April 29, 2011, the Company made certain modifications to its equity incentive plan. Accordingly, the Company has computed diluted earnings per share in accordance with ASC 260, which requires that the Company treat the modification as if there was a cancellation and new issuance of an award. Consistent with the approach as outlined within ASC 260 the Company calculated the pre-modification and post-modification awards separately and included each for the weighted average period that each was outstanding.
For the year ended December 31, 2011, the weighted-average shares outstanding for calculating basic earnings per share was 7,380,996. For the weighted-average period prior to the modification, 169,890 shares were dilutive for a total of 7,550,886 shares available to determine dilutive earnings per share. Subsequent to the modification, 370,476 were determined to be dilutive for a total of 7,751,472
F-35
Community Choice Financial Inc. and Subsidiaries
Notes to Consolidated Financial Statements (Continued)
(Dollars in thousands, except per share data)
Note 18. Net income per common share (actual number of shares disclosed) (Continued)
shares available to determine dilutive earnings per share. The potential common shares excluded from diluted earnings per share were 907,668 and 662,106 for the pre and post modification periods as they were considered anti-dilutive.
Note 19. Transactions with Variable Interest Entities
The Company began conducting business through a wholly owned subsidiary registered as a Credit Services Organization ("CSO") under Ohio law during 2009. In connection with operating as a CSO, the Company entered into a credit services organization agreement with an unaffiliated third-party lender in 2009. The agreement governs the terms by which the Company refers customers to that lender, on a non-exclusive basis, for a possible extension of credit, processes loan applications and commits to reimburse the lender for any loans or related fees that were not collected from such customers. During 2010, the Company transitioned away from the CSO model but continued to offer customers access to the third party lender.
The Company has a debt-buying arrangement with the lender whereby it purchases defaulted accounts. The Company accrues for this obligation through management's estimation of anticipated purchases based on expected losses in the lender's portfolio. This obligation is recorded as a current liability on the Company's consolidated balance sheet. The accrual for these obligations totaled $157 and $110 for the years ended December 31, 2011 and 2010, respectively. The Company has determined that the vendor is a VIE but that the Company is not the primary beneficiary of this VIE. Therefore, the Company has not consolidated the lender in 2011 or 2010.
The Company acquired a 22.5% membership interest of Insight Holdings in 2011. As additional consideration to Insight Holdings, the Company agreed to make available to Insight Holdings a revolving credit facility of $3,000. The Company has determined that Insight Holdings is a VIE but that the Company is not the primary beneficiary of this VIE, and therefore has not consolidated Insight in 2011. The investment in Insight is accounted for under the equity method.
Note 20. Optional Card Feature
An optional feature available to some customers who sign up for a prepaid debit card through the Company, as Agent for Insight Card Services, is the ability to have a third-party lender unrelated to the customer direct loan proceeds onto the customer's card. The Company purchases a participation in these loans which is recorded in the finance receivables.
Note 21. Discontinued Operations
In December 2010, the Company decided to discontinue the Buckeye Commercial Check Cashing of Florida, LLC ("Commercial") due to operational performance. The Company completed the liquidation of Commercial and ceased operations in December 2010. The liquidation consisted of normal collection practices with any uncollected balances charged-off by December 31, 2010. No recoveries are anticipated by the Company.
F-36
Community Choice Financial Inc. and Subsidiaries
Notes to Consolidated Financial Statements (Continued)
(Dollars in thousands, except per share data)
Note 21. Discontinued Operations (Continued)
Results from discontinued operations of Commercial for the years ended December 31, 2010 and 2009 were as follows:
| |
2010 | 2009 | |||||
|---|---|---|---|---|---|---|---|
Total Revenue |
$ | 568 | $ | 1,175 | |||
Branch Expenses: |
|||||||
Provision for Loan Losses |
3,471 | 171 | |||||
Selling, general and administrative |
571 | 407 | |||||
Total operating expenses |
4,042 | 578 | |||||
Corporate expenses |
68 | 3 | |||||
Net income (loss) before income taxes |
(3,542 | ) | 594 | ||||
Provision (benefit) for income taxes |
(1,346 | ) | 226 | ||||
Income (loss) from discontinued operations |
$ | (2,196 | ) | $ | 368 | ||
Corporate expenses include only direct expenses that are related to Commercial but were considered corporate type expenses that are typically not allocated to store level operations. There were no significant non-cash assets or liabilities included in the balance sheets at December 31, 2011 and 2010.
Note 22. Equity Method Investments
The Company is accounting for the investment in Insight Holdings Company, LLC, a 22.5% owned affiliate, by the equity method of accounting under which the Company's share of the net income of the affiliate is recognized as income in the Company's statement of income and added to the investment account, and dividends received from the affiliate are treated as a reduction of the investment account.
Condensed financial information as of December 31, 2011 and for the period of November 15 through December 31, 2011 is as follows:
| |
December 31, 2011 | |||
|---|---|---|---|---|
Current assets |
$ | 11,475 | ||
Property & equipment, net |
1,115 | |||
Other assets |
2,017 | |||
Total assets |
$ | 14,607 | ||
Current liabilities |
$ |
14,080 |
||
Long term liabilities |
191 | |||
Members' equity |
336 | |||
Total liabilities and members' equity |
$ | 14,607 | ||
F-37
Community Choice Financial Inc. and Subsidiaries
Notes to Consolidated Financial Statements (Continued)
(Dollars in thousands, except per share data)
Note 22. Equity Method Investments (Continued)
| |
November 15, 2011 through December 31, 2011 |
|||
|---|---|---|---|---|
Revenue |
$ | 5,551 | ||
Cost of goods sold |
4,935 | |||
Gross margin |
616 | |||
General & administrative expenses |
1,111 | |||
Loss from operations |
(495 | ) | ||
Other expense |
(210 | ) | ||
Net loss |
$ | (705 | ) | |
The Company's 22.5% purchase of Insight Holdings Company, LLC resulted in a difference between the purchase price paid and the underlying book value of equity creating implied other intangible assets and implied goodwill. The implied other intangible assets will be amortized over a five-year period. The difference between the purchase price paid and the underlying book value of equity is stated as follows:
| |
|
|||
|---|---|---|---|---|
Equity in net assets |
173 |
|||
Implied other intangible assets |
5,964 | |||
Implied goodwill |
5,113 | |||
|
$ | 11,250 | ||
The Company's share of the loss is $159 which was applied to the initial $11,250 purchase resulting in an $11,091 carrying value for the Company's investment in Insight Holdings as of December 31, 2011.
The Company's share of the loss of Latin Card for the year ended December 31, 2011 was $256. The carrying value of the Company's investment in Latin Card is $18 as of December 31, 2011.
Note 23. Subsequent Events
On April 1, 2012, the Company acquired the equity interests, in the form of both membership units and stock of Direct Financial Solutions, LLC and its subsidiaries ("DFS"), as well as two other affiliated entities, Direct Financial Solutions of UK Limited and its subsidiary Cash Central UK Limited and DFS Direct Financial Solutions of Canada, Inc. and a related company, Reliant Software, Inc., which is owned by a relative of the sellers of DFS. The purchase price for the business was $22,000. Management is evaluating the purchase transaction and has not determined the allocation of the purchase price among the tangible and intangible assets.
On February 14, 2012, the Company authorized an increase to the maximum number of awards available under the 2011 Management Equity Incentive Plan to 2,941,746. The Company also issued 334,020 options and 35,130 restricted stock units with a per share exercise price of $19.95. The options vest ratably over a three year period or become fully vested in the event of a change in control as defined in the award agreement. The restricted stock units vest ratably over a three year period as defined in the award agreement.
F-38
Community Choice Financial Inc. and Subsidiaries
Notes to Consolidated Financial Statements (Continued)
(Dollars in thousands, except per share data)
Note 23. Subsequent Events (Continued)
In April 2012, the company determined to reprice the exercise price of these options, effective as of the date on which a public offering price for the Company's common shares (the "IPO Price") for the Company's initial public offering ("IPO") is determined by the Company (the "Pricing Date"). The new exercise price is contingent on the IPO being consummated within 10 business days after the Pricing Date and not later than December 31, 2012, so that the exercise price for these awards on or after the Pricing Date is the IPO Price.
The Company's board of directors and stockholders approved an amended and restated certificate of incorporation that will, prior to the effectiveness of the registration statement, effect a six-for-one stock split of all the outstanding shares of common stock. The Company will amend and restate its certificate of incorporation to provide that the authorized capital stock will consist of 300,000 shares of common stock at $0.01 par value per share. Accordingly, all common share and per common share amounts for all years presented in these consolidated financial statements and notes thereto, have been adjusted retroactively, where applicable, to reflect this stock split.
On April 22, 2012, the Company entered into an Asset Purchase Agreement in which the Company agreed to acquire the assets of a retail consumer finance operator in the state of Florida. The purchase price is $45,500, which is subject to certain price adjustments not yet determined.
F-39

Independent Auditor's Report
To
the Board of Directors
CCCS Corporate Holdings, Inc.
Oakland, California
We have audited the accompanying consolidated balance sheets of CCCS Corporate Holdings, Inc. and Subsidiaries (the Company) as of December 31, 2010 and 2009, and the related consolidated statements of income, stockholders' equity and cash flows for each of the three years in the period ended December 31, 2010. These consolidated financial statements are the responsibility of the Company's management. Our responsibility is to express an opinion on these consolidated financial statements based on our audits.
We conducted our audits in accordance with auditing standards generally accepted in the United States of America. Those standards require that we plan and perform the audit to obtain reasonable assurance about whether the financial statements are free of material misstatement. An audit includes examining, on a test basis, evidence supporting the amounts and disclosures in the financial statements. An audit also includes assessing the accounting principles used and significant estimates made by management, as well as evaluating the overall financial statement presentation. We believe that our audits provide a reasonable basis for our opinion.
In our opinion, the consolidated financial statements referred to above present fairly, in all material respects, the financial position of CCCS Corporate Holdings, Inc. and Subsidiaries as of December 31, 2010 and 2009, and the results of their operations and their cash flows for each of the three years in the period ended December 31, 2010, in conformity with accounting principles generally accepted in the United States of America.
/s/ McGladrey & Pullen, LLP
Chicago,
Illinois
August 22, 2011
F-40
CCCS Corporate Holdings, Inc. and Subsidiaries
Consolidated Balance Sheets
December 31, 2010 and 2009
(In thousands)
| |
2010 | 2009 | ||||||||
|---|---|---|---|---|---|---|---|---|---|---|
Assets |
||||||||||
Current assets |
||||||||||
Cash |
$ | 26,125 | $ | 33,655 | ||||||
Advances and fees receivable, net |
14,416 | 12,230 | ||||||||
Deferred income taxes |
724 | 642 | ||||||||
Other current assets |
1,176 | 974 | ||||||||
Total current assets |
42,441 | 47,501 | ||||||||
Leasehold improvements and equipment, net |
7,363 | 5,672 | ||||||||
Other assets |
||||||||||
Goodwill |
115,332 | 114,618 | ||||||||
Other intangibles, net |
10,923 | 12,563 | ||||||||
Other assets |
3,018 | 2,410 | ||||||||
|
129,273 | 129,591 | ||||||||
Total assets |
$ | 179,077 | $ | 182,764 | ||||||
Liabilities and Stockholders' Equity |
||||||||||
Current liabilities |
||||||||||
Current portion of long-term debt |
$ | 10,800 | $ | 2,000 | ||||||
Accounts payable, accrued expenses and other payables |
9,552 | 13,385 | ||||||||
Current portion of deferred revenue |
1,125 | 1,125 | ||||||||
Total current liabilities |
21,477 | 16,510 | ||||||||
Long-term liabilities |
||||||||||
Long-term debt, net of current portion |
69,223 | 86,023 | ||||||||
Deferred rent |
631 | 520 | ||||||||
Deferred revenue, net of current portion |
3,625 | 4,750 | ||||||||
Deferred income taxes |
13,129 | 11,285 | ||||||||
|
86,608 | 102,578 | ||||||||
Total liabilities |
108,085 | 119,088 | ||||||||
Commitments and contingencies |
||||||||||
Stockholders' Equity |
||||||||||
Common Stock (par value $.01, 1,000 shares authorized, issued and outstanding in 2010 and 2009) |
— | — | ||||||||
Additional paid-in capital |
27,316 | 27,316 | ||||||||
Retained earnings |
15,255 | 9,777 | ||||||||
Accumulated other comprehensive income |
66 | 169 | ||||||||
Total CCCS Corporate Holdings, Inc. stockholders' equity |
42,637 | 37,262 | ||||||||
Non-controlling interests |
28,355 | 26,414 | ||||||||
Total equity |
70,992 | 63,676 | ||||||||
Total liabilities and stockholders' equity |
$ | 179,077 | $ | 182,764 | ||||||
See Notes to Consolidated Financial Statements.
F-41
CCCS Corporate Holdings, Inc. and Subsidiaries
Consolidated Statements of Income
Years Ended December 31, 2010, 2009 and 2008
(In thousands)
| |
2010 | 2009 | 2008 | ||||||||
|---|---|---|---|---|---|---|---|---|---|---|---|
Revenue: |
|||||||||||
Payroll advance fees, net |
$ | 32,278 | $ | 25,799 | $ | 25,016 | |||||
Check cashing fees |
29,408 | 27,797 | 28,352 | ||||||||
Other revenue |
12,402 | 9,787 | 9,752 | ||||||||
|
74,088 | 63,383 | 63,120 | ||||||||
Store expenses: |
|||||||||||
Salaries and fringe benefits |
23,156 | 18,325 | 17,928 | ||||||||
Occupancy costs |
8,470 | 5,932 | 5,856 | ||||||||
Provision for losses from returned checks |
6,943 | 5,704 | 6,777 | ||||||||
Other store expenses |
6,362 | 5,093 | 5,454 | ||||||||
|
44,931 | 35,054 | 36,015 | ||||||||
Stores gross profit |
29,157 | 28,329 | 27,105 | ||||||||
Corporate and other expenses: |
|||||||||||
Selling, general, and administrative expenses |
6,608 | 6,273 | 6,005 | ||||||||
Non-recurring class action settlement costs |
— | 2,313 | — | ||||||||
Non-recurring debt acquisition costs |
— | 107 | — | ||||||||
Interest expense and finance fees |
4,436 | 4,646 | 7,927 | ||||||||
Depreciation and amortization |
3,630 | 3,698 | 4,085 | ||||||||
|
14,674 | 17,037 | 18,017 | ||||||||
Income from continuing operations before provision for income taxes |
14,483 | 11,292 | 9,088 | ||||||||
Provision for income taxes |
4,716 | 2,864 | 2,575 | ||||||||
Income from continuing operations |
9,767 | 8,428 | 6,513 | ||||||||
Loss from discontinued operations, net of benefit for income tax of $210, $0 and $0 (Note 12) |
(457 | ) | — | — | |||||||
Net income |
9,310 | 8,428 | 6,513 | ||||||||
Net income attributable to non-controlling interest |
3,832 | 3,460 | 3,762 | ||||||||
Net income attributable to CCCS Corporate Holdings, Inc. |
$ | 5,478 | $ | 4,968 | $ | 2,751 | |||||
See Notes to Consolidated Financial Statements.
F-42
CCCS Corporate Holdings, Inc. and Subsidiaries
Consolidated Statements of Stockholders' Equity
Years Ended December 31, 2010, 2009 and 2008
(In thousands)
| |
|
|
|
|
|
Accumulative Other Comprehensive Income (Loss) |
|
|
|||||||||||||||||||
|---|---|---|---|---|---|---|---|---|---|---|---|---|---|---|---|---|---|---|---|---|---|---|---|---|---|---|---|
| |
Common Stock | |
|
|
|
|
|||||||||||||||||||||
| |
Additional Paid-In Capital |
Retained Earnings |
Non- Controlling Interest |
Comprehensive Income |
|
||||||||||||||||||||||
| |
Shares | Amount | Total | ||||||||||||||||||||||||
Balances, December 31, 2007 |
1,000 | $ | — | $ | 27,316 | $ | 2,058 | $ | 22,687 | $ | — | $ | — | $ | 52,061 | ||||||||||||
Equity-based compensation |
— | — | — | — | 88 | — | — | 88 | |||||||||||||||||||
Tax distributions to non-controlling interests |
— | — | — | — | (2,065 | ) | — | — | (2,065 | ) | |||||||||||||||||
Other comprehensive income: |
|||||||||||||||||||||||||||
Net income |
— | — | — | 2,751 | 3,762 | — | 6,513 | 6,513 | |||||||||||||||||||
Effect of unrealized retained interest in assets sold |
— | — | — | — | — | 340 | 340 | 340 | |||||||||||||||||||
Total comprehensive income |
$ | 6,853 | |||||||||||||||||||||||||
Balances, December 31, 2008 |
1,000 | — | 27,316 | 4,809 | 24,472 | 340 | 56,937 | ||||||||||||||||||||
Equity-based compensation |
— | — | — | — | 38 | — | — | 38 | |||||||||||||||||||
Tax distributions to non-controlling interests |
— | — | — | — | (1,556 | ) | — | — | (1,556 | ) | |||||||||||||||||
Other comprehensive income: |
|||||||||||||||||||||||||||
Net income |
— | — | — | 4,968 | 3,460 | — | 8,428 | 8,428 | |||||||||||||||||||
Effect of unrealized retained interest in assets sold |
— | — | — | — | — | (171 | ) | (171 | ) | (171 | ) | ||||||||||||||||
Total comprehensive income |
$ | 8,257 | |||||||||||||||||||||||||
Balances, December 31, 2009 |
1,000 | — | 27,316 | 9,777 | 26,414 | 169 | 63,676 | ||||||||||||||||||||
Equity-based compensation |
— | — | — | — | 38 | — | — | 38 | |||||||||||||||||||
Tax distributions to non-controlling interests |
— | — | — | — | (1,929 | ) | — | — | (1,929 | ) | |||||||||||||||||
Other comprehensive income: |
|||||||||||||||||||||||||||
Net income |
— | — | — | 5,478 | 3,832 | — | 9,310 | 9,310 | |||||||||||||||||||
Effect of unrealized retained interest in assets sold |
— | — | — | — | — | (103 | ) | (103 | ) | (103 | ) | ||||||||||||||||
Total comprehensive income |
$ | 9,207 | |||||||||||||||||||||||||
Balances, December 31, 2010 |
1,000 | $ | — | $ | 27,316 | $ | 15,255 | $ | 28,355 | $ | 66 | $ | 70,992 | ||||||||||||||
See Notes to Consolidated Financial Statements.
F-43
CCCS Corporate Holdings, Inc. and Subsidiaries
Consolidated Statements of Cash Flows
Years Ended December 31, 2010, 2009 and 2008
(In thousands)
| |
2010 | 2009 | 2008 | ||||||||||
|---|---|---|---|---|---|---|---|---|---|---|---|---|---|
Cash Flows from Operating Activities |
|||||||||||||
Net income |
$ | 9,310 | $ | 8,428 | $ | 6,513 | |||||||
Depreciation and amortization |
3,630 | 3,698 | 4,085 | ||||||||||
Amortization of deferred financing costs |
541 | 541 | 541 | ||||||||||
Provision for losses from returned checks |
6,942 | 5,704 | 6,777 | ||||||||||
Change in fair value of interest rate swap |
— | (992 | ) | 233 | |||||||||
Loss on disposition of assets |
476 | 115 | 140 | ||||||||||
Deferred income taxes |
1,762 | 1,174 | 1,595 | ||||||||||
Equity-based compensation |
38 | 38 | 88 | ||||||||||
Deferred rent |
111 | 87 | 77 | ||||||||||
Changes in unrealized retained interest in assets sold |
(103 | ) | (171 | ) | 340 | ||||||||
Changes in: |
|||||||||||||
Fees receivable, net |
(94 | ) | 30 | (57 | ) | ||||||||
Other current assets |
(26 | ) | (420 | ) | (108 | ) | |||||||
Other assets |
(113 | ) | 15 | (223 | ) | ||||||||
Accounts payable, accrued expenses and other payables |
(4,107 | ) | 1,157 | (342 | ) | ||||||||
Deferred income |
(1,125 | ) | (375 | ) | 6,196 | ||||||||
Net cash provided by operating activities |
17,242 | 19,029 | 25,855 | ||||||||||
Cash Flows from Investing Activities |
|||||||||||||
Acquisitions of assets of businesses, net of cash |
(3,131 | ) | (11,073 | ) | (1,730 | ) | |||||||
Acquisition of leasehold improvements and equipment |
(1,735 | ) | (721 | ) | (990 | ) | |||||||
Decreases in advances receivable |
(9,994 | ) | (6,318 | ) | (7,855 | ) | |||||||
Decrease (increase) in security deposits |
17 | (58 | ) | (57 | ) | ||||||||
Net cash used in investing activities |
(14,843 | ) | (18,170 | ) | (10,632 | ) | |||||||
Cash Flows from Financing Activities |
|||||||||||||
Decrease in revolving loans, net |
— | — | (1,647 | ) | |||||||||
Repayment of long-term debt |
(8,000 | ) | (3,492 | ) | (2,745 | ) | |||||||
Tax distributions to non-controlling interests |
(1,929 | ) | (1,556 | ) | (2,065 | ) | |||||||
Net cash used in financing activities |
(9,929 | ) | (5,048 | ) | (6,457 | ) | |||||||
Increase (decrease) in cash |
(7,530 | ) | (4,189 | ) | 8,766 | ||||||||
Cash: |
|||||||||||||
Beginning of year |
33,655 | 37,844 | 29,078 | ||||||||||
End of year |
$ | 26,125 | $ | 33,655 | $ | 37,844 | |||||||
F-44
CCCS Corporate Holdings, Inc. and Subsidiaries
Consolidated Statements of Cash Flows (Continued)
Years Ended December 31, 2010, 2009 and 2008
(In thousands)
| |
2010 | 2009 | 2008 | ||||||||||
|---|---|---|---|---|---|---|---|---|---|---|---|---|---|
Supplemental Disclosures of Cash Flow Information |
|||||||||||||
Interest paid |
$ | 3,789 | $ | 4,214 | $ | 6,769 | |||||||
Income taxes paid |
$ | 2,642 | $ | 2,823 | $ | 294 | |||||||
Supplemental Schedule of Noncash Investing and Financing Activities |
|||||||||||||
Business combinations |
|||||||||||||
Assets acquired |
$ | 4,006 | $ | 12,643 | $ | 1,730 | |||||||
Less cash acquired |
(709 | ) | (720 | ) | — | ||||||||
Purchase price, net of cash acquired |
3,297 | 11,923 | 1,730 | ||||||||||
Remainder of purchase price due to seller |
(166 | ) | (850 | ) | — | ||||||||
Purchase price paid |
$ | 3,131 | $ | 11,073 | $ | 1,730 | |||||||
See Notes to Consolidated Financial Statements.
F-45
CCCS Corporate Holdings, Inc. and Subsidiaries
Notes to Consolidated Financial Statements
(Dollars in thousands)
Note 1. Nature of Operations and Significant Accounting Policies
Nature of operations: CCCS Corporate Holdings, Inc and Subsidiaries (the Company) operates in one line of business and provides retail financial services, such as check cashing, payroll advances, money orders, wire transfers and various other related services, for a fee. As of December 31, 2010 and 2009, respectively, business was conducted from 141 and 119 Company-owned and operated stores located in California and Oregon for which the premises are leased from various unrelated and related parties.
Basis of presentation: The accompanying consolidated financial statements include the accounts of the Company and its 80.1% owned subsidiary, CCCS Holdings, LLC, and its wholly-owned subsidiaries California Check Cashing Stores, LLC (CCCS LLC) and FastCash, Inc. (FastCash). All significant intercompany accounts and transactions have been eliminated in consolidation. The Company follows the measurement and presentation requirements for noncontrolling interests in consolidated financial statements. The noncontrolling interests represent the portion of the equity not attributable, directly or indirectly, to CCCS Corporate Holdings, Inc. The profit or loss not attributable, directly or indirectly, to CCCS Corporate Holdings, Inc. is allocated to the net income attributable to noncontrolling interests in the consolidated statements of income.
Accounting policies: The Company follows accounting standards established by the Financial Accounting Standards Board (the FASB) to ensure consistent reporting of financial condition, results of operations, and cash flows. References to Generally Accepted Accounting Principles (GAAP) in these notes are to the FASB Accounting Standards CodificationTM, sometimes referred to as the Codification or ASC.
Use of estimates: The preparation of financial statements in conformity with accounting principles generally accepted in the United States of America requires management to make estimates and assumptions that affect the reported amounts of assets and liabilities and disclosure of contingent assets and liabilities at the date of the financial statements and the reported amounts of revenue and expenses during the reporting period. Actual results could differ from those estimates. Material estimates that are particularly susceptible to change relate to the determination of the allowance for credit losses, impairment of goodwill and fair value of equity-based compensation.
Concentrations: Concentration of credit risk with respect to advances and fees receivable is limited due to the large number of customers comprising the customer base. However, the Company is exposed to a concentration of credit risk inherent in providing alternative financing programs to customers who may not be able to obtain traditional bank financing. The customers are concentrated in California and Oregon and economic conditions in these areas could impact the customers' ability to pay the advance.
Revenue recognition: All of the Company's branch transactions are processed through its point-of-sale system. These transactions include check cashing, bill payment, money transfer, money order sales, and other miscellaneous products and services. The full amount of the check cashing fee is recognized as revenue at the time of the transaction with no allowance for anticipated returned checks. The Company acts in an agency capacity regarding bill payment services, money transfers, and money orders offered and sold at its branches. The Company records the net amount retained as revenue because the supplier is the primary obligor in the arrangement, the amount earned by the Company is fixed, and the supplier is determined to have the ultimate credit risk. Revenue from payroll advances,
F-46
CCCS Corporate Holdings, Inc. and Subsidiaries
Notes to Consolidated Financial Statements (Continued)
(Dollars in thousands)
Note 1. Nature of Operations and Significant Accounting Policies (Continued)
which have terms ranging from 1 to 31 days (in California) and 31 to 40 days (in Oregon), are recognized on a constant yield basis ratably over the term of each advance. As a result of the Company's charge-off policy, all accounts are charged off between 1 and 30 days past due rather than being placed in nonaccrual status.
Cash: At times, the Company may maintain deposits with banks in amounts in excess of federal depository insurance limits, but believes any such amounts do not represent significant credit risk.
Advances and fees receivable: The Company's advances and fees receivable are recorded at amounts charged to customers for check cashing, payroll advances and loans presented on the consolidated balance sheets net of unearned revenue and the allowance for loan losses and doubtful accounts. The Company's allowances for loan losses and doubtful accounts are based on the amount of balances past due, historical charge-off experience, current collection patterns, current economic conditions and other information obtained regarding the financial condition of customers. Payroll advances and related fees are charged off immediately if not collected by the due date. Returned checks are generally charged off 30 to 60 days after return without success in collections. Consumer automobile loans and related fees are charged off immediately in the event of bankruptcy, death or pending legal action. Recoveries are recorded in the period in which they are received.
Leasehold improvements and equipment: Leasehold improvements and equipment are recorded at cost. Provisions for depreciation of depreciable assets are computed under the straight-line method over periods which approximate the estimated useful lives of the assets. Amortization of leasehold improvements is computed over the estimated useful lives of the assets or the term of the lease, whichever is shorter. The costs of assets retired or disposed of and the accumulated depreciation or amortization thereon are removed from the accounts with any gain or loss realized upon sale or disposal charged to the statements of operations. Significant improvements and betterments are capitalized while repairs and maintenance are expensed in the period incurred.
Deferred payroll and consumer automobile loan costs: Direct costs incurred for the origination of payroll and consumer automobile loans are deferred and amortized to payroll advance fee income and other revenue over the contractual lives of the loans using the interest method. Unamortized amounts are recognized in income at the time that loans are paid in full.
Deferred finance costs: Costs incurred in connection with obtaining financing are deferred and amortized as interest expense on a basis which approximates the effective interest rate over the life of the related debt. Deferred finance costs, included in other assets in the Company's consolidated balance sheets amounted to approximately $1,046 and $1,587 at December 31, 2010 and 2009, respectively, net of accumulated amortization of approximately $2,245 and $1,704, as of December 31, 2010 and 2009, respectively.
Goodwill and other intangibles: Under the provisions of ASC 350, Intangibles-Goodwill and Others, purchased goodwill is not amortized but is tested annually for impairment. Goodwill represents the excess cost over the fair value of tangible net assets of the Company and is recorded on the balance sheet. The Company reviews the carrying value of the goodwill and other indefinite life intangibles annually (October 1) and at other times when facts or circumstances indicate that the recorded amount of goodwill and other indefinite life intangibles may be impaired. If this review indicates that goodwill
F-47
CCCS Corporate Holdings, Inc. and Subsidiaries
Notes to Consolidated Financial Statements (Continued)
(Dollars in thousands)
Note 1. Nature of Operations and Significant Accounting Policies (Continued)
and other indefinite life intangibles are not recoverable, the Company's carrying value of the goodwill and other indefinite life intangibles are reduced by the estimated shortfall. No impairment loss was recognized for 2010, 2009 or 2008.
In accordance with ASC 340, Other Assets and Deferred Costs, the Company reviews their long-lived assets periodically to determine potential impairment by comparing the carrying value of the long-lived assets with the estimated future net undiscounted cash flows expected to result from the use of the assets, including cash flows from disposition. Should the sum of the expected future net cash flows be less than the carrying value, the Company would recognize an impairment loss at that date. An impairment loss would be measured by comparing the amount by which the carrying value exceeds the fair value of the long-lived assets. Other intangibles consist of customer relationships, trademarks/trade names, non-compete agreement and software licenses.
Deferred revenue: The Company records upfront fees received under long-term agreements as deferred revenue and such upfront fees are recognized as revenue ratably over the lives of the respective agreements.
Accumulated other comprehensive income: The Company's accumulated other comprehensive income, as reflected in the accompanying consolidated statements of stockholders' equity, consists of the difference between cost and fair value of unrecognized retained interest in assets sold.
Advertising: Costs incurred for producing and communicating advertising are charged to operations when incurred or the first time advertising takes place. Advertising expense for the years ended December 31, 2010, 2009 and 2008, respectively, amounted to approximately $1,265, $1,044 and $935.
Income taxes: The Company accounts for income taxes in accordance with ASC 740, Income Taxes. Under this standard, deferred tax assets and liabilities are recognized for the future tax consequences attributable to differences between the financial statement carrying amount and the tax basis of existing assets and liabilities. Deferred tax assets and liabilities are measured using enacted tax rates expected to apply to taxable income in the years in which those temporary differences are expected to be recovered or settled. Valuation allowances are established, when necessary, to reduce deferred tax assets to the amount expected to be realized.
The Company has not recorded a reserve for any tax positions for which the ultimate deductibility is highly certain but for which there is uncertainty about the timing of such deductibility. The Company files tax returns in all appropriate jurisdictions, which include a federal tax return and state tax returns. Open tax years are 2006 to 2010, which statutes expire in 2011 to 2014, respectively. When and if applicable, potential interest and penalty costs are accrued as incurred, with expenses recognized in selling, general and administrative expenses in the consolidated statements of income. As of December 31, 2010 and 2009, the Company has no liability for unrecognized tax benefits.
New store costs: Start-up costs for new stores such as training, supplies and travel are expensed as incurred.
Store acquisitions: Store acquisitions are accounted for using the purchase method of accounting prescribed by ASC 805, Business Combinations. This method requires the allocation of the purchase price to individual tangible assets acquired, intangible assets acquired arising from contractual or legal
F-48
CCCS Corporate Holdings, Inc. and Subsidiaries
Notes to Consolidated Financial Statements (Continued)
(Dollars in thousands)
Note 1. Nature of Operations and Significant Accounting Policies (Continued)
rights, and liabilities assumed based on their estimated fair values at the date of acquisition. The excess of the cost of acquired assets over the net amounts assigned to assets acquired and liabilities assumed is recognized as goodwill. Beginning January 1, 2009, any costs, including out-of-pocket or incremental costs directly related to the acquisition, such as fees paid to outside consultants for accounting, legal, or engineering investigations or for appraisals, are expensed as transaction costs in the accompanying consolidated statements of income.
Gain or loss on store closure: The Company closes stores in the normal course of business based on store performance, lease termination or unfavorable lease extension terms. For closed stores, a loss is recorded in other store expenses for the write-off of any remaining book value of leasehold improvements and equipment not transferred to other locations and any related closing costs. For stores sold to third parties, a gain or loss is recorded based on the amount received less the write-off of any remaining book value of leasehold improvements and equipment not sold or transferred to other locations and any related closing costs.
Store expenses: The direct costs incurred in operating the stores, excluding depreciation and amortization, are classified as store expenses and are deducted from total revenue to determine contribution attributable to the stores. Store expenses include salary and benefit expense of store employees, rent and other occupancy costs, armored and security costs, losses for returned checks net of recoveries, cash shortages, and other costs incurred by the stores.
Equity-based compensation: The Company applies ASC Topic 718, Stock Compensation, which addresses the accounting for equity-based employee plans. This standard requires that such transactions are accounted for using a fair-value-based method of accounting. Employee costs include all equity-based payments granted to employees based on the grant date estimated fair value over the service period.
Derivative instruments: The Company accounts for derivative instruments under the provisions of ASC 815, Derivatives and Hedging. ASC 815 requires all derivatives to be recognized as assets or liabilities on the balance sheet and measured at fair value. Changes in the fair value of derivatives are either recognized as income or expense or other comprehensive income (loss), depending on the designated purpose of the derivative.
Fair value of financial instruments: The Company accounts for fair value of financial instruments under the provisions of ASC 820, Fair Value Measurements and Disclosures. ASC 820 defines fair value, establishes a framework for measuring fair value, and expands disclosures about fair value measurement. ASC 820 also emphasizes that fair value is a market based measurement, not an entity specific measurement, and sets out a fair value hierarchy with the highest priority being quoted prices in active markets. Under ASC 820, fair value measurements are disclosed by level within that hierarchy. ASC 820 applies to all assets and liabilities that are measured and reported on a fair value basis.
ASC 820 requires disclosure that establishes a framework for measuring fair value in GAAP, and expands disclosure about fair value measurements. This statement enables the reader of the financial statements to assess the inputs used to develop those measurements by establishing a hierarchy for ranking the quality and reliability of the information used to determine fair values. The statement
F-49
CCCS Corporate Holdings, Inc. and Subsidiaries
Notes to Consolidated Financial Statements (Continued)
(Dollars in thousands)
Note 1. Nature of Operations and Significant Accounting Policies (Continued)
requires that assets and liabilities carried at fair value will be classified and disclosed in one of the following three categories:
Level 1. Quoted market prices in active markets for identical assets or liabilities.
Level 2. Observable market based inputs or unobservable inputs that are corroborated by market data.
Level 3. Unobservable inputs that are not corroborated by market data.
In determining the appropriate levels, the Company performs a detailed analysis of the assets and liabilities that are subject to ASC 820. At each reporting period, all assets and liabilities for which the fair value measurement is based on significant unobservable inputs are classified as Level 3.
The estimated fair values of the Company's short-term financial instruments, including receivables and payables arising in the ordinary course of business, approximate their individual carrying amounts due to the relatively short period of time between their origination and expected realization. The recorded values of long-term debt approximate their fair values because the interest rates fluctuate or, if they are fixed, they are based on current rates offered to the Company for debt with similar terms and maturities.
The Company's retained interest in assets sold are carried at fair value and classified within Level 3 due to the lack of observable pricing data. The fair value of the Level 3 retained interest in assets sold is calculated with historical consumer collections data using a static pool analysis that has been discounted to address the appropriate risk profile. Results of the analysis may be adjusted, as appropriate, to reflect other market conditions or the perceived credit risk of the borrower.
Fair Value on a Recurring Basis
The table below presents the balances of assets measured at fair value on a recurring basis.
| |
December 31, 2010 | ||||||||||||
|---|---|---|---|---|---|---|---|---|---|---|---|---|---|
| |
Total | Level 1 | Level 2 | Level 3 | |||||||||
Retained interest in assets sold |
$ | 220 | $ | — | $ | — | $ | 220 | |||||
| |
December 31, 2009 | ||||||||||||
|---|---|---|---|---|---|---|---|---|---|---|---|---|---|
| |
Total | Level 1 | Level 2 | Level 3 | |||||||||
Retained interest in assets sold |
$ | 561 | $ | — | $ | — | $ | 561 | |||||
F-50
CCCS Corporate Holdings, Inc. and Subsidiaries
Notes to Consolidated Financial Statements (Continued)
(Dollars in thousands)
Note 1. Nature of Operations and Significant Accounting Policies (Continued)
The table below sets forth a summary of changes in fair value of the Company's level 3 assets for the years ended December 31, 2010 and 2009.
| |
2010 | 2009 | ||||||
|---|---|---|---|---|---|---|---|---|
Balance, beginning of year |
$ | 561 | $ | 911 | ||||
Total net gains (losses) included in: |
||||||||
Net income |
667 | 926 | ||||||
Other comprehensive income |
103 | 171 | ||||||
Purchases, sales, issuances and settlements, net |
(1,111 | ) | (1,447 | ) | ||||
Balance, end of year |
$ | 220 | $ | 561 | ||||
Governmental regulation: The Company is subject to various state and federal laws and regulations, which are subject to change and which may impose significant costs or limitations on the way the Company conducts or expands its business. Certain limitations include among other things imposed limits on fee rates and other charges, the number of advances to a customer, a cooling off period (not applicable in California), the number of permitted rollovers (not applicable in California), and required licensing and qualification.
Although states provide the primary regulatory framework under which the Company offers payday cash advance services and consumer loans, certain federal laws also impact the business. The Company's payday cash advance services and consumer loans are subject to federal laws and regulations, including the Truth-in-Lending Act (TILA), the Equal Credit Opportunity Act (ECOA), the Fair Credit Reporting Act (FCRA), the Gramm-Leach-Bliley Act (GLBA) and the regulations promulgated for each. Among other things, these laws require disclosure of the principal terms of each transaction to every customer, prohibit misleading advertising, protect against discriminatory lending practices, proscribe unfair credit practices and prohibit creditors from discriminating against credit applicants on the basis of race, sex, age or marital status. The GLBA and its implementing regulations generally require the Company to protect the confidentiality of its customers' nonpublic personal information and to disclose to the Company's customers its privacy policy and practices.
Additionally, various legislation has been proposed or introduced in the U.S. Congress and California legislature to further regulate the cash advance business. Congressional and Legislative members continue to receive pressure from customer advocates and other industry opposition groups to adopt such legislation.
Recent accounting pronouncements: In July 2010, the FASB issued Accounting Standard Update (ASU) No. 2010-20, Receivables (Topic 310): Disclosures about the Credit Quality of Financing Receivables and the Allowance for Credit Losses (ASU 2010-20). The ASU amends FASB Accounting Standards Codification Topic 310, Receivables, to improve the disclosures that an entity provides about the credit quality of its financing receivables and the related allowance for credit losses. As a result of these amendments, an entity is required to disaggregate, by portfolio segment or class of financing receivable, certain existing disclosures and provide certain new disclosures about its financing receivables and related allowance for credit losses. For public entities, the disclosures as of the end of a reporting period are effective for interim and annual reporting periods ending on or after
F-51
CCCS Corporate Holdings, Inc. and Subsidiaries
Notes to Consolidated Financial Statements (Continued)
(Dollars in thousands)
Note 1. Nature of Operations and Significant Accounting Policies (Continued)
December 15, 2010. The disclosures about activity that occurs during a reporting period are effective for interim and annual reporting periods beginning on or after December 15, 2010. The disclosures about the credit quality of the Company's receivables required by the ASU are in Note 2. As this ASU amends only the disclosure requirements for loans and the allowance for credit losses, the adoption of ASU No. 2010-20 did not have a significant impact on the Company's consolidated financial statements.
Subsequent events: The Company has evaluated subsequent events for potential recognition and /or disclosure through August 22, 2011, the date the consolidated financial statements were available to be issued.
Note 2. Advances and Fees Receivable, Credit Quality Information and Allowance for Losses
Advances and fees receivable, net, at December 31, 2010 and 2009, consist of:
| |
2010 | 2009 | |||||
|---|---|---|---|---|---|---|---|
Payroll and other advances receivable |
$ | 13,946 | $ | 12,510 | |||
Consumer automobile advances receivable |
1,133 | 189 | |||||
Returned checks receivable |
315 | 220 | |||||
Commissions receivable |
496 | 403 | |||||
Retained interest in assets sold |
100 | 354 | |||||
Allowance for loan losses and doubtful accounts |
(719 | ) | (631 | ) | |||
Unearned revenue, net of deferred costs |
(855 | ) | (815 | ) | |||
|
$ | 14,416 | $ | 12,230 | |||
Changes in the allowance for the loan losses and doubtful accounts by product type for the year ending December 31, 2010 are as follows:
| |
Balance 1/1/2010 |
Provision | Charge-Offs | Recoveries | Balance 12/31/10 |
Finance Receivables 12/31/2010 |
Allowance as a percentage of receivable |
|||||||||||||||
|---|---|---|---|---|---|---|---|---|---|---|---|---|---|---|---|---|---|---|---|---|---|---|
Payroll and other advances receivable |
$ | 534 | $ | 5,330 | $ | (77,749 | ) | $ | 72,424 | $ | 539 | $ | 13,946 | 3.86 | % | |||||||
Consumer automobile advances receivable* |
31 | 161 | (106 | ) | — | 86 | 2,445 | 3.52 | % | |||||||||||||
Returned checks receivable |
66 | 1,451 | (2,057 | ) | 634 | 94 | 315 | 29.84 | % | |||||||||||||
|
$ | 631 | $ | 6,942 | $ | (79,912 | ) | $ | 73,058 | $ | 719 | $ | 16,706 | 4.30 | % | |||||||
- *
- includes $1,312 classified in other assets
F-52
CCCS Corporate Holdings, Inc. and Subsidiaries
Notes to Consolidated Financial Statements (Continued)
(Dollars in thousands)
Note 2. Advances and Fees Receivable, Credit Quality Information and Allowance for Losses (Continued)
Activity in the allowance for loan losses and doubtful accounts for the years ended December 31, 2009 and 2008, was as follows:
| |
2009 | 2008 | |||||
|---|---|---|---|---|---|---|---|
Balance, beginning of year |
$ | 298 | $ | 300 | |||
Provision for losses from returned checks |
5,704 | 6,777 | |||||
Charge-offs, net |
(5,371 | ) | (6,779 | ) | |||
Balance, end of year |
$ | 631 | $ | 298 | |||
The Company considers the near term repayment performance of finance receivables as its primary credit quality indicator. The Company does not perform credit checks through consumer reporting agencies. If a third-party lender provides the advance, the applicable third-party lender decides whether to approve the cash advance and establishes all of the underwriting criteria and terms, conditions, and features of the customer agreements. The due date depends on the product.
Aging of receivables are as follows:
| |
December 31, 2010 | |||
|---|---|---|---|---|
Current finance receivables |
$ | 14,941 | ||
Past due finance receivables (1-30 days) |
1,765 | |||
|
$ | 16,706 | ||
Advances and fees include deferred advance costs of approximately $31 and $18 at December 31, 2010 and 2009, respectively. The effect of payroll advance costs on payroll advance fees for the years ended December 31, 2010, 2009 and 2008 was as follows:
| |
2010 | 2009 | 2008 | |||||||
|---|---|---|---|---|---|---|---|---|---|---|
Payroll advance fees, gross |
$ | 33,211 | $ | 26,569 | $ | 25,731 | ||||
Amortization of deferred payroll advance costs |
(933 | ) | (770 | ) | (715 | ) | ||||
Payroll advance fees, net |
$ | 32,278 | $ | 25,799 | $ | 25,016 | ||||
F-53
CCCS Corporate Holdings, Inc. and Subsidiaries
Notes to Consolidated Financial Statements (Continued)
(Dollars in thousands)
Note 3. Leasehold Improvements and Equipment
Leasehold improvements and equipment, net, at December 31, 2010 and 2009 consist of:
| |
2010 | 2009 | Depreciable Lives |
|||||
|---|---|---|---|---|---|---|---|---|
Fixtures and equipment |
$ | 6,479 | $ | 5,742 | 2-9 years | |||
Leasehold improvements |
6,062 | 3,626 | 2-9 years | |||||
Automobiles |
5 | 5 | 5 years | |||||
Software |
397 | 247 | 5 years | |||||
|
12,943 | 9,620 | ||||||
Accumulated depreciation and amortization |
(5,580 | ) | (3,948 | ) | ||||
|
$ | 7,363 | $ | 5,672 | ||||
Total depreciation and amortization expense amounted to approximately $1,710, $1,144 and $1,256 for the years ended December 31, 2010, 2009 and 2008, respectively.
Note 4. Intangible Assets
Intangible assets, net, at December 31, 2010 and 2009 consist of:
| |
2010 | 2009 | Estimated Life |
||||||
|---|---|---|---|---|---|---|---|---|---|
Gross carrying amount |
|||||||||
Customer relationships |
$ | 14,070 | $ | 13,790 | 3-7 years | ||||
Trademarks/tradenames |
7,000 | 7,000 | Indefinite | ||||||
Non-compete agreements |
380 | 380 | 4 years | ||||||
Software licenses |
73 | 73 | 1 year | ||||||
Licensed tradename |
110 | 110 | 5 years | ||||||
|
21,633 | 21,353 | |||||||
Accumulated amortization |
(10,710 | ) | (8,790 | ) | |||||
|
$ | 10,923 | $ | 12,563 | |||||
Total amortization expense amounted to approximately $1,921, $2,553 and $2,828 for the years ended December 31, 2010, 2009 and 2008, respectively.
Amortization expense for future years is expected to be as follows:
2011 |
$ | 1,810 | ||
2012 |
1,467 | |||
2013 |
261 | |||
2014 |
166 | |||
2015 |
144 | |||
Thereafter |
75 | |||
|
$ | 3,923 | ||
F-54
CCCS Corporate Holdings, Inc. and Subsidiaries
Notes to Consolidated Financial Statements (Continued)
(Dollars in thousands)
Note 5. Other Assets
Other assets at December 31, 2010 and 2009 consist of:
| |
2010 | 2009 | |||||
|---|---|---|---|---|---|---|---|
Consumer automobile advances receivable |
$ | 1,312 | $ | 219 | |||
Retained interest in assets sold |
119 | 207 | |||||
Deferred financing fees, net |
1,046 | 1,587 | |||||
Security deposits |
428 | 397 | |||||
Other |
113 | — | |||||
|
$ | 3,018 | $ | 2,410 | |||
Note 6. Borrowings
CCCS LLC was obligated to various participating lenders under a First Lien Credit Agreement and a Second Lien Credit Agreement (collectively, the Credit Agreements), both of which were most recently amended March 15, 2007. These Credit Agreements provided for maximum borrowings of up to $145 million, represented by a $20 million revolving loan (including up to a $15 million Swingline commitment), a $77 million Tranche B Loan, and an $18 million Term Loan, plus an uncommitted incremental amount of up to $30 million, bearing interest at either the Alternate Base Rate plus the Applicable Margin or the Adjusted LIBOR Rate plus the Applicable Margin at CCCS LLC's election at the time of drawing on the loans. The interest rates on the Tranche B Loan and Term Loan ranged from 3.26 percent to 3.54 percent and 7.49 percent to 7.52 percent, respectively, as of December 31, 2010. Borrowings under the First Lien Credit Agreement required quarterly payments of principal of $192 or an annual payment of principal based on excess cash flow, as defined, whichever is greater, reduced by any Optional Prepayments occurring within 12 months preceding such prepayments, with final maturity September 29, 2012, and borrowings under the Second Lien Credit Agreement had final maturity September 29, 2013. The loans under the Credit Agreements were secured by substantially all of the assets of CCCS LLC and guaranteed by CCCS Holdings, LLC. The Credit Agreements contained various restrictions, including maintenance of certain financial ratios, limitations on capital expenditures and certain other restrictions. All amounts due under the Credit Agreements were paid in full upon completion of the transaction disclosed in Note 13.
Borrowings at December 31, 2010 and 2009, consist of the following:
| |
2010 | 2009 | |||||
|---|---|---|---|---|---|---|---|
Tranche B loans |
$ | 62,023 | $ | 70,023 | |||
Second Lien loans |
18,000 | 18,000 | |||||
|
80,023 | 88,023 | |||||
Current maturities |
(10,800 | ) | (2,000 | ) | |||
Long-term portion |
$ | 69,223 | $ | 86,023 | |||
CCCS LLC previously entered into an interest rate swap agreement to convert a portion ($30 million notional amount, 5.19 percent fixed rate) of its floating notes payable to fixed rate debt. This derivative instrument was an economic hedge that had not been designated for hedge accounting
F-55
CCCS Corporate Holdings, Inc. and Subsidiaries
Notes to Consolidated Financial Statements (Continued)
(Dollars in thousands)
Note 6. Borrowings (Continued)
treatment. This derivative instrument was reported at fair value with gains and losses recognized in the consolidated statements of income. The agreement was not renewed when it expired on October 26, 2009.
Note 7. Equity Based Compensation
CCCS Holdings, LLC's operating agreement provides for the granting of Class C membership units as incentives to key members of management. These incentive units vest ratably over a 24 to 48-month period provided that employment has not terminated.
A summary of Class C management incentive units for the years ended December 31, 2010, 2009 and 2008, is as follows:
| |
Units | Grant Date Fair Value | Units Vested | |||||||
|---|---|---|---|---|---|---|---|---|---|---|
Outstanding, January 1, 2008 |
35.00 | $ | 278 | 12.50 | ||||||
Granted |
2.50 | 22 | ||||||||
Outstanding, December 31, 2008 |
37.50 | 300 | 25.50 | |||||||
Granted |
— | — | ||||||||
Outstanding, December 31, 2009 |
37.50 | 300 | 30.00 | |||||||
Granted |
— | — | ||||||||
Outstanding, December 31, 2010 |
37.50 | $ | 300 | 34.38 | ||||||
The value of the units granted during 2008 were determined based on the underlying equity value of CCCS Holdings, LLC at the date of grant. The compensation expense associated with these awards is recognized straight-line over the service period. During the years ended December 31, 2010, 2009 and 2008, the Company recorded $38, $38 and $88, respectively, of compensation expense related to these management incentive units and as of December 31, 2010, the total unrecognized compensation cost related to unvested management incentive units was approximately $27.
Note 8. Provision for Income Taxes
The provision for income taxes for the years ended December 31, 2010, 2009 and 2008, consist of the following:
| |
2010 | 2009 | 2008 | |||||||
|---|---|---|---|---|---|---|---|---|---|---|
Current |
$ | 2,744 | $ | 1,690 | $ | 980 | ||||
Deferred |
1,762 | 1,174 | 1,595 | |||||||
|
$ | 4,506 | $ | 2,864 | $ | 2,575 | ||||
F-56
CCCS Corporate Holdings, Inc. and Subsidiaries
Notes to Consolidated Financial Statements (Continued)
(Dollars in thousands)
Note 8. Provision for Income Taxes (Continued)
Income tax expense (benefit) has been allocated as follows:
| |
2010 | 2009 | 2008 | |||||||
|---|---|---|---|---|---|---|---|---|---|---|
Continuing operations |
$ | 4,716 | $ | 2,864 | $ | 2,575 | ||||
Discontinued operations |
(210 | ) | — | — | ||||||
|
$ | 4,506 | $ | 2,864 | $ | 2,575 | ||||
A reconciliation of the provision (benefit) for income taxes with amounts determined by applying the statutory U.S. federal income tax rate to income before income taxes is as follows:
| |
2010 | 2009 | 2008 | |||||||
|---|---|---|---|---|---|---|---|---|---|---|
Computed tax provision at the federal statutory rate |
$ | 4,697 | $ | 3,839 | $ | 3,090 | ||||
State taxes net of federal benefit |
806 | 659 | 530 | |||||||
Effect of pass-through entities |
(1,533 | ) | (1,384 | ) | (1,505 | ) | ||||
Permanent differences and other |
536 | (250 | ) | 460 | ||||||
|
$ | 4,506 | $ | 2,864 | $ | 2,575 | ||||
Under the asset and liability method, deferred income taxes are recognized for the tax consequences of "temporary differences" by applying enacted statutory tax rates applicable to future years to differences between the financial statement carrying amounts and its tax basis of existing assets and liabilities. At December 31, 2010 and 2009, the Company's deferred income tax assets and liabilities consisted of the following:
| |
2010 | 2009 | |||||||
|---|---|---|---|---|---|---|---|---|---|
Deferred tax assets |
|||||||||
Advances and loans receivable |
$ | 247 | $ | 217 | |||||
Other |
511 | 546 | |||||||
|
758 | 763 | |||||||
Deferred tax liabilities |
|||||||||
Retained interest in loans sold |
(74 | ) | (192 | ) | |||||
Leasehold improvements and equipment |
(272 | ) | (358 | ) | |||||
Goodwill and intangible assets |
(12,817 | ) | (10,856 | ) | |||||
|
(13,163 | ) | (11,406 | ) | |||||
Net deferred tax liability |
$ | (12,405 | ) | $ | (10,643 | ) | |||
F-57
CCCS Corporate Holdings, Inc. and Subsidiaries
Notes to Consolidated Financial Statements (Continued)
(Dollars in thousands)
Note 8. Provision for Income Taxes (Continued)
The net deferred tax assets and (liabilities) are classified in the consolidated balance sheets as follows:
| |
2010 | 2009 | |||||
|---|---|---|---|---|---|---|---|
Current |
$ | 724 | $ | 642 | |||
Noncurrent |
(13,129 | ) | (11,285 | ) | |||
|
$ | (12,405 | ) | $ | (10,643 | ) | |
Note 9. Employee Benefit Plan
The Company maintains a 401(k) profit sharing plan for the benefit of all eligible employees. The plan, established under the provisions of section 401(k) of the Internal Revenue Code, provides for discretionary employer contributions. The Company provided for discretionary contributions of approximately $0, $713 and $598 for the years ended December 31, 2010, 2009 and 2008, respectively.
Note 10. Commitments and Contingencies
The Company leases retail and office space under operating leases with related and unrelated parties expiring in various years through 2033. The leases require the Company to pay additional rentals for increases in operating expenses and real estate taxes and contain renewal options. For financial statement purposes, base rent payments are being accounted for on a straight-line basis. Accordingly, the balance sheets reflect a liability for the excess of the expense charged compared to the amount paid. Total rent expense for operating leases amounted to approximately $5,815, $3,786 and $3,543 for the years ended December 31, 2010, 2009 and 2008, respectively, inclusive of approximately $486, $448 and $432 to related parties for the years ended December 31, 2010, 2009 and 2008, respectively.
Future minimum lease payments under noncancelable operating leases as of December 31, 2010 are as follows:
| |
Related Parties |
Third Parties |
Total | |||||||
|---|---|---|---|---|---|---|---|---|---|---|
2011 |
$ | 476 | $ | 5,255 | $ | 5,731 | ||||
2012 |
490 | 4,627 | 5,117 | |||||||
2013 |
— | 3,334 | 3,334 | |||||||
2014 |
— | 2,104 | 2,104 | |||||||
2015 |
— | 886 | 886 | |||||||
Thereafter |
— | 466 | 466 | |||||||
|
$ | 966 | $ | 16,672 | $ | 17,638 | ||||
The Company has an advisory agreement with an affiliate of the Company's controlling member. The advisory agreement requires the Company to pay a management fee of the greater of $800 or 3 percent of EBITDA, as defined, annually through December 31, 2013. Management fee expense for the years ended December 31, 2010, 2009 and 2008 was $800 in all three years. Amounts included in
F-58
CCCS Corporate Holdings, Inc. and Subsidiaries
Notes to Consolidated Financial Statements (Continued)
(Dollars in thousands)
Note 10. Commitments and Contingencies (Continued)
accounts payable related to this agreement were approximately $200 at both December 31, 2010 and 2009.
On February 19, 2010, a California court approved the terms of settlement and agreed upon procedures as set forth in a class action Settlement Agreement brought against the Company by current and former employees of the Company. An amount of $2,039 was accrued and included in accounts payable, accrued expenses and other payables in the accompanying consolidated balance sheet at December 31, 2009 relating to the amount of the settlement plus court costs and attorneys fees. The total cost of this judgment (paid in February 2010) was recognized during 2009 in the accompanying consolidated statement of income.
The Company is party to various other claims, legal actions and complaints arising in the ordinary course of business. In the opinion of management, all such matters are adequately covered by insurance, or, if not so covered, are without merit or are of such kind, or involve such amounts, that unfavorable disposition would not have a material effect on the Company's consolidated financial position or liquidity.
Note 11. Business Combinations
On March 24, 2010, the Company acquired the operations of 20 stores located in Southern California from a competitor for aggregate consideration of $2,662. On December 29, 2009, the Company acquired the operations of 22 stores located in California, Washington and Oregon from a competitor for aggregate consideration of $11,453. During 2010, 2009 and 2008, respectively, the Company also acquired the assets of various other check cashing stores located in California for aggregate cash consideration of $635, $470 and $1,730. The acquisitions are part of a long-term expansion strategy, and served to increase the Company's market presence in California. As a result of these transactions, the purchase price was allocated to certain acquired assets, including a number of identified intangibles in accordance with ASC 805. During 2010, 2009 and 2008, respectively, the goodwill of $787, $6,389 and $1,043 arising from these acquisitions consists largely of synergies and economies of scale expected from combining the operations and entering new markets.
F-59
CCCS Corporate Holdings, Inc. and Subsidiaries
Notes to Consolidated Financial Statements (Continued)
(Dollars in thousands)
Note 11. Business Combinations (Continued)
The following table summarizes the consideration paid for the above mentioned acquisitions and the amounts of the assets acquired and liabilities assumed recognized at the respective acquisition dates:
| |
2010 | 2009 | 2008 | |||||||||
|---|---|---|---|---|---|---|---|---|---|---|---|---|
Consideration: |
||||||||||||
Cash |
$ | 3,131 | $ | 11,073 | $ | 1,730 | ||||||
Due to seller |
166 | 850 | — | |||||||||
|
$ | 3,297 | $ | 11,923 | $ | 1,730 | ||||||
Recognized amounts of identifiable assets acquired: |
||||||||||||
Advances and fees receivable |
$ | 46 | $ | 2,863 | $ | — | ||||||
Other current assets |
68 | — | — | |||||||||
Lease deposits |
49 | 48 | — | |||||||||
Leasehold improvements, furniture and equipment |
2,067 | 1,400 | 687 | |||||||||
Intangible assets |
280 | 1,223 | — | |||||||||
Total identifiable net assets |
2,510 | 5,534 | 687 | |||||||||
Goodwill |
787 | 6,389 | 1,043 | |||||||||
|
$ | 3,297 | $ | 11,923 | $ | 1,730 | ||||||
Acquisition-related costs (included in selling, general and administrative expenses in the Company's consolidated statements of income) |
$ | 61 | $ | 203 | $ | — | ||||||
The acquired advances and fees receivable are payroll advances and have been recorded at fair value which approximates the contractual cash flows that are believed to be collectible because of the short-term nature of such receivables.
The acquired intangibles will be amortized over their useful lives, as estimated by management based on their intended use. The identifiable intangibles and useful lives for the 2010 and 2009 acquisitions are presented below. There were no identifiable assets acquired in the 2008 acquisitions.
| |
Weighted Average Useful Life |
2010 | 2009 | ||||||
|---|---|---|---|---|---|---|---|---|---|
Customer relationships |
6-7 years | $ | 280 | $ | 660 | ||||
Tradename |
5 years | — | 110 | ||||||
Non-compete agreements |
4 years | — | 380 | ||||||
Software licenses |
1 years | — | 73 | ||||||
|
$ | 280 | $ | 1,223 | |||||
For income tax purposes, the intangibles and goodwill recognized will be deductible over 15 years.
All acquisitions in 2010, 2009 and 2008 were financed from the Company's cash reserves.
F-60
CCCS Corporate Holdings, Inc. and Subsidiaries
Notes to Consolidated Financial Statements (Continued)
(Dollars in thousands)
Note 12. Discontinued Operations
Included in the December 29, 2009 acquisition described above were four stores in the State of Washington, under which the Company commenced operations on January 20, 2010. Due to a change in law provision in Washington effective January 1, 2010, it made the business wholly unprofitable. The Company continued operations and made the decision to close its stores in Washington, with the final day of operations being August 21, 2010. After winding up operations, licensing, and other real estate matters, the Company has no further plans to operate in Washington. There are no anticipated future cash flows to be generated from the operation, as there is no longer an operation and it is not expected that customers in Washington will migrate to other Company-owned stores.
As a result of the above the Company determined that the closing of these stores represented a discontinued operation and has reflected a loss from discontinued operations of $457, net of a benefit for income taxes of $210, in the statement of income for the year ended December 31, 2010. This loss is comprised of revenues earned for the period of $158 offset by store expenses of $599 and write-offs of related intangible assets of $226. There were no assets, liabilities, revenues or expenses associated with the Washington stores as of and for the year ended December 31, 2009.
Note 13. Subsequent Event
On March 17, 2011, the Company acquired the operations of a single payroll advance store in Hawthorne, California. The acquisition is part of a long-term expansion strategy and serves to increase the Company's market presence California. The Company paid approximately $754 for the assets acquired, including purchase of receivables and lease buy-out, utilizing cash generated from operations.
On April 13, 2011, the Company entered into an agreement and plan of merger pursuant to which Community Choice Financial Inc. ("CCFI"), a newly-formed holding company, expects to acquire all outstanding shares of CheckSmart Financial Holdings Corp. ("CheckSmart") and all outstanding membership units of the Company. The transaction is structured as a stock-for-stock transaction, with the current equity holders of each of CheckSmart and the Company agreeing to contribute the equity of the separate companies to CCFI in exchange for shares CCFI. As a result of the transaction, the current equity holders of CheckSmart and the Company will own 77% and 23%, respectively, of CCFI. Immediately upon completion of the transaction, CCFI will declare a special dividend payable to its shareholders and pay bonuses to management in an aggregate amount of $125.0 million. On April 29, 2011, all requirements and conditions were met, including the successful completion of a secured senior notes offering in an amount sufficient to repay outstanding indebtedness of both CheckSmart and the Company, and the transaction was consummated as described. As a result of this transaction, the Company determined that an impairment of goodwill and intangible assets occurred in 2011 and recorded an impairment charge of approximately $28,986 during the three months ending March 31, 2011.
F-61
CCCS Corporate Holdings, Inc. and Subsidiaries
Consolidated Balance Sheets
March 31, 2011 and December 31, 2010
(Dollars in thousands)
| |
March 31, 2011 |
December 31, 2010 |
|||||||
|---|---|---|---|---|---|---|---|---|---|
| |
(unaudited) |
|
|||||||
Assets |
|||||||||
Current Assets |
|||||||||
Cash |
$ | 25,260 | $ | 26,125 | |||||
Advances and fees receivable, net |
12,148 | 14,416 | |||||||
Other current assets |
357 | 1,176 | |||||||
Deferred income taxes |
240 | 724 | |||||||
Total current assets |
38,005 | 42,441 | |||||||
Noncurrent Assets |
|||||||||
Leasehold improvements and equipment, net |
7,160 | 7,363 | |||||||
Goodwill |
91,231 | 115,332 | |||||||
Other intangibles, net |
6,244 | 10,923 | |||||||
Other assets |
2,810 | 3,018 | |||||||
Total assets |
$ | 145,450 | $ | 179,077 | |||||
Liabilities and Stockholders' Equity |
|||||||||
Current Liabilities |
|||||||||
Current portion of long-term debt |
$ | 18,400 | $ | 10,800 | |||||
Current portion of deferred revenue |
1,125 | 1,125 | |||||||
Accounts payable and accrued liabilities |
9,024 | 9,552 | |||||||
Total current liabilities |
28,549 | 21,477 | |||||||
Noncurrent Liabilities |
|||||||||
Notes payable |
55,523 | 69,223 | |||||||
Deferred rent |
713 | 631 | |||||||
Deferred revenue |
3,344 | 3,625 | |||||||
Deferred income taxes |
3,552 | 13,129 | |||||||
Total liabilities |
91,681 | 108,085 | |||||||
Commitments and Contingencies |
|||||||||
Stockholders' Equity |
|||||||||
Common stock |
— | — | |||||||
Additional paid-in capital |
27,316 | 27,316 | |||||||
Retained earnings |
1,895 | 15,255 | |||||||
Accumulated other comprehensive income |
46 | 66 | |||||||
Noncontrolling interests |
24,512 | 28,355 | |||||||
Total equity |
53,769 | 70,992 | |||||||
Total liabilities and stockholders' equity |
$ | 145,450 | $ | 179,077 | |||||
See Notes to Unaudited Consolidated Financial Statements.
F-62
CCCS Corporate Holdings, Inc. and Subsidiaries
Consolidated Statements of Income
Three Months Ended March 31, 2011 and 2010
(Unaudited)
(Dollars in thousands)
| |
Three Months Ended March 31, |
||||||||
|---|---|---|---|---|---|---|---|---|---|
| |
2011 | 2010 | |||||||
Revenues: |
|||||||||
Payroll advance fees, net |
$ | 8,105 | $ | 7,479 | |||||
Check cashing fees |
7,428 | 7,582 | |||||||
Other revenue |
3,365 | 2,714 | |||||||
Total revenues |
18,898 | 17,775 | |||||||
Branch expenses: |
|||||||||
Salaries and fringe benefits |
5,941 | 5,467 | |||||||
Occupancy costs |
2,213 | 1,807 | |||||||
Provision for losses from returned checks |
1,202 | 1,741 | |||||||
Other store expenses |
1,577 | 1,441 | |||||||
Total store expenses |
10,933 | 10,456 | |||||||
Stores gross profit |
7,965 | 7,319 | |||||||
Selling, general and administrative expenses |
1,884 | 1,613 | |||||||
Interest expense and finance fees |
1,031 | 1,099 | |||||||
Depreciation and amortization |
954 | 815 | |||||||
Goodwill and other intangibles impairment |
28,986 | — | |||||||
Income (loss) from continuing operations before provision for income taxes |
(24,890 | ) | 3,792 | ||||||
Provision for income taxes |
(7,780 | ) | 1,691 | ||||||
Income (loss) from continuing operations |
(17,110 | ) | 2,101 | ||||||
Loss from discontinued operations |
— | (53 | ) | ||||||
Net Income (loss) |
$ | (17,110 | ) | $ | 2,048 | ||||
Net Income (loss) attributable to non-controlling interest |
(3,750 | ) | 741 | ||||||
Net Income (loss) attributable to CCCS Corporate Holdings, Inc. |
$ | (13,360 | ) | $ | 1,307 | ||||
See Notes to Unaudited Consolidated Financial Statements.
F-63
CCCS Corporate Holdings, Inc. and Subsidiaries
Consolidated Statements of Stockholders' Equity
Three Months Ended March 31, 2011
(Unaudited)
(Dollars in thousands)
| |
Common Stock | |
|
|
Accumulative Other Comprehensive Income (Loss) |
|
|
|||||||||||||||||||
|---|---|---|---|---|---|---|---|---|---|---|---|---|---|---|---|---|---|---|---|---|---|---|---|---|---|---|
| |
Additional Paid-In Capital |
Retained Earnings |
Non- Controlling Interest |
Comprehensive Income (Loss) |
|
|||||||||||||||||||||
| |
Shares | Amount | Total | |||||||||||||||||||||||
Balance, December 31, 2010 |
1,000 | $ | 0 | $ | 27,316 | $ | 15,255 | $ | 28,355 | $ | 66 | $ | 70,992 | |||||||||||||
Equity based compensation |
10 | 10 | ||||||||||||||||||||||||
Tax distributions to non-controlling interests |
(103 | ) | (103 | ) | ||||||||||||||||||||||
Other comprehensive income |
||||||||||||||||||||||||||
Net income (loss) |
(13,360 | ) | (3,750 | ) | (17,110 | ) | (17,110 | ) | ||||||||||||||||||
Effect of unrealized retained interest in assets sold |
(20 | ) | (20 | ) | (20 | ) | ||||||||||||||||||||
|
$ | (17,130 | ) | |||||||||||||||||||||||
Balance, March 31, 2011 |
1,000 | $ | 0 | $ | 27,316 | $ | 1,895 | $ | 24,512 | $ | 46 | $ | 53,769 | |||||||||||||
See Notes to Unaudited Consolidated Financial Statements.
F-64
CCCS Corporate Holdings, Inc. and Subsidiaries
Consolidated Statements of Cash Flows
Three Months Ended March 31, 2011 and 2010
(Unaudited)
(Dollars in thousands)
| |
Three Months Ended March 31, |
||||||||||
|---|---|---|---|---|---|---|---|---|---|---|---|
| |
2011 | 2010 | |||||||||
Cash Flows From Operating Activities |
|||||||||||
Net income (loss) |
$ | (17,110 | ) | $ | 2,101 | ||||||
Gain (loss) from discontinued operations |
(53 | ) | |||||||||
Adjustments to reconcile net income (loss) to net cash provided by operating activities: |
|||||||||||
Provision for loan losses |
1,202 | 1,740 | |||||||||
Goodwill impairment |
28,986 | ||||||||||
Loss on disposal of assets |
— | 35 | |||||||||
Effect of unrealized retained interest in assets sold |
(20 | ) | (42 | ) | |||||||
Depreciation |
488 | 346 | |||||||||
Amortization of intangibles & deferred financing cost |
455 | 459 | |||||||||
Deferred rent |
82 | — | |||||||||
Equity based compensation |
10 | 10 | |||||||||
Deferred income taxes |
(9,093 | ) | 670 | ||||||||
Changes in assets and liabilities: |
|||||||||||
Other assets |
1,027 | 876 | |||||||||
Deferred revenue |
(281 | ) | (281 | ) | |||||||
Accounts payable and accrued expenses |
(528 | ) | (1,243 | ) | |||||||
Net cash provided by operating activities—continuing operations |
5,218 | 4,618 | |||||||||
Cash Flows From Investing Activities |
|||||||||||
Net receivables (originated) repaid |
1,066 | 89 | |||||||||
Net acquired assets, net of cash |
(661 | ) | (2,500 | ) | |||||||
Purchase of leasehold improvements and equipment |
(285 | ) | (385 | ) | |||||||
Net cash provided by (used in) investing activities—continuing operations |
120 | (2,796 | ) | ||||||||
Cash Flows From Financing Activities |
|||||||||||
Tax distributions to non-controlling interests |
(103 | ) | (804 | ) | |||||||
Net payments of long-term debt |
(6,100 | ) | (2,000 | ) | |||||||
Net cash used in financing activities—continuing operations |
(6,203 | ) | (2,804 | ) | |||||||
Net decrease in cash and cash equivalents |
(865 | ) | (982 | ) | |||||||
Cash and cash equivalents: |
|||||||||||
Beginning |
26,125 | 33,655 | |||||||||
Ending |
$ | 25,260 | $ | 32,673 | |||||||
See Notes to Unaudited Consolidated Financial Statements.
F-65
CCCS Corporate Holdings, Inc. and Subsidiaries
Notes to Unaudited Consolidated Financial Statements
(Dollars in thousands)
Note 1. Nature of Operations and Significant Accounting Policies
Nature of operations: CCCS Corporate Holdings, Inc. and Subsidiaries (the Company) operates in one line of business and provides retail financial services, such as check cashing, payroll advances, money orders, wire transfers and various other related services, for a fee. As of March 31, 2011, the Company owned and operated 141 stores in California and Oregon.
Basis of presentation: The accompanying interim unaudited consolidated financial statements of CCCS Corporate Holdings, Inc. and Subsidiaries have been prepared in accordance with accounting principles generally accepted in the United States for interim financial information. They do not include all information and footnotes required by accounting principles generally accepted in the United States for complete financial statements. Although management believes that the disclosures are adequate to prevent the information from being misleading, the interim unaudited consolidated financial statements should be read in conjunction with the Company's audited financial statements for the year ended December 31, 2010. In the opinion of the Company's management, all adjustments consisting of normal recurring adjustments, considered necessary for a fair statement of the Company's financial condition, have been included. The results for any interim period are not necessarily indicative of results to be expected for the year ending December 31, 2011.
Basis of consolidation: The accompanying consolidated financial statements include the accounts of the Company and its 80.1% owned subsidiary, CCCS Holdings, LLC, and its wholly-owned subsidiaries California Check Cashing Stores, LLC (CCCS LLC) and FastCash, Inc. (FastCash). All significant intercompany accounts and transactions have been eliminated in consolidation.
The Company follows the measurement and presentation requirements for non-controlling interests in consolidated financial statements. The non-controlling interests represent the portion of the equity not attributable, directly or indirectly, to CCCS Corporate Holdings, Inc. The profit or loss not attributable, directly or indirectly, to CCCS Corporate Holdings, Inc. is allocated to the net income (loss) attributable to non-controlling interests in the consolidated statements of operations.
Use of estimates: The preparation of financial statements in conformity with accounting principles generally accepted in the United States of America requires management to make estimates and assumptions that affect the reported amounts of assets and liabilities and disclosure of contingent assets and liabilities at the date of the financial statements and the reported amounts of revenue and expenses during the reporting period. Actual results could differ from those estimates. Material estimates that are particularly susceptible to change relate to the determination of the allowance for loan losses, impairment of goodwill and fair value of equity-based compensation.
Concentrations: Concentration of credit risk with respect to advances and fees receivable is limited due to the large number of customers comprising the customer base. However, the Company is exposed to a concentration of credit risk inherent in providing alternative financing programs to customers who may not be able to obtain traditional bank financing. The customers are concentrated in California and Oregon and economic conditions in these areas could impact the customers' ability to pay the advance.
Revenue recognition: All of the Company's branch transactions are processed through its point-of-sale system. These transactions include check cashing, bill payment, money transfer, money order sales, and other miscellaneous products and services. The full amount of the check cashing fee is recognized as revenue at the time of the transaction with no allowance for anticipated returned checks.
F-66
CCCS Corporate Holdings, Inc. and Subsidiaries
Notes to Unaudited Consolidated Financial Statements (Continued)
(Dollars in thousands)
Note 1. Nature of Operations and Significant Accounting Policies (Continued)
The Company acts in an agency capacity regarding bill payment services, money transfers, and money orders offered and sold at its branches. The Company records the net amount retained as revenue because the supplier is the primary obligor in the arrangement, the amount earned by the Company is fixed, and the supplier is determined to have the ultimate credit risk. Revenue from payroll advances, which have terms ranging from 1 to 31 days (in California) and 31 to 40 days (in Oregon), are recognized on a constant yield basis ratably over the term of each advance.
Advances and fees receivable: The Company's advances and fees receivable are recorded at amounts charged to customers for check cashing and payroll advances and presented on the consolidated balance sheets net of unearned revenue and the allowance for loan losses. Provision for loan losses are charged to income in amounts sufficient to cover estimated losses in the loan portfolio. All advances and fees receivable are evaluated collectively for impairment. The Company's allowances for loan losses are based on the amount of balances past due, historical charge-off experience, current collection patterns, current economic conditions and other information obtained regarding the financial condition of customers. Payroll advances and related fees are charged off immediately if not collected by the due date. Returned checks are generally charged off 30 to 60 days after a return item without success in collections. Recoveries are recorded in the period in which they are received.
As a result of the Company's charge-off policies, most accounts are charged-off rather than being placed in nonaccrual status and thus any impact to the consolidated financial statements is immaterial.
Deferred payroll advance costs: Direct costs incurred for the origination of payroll advances are deferred and amortized to payroll advance fee income over the contractual lives of the advances using the interest method. Unamortized amounts are recognized in income at the time that advances are paid in full.
Goodwill and other intangibles: Goodwill represents the excess cost over the fair value of tangible net assets of the Company and is recorded on the balance sheet. The Company tests the carrying value of the goodwill and other indefinite life intangibles annually or when the events and circumstances warrant such a review. If this review indicates that goodwill and other indefinite life intangibles are not recoverable, the Company's carrying value of the goodwill and other indefinite life intangibles are reduced by the estimated shortfall.
As a result of the transaction discussed in Note 12, impairment testing was performed by the Company and management has determined the goodwill is impaired. See Note 3 for further discussion.
In accordance with ASC 340, Other Assets and Deferred Costs, the Company reviews their long-lived assets periodically to determine potential impairment by comparing the carrying value of the long-lived assets with the estimated future net undiscounted cash flows expected to result from the use of the assets, including cash flows from disposition. Should the sum of the expected future net cash flows be less than the carrying value, the Company would recognize an impairment loss at that date. An impairment loss would be measured by comparing the amount by which the carrying value exceeds the fair value of the long-lived assets. Other intangibles consist of customer relationships, trademarks/trade names, non-compete agreement and software licenses.
F-67
CCCS Corporate Holdings, Inc. and Subsidiaries
Notes to Unaudited Consolidated Financial Statements (Continued)
(Dollars in thousands)
Note 1. Nature of Operations and Significant Accounting Policies (Continued)
Accumulated other comprehensive income: The Company's accumulated other comprehensive income, as reflected in the accompanying consolidated statement of stockholders' equity, consists of the difference between cost and fair value of unrecognized retained interest in assets sold.
Income taxes: The Company accounts for income taxes in accordance with ASC 740, Income Taxes. Under this standard, deferred tax assets and liabilities are recognized for the future tax consequences attributable to differences between the financial statement carrying amount and the tax basis of existing assets and liabilities. Deferred tax assets and liabilities are measured using enacted tax rates expected to apply to taxable income in the years in which those temporary differences are expected to be recovered or settled. Valuation allowances are established, when necessary, to reduce deferred tax assets to the amount expected to be realized.
The Company has not recorded a reserve for any tax positions for which the ultimate deductibility is highly certain but for which there is uncertainty about the timing of such deductibility. The Company files tax returns in all appropriate jurisdictions, which include a federal tax return and state tax returns. Open tax years are 2006 to 2010, which statutes expire in 2011 to 2014, respectively. When and if applicable, potential interest and penalty costs are accrued as incurred, with expenses recognized in selling, general and administrative expenses in the consolidated statements of operations. As of March 31, 2011 and December 31, 2010, the Company has no liability for unrecognized tax benefits.
Equity-based compensation: The Company applies ASC Topic 718, Stock Compensation, which addresses the accounting for equity-based employee plans. This standard requires that such transactions are accounted for using a fair-value-based method of accounting. Employee costs include all equity-based payments granted to employees based on the grant date estimated fair value over the service period.
Derivative instruments: The Company accounts for derivative instruments under the provisions of ASC 815, Derivatives and Hedging. ASC 815 requires all derivatives to be recognized as assets or liabilities on the balance sheet and measured at fair value. Changes in the fair value of derivatives are either recognized as income or expense or other comprehensive income (loss), depending on the designated purpose of the derivative.
Fair value of financial instruments: The Company accounts for fair value of financial instruments under the provisions of ASC 820, Fair Value Measurements and Disclosures. ASC 820 defines fair value, establishes a framework for measuring fair value, and expands disclosures about fair value measurement. ASC 820 also emphasizes that fair value is a market based measurement, not an entity specific measurement, and sets out a fair value hierarchy with the highest priority being quoted prices in active markets. Under ASC 820, fair value measurements are disclosed by level within that hierarchy. ASC 820 applies to all assets and liabilities that are measured and reported on a fair value basis.
ASC 820 requires disclosure that establishes a framework for measuring fair value in GAAP, and expands disclosure about fair value measurements. This statement enables the reader of the financial statements to assess the inputs used to develop those measurements by establishing a hierarchy for ranking the quality and reliability of the information used to determine fair values. The statement
F-68
CCCS Corporate Holdings, Inc. and Subsidiaries
Notes to Unaudited Consolidated Financial Statements (Continued)
(Dollars in thousands)
Note 1. Nature of Operations and Significant Accounting Policies (Continued)
requires that assets and liabilities carried at fair value will be classified and disclosed in one of the following three categories:
Level 1. Quoted market prices in active markets for identical assets or liabilities.
Level 2. Observable market based inputs or unobservable inputs that are corroborated by market data.
Level 3. Unobservable inputs that are not corroborated by market data.
In determining the appropriate levels, the Company performs a detailed analysis of the assets and liabilities that are subject to ASC 820. At each reporting period, all assets and liabilities for which the fair value measurement is based on significant unobservable inputs are classified as Level 3.
The estimated fair values of the Company's short-term financial instruments, including receivables and payables arising in the ordinary course of business, approximate their individual carrying amounts due to the relatively short period of time between their origination and expected realization. The recorded values of long-term debt approximate their fair values because the interest rates fluctuate or, if they are fixed, they are based on current rates offered to the Company for debt with similar terms and maturities.
The Company's retained interest in assets sold are carried at fair value and classified within Level 3 due to the lack of observable pricing data. The fair value of the Level 3 retained interest in assets sold is calculated with historical consumer collections data using a static pool analysis that has been discounted to address the appropriate risk profile. Results of the analysis may be adjusted, as appropriate, to reflect other market conditions or the perceived credit risk of the borrower.
Governmental regulation: The Company is subject to various state and federal laws and regulations, which are subject to change and which may impose significant costs or limitations on the way the Company conducts or expands its business. Certain limitations include among other things imposed limits on fee rates and other charges, the number of advances to a customer, a cooling off period (not applicable in California), the number of permitted rollovers (not applicable in California), and required licensing and qualification.
Although states provide the primary regulatory framework under which the Company offers payday cash advance services and consumer loans, certain federal laws also impact the business. The Company's payday cash advance services and consumer loans are subject to federal laws and regulations, including the Truth-in-Lending Act (TILA), the Equal Credit Opportunity Act (ECOA), the Fair Credit Reporting Act (FCRA), the Gramm-Leach-Bliley Act (GLBA) and the regulations promulgated for each. Among other things, these laws require disclosure of the principal terms of each transaction to every customer, prohibit misleading advertising, protect against discriminatory lending practices, proscribe unfair credit practices and prohibit creditors from discriminating against credit applicants on the basis of race, sex, age or marital status. The GLBA and its implementing regulations generally require the Company to protect the confidentiality of its customers' nonpublic personal information and to disclose to the Company's customers its privacy policy and practices.
Additionally, various legislation has been proposed or introduced in the U.S. Congress and California legislature to further regulate the cash advance business. Congressional and Legislative
F-69
CCCS Corporate Holdings, Inc. and Subsidiaries
Notes to Unaudited Consolidated Financial Statements (Continued)
(Dollars in thousands)
Note 1. Nature of Operations and Significant Accounting Policies (Continued)
members continue to receive pressure from consumer advocates and other industry opposition groups to adopt such legislation.
On July 21, 2010, the Dodd-Frank Wall Street Reform and Consumer Protection Act was enacted into law. This act established the semi-autonomous Consumer Financial Protection Bureau ("CFPB") as a consumer watchdog to regulate mortgages, credit cards, payday loans and other financial products. Any changes in state or federal legislation regulating products and services offered by the Company could cause the Company to convert to selling a different product of service, reduce rates, or stop selling a specific product or service. Such changes could have significant adverse impacts on the business by reducing operating margins, eliminating geographic selling areas or curtailing expansion.
Recent accounting pronouncements: In July 2010, the FASB issued Accounting Standard Update No. 2010-20, Disclosures about the Credit Quality of Financing Receivables and the Allowance for Credit Losses (ASU 2010-20). ASU 2010-20 amends the ASC's guidance on receivables by requiring more robust and disaggregated disclosure about the credit quality of an entity's loans and its allowances for loan losses. This update is effective for the Company for annual reporting periods ending after December 15, 2010. The adoption of this guidance did not have a significant impact on the Company's financial position, results of operations or cash flows.
Subsequent events: The Company has evaluated subsequent events (events occurring after March 31, 2011) through August 22, 2011, which represents the date the consolidated financial statements were available to be issued.
Note 2. Advances and Fees Receivables, Credit Quality Information and Allowance for Loan Losses
Advances and fees receivables represent amounts due from customers for advances at March 31, 2011 and December 31, 2010 consisted of the following:
| |
March 31, 2011 |
December 31, 2010 |
|||||
|---|---|---|---|---|---|---|---|
Payroll and other advances receivable |
$ | 11,607 | $ | 13,946 | |||
Consumer automobile advances receivable |
1,069 | 1,133 | |||||
Returned checks receivable |
292 | 315 | |||||
Commissions receivable |
476 | 496 | |||||
Retained interest in assets sold |
81 | 100 | |||||
Unearned advance fees, net of deferred loan costs |
(544 | ) | (855 | ) | |||
Advanced Fees Receivables before Allowance for Loan Losses |
12,981 | 15,135 | |||||
Allowance for loan losses |
(833 | ) | (719 | ) | |||
|
$ | 12,148 | $ | 14,416 | |||
F-70
CCCS Corporate Holdings, Inc. and Subsidiaries
Notes to Unaudited Consolidated Financial Statements (Continued)
(Dollars in thousands)
Note 2. Advances and Fees Receivables, Credit Quality Information and Allowance for Loan Losses (Continued)
Changes in the allowance for loan losses by product type for the three months ended March 31, 2011 was as follows:
Allowance For Loan Losses by Product Type
| |
Balance 1/1/2011 |
Q1 Provision |
Q1 Charge-Offs |
Q1 Recoveries |
Balance 3/31/2011 |
Finance Receivables 3/31/2011 |
Allowance as a percentage of receivable |
|||||||||||||||
|---|---|---|---|---|---|---|---|---|---|---|---|---|---|---|---|---|---|---|---|---|---|---|
Payroll and other advances receivable |
$ | 539 | $ | 950 | ($ | 21,558 | ) | $ | 20,677 | $ | 608 | $ | 11,607 | 5.24 | % | |||||||
Consumer automobile advances receivable* |
86 | 45 | 0 | 0 | 131 | 2,307 | 5.68 | % | ||||||||||||||
Returned checks receivable |
94 | 207 | (412 | ) | 205 | 94 | 292 | 32.19 | % | |||||||||||||
|
$ | 719 | $ | 1,202 | ($ | 21,970 | ) | $ | 20,882 | $ | 833 | $ | 14,206 | 5.86 | % | |||||||
- *
- includes $1,238 finance receivables classified in other assets.
Changes in the allowance for loan losses for the three months ended March 31, 2010 was as follows:
| |
Three Months Ended March 31, |
||||
|---|---|---|---|---|---|
| |
2010 | ||||
Balance, beginning of period |
$ | 631 | |||
Provision for loan losses |
1,741 | ||||
Charge-offs, net |
(1,762 | ) | |||
Balance, end of period |
$ | 610 | |||
The Company considers the near term repayment performance of finance receivables as its primary credit quality indicator. The Company does not perform credit checks through consumer reporting agencies. If a third-party lender provides the advance, the applicable third-party lender decides whether to approve the cash advance and establishes all of the underwriting criteria and terms, conditions, and features of the customer agreements. The due date depends on the product.
Aging of Receivables are as follows (in thousands):
| |
March 31, 2011 |
December 31, 2010 |
|||||
|---|---|---|---|---|---|---|---|
Current finance receivables |
$ | 13,180 | $ | 14,941 | |||
Past due finance receivables (1-30 days) |
1,026 | 1,765 | |||||
|
$ | 14,206 | $ | 16,706 | |||
F-71
CCCS Corporate Holdings, Inc. and Subsidiaries
Notes to Unaudited Consolidated Financial Statements (Continued)
(Dollars in thousands)
Note 3. Goodwill and Other Intangible Assets
The following table summarizes goodwill and other intangible assets as of March 31, 2011 and December 31, 2010:
| |
March 31, 2011 |
December 31, 2010 |
||||||
|---|---|---|---|---|---|---|---|---|
Goodwill from acquisitions |
$ | 115,332 | $ | 115,332 | ||||
Intangible assets acquired from acquisitions |
||||||||
Customer relationships |
14,733 | 14,070 | ||||||
Trademarks |
2,115 | 7,000 | ||||||
Non-compete |
380 | 380 | ||||||
Software licenses |
73 | 73 | ||||||
Licensed trade names |
110 | 110 | ||||||
Impairment of goodwill |
(24,101 | ) | — | |||||
|
108,642 | 136,965 | ||||||
Accumulated amortization |
(11,167 | ) | (10,710 | ) | ||||
|
$ | 97,475 | $ | 126,255 | ||||
The Company tests the carrying value of the goodwill and other indefinite life intangibles annually or when the events and circumstances warrant such a review. If this review indicates that goodwill and other indefinite life intangibles are not recoverable, the Company's carrying value of the goodwill and other indefinite life intangibles are reduced by the estimated shortfall.
The Company entered into an agreement to merge with CheckSmart and the expected closing value indicated that the Company's carrying value of goodwill and other intangibles was impaired.
As a result of the transaction discussed in Note 12, the Company conducted a test for impairment of goodwill as of March 31, 2011. The impairment test of goodwill resulted in the impairment of goodwill totaling $24.1 million and an impairment of trademarks of $4.85 million. The methodology for determining the fair value was a combination of quoted market prices, prices of comparable businesses, discounted estimated cash flows and other valuation techniques.
Note 4. Pledged Assets and Debt
Debt at March 31, 2011 and December 31, 2010 consisted of the following:
| |
March 31, 2011 |
December 31, 2010 |
||||||
|---|---|---|---|---|---|---|---|---|
Tranche B loans, secured, 3.26% - 3.54%, collateralized by all Company assets, quarterly principal payments of $192 and excess cash payments as defined in the agreement, with remaining balance due September 2012 |
$ | 55,923 | $ | 62,023 | ||||
Second Lien loans, secured, 7.49% - 7.52%, collateralized by all Company assets, interest only payments with remaining principal balance due September 2013 |
18,000 | 18,000 | ||||||
|
73,923 | 80,023 | ||||||
Less current maturities |
18,400 | 10,800 | ||||||
Long-term portion |
$ | 55,523 | $ | 69,223 | ||||
F-72
CCCS Corporate Holdings, Inc. and Subsidiaries
Notes to Unaudited Consolidated Financial Statements (Continued)
(Dollars in thousands)
Note 5. Accounts Payable and Accrued Liabilities
Accounts payable and accrued liabilities at March 31, 2011 and December 31, 2010 consisted of the following:
| |
March 31, 2011 |
December 31, 2010 |
|||||
|---|---|---|---|---|---|---|---|
Accounts payable |
$ | 464 | $ | 504 | |||
Money orders payable |
2,718 | 4,058 | |||||
Accrued interest |
106 | 135 | |||||
Accrued payroll and benefits |
860 | 400 | |||||
Wire transfers payable |
1,976 | 2,126 | |||||
Other |
2,900 | 2,329 | |||||
|
$ | 9,024 | $ | 9,552 | |||
Note 6. Equity Based Compensation
CCCS Holdings, LLC Operating Agreement provides for the Board of Directors granting of Class C membership units as incentives to key members of management. These incentive units vest ratably over a 24 to 48-month period provided that employment has not terminated.
A summary of Class C management incentive units for the period ended March 31, 2011 is as follows:
| |
Units | Grant Date Fair Value |
Units Vested | |||||||
|---|---|---|---|---|---|---|---|---|---|---|
Outstanding, December 31, 2010 |
37.50 | $ | 300 | 34.38 | ||||||
Granted |
— | — | ||||||||
Outstanding, March 31, 2011 |
37.50 | $ | 300 | 35.47 | ||||||
The compensation expense associated with these awards is recognized straight-line over the service period. During the three months ended March 31, 2011 and 2010, the Company recorded $10 of compensation expense in both periods related to these management incentive units; and as of March 31, 2011 and December 31, 2010, the total unrecognized compensation cost related to unvested management incentive units was approximately $18 and $27, respectively.
Note 7. Litigation
From time-to-time the Company is a defendant in various lawsuits and administrative proceedings wherein certain amounts are claimed or violations of law or regulations are asserted. In the opinion of the Company's management, these claims are without substantial merit and should not result in judgments which in the aggregate would have a material adverse effect on the Company's consolidated financial statements.
Note 8. Business Combination
On March 24, 2010, the Company acquired the operations of 20 stores located in Southern California from a competitor for aggregate consideration of $2,662. The acquisition was part of a long-term expansion strategy, and served to increase the Company's market presence in California. The purchase price was allocated to certain acquired assets, including a number of identified intangibles in accordance with ASC 805. The goodwill of $420 arising from this acquisition consists largely of synergies and economies of scale expected from combining the operations and entering new markets. All of the goodwill recognized is expected to be deductible for income tax purposes and will be deductible over 15 years.
F-73
CCCS Corporate Holdings, Inc. and Subsidiaries
Notes to Unaudited Consolidated Financial Statements (Continued)
(Dollars in thousands)
Note 8. Business Combination (Continued)
The following table summarizes the consideration paid for the above mentioned acquisition and the amounts of the assets acquired and liabilities assumed recognized at the acquisition date:
Fair value of total consideration transferred, cash |
$ | 2,662 | ||||
Recognized amounts of identifiable assets acquired |
||||||
Advance fees and receivables |
$ | 46 | ||||
Other current assets and deposits |
117 | |||||
Leasehold improvements and equipment |
1,799 | |||||
Identifiable intangible assets |
280 | |||||
Total indentifiable net assets |
2,242 | |||||
Goodwill |
420 | |||||
|
$ | 2,662 | ||||
The acquired advances and fees receivable are payroll advances and have been recorded at fair value which approximates the contractual cash flows that are believed to be collectible because of the short-term nature of such receivables.
The acquired intangibles will be amortized over their useful lives, as estimated by management based on their intended use.
The acquisition was financed from the Company's cash reserves.
Note 9. Income Taxes
The Company and its Subsidiaries file multiple federal income tax returns and a partnership return, where income is allocated to and reported in each non-controlling members' federal and state income tax returns. No provision for federal or state income taxes is reflected in the consolidated financial statements to the extent that such income is required to be reporting by the non-controlling members. The Company files separate state income tax returns as permitted by the individual states in which it operates.
The Company had no liability recorded for unrecognized tax benefits at March 31, 2011 and December 31, 2010.
Note 10. Discontinued Operations
The Company commenced operations in four stores in the State of Washington on January 20, 2010. Due to a change in law provision in Washington effective January 1, 2010, it made the business wholly unprofitable. The Company continued operations and made the decision to close its stores in Washington, with the final day of operations being August 21, 2010. After winding up operations, licensing, and other real estate matters, the Company has no further plans to operate in Washington. There are no anticipated future cash flows to be generated from the operation, as there is no longer an operation and it is not expected that customers in Washington will migrate to other Company-owned stores.
F-74
CCCS Corporate Holdings, Inc. and Subsidiaries
Notes to Unaudited Consolidated Financial Statements (Continued)
(Dollars in thousands)
Note 10. Discontinued Operations (Continued)
Results from discontinued operations of Washington stores for the three months ended March 31, 2011 and 2010 were as follows:
| |
Three Months Ended March 31, |
|||||||
|---|---|---|---|---|---|---|---|---|
| |
2011 | 2010 | ||||||
Total Revenue |
$ | — | $ | 57 | ||||
Branch Expenses: |
||||||||
Provision for loan losses |
— | (24 | ) | |||||
Selling, general and administrative |
— | 134 | ||||||
Total operating expenses |
— | 110 | ||||||
Corporate expenses |
— | — | ||||||
Net loss before income taxes |
— | (53 | ) | |||||
Benefit for income taxes |
— | — | ||||||
Loss from discontinued operations |
$ | — | $ | (53 | ) | |||
There were no significant non-cash assets or liabilities included in the balance sheets at March 31, 2011 and December 31, 2010.
Note 11. Commitments and Contingencies
The Company leases retail and office space under operating leases with related and unrelated parties expiring in various years through 2033. The leases require the Company to pay additional rentals for increases and operating expenses and real estate taxes and contain renewal options. Total rent expense to related parties for the three months ended March 31, 2011 and 2010 was $120 and $123, respectively.
The Company has an advisory agreement with an affiliate of the Company's controlling member. The advisory agreement requires the Company to pay a management fee of the greater of $800 or 3% of EBITDA, as defined, annually through December 31, 2013. Management fee expense for the three months ended March 31, 2011 and 2010 was $200 for both periods.
Note 12. Subsequent Events
In April 2011, Community Choice Financial Inc., ("CCFI"), a newly formed holding company and CheckSmart Financial Holdings Corp., ("CheckSmart") together with CCCS Corporate Holdings, Inc. and CCCS Holdings, LLC entities (collectively, "CCCS") located in the western United States and certain other parties executed an Agreement and Plan of Merger pursuant to which CCFI acquired all outstanding shares of both CheckSmart and CCCS. The transaction was structured as a stock-for-stock transaction, in which the equity holders of each of CheckSmart and CCCS agreed to contribute the equity of the separate companies to CCFI in exchange for shares of the combined company. As a result of the transaction, the equity holders of CheckSmart and CCCS own approximately 77% and 23% of CCFI, respectively.
F-75
CCCS Corporate Holdings, Inc. and Subsidiaries
Notes to Unaudited Consolidated Financial Statements (Continued)
(Dollars in thousands)
Note 12. Subsequent Events (Continued)
In connection with the above transaction, CCFI issued $395,000 8-year senior secured notes. The notes have an interest rate of 10.75% payable semi-annually and will mature on May 1, 2019. The proceeds were used to refinance existing debt, pay fees and expenses, and to finance a special dividend to shareholders and bonuses to management. The amount of special dividend was $120,566 and the amount of bonuses to management was $4,434.
In April 2011, CCFI also entered into a 4-year, $40,000 revolving credit facility concurrent with the notes offering. The revolving credit facility, at the Company's option, bears interest at either (a) LIBOR plus a margin of 5% or (b) an alternative base rate (determined as the greatest of the prime rate, the federal funds effective rate plus 0.5% or 1-month LIBOR plus 1%) plus a margin of 4%, and will mature on April 29, 2015.
Substantially all assets of the Company are pledged as collateral on the senior secured notes and revolving credit facility. The agreements contain various restrictions, including, in the case of the revolving credit facility, a requirement to maintain certain financial ratios, and certain other restrictions.
F-76

Part II
Information not required in prospectus
Item 13. Other expenses of issuance and distribution.
The following table shows the costs and expenses, other than underwriting discounts and commissions, to be incurred in connection with the offering described in this registration statement, all of which will be paid by the registrant. All amounts are estimates, other than the SEC registration fee, the FINRA filing fee and the Nasdaq listing fee.
SEC registration fee |
$ | 16,870 | |
FINRA filing fee |
23,500 | ||
Nasdaq listing fee |
150,000 | ||
Accounting fees and expenses |
765,000 | ||
Legal fees and expenses |
927,000 | ||
Printing and engraving expenses |
258,000 | ||
Blue sky fees and expenses |
0 | ||
Transfer agent and registrar fees and expenses |
4,000 | ||
Miscellaneous expenses |
182,850 | ||
Total |
$ | 2,327,220 | |
Item 14. Indemnification of directors and officers.
Under Section 1701.13 of the Ohio Revised Code, Ohio corporations are authorized to indemnify directors, officers, employees and agents within prescribed limits and must indemnify them under certain circumstances. Ohio law does not provide statutory authorization for a corporation to indemnify directors, officers, employees and agents for settlements, fines or judgments in the context of derivative suits. However, it provides that directors (but not officers, employees or agents) are entitled to mandatory advance of expenses, including attorneys' fees, incurred in defending any action, including derivative actions, brought against the director, provided that the director agrees to cooperate with the corporation concerning the matter and to repay the amount advanced if it is proved by clear and convincing evidence that the director's act or failure to act was done with deliberate intent to cause injury to the corporation or with reckless disregard for the corporation's best interests.
Ohio law does not authorize payment of judgments to a director, officer, employee or agent after a finding of negligence or misconduct in a derivative suit absent a court order. Indemnification is permitted, however, to the extent such person succeeds on the merits. In all other cases, if a director, officer, employee or agent acted in good faith and in a manner he reasonably believed to be in or not opposed to the best interests of the corporation, indemnification is discretionary except as otherwise provided by a corporation's articles of incorporation, code of regulations or by contract except with respect to the advancement of expenses of directors.
Under Ohio law, a director is not liable for monetary damages unless it is provided by clear and convincing evidence that his action or failure to act was undertaken with deliberate intent to cause injury to the corporation or with reckless disregard for the best interests of the corporation. There is, however, no comparable provision limiting the liability of officers, employees or agents of a corporation. The statutory right to indemnification is not exclusive in Ohio, and Ohio corporations may, among other things, procure insurance for such persons.
We include in our code of regulations provisions to indemnify our directors and officers to the fullest extent permitted by the Ohio Revised Code. We have obtained insurance that insures our directors and officers against certain losses and which insures us against our obligations to indemnify the directors and officers.
II-1
Item 15. Recent sales of unregistered securities.
On April 29, 2011, we completed an offering of $395 million aggregate principal amount of 10.75% senior notes due 2019 (the "Notes") at an aggregate offering price of 100%. Credit Suisse Securities (USA) LLC, Jefferies & Company, Inc. and Stephens Inc. acted as initial purchasers for the offering and received an aggregate underwriting discount of $10.2 million. The Notes and related guarantees were offered only to qualified institutional buyers in reliance on the exemption from registration set forth in Rule 144A under the Securities Act of 1933, as amended (the "Securities Act"), and outside the United States to non-U.S. persons in reliance on the exemption from registration set forth in Regulation S under the Securities Act.
On April 29, 2011, in connection with the consummation of the California Acquisition and the formation of our Company, we issued an aggregate of 1,330,256 common shares to our shareholders and issued options to purchase an aggregate of 207,164 common shares to our management in connection with the cancellation of options to purchase shares of CheckSmart, our predecessor.
Item 16. Exhibits and financial statement schedules.
- (a)
- Exhibits
| Number | Description | ||
|---|---|---|---|
| 1.1 | Form of Underwriting Agreement. | ||
2.1** |
Agreement and Plan of Merger, dated as of April 13, 2011, by and among CheckSmart Financial Holdings Corp., Community Choice Financial Inc., CCFI Merger Sub I Inc., CCFI Merger Sub II Inc., the Seller Parties (as defined therein), the Seller Representative (as defined therein), CCCS Corporate Holdings, Inc., CCCS Holdings, LLC and CheckSmart Financial Company |
||
2.2** |
First Amendment to Agreement and Plan of Merger, dated as of April 28, 2011, by and among CheckSmart Financial Holdings Corp., Community Choice Financial Inc., CCFI Merger Sub I Inc., CCFI Merger Sub II Inc., the Seller Parties (as defined therein), the Seller Representative (as defined therein), CCCS Corporate Holdings, Inc., CCCS Holdings, LLC and CheckSmart Financial Company |
||
3.1** |
Articles of Incorporation of Community Choice Financial Inc. |
||
3.2** |
Code of Regulations of Community Choice Financial Inc. |
||
3.3** |
Form of Amendment to Articles of Incorporation of Community Choice Financial Inc. to be in effect following the closing of this offering |
||
4.1 |
Form of specimen common share certificate |
||
4.2** |
Indenture, dated as of April 29, 2011, among Community Choice Financial Inc., the Subsidiary Guarantors (as defined therein) and U.S. Bank National Association, as trustee and collateral agent, with respect to our 10.75% Senior Secured Notes due 2019 |
||
4.3** |
Revolving Credit Agreement, dated as of April 29, 2011, among Community Choice Financial Inc., the lenders party thereto and Credit Suisse AG, as administrative agent |
||
4.4** |
Amended and Restated Credit Agreement, dated as of April 29, 2011, by and between Insight Capital, LLC, and Republic Bank of Chicago |
||
4.5** |
First Modification to Amended and Restated Credit Agreement, dated as of July 31, 2011, by and between Insight Capital, LLC, and Republic Bank of Chicago |
||
II-2
| Number | Description | ||
|---|---|---|---|
| 4.6** | Registration Rights Agreement, dated as of April 29, 2011, among Community Choice Financial Inc., the guarantors party thereto, Credit Suisse Securities (USA) LLC, Jefferies & Company, Inc. and Stephens Inc. | ||
4.7** |
First Supplemental Indenture, dated as of April 1, 2012, among Community Choice Financial Inc., the Guaranteeing Subsidiaries (as defined therein) and U.S. Bank National Association, as trustee |
||
5.1** |
Opinion of Jones Day |
||
10.1** |
Shareholders Agreement, dated as of April 29, 2011, among Community Choice Financial Inc. and the Shareholders of Community Choice Financial Inc. |
||
10.2 |
Community Choice Financial Inc. 2011 Management Equity Incentive Plan, effective as of April 29, 2011, and Amendment No. 1 to the 2011 Management Equity Incentive Plan, dated as of February 1, 2012 |
||
10.3** |
Advisory Services and Monitoring Agreement dated as of April 29, 2011, by and among Community Choice Financial Inc., CheckSmart Financial Company, California Check Cashing Stores, LLC, Diamond Castle Holdings, LLC and GGC Administration, LLC |
||
10.4** |
Employment Agreement, dated as of May 1, 2006, by and between CheckSmart Financial Company and William E. Saunders, Jr., as amended three times to date, including (A) Restricted Share Award Agreement (2006 Management Equity Incentive Plan), dated as of May 1, 2006, between CheckSmart Financial Holdings Corp. and William E. Saunders, Jr., (B) Tandem Stock Option/Stock Unit Liquidity Event Award Agreement (2006 Management Equity Incentive Plan), dated as of May 1, 2006, between CheckSmart Financial Holdings Corp. and William E. Saunders, Jr. and (C) Confidentiality, Non-Competition and Intellectual Property agreement, dated as of May 1, 2006, between CheckSmart Financial Company and William E. Saunders, Jr. |
||
10.5** |
Employment Agreement, dated as of May 1, 2006, by and between CheckSmart Financial Company and Kyle Hanson, as amended two times to date, including (A) Option Grant Award Agreement (2006 Management Equity Incentive Plan), dated as of May 9, 2006, between CheckSmart Financial Holdings Corp. and Kyle Hanson and (B) Confidentiality, Non-Competition and Intellectual Property agreement, dated as of May 1, 2006, between CheckSmart Financial Company and Kyle Hanson |
||
10.6** |
Employment Agreement, dated as of May 1, 2006, by and between CheckSmart Financial Company and Chad Streff, as amended two times to date, including (A) Stock Appreciation Right Award Agreement (2006 Management Equity Incentive Plan), dated as of May 1, 2006, between CheckSmart Financial Holdings Corp. and Chad M. Streff and (B) Confidentiality, Non-Competition and Intellectual Property agreement, dated as of May 1, 2006, between CheckSmart Financial Company and Chad Streff |
||
10.7** |
Employment Agreement, dated as of January 1, 2011, by and between CheckSmart Financial Company and Michael Durbin, including (A) Option Grant Award Agreement (2006 Management Equity Incentive Plan, as amended), dated as of December 31, 2010, between CheckSmart Financial Holdings Corp. and Michael Durbin and (B) Confidentiality, Non-Competition and Intellectual Property agreement, dated as of January 1, 2011, between CheckSmart Financial Company and Michael Durbin |
||
II-3
| Number | Description | ||
|---|---|---|---|
| 10.8** | Employment Agreement, dated as of April 1, 2011, by and between Community Choice Financial Inc. and Bridgette C. Roman, including Confidentiality, Non-Competition and Intellectual Property agreement, dated as of April 1, 2011, between Community Choice Financial Inc. and Bridgette C. Roman | ||
10.9** |
Option Grant Award Agreement (2006 Management Equity Incentive Plan), dated as of June 4, 2007, between CheckSmart Financial Holdings Corp. and Kyle Hanson |
||
10.10** |
Form Option Grant Award Agreement (2006 Management Equity Incentive Plan, as amended), dated as of December 31, 2008, with CheckSmart Financial Holdings Corp. |
||
10.11** |
Option Grant Award Agreement (2006 Management Equity Incentive Plan, as amended), dated as of December 31, 2008, between CheckSmart Financial Holdings Corp. and Bridgette Roman |
||
10.12** |
Stock Appreciation Right Award Agreement (2006 Management Equity Incentive Plan, as amended), dated as of December 31, 2008, between CheckSmart Financial Holdings Corp. and Chad Streff |
||
10.13** |
2012 Executive Compensation, Benefit and Severance Program |
||
10.14** |
Form Option Award Agreement (2011 Management Equity Incentive Plan) |
||
10.15 |
Form Restricted Stock Unit Agreement (2011 Management Equity Incentive Plan) |
||
10.16** |
Amendment to Shareholders Agreement among Community Choice Financial Inc. and the Shareholders of Community Choice Financial Inc., effective as of April 20, 2012 |
||
10.17 |
Checksmart Financial Holdings Corp. 2006 Management Equity Incentive Plan, effective as of May 1, 2006, and Amendment No. 1 to the 2006 Management Equity Incentive Plan, dated as of July 26, 2007 |
||
21.1 |
List of subsidiaries |
||
23.1 |
Consent of McGladrey LLP |
||
23.2 |
Consent of McGladrey LLP |
||
23.3** |
Consent of Jones Day (included in Exhibit 5.1). |
||
24.1** |
Powers of Attorney |
||
24.2** |
Power of Attorney |
||
- **
- Previously filed.
(a) The undersigned registrant hereby undertakes to provide to the underwriters at the closing specified in the underwriting agreement, certificates in such denominations and registered in such names as required by the underwriters to permit prompt delivery to each purchaser.
(b) Insofar as indemnification for liabilities arising under the Securities Act of 1933, as amended, may be permitted to directors, officers and controlling persons of the registrant pursuant to the foregoing provisions, or otherwise, the registrant has been advised that in the opinion of the SEC such indemnification is against public policy as expressed in the Securities Act of 1933, as amended, and is, therefore, unenforceable. In the event that a claim for indemnification against such liabilities (other than the payment by the registrant of expenses incurred or paid by a director, officer or controlling
II-4
person of the registrant in the successful defense of any action, suit or proceeding) is asserted by such director, officer or controlling person in connection with the securities being registered, the registrant will, unless in the opinion of its counsel the matter has been settled by controlling precedent, submit to a court of appropriate jurisdiction the question whether such indemnification by it is against public policy as expressed in the Securities Act of 1933, as amended, and will be governed by the final adjudication of such issue.
(c) The undersigned registrant hereby undertakes that:
1. For purposes of determining any liability under the Securities Act of 1933, as amended, the information omitted from the form of prospectus filed as part of this registration statement in reliance upon Rule 430A and contained in a form of prospectus filed by the registrant pursuant to Rule 424(b)(1) or (4) or 497(h) under the Securities Act of 1933, as amended, shall be deemed to be part of this registration statement as of the time it was declared effective.
2. For the purpose of determining any liability under the Securities Act of 1933, as amended, each post-effective amendment that contains a form of prospectus shall be deemed to be a new registration statement relating to the securities offered therein, and the offering of such securities at that time shall be deemed to be the initial bona fide offering thereof.
II-5
Pursuant to the requirements of the Securities Act of 1933, the registrant has duly caused this registration statement to be signed on its behalf by the undersigned, thereunto duly authorized, in the city of Dublin, State of Ohio, on May 7, 2012.
| COMMUNITY CHOICE FINANCIAL INC. | ||||
By: |
/s/ WILLIAM E. SAUNDERS, JR. Name: William E. Saunders, Jr. Title: Chief Executive Officer |
|||
Pursuant to the requirements of the Securities Act of 1933, as amended, this Registration Statement has been signed by the following persons in the capacities indicated on May 7, 2012.
Signature
|
Title
|
|
|---|---|---|
| /s/ WILLIAM E. SAUNDERS, JR. William E. Saunders, Jr. |
Chief Executive Officer and Director (Principal Executive Officer) |
|
* Michael Durbin |
Chief Financial Officer (Principal Financial Officer and Principal Accounting Officer) |
|
* H. Eugene Lockhart |
Chairman of the Board of Directors |
|
* Lee A. Wright |
Director |
|
* Michael Langer |
Director |
|
* Felix Lo |
Director |
|
* Andrew Rush |
Director |
II-6
Signature
|
Title
|
|
|---|---|---|
| * Eugene Schutt |
Director | |
* David M. Wittels |
Director |
- *
- The undersigned, by signing his name hereto, does sign and execute this registration statement on Form S-1 pursuant to the Power of Attorney executed by the above-named directors and officers of the registrant.
By: |
/s/ WILLIAM E. SAUNDERS, JR. Attorney-in-Fact |
II-7
| Number | List of Exhibits | ||
|---|---|---|---|
| 1.1 | Form of Underwriting Agreement. | ||
| 2.1** | Agreement and Plan of Merger, dated as of April 13, 2011, by and among CheckSmart Financial Holdings Corp., Community Choice Financial Inc., CCFI Merger Sub I Inc., CCFI Merger Sub II Inc., the Seller Parties (as defined therein), the Seller Representative (as defined therein), CCCS Corporate Holdings, Inc., CCCS Holdings, LLC and CheckSmart Financial Company | ||
| 2.2** | First Amendment to Agreement and Plan of Merger, dated as of April 28, 2011, by and among CheckSmart Financial Holdings Corp., Community Choice Financial Inc., CCFI Merger Sub I Inc., CCFI Merger Sub II Inc., the Seller Parties (as defined therein), the Seller Representative (as defined therein), CCCS Corporate Holdings, Inc., CCCS Holdings, LLC and CheckSmart Financial Company | ||
| 3.1** | Articles of Incorporation of Community Choice Financial Inc. | ||
| 3.2** | Code of Regulations of Community Choice Financial Inc. | ||
| 3.3** | Form of Amendment to Articles of Incorporation of Community Choice Financial Inc. to be in effect following the closing of this offering | ||
| 4.1 | Form of specimen common share certificate | ||
| 4.2** | Indenture, dated as of April 29, 2011, among Community Choice Financial Inc., the Subsidiary Guarantors (as defined therein) and U.S. Bank National Association, as trustee and collateral agent, with respect to our 10.75% Senior Secured Notes due 2019 | ||
| 4.3** | Revolving Credit Agreement, dated as of April 29, 2011, among Community Choice Financial Inc., the lenders party thereto and Credit Suisse AG, as administrative agent | ||
| 4.4** | Amended and Restated Credit Agreement, dated as of April 29, 2011, by and between Insight Capital, LLC, and Republic Bank of Chicago | ||
| 4.5** | First Modification to Amended and Restated Credit Agreement, dated as of July 31, 2011, by and between Insight Capital, LLC, and Republic Bank of Chicago | ||
| 4.6** | Registration Rights Agreement, dated as of April 29, 2011, among Community Choice Financial Inc., the guarantors party thereto, Credit Suisse Securities (USA) LLC, Jefferies & Company, Inc. and Stephens Inc. | ||
| 4.7** | First Supplemental Indenture, dated as of April 1, 2012, among Community Choice Financial Inc., the Guaranteeing Subsidiaries (as defined therein) and U.S. Bank National Association, as trustee | ||
| 5.1** | Opinion of Jones Day | ||
| 10.1** | Shareholders Agreement, dated as of April 29, 2011, among Community Choice Financial Inc. and the Shareholders of Community Choice Financial Inc. | ||
| 10.2 | Community Choice Financial Inc. 2011 Management Equity Incentive Plan, effective as of April 29, 2011, and Amendment No. 1 to the 2011 Management Equity Incentive Plan, dated as of February 1, 2012 | ||
| 10.3** | Advisory Services and Monitoring Agreement dated as of April 29, 2011, by and among Community Choice Financial Inc., CheckSmart Financial Company, California Check Cashing Stores, LLC, Diamond Castle Holdings, LLC and GGC Administration, LLC | ||
| 10.4** | Employment Agreement, dated as of May 1, 2006, by and between CheckSmart Financial Company and William E. Saunders, Jr., as amended three times to date, including (A) Restricted Share Award Agreement (2006 Management Equity Incentive Plan), dated as of May 1, 2006, between CheckSmart Financial Holdings Corp. and William E. Saunders, Jr., (B) Tandem Stock Option/Stock Unit Liquidity Event Award Agreement (2006 Management Equity Incentive Plan), dated as of May 1, 2006, between CheckSmart Financial Holdings Corp. and William E. Saunders, Jr. and (C) Confidentiality, Non-Competition and Intellectual Property agreement, dated as of May 1, 2006, between CheckSmart Financial Company and William E. Saunders, Jr. | ||
| Number | List of Exhibits | ||
|---|---|---|---|
| 10.5** | Employment Agreement, dated as of May 1, 2006, by and between CheckSmart Financial Company and Kyle Hanson, as amended two times to date, including (A) Option Grant Award Agreement (2006 Management Equity Incentive Plan), dated as of May 9, 2006, between CheckSmart Financial Holdings Corp. and Kyle Hanson and (B) Confidentiality, Non-Competition and Intellectual Property agreement, dated as of May 1, 2006, between CheckSmart Financial Company and Kyle Hanson | ||
| 10.6** | Employment Agreement, dated as of May 1, 2006, by and between CheckSmart Financial Company and Chad Streff, as amended two times to date, including (A) Stock Appreciation Right Award Agreement (2006 Management Equity Incentive Plan), dated as of May 1, 2006, between CheckSmart Financial Holdings Corp. and Chad M. Streff and (B) Confidentiality, Non-Competition and Intellectual Property agreement, dated as of May 1, 2006, between CheckSmart Financial Company and Chad Streff | ||
| 10.7** | Employment Agreement, dated as of January 1, 2011, by and between CheckSmart Financial Company and Michael Durbin, including (A) Option Grant Award Agreement (2006 Management Equity Incentive Plan, as amended), dated as of December 31, 2010, between CheckSmart Financial Holdings Corp. and Michael Durbin and (B) Confidentiality, Non-Competition and Intellectual Property agreement, dated as of January 1, 2011, between CheckSmart Financial Company and Michael Durbin | ||
| 10.8** | Employment Agreement, dated as of April 1, 2011, by and between Community Choice Financial Inc. and Bridgette C. Roman, including Confidentiality, Non-Competition and Intellectual Property agreement, dated as of April 1, 2011, between Community Choice Financial Inc. and Bridgette C. Roman | ||
| 10.9** | Option Grant Award Agreement (2006 Management Equity Incentive Plan), dated as of June 4, 2007, between CheckSmart Financial Holdings Corp. and Kyle Hanson | ||
| 10.10** | Form Option Grant Award Agreement (2006 Management Equity Incentive Plan, as amended), dated as of December 31, 2008, with CheckSmart Financial Holdings Corp. | ||
| 10.11** | Option Grant Award Agreement (2006 Management Equity Incentive Plan, as amended), dated as of December 31, 2008, between CheckSmart Financial Holdings Corp. and Bridgette Roman | ||
| 10.12** | Stock Appreciation Right Award Agreement (2006 Management Equity Incentive Plan, as amended), dated as of December 31, 2008, between CheckSmart Financial Holdings Corp. and Chad Streff | ||
| 10.13** | 2012 Executive Compensation, Benefit and Severance Program | ||
| 10.14** | Form Option Award Agreement (2011 Management Equity Incentive Plan) | ||
| 10.15 | Form Restricted Stock Unit Agreement (2011 Management Equity Incentive Plan) | ||
| 10.16** | Amendment to Shareholders Agreement among Community Choice Financial Inc. and the Shareholders of Community Choice Financial Inc., effective as of April 20, 2012 | ||
| 10.17 | Checksmart Financial Holdings Corp. 2006 Management Equity Incentive Plan, effective as of May 1, 2006, and Amendment No. 1 to the 2006 Management Equity Incentive Plan, dated as of July 26, 2007 | ||
| 21.1 | List of subsidiaries | ||
| 23.1 | Consent of McGladrey LLP | ||
| 23.2 | Consent of McGladrey LLP | ||
| 23.3** | Consent of Jones Day (included in Exhibit 5.1). | ||
| 24.1** | Powers of Attorney | ||
| 24.2** | Power of Attorney | ||
- **
- Previously filed.