Attached files
| file | filename |
|---|---|
| 8-K - 8-K - BRUKER CORP | a12-11429_18k.htm |
Exhibit 99.1
|
|
Bruker Energy & Supercon Technologies (BEST), Inc. Investor Presentation May 2012 BEST is a wholly owned subsidiary of Bruker Corporation (NASDAQ: BRKR) Think forward |
|
|
Bruker Corporation Safe Harbor Statement 2 Any statements contained in this presentation that do not describe historical facts may constitute forward-looking statements as that term is defined in the Private Securities Litigation Reform Act of 1995. Any forward-looking statements contained herein are based on current expectations, but are subject to risks and uncertainties that could cause actual results to differ materially from those projected, including, but not limited to, risks and uncertainties relating to adverse changes in conditions in the global economy and volatility in the capital markets, the integration of businesses we have acquired or may acquire in the future, changing technologies, product development and market acceptance of our products, the cost and pricing of our products, manufacturing, competition, dependence on collaborative partners and key suppliers, capital spending and government funding policies, changes in governmental regulations, realization of anticipated benefits from economic stimulus programs, intellectual property rights, litigation, and exposure to foreign currency fluctuations and other risk factors discussed from time to time in our filings with the Securities and Exchange Commission. These and other factors are identified and described in more detail in our filings with the SEC, including, without limitation, our annual report on Form 10-K for the year ended December 31, 2011, our most recent quarterly reports on Form 10-Q and our current reports on Form 8-K. We expressly disclaim any intent or obligation to update these forward-looking statements other than as required by law. |
|
|
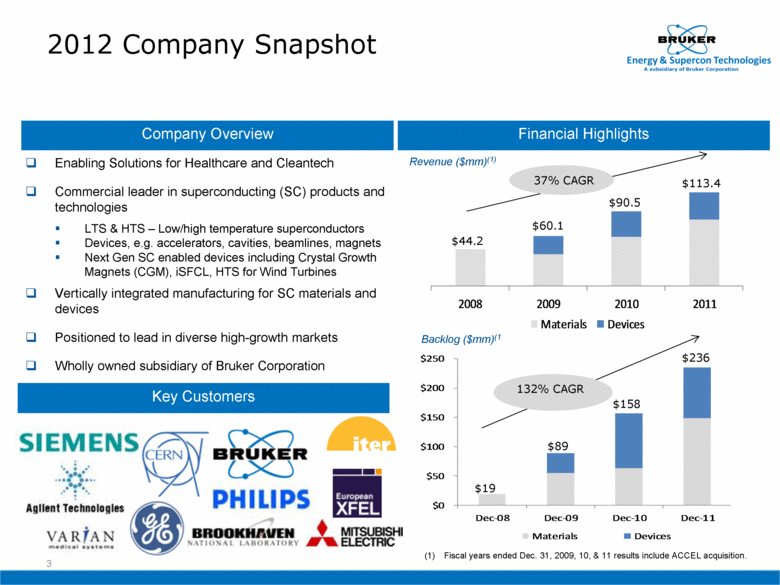
2012 Company Snapshot 3 Enabling Solutions for Healthcare and Cleantech Commercial leader in superconducting (SC) products and technologies LTS & HTS – Low/high temperature superconductors Devices, e.g. accelerators, cavities, beamlines, magnets Next Gen SC enabled devices including Crystal Growth Magnets (CGM), iSFCL, HTS for Wind Turbines Vertically integrated manufacturing for SC materials and devices Positioned to lead in diverse high-growth markets Wholly owned subsidiary of Bruker Corporation Company Overview Financial Highlights Key Customers 37% CAGR 132% CAGR $19 $89 $158 $236 Revenue ($mm)(1) Backlog ($mm)(1 Fiscal years ended Dec. 31, 2009, 10, & 11 results include ACCEL acquisition. $44.2 $60.1 $90.5 $113.4 2008 2009 2010 2011 Materials Devices |
|
|
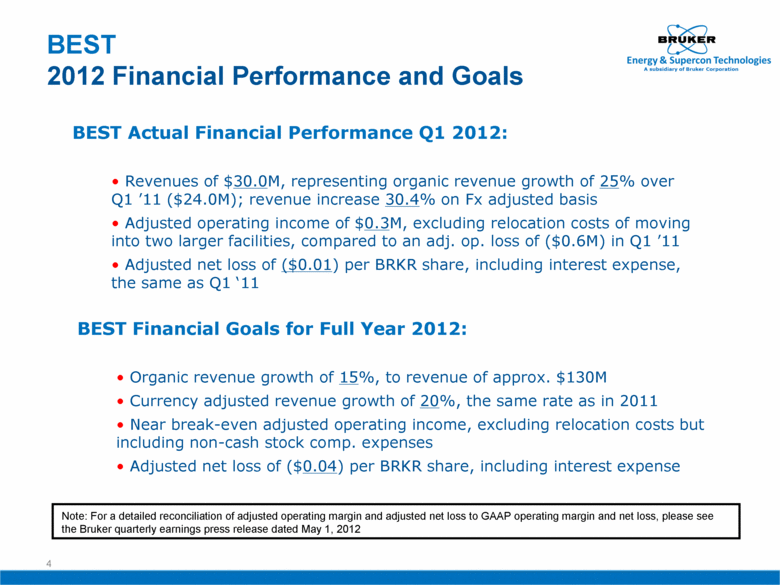
BEST 2012 Financial Performance and Goals 4 BEST Financial Goals for Full Year 2012: Organic revenue growth of 15%, to revenue of approx. $130M Currency adjusted revenue growth of 20%, the same rate as in 2011 Near break-even adjusted operating income, excluding relocation costs but including non-cash stock comp. expenses Adjusted net loss of ($0.04) per BRKR share, including interest expense BEST Actual Financial Performance Q1 2012: Revenues of $30.0M, representing organic revenue growth of 25% over Q1 ’11 ($24.0M); revenue increase 30.4% on Fx adjusted basis Adjusted operating income of $0.3M, excluding relocation costs of moving into two larger facilities, compared to an adj. op. loss of ($0.6M) in Q1 ’11 Adjusted net loss of ($0.01) per BRKR share, including interest expense, the same as Q1 ‘11 Note: For a detailed reconciliation of adjusted operating margin and adjusted net loss to GAAP operating margin and net loss, please see the Bruker quarterly earnings press release dated May 1, 2012 |
|
|
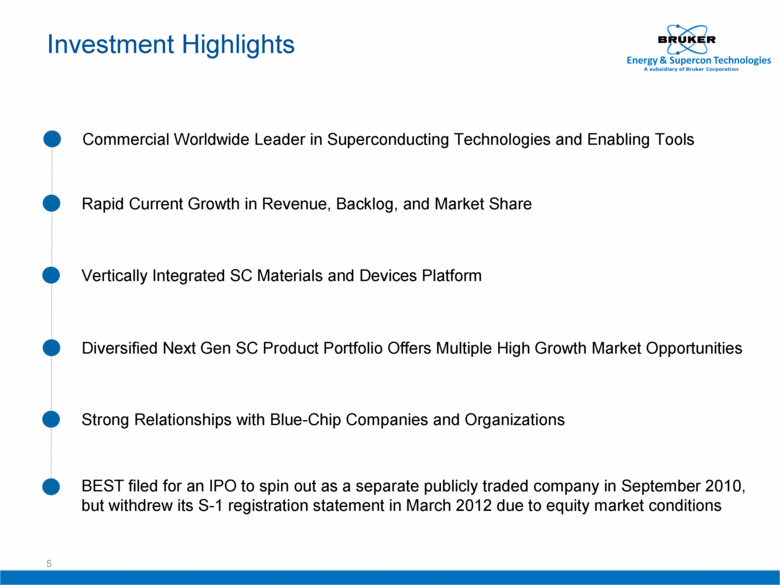
Investment Highlights 5 Commercial Worldwide Leader in Superconducting Technologies and Enabling Tools Vertically Integrated SC Materials and Devices Platform Strong Relationships with Blue-Chip Companies and Organizations BEST filed for an IPO to spin out as a separate publicly traded company in September 2010, but withdrew its S-1 registration statement in March 2012 due to equity market conditions Rapid Current Growth in Revenue, Backlog, and Market Share Diversified Next Gen SC Product Portfolio Offers Multiple High Growth Market Opportunities |
|
|
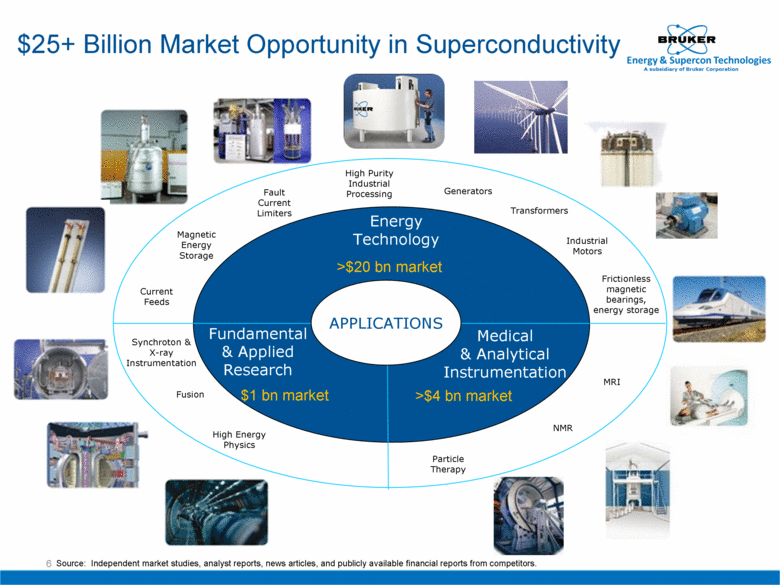
$25+ Billion Market Opportunity in Superconductivity 6 Source: Independent market studies, analyst reports, news articles, and publicly available financial reports from competitors. >$20 bn market >$4 bn market Energy Technology APPLICATIONS $1 bn market Fundamental & Applied Research Medical & Analytical Instrumentation Current Feeds Synchroton & X-ray Instrumentation Fusion High Energy Physics Magnetic Energy Storage Fault Current Limiters Transformers Generators High Purity Industrial Processing Frictionless magnetic bearings, energy storage MRI NMR Particle Therapy Industrial Motors |
|
|
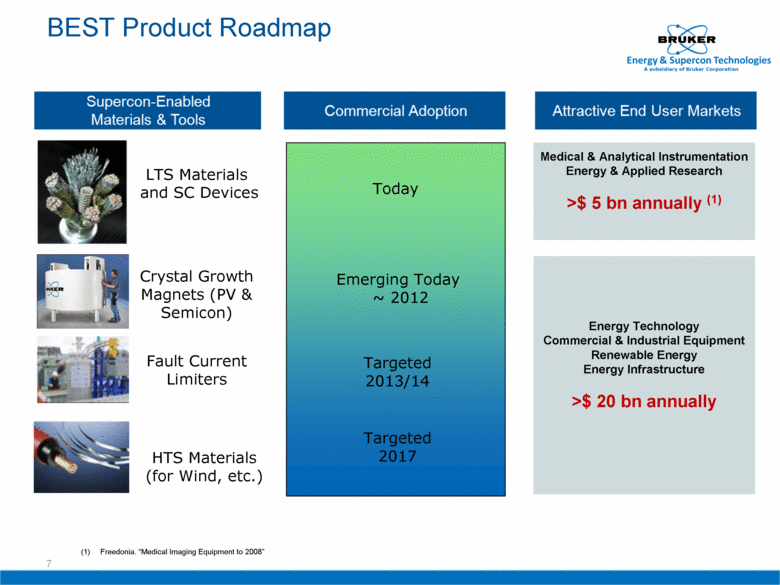
BEST Product Roadmap Emerging Today ~ 2012 Targeted 2013/14 Today Crystal Growth Magnets (PV & Semicon) LTS Materials and SC Devices Fault Current Limiters HTS Materials (for Wind, etc.) Targeted 2017 Freedonia. “Medical Imaging Equipment to 2008” Medical & Analytical Instrumentation Energy & Applied Research >$ 5 bn annually (1) Energy Technology Commercial & Industrial Equipment Renewable Energy Energy Infrastructure >$ 20 bn annually 7 |
|
|
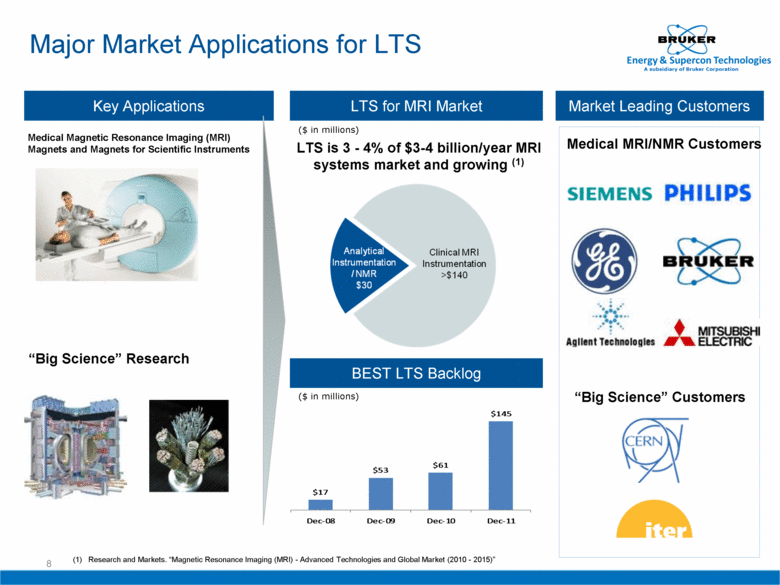
“Big Science” Research Medical Magnetic Resonance Imaging (MRI) Magnets and Magnets for Scientific Instruments 8 Major Market Applications for LTS Key Applications LTS for MRI Market Market Leading Customers LTS is 3 - 4% of $3-4 billion/year MRI systems market and growing (1) (1) Research and Markets. “Magnetic Resonance Imaging (MRI) - Advanced Technologies and Global Market (2010 - 2015)” BEST LTS Backlog ($ in millions) ($ in millions) Medical MRI/NMR Customers “Big Science” Customers $17 $53 $61 $145 Dec-08 Dec-09 Dec-10 Dec-11 |
|
|
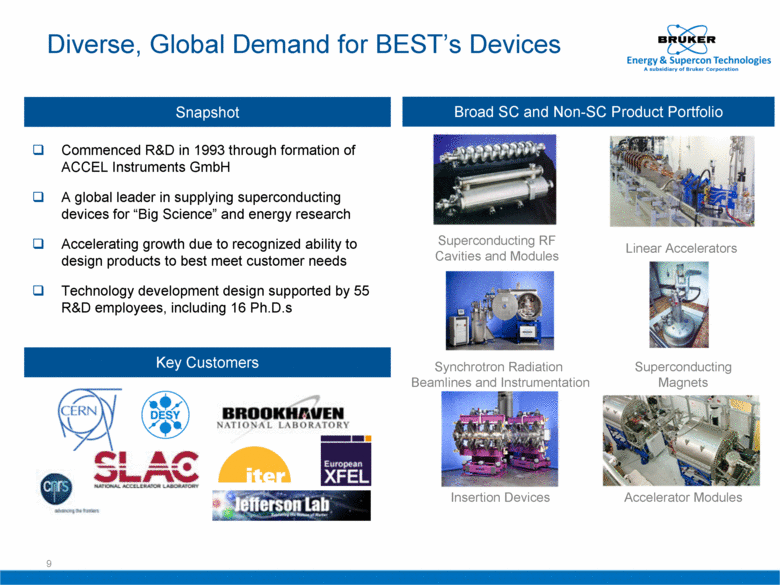
9 Diverse, Global Demand for BEST’s Devices Commenced R&D in 1993 through formation of ACCEL Instruments GmbH A global leader in supplying superconducting devices for “Big Science” and energy research Accelerating growth due to recognized ability to design products to best meet customer needs Technology development design supported by 55 R&D employees, including 16 Ph.D.s Snapshot Broad SC and Non-SC Product Portfolio Superconducting RF Cavities and Modules Linear Accelerators Synchrotron Radiation Beamlines and Instrumentation Key Customers Insertion Devices Superconducting Magnets Accelerator Modules |
|
|
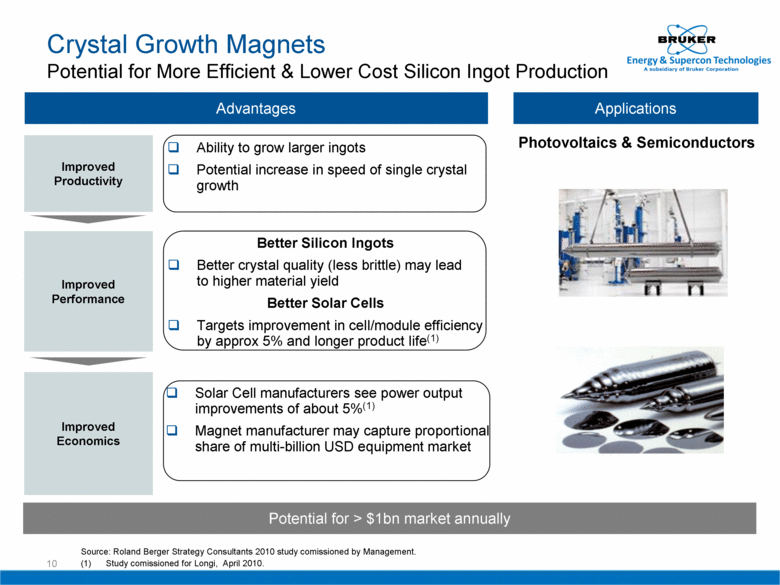
10 Improved Productivity Ability to grow larger ingots Potential increase in speed of single crystal growth Better Silicon Ingots Better crystal quality (less brittle) may lead to higher material yield Better Solar Cells Targets improvement in cell/module efficiency by approx 5% and longer product life(1) Solar Cell manufacturers see power output improvements of about 5%(1) Magnet manufacturer may capture proportional share of multi-billion USD equipment market Advantages Improved Performance Improved Economics Applications Photovoltaics & Semiconductors Source: Roland Berger Strategy Consultants 2010 study comissioned by Management. (1) Study comissioned for Longi, April 2010. Crystal Growth Magnets Potential for More Efficient & Lower Cost Silicon Ingot Production Potential for > $1bn market annually |
|
|
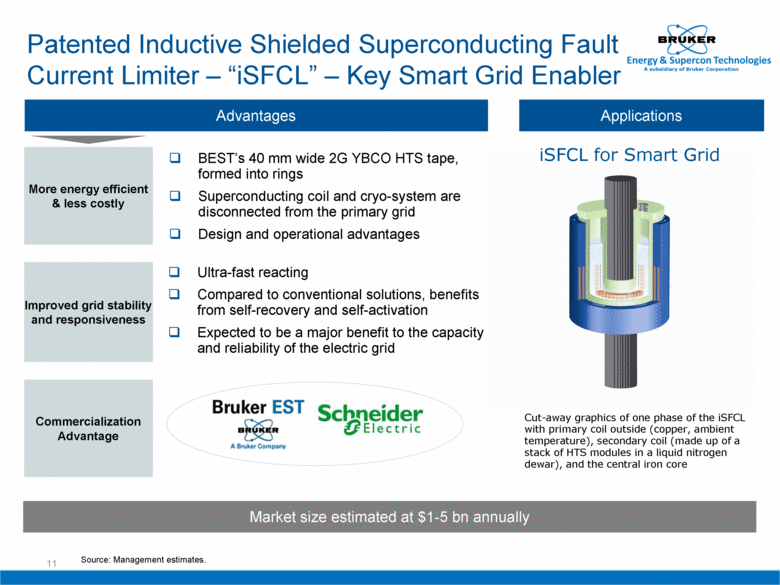
11 More energy efficient & less costly BEST’s 40 mm wide 2G YBCO HTS tape, formed into rings Superconducting coil and cryo-system are disconnected from the primary grid Design and operational advantages Ultra-fast reacting Compared to conventional solutions, benefits from self-recovery and self-activation Expected to be a major benefit to the capacity and reliability of the electric grid Advantages Improved grid stability and responsiveness Applications Source: Management estimates. Patented Inductive Shielded Superconducting Fault Current Limiter – “iSFCL” – Key Smart Grid Enabler Market size estimated at $1-5 bn annually Commercialization Advantage Cut-away graphics of one phase of the iSFCL with primary coil outside (copper, ambient temperature), secondary coil (made up of a stack of HTS modules in a liquid nitrogen dewar), and the central iron core iSFCL for Smart Grid |
|
|
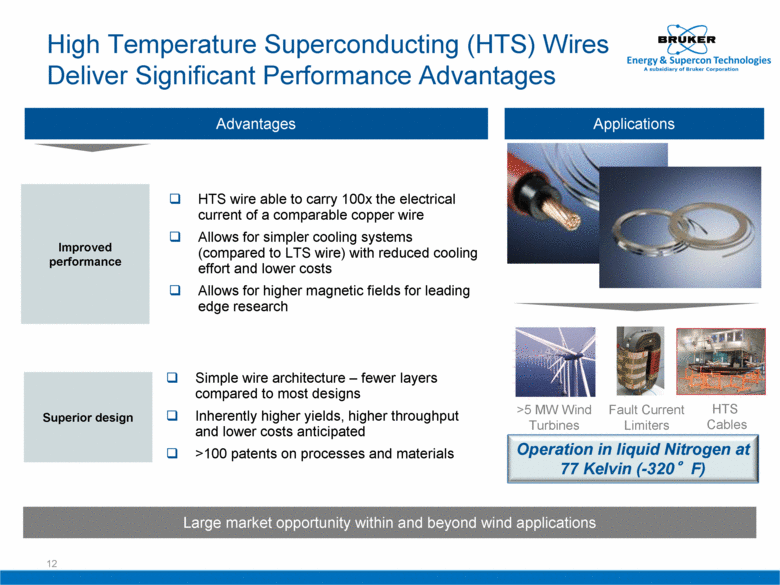
12 Improved performance HTS wire able to carry 100x the electrical current of a comparable copper wire Allows for simpler cooling systems (compared to LTS wire) with reduced cooling effort and lower costs Allows for higher magnetic fields for leading edge research Simple wire architecture – fewer layers compared to most designs Inherently higher yields, higher throughput and lower costs anticipated >100 patents on processes and materials Advantages Superior design Applications High Temperature Superconducting (HTS) Wires Deliver Significant Performance Advantages Operation in liquid Nitrogen at 77 Kelvin (-320°F) Large market opportunity within and beyond wind applications >5 MW Wind Turbines Fault Current Limiters HTS Cables |
|
|
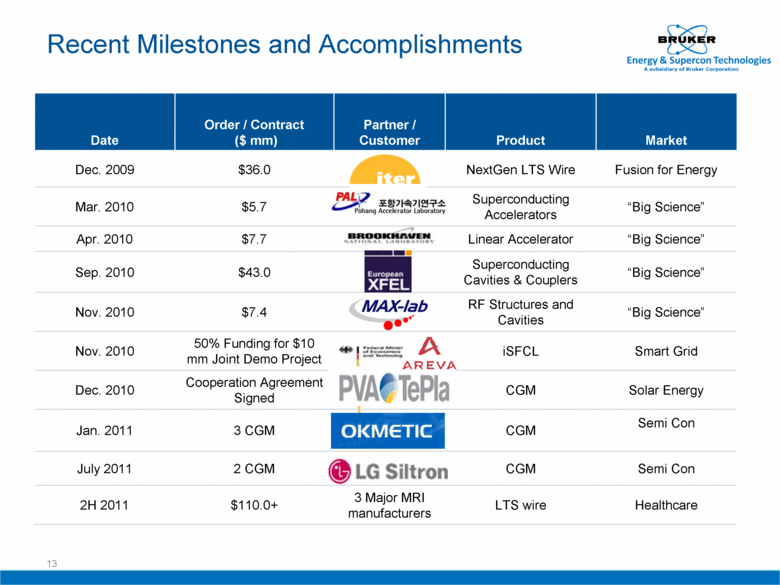
Recent Milestones and Accomplishments Date Order / Contract ($ mm) Partner / Customer Product Market Dec. 2009 $36.0 NextGen LTS Wire Fusion for Energy Mar. 2010 $5.7 Superconducting Accelerators “Big Science” Apr. 2010 $7.7 Linear Accelerator “Big Science” Sep. 2010 $43.0 Superconducting Cavities & Couplers “Big Science” Nov. 2010 $7.4 RF Structures and Cavities “Big Science” Nov. 2010 50% Funding for $10 mm Joint Demo Project iSFCL Smart Grid Dec. 2010 Cooperation Agreement Signed CGM Solar Energy Jan. 2011 3 CGM CGM Semi Con July 2011 2 CGM CGM Semi Con 2H 2011 $110.0+ 3 Major MRI manufacturers LTS wire Healthcare 13 |
|
|
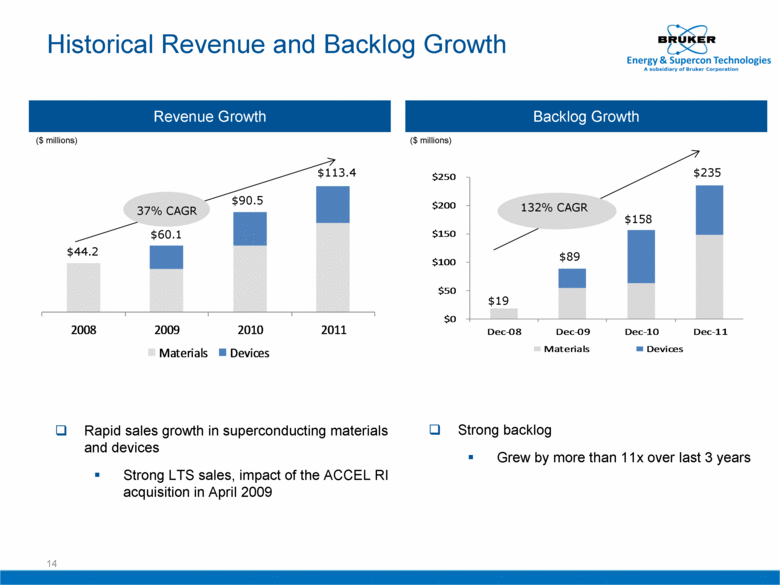
14 Historical Revenue and Backlog Growth Revenue Growth Backlog Growth ($ millions) ($ millions) Rapid sales growth in superconducting materials and devices Strong LTS sales, impact of the ACCEL RI acquisition in April 2009 Strong backlog Grew by more than 11x over last 3 years 132% CAGR $19 $89 $158 $235 37% CAGR $90.5 $113.4 $60.1 $44.2 $0 $50 $100 $150 $200 $250 Dec-08 Dec-09 Dec-10 Dec-11 Materials Devices 2008 2009 2010 2011 Materials Devices |
|
|
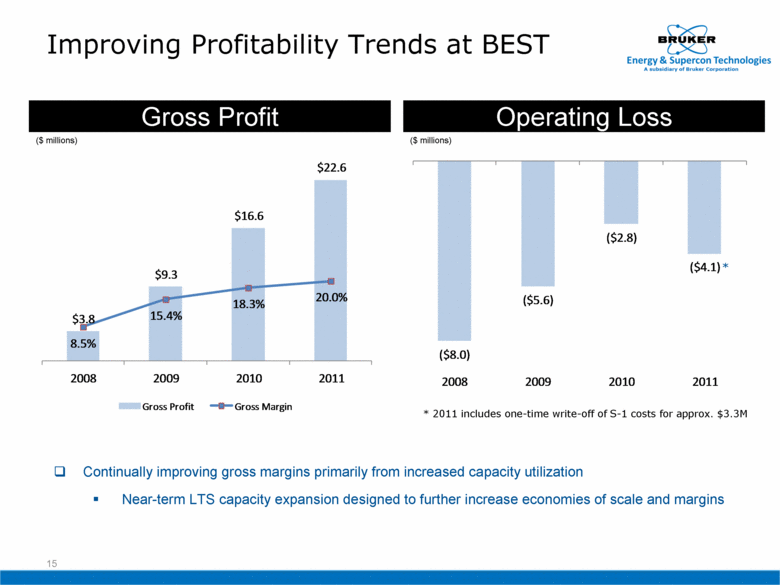
Improving Profitability Trends at BEST 15 Gross Profit Operating Loss Continually improving gross margins primarily from increased capacity utilization Near-term LTS capacity expansion designed to further increase economies of scale and margins * 2011 includes one-time write-off of S-1 costs for approx. $3.3M * ($ millions) ($ millions) $3.8 $9.3 $16.6 $22.6 8.5% 15.4% 18.3% 20.0% 2008 2009 2010 2011 Gross Profit Gross Margin ($8.0) ($5.6) ($2.8) ($4.1) 2008 2009 2010 2011 |
|
|
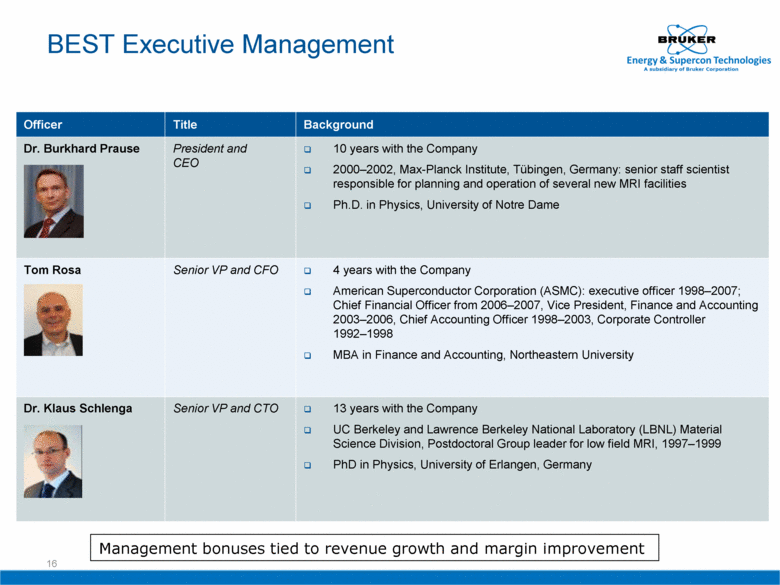
16 BEST Executive Management Officer Title Background Dr. Burkhard Prause President and CEO 10 years with the Company 2000–2002, Max-Planck Institute, Tübingen, Germany: senior staff scientist responsible for planning and operation of several new MRI facilities Ph.D. in Physics, University of Notre Dame Tom Rosa Senior VP and CFO 4 years with the Company American Superconductor Corporation (ASMC): executive officer 1998–2007; Chief Financial Officer from 2006–2007, Vice President, Finance and Accounting 2003–2006, Chief Accounting Officer 1998–2003, Corporate Controller 1992–1998 MBA in Finance and Accounting, Northeastern University Dr. Klaus Schlenga Senior VP and CTO 13 years with the Company UC Berkeley and Lawrence Berkeley National Laboratory (LBNL) Material Science Division, Postdoctoral Group leader for low field MRI, 1997–1999 PhD in Physics, University of Erlangen, Germany Management bonuses tied to revenue growth and margin improvement |
|
|
[LOGO] |

