Attached files
| file | filename |
|---|---|
| 8-K - 8K POWER POINT - VECTREN CORP | vvc8_k.htm |
| EX-99.2 - EXHIBIT 99.2 - VECTREN CORP | ex99_2.htm |
Exhibit 99.1
AGA Financial Forum
Investor Presentation
May 6-8, 2012

Forward-Looking Statements
All statements other than statements of historical fact are forward-looking statements made
in good faith by the company and are intended to qualify for the safe harbor from liability
established by the Private Securities Litigation Reform Act of 1995. Such statements are
based on management’s beliefs, as well as assumptions made by and information currently
available to management and include such words as “believe”, “anticipate”, ”endeavor”,
“estimate”, “expect”, “objective”, “projection”, “forecast”, “goal”, “likely”, and similar
expressions intended to identify forward-looking statements.
Vectren cautions readers that the assumptions forming the basis for forward-looking
statements include many factors that are beyond Vectren’s ability to control or estimate
precisely and actual results could differ materially from those contained in this document.
Forward-looking statements speak only as of the date on which our statement is made, and
we assume no duty to update them. More detailed information about these factors is set
forth in Vectren’s filings with the Securities and Exchange Commission, including Vectren’s
2011 annual report on Form 10-K filed on February 16, 2012.
Robert L. Goocher, Treasurer and VP - Investor Relations
rgoocher@vectren.com
812-491-4080
2

Management Representatives at AGA
Ø Carl Chapman - Chairman, President and CEO
Ø Jerry Benkert - Executive Vice President and CFO
Ø Robert Goocher - Treasurer & Vice President - Investor Relations
3
Ø NYSE Symbol: VVC
Ø 8-10% target annual total
shareholder return
shareholder return
• Annual dividends paid increased 52
consecutive years, effective Dec. 1,
2011, to annualized rate of $1.40 per
share
consecutive years, effective Dec. 1,
2011, to annualized rate of $1.40 per
share
Ø Over 1.1 million utility customers in
Indiana and Ohio
Indiana and Ohio
• Operate in constructive regulatory
environments with revenue
stabilization mechanisms
environments with revenue
stabilization mechanisms
Ø Well diversified nonutility portfolio
linked to core utility operations
linked to core utility operations
Ø ~$4.8 billion in assets
Ø ~$2.2 billion in revenues
Ø ~$2.4 billion market cap
Ø S&P: A-, Moody’s: A3
• Stable outlook for both
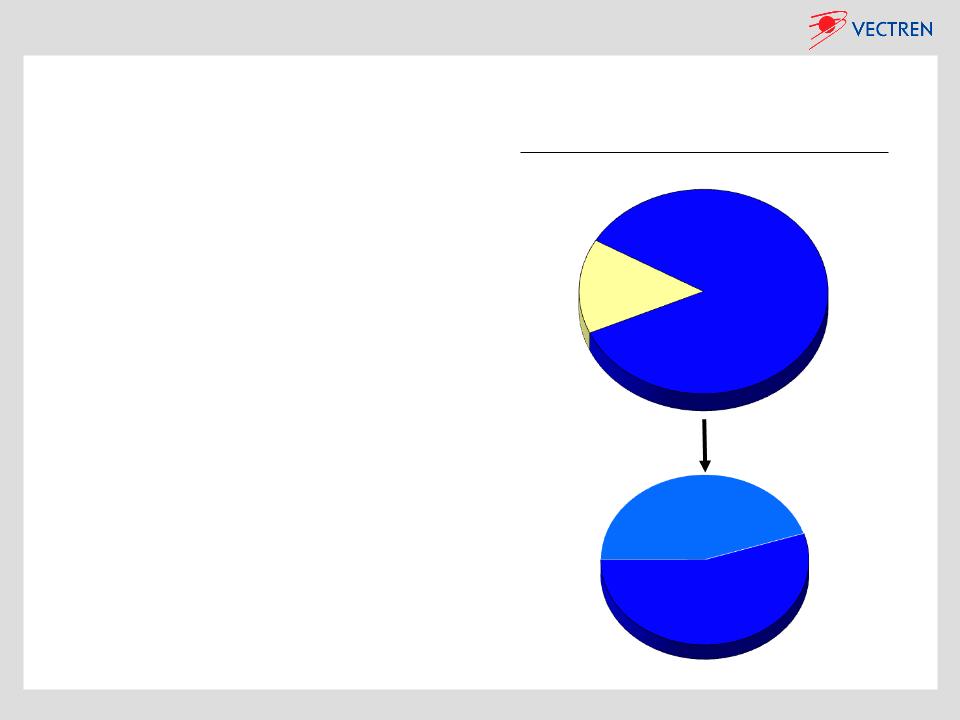
Vectren Corporation Overview
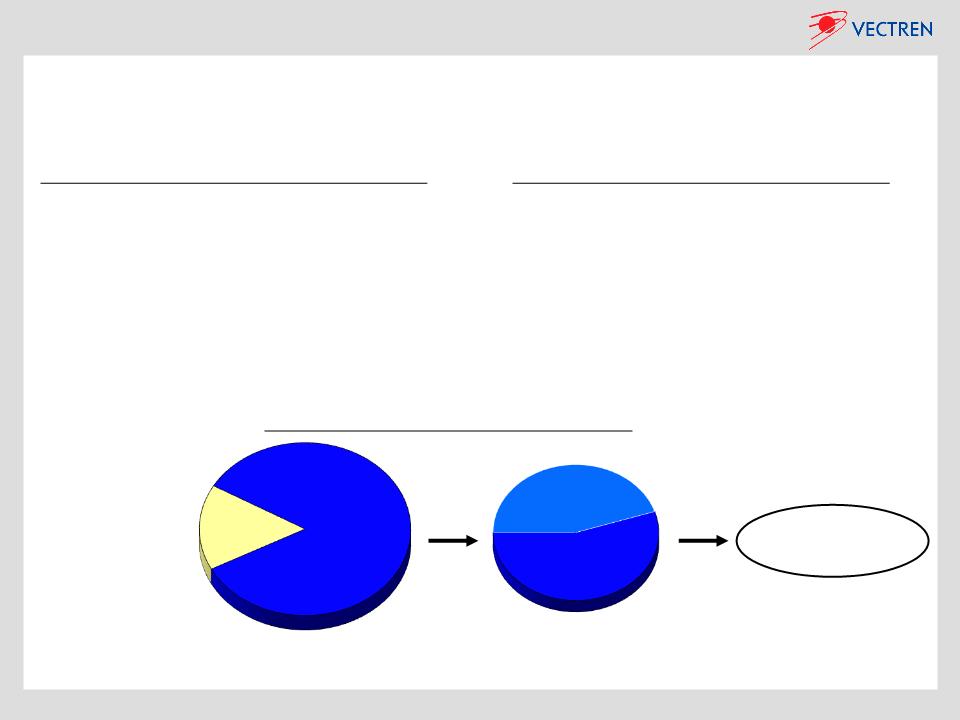
Vectren’s Core Earnings
4
Electric
~55%
Gas
~45%
Utility
~80-90%
Nonutility
~10-20%
5
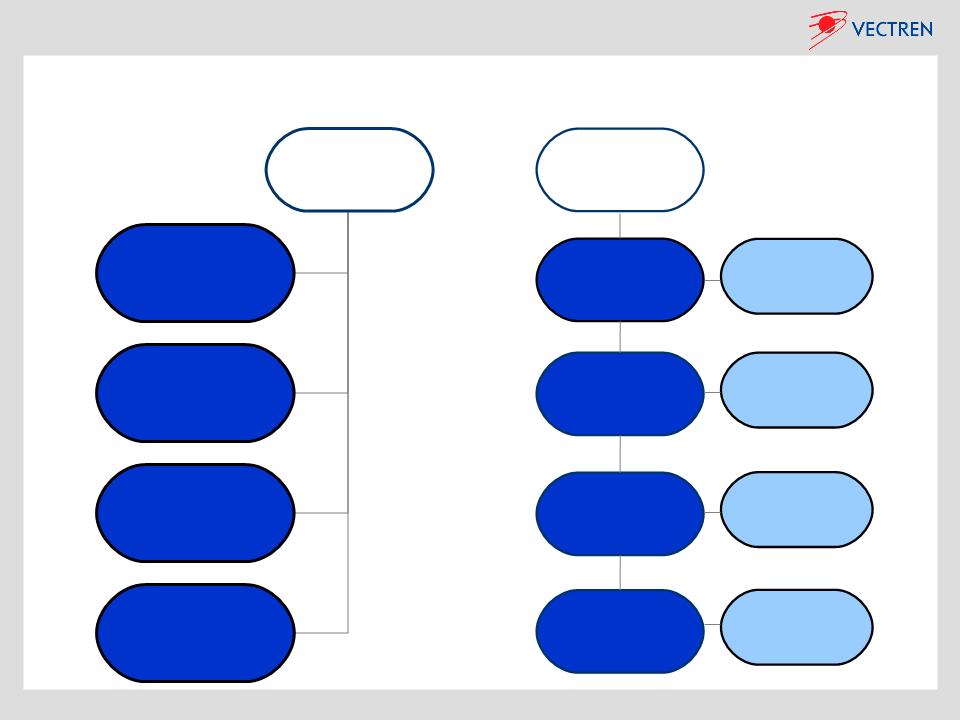
Vectren at a Glance
Vectren
Nonutility
Infrastructure
Services
Services
Energy Services
Coal Mining
Energy
Marketing
Marketing
Distribution &
Transmission Pipeline
Construction
Energy Saving
Performance Contracting
& Renewable Projects
Mines and Sells
Coal to Vectren
and 3rd Parties
Wholesale
Gas Marketing
Business
Vectren
Utility
Vectren North
Indiana Gas
570,000 Customers
Vectren South
SIGECO - Electric
142,000 Customers
Vectren South
SIGECO - Gas
110,000 Customers
Vectren Ohio
VEDO
313,000 Customers

6
Looking Ahead - Strategies for 2012 and Beyond
Utility
Ø Execute strategies to consistently achieve annual utility earnings growth target of 3%
• Earn allowed returns in gas and electric utilities
– Implement electric utility lost margin recovery mechanisms
– Earn current returns on infrastructure investments as provided for in IN & OH
legislation
legislation
– Aggressively manage costs through performance management & strategic sourcing
• Disciplined allocation of capital to operate at cash flow neutral
– Reinvest earnings to support necessary rate base growth
– Reduce incremental external financing requirements

7
Looking Ahead - Strategies for 2012 and Beyond - Cont.
Nonutility
Ø Continued growth and profitability of existing portfolio of nonutility businesses and
reduce the reliance on earnings growth from our commodity-sensitive businesses
reduce the reliance on earnings growth from our commodity-sensitive businesses
• Continue to invest in Infrastructure Services and Energy Services businesses to drive long
-term earnings growth
-term earnings growth
– Infrastructure Services - construction activity for the remainder of 2012 and beyond is
expected to be strong as utilities and pipeline operators continue to replace their aging
natural gas and oil infrastructure and as demand rises for construction of shale gas
and oil infrastructure
expected to be strong as utilities and pipeline operators continue to replace their aging
natural gas and oil infrastructure and as demand rises for construction of shale gas
and oil infrastructure
– Energy Services - long-term earnings growth opportunities expected given the national
focus on energy conservation, renewable energy and sustainability
focus on energy conservation, renewable energy and sustainability
• Investment in Coal Mining is nearly complete with third Indiana coal mine nearing startup
– As demand dictates, open Oaktown 2 coal mine and ramp up to full production
• Continue the focus on improving ProLiance’s profitability prospects through further
reductions in fixed cost structure and customer growth
reductions in fixed cost structure and customer growth

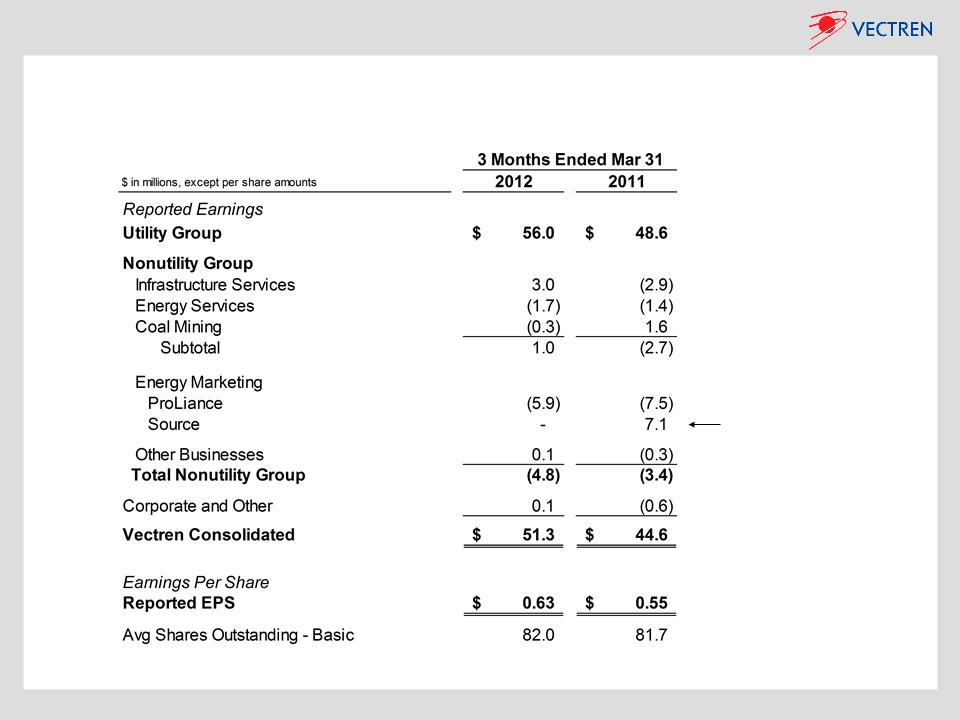
First Quarter 2012 Review
Ø Vectren consolidated 1st quarter 2012 earnings of $51.3 million, or $0.63 per share,
compared to $44.6 million, or $0.55 per share in 2011
compared to $44.6 million, or $0.55 per share in 2011
• Consolidated results improved over the prior year; 2012 EPS guidance
affirmed
affirmed
• Utility results increased by $7.4 million over 2011 with higher electric margins and
lower operating expenses and interest expense being the principal drivers, partially
offset by weather impacts (primarily on the electric business)
lower operating expenses and interest expense being the principal drivers, partially
offset by weather impacts (primarily on the electric business)
• Nonutility results also improved over 2011 by $5.7 million (excluding Source) reflecting
very strong results from Infrastructure Services and a lower level of loss at ProLiance,
partially offset by lower contributions from Coal Mining
very strong results from Infrastructure Services and a lower level of loss at ProLiance,
partially offset by lower contributions from Coal Mining
– Although seasonal Source earnings for the 1st quarter 2011 were $7.1 million, or $0.09 per
share, full year results from operations were $2.8 million, or $0.03 per share
share, full year results from operations were $2.8 million, or $0.03 per share
§ Source was sold December 31, 2011
8

2012 EPS Guidance Affirmed
Consolidated: $1.75 to $1.95 per share
Utility: $1.60 to $1.70 per share
Nonutility, excl. ProLiance: $0.30 to $0.40 per share
ProLiance: $(0.20) to $(0.10) per share
Ø Consolidated 2012 EPS guidance midpoint remains at $2.00, excluding ProLiance
Ø Updated 2012 earnings guidance (midpoints) for Nonutility businesses, excl. ProLiance
Ø Infrastructure Services - expected contribution of $20 million
Ø Energy Services - expected contribution of $3 million
Ø Coal Mining - expected contribution of $6 million
9
10
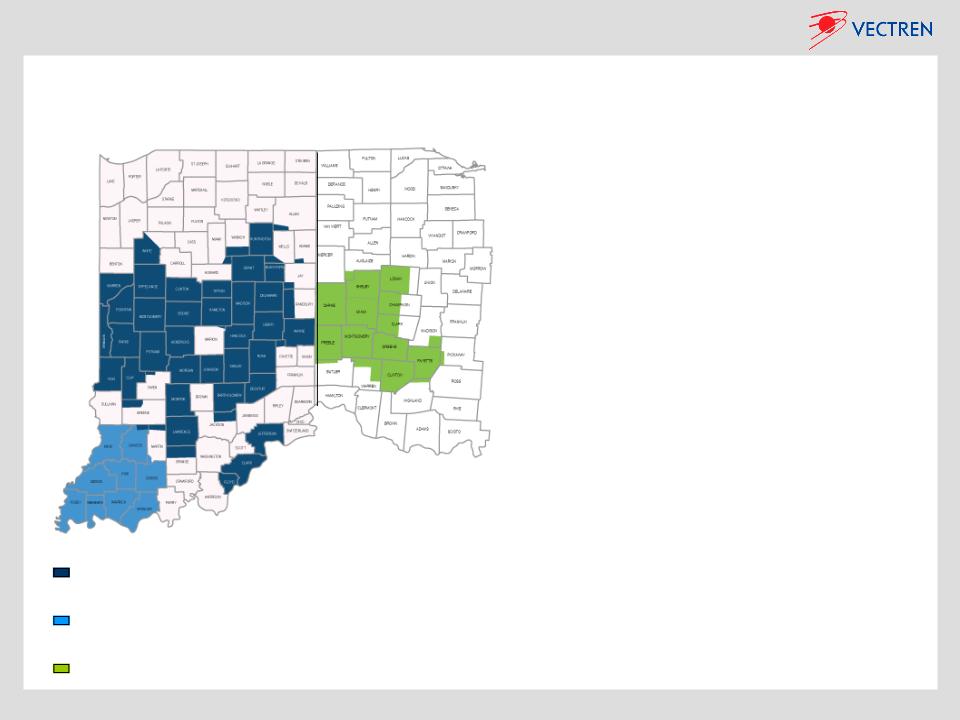
Vectren Energy Delivery of Indiana - North
Vectren Energy Delivery of Indiana - South
Vectren Energy Delivery of Ohio
Vectren’s Utility Group - Service Territories & Rate Base
OH
IN
Ø Gas Utilities’ Rate Base: ~$1.2 billion*
• ~$0.9 billion Indiana
• ~$0.3 billion Ohio
• ~10.2% Total Gas Allowed ROE
Ø Electric Utility Rate Base: ~$1.3 billion*
• All Indiana; excludes FERC
Transmission
Transmission
• 10.4% Allowed ROE
Ø FERC Electric Transmission Rate Base:
~$0.1 billion
~$0.1 billion
• 12.38% Allowed ROE
* From last rate cases
11
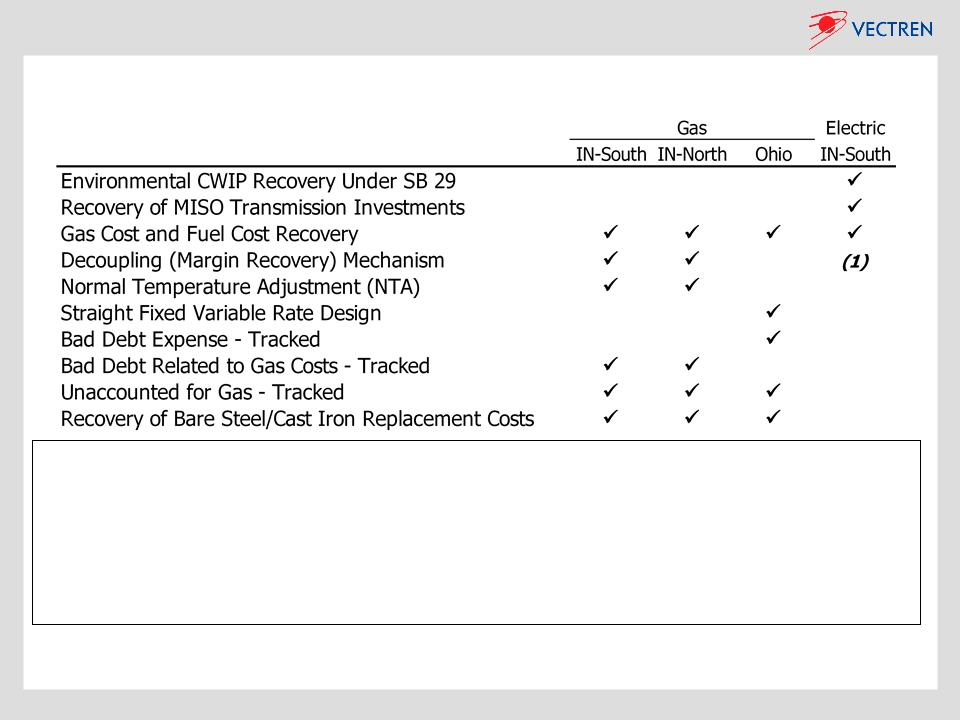
Constructive Utility Regulation & Legislation
(1) Settlement approved 9/1/2011, which provides for the ability to stabilize margins from the company's large commercial & industrial
customers associated with implementation of energy efficiency programs. The order also provides that margin reductions from residential
and commercial customers due to efficiency programs may be deferred for future recovery.
customers associated with implementation of energy efficiency programs. The order also provides that margin reductions from residential
and commercial customers due to efficiency programs may be deferred for future recovery.
Ø State legislation recently enacted in both Indiana and Ohio supporting additional investments
in infrastructure modernization programs that may be required as new federal safety or
environmental standards are enacted
in infrastructure modernization programs that may be required as new federal safety or
environmental standards are enacted
• Indiana Senate Bill 251, effective May 2011, allows for cost recovery outside a base rate
proceeding for federally mandated projects (applies to both gas and electric, capital and O&M)
proceeding for federally mandated projects (applies to both gas and electric, capital and O&M)
• Ohio House Bill 95, effective Sept. 2011, allows natural gas companies to recover costs related to
capital expenditure programs
capital expenditure programs

12
Generation Portfolio - Profile
Ø 5 Coal-fired base units - 1,000 MW
• 100% scrubbed for SO2
• 90% controlled for NOx
• Substantial removal of mercury and
particulate matter
particulate matter
Ø 6 Gas-fired peak-use turbines - 295 MW
Ø Purchased capacity - 100 MW thru 2012
Ø Renewable energy ~ 5%
• Landfill gas generation facility - 3MW
• Wind energy - up to 80 MW via ~20-
year purchased power contracts
year purchased power contracts
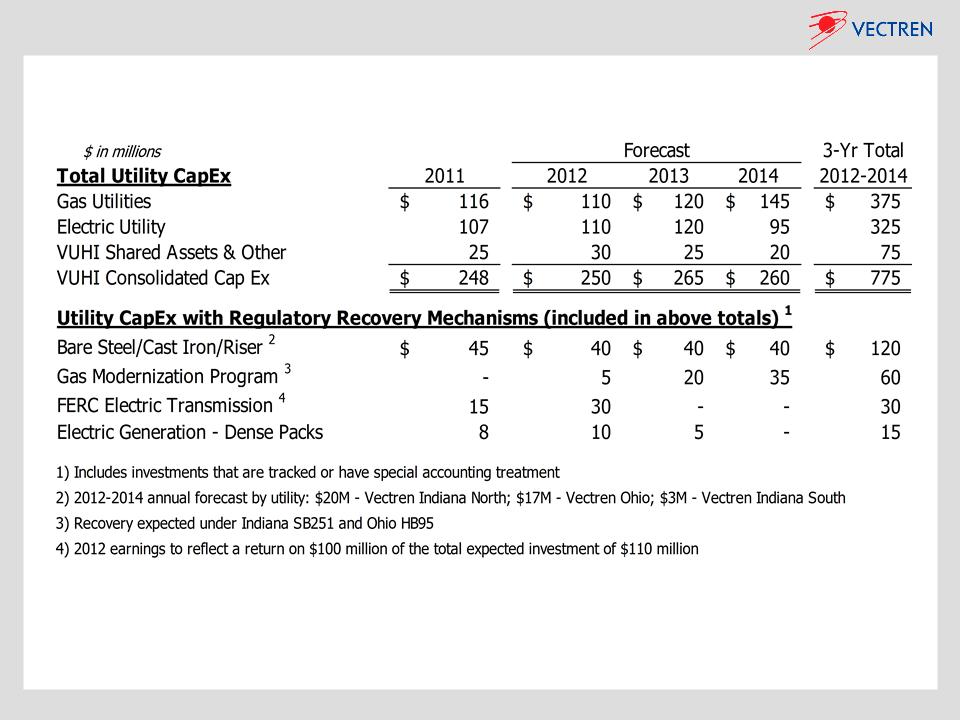
Utility Investments - Recent History & Near Future
Investments Made
Ø Over $410 million invested during last
decade in emissions control equipment
decade in emissions control equipment
• Was tracked via Indiana Senate Bill 29
(return on/of CWIP investment)
(return on/of CWIP investment)
Ø Well positioned to comply with new EPA
rules without significant additional
investment, & with no plant retirements
rules without significant additional
investment, & with no plant retirements
Ø Strongly meeting reserve requirements -
no new generation expected in near term
no new generation expected in near term
Ø Completion expected in 2012 on high
voltage transmission line; recovered timely
at 12.38% FERC-approved equity return
voltage transmission line; recovered timely
at 12.38% FERC-approved equity return
Ø Gas modernization legislation and/or
regulation will drive ramp-up in
infrastructure spending at Vectren’s
gas utilities for several years
regulation will drive ramp-up in
infrastructure spending at Vectren’s
gas utilities for several years
Ø Vectren’s gas utilities’ bare steel & cast
iron replacement program began in 2008
iron replacement program began in 2008
• ~$800 million program, ~20 years
Looking Ahead
13
Utility CapEx and Cash Flow
Ø Targeting free cash flow neutral in 2012-2014, similar to 2011
• Depreciation & amortization expense of $190 to $205 million per year expected through 2014
Ø No need for incremental external debt or equity financings expected in near term
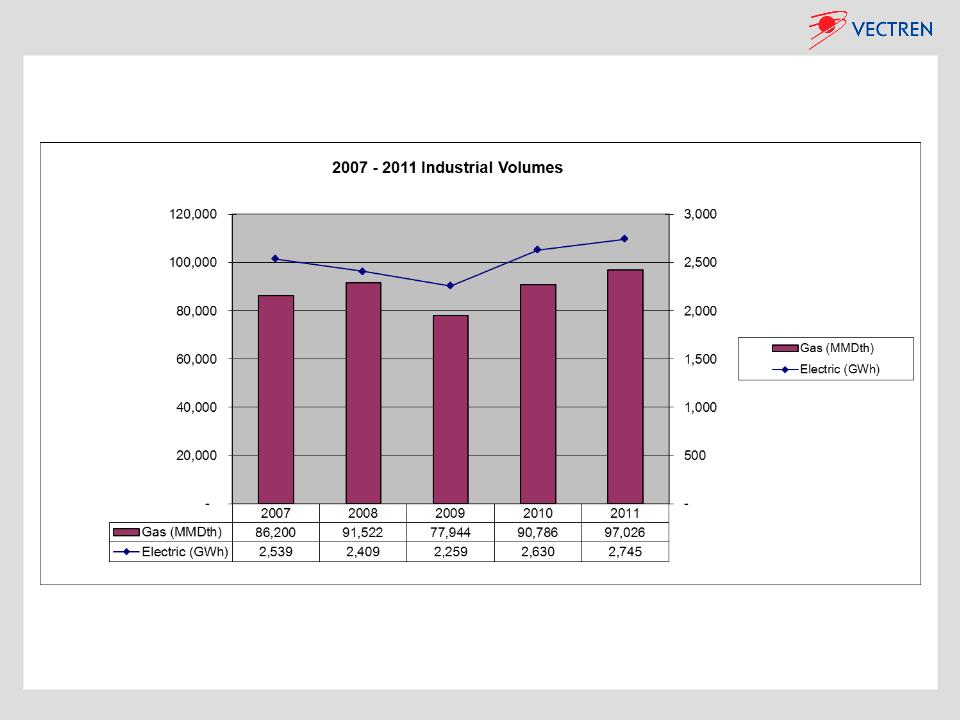
Utility Industrial Volumes
14
Ø Economic recovery in Indiana & Ohio evidenced by volumes at pre-recession levels by 2010
Ø With extremely mild 1st quarter weather in 2012 vs. 2011, gas volumes down 3%, but
electric volumes up 3%
electric volumes up 3%
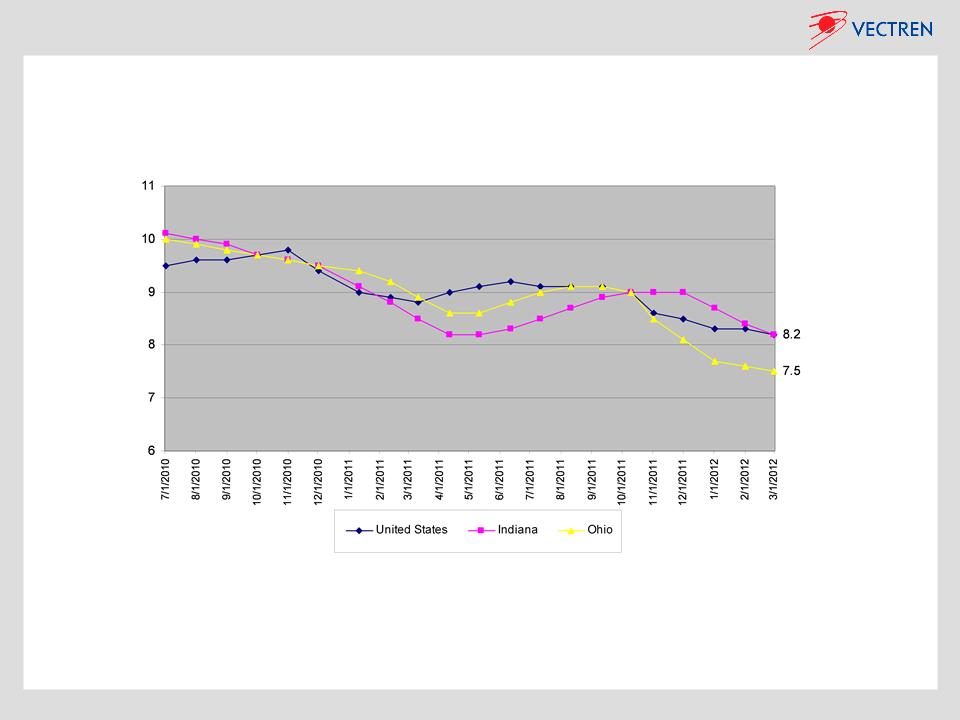
Seasonally Adjusted Unemployment Rates
U.S., Indiana and Ohio
U.S., Indiana and Ohio
Ø Indiana’s rate dropped 0.2% to 8.2% in March 2012, matching the U.S. rate
Ø March 2012 is the fourth consecutive month Indiana’s rate has declined
Ø Ohio’s rate dropped for the eight straight month, to 7.5% in March 2012
15
Source: www.in.gov
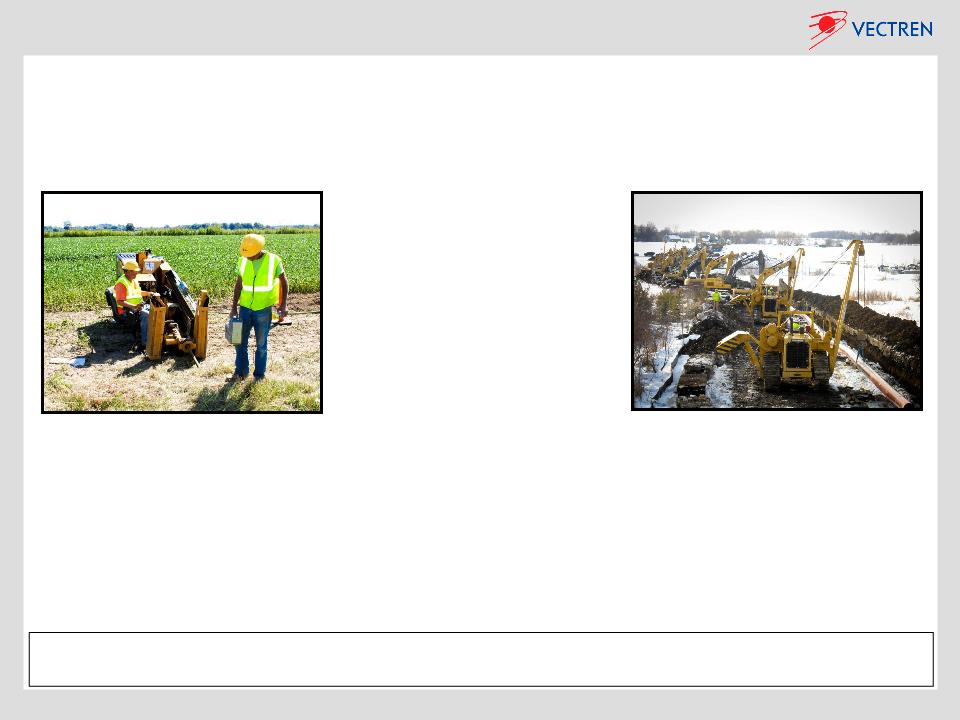
Infrastructure Services - Miller Pipeline & Minnesota Limited
Distribution Business
ØProvides underground pipeline construction and
repair services for natural gas, water and
wastewater companies
repair services for natural gas, water and
wastewater companies
ØMajor customers are regional utilities, such as
Vectren, NiSource, Duke, LG&E, Alagasco and
Citizens
Vectren, NiSource, Duke, LG&E, Alagasco and
Citizens
Transmission Business
ØProvides underground pipeline construction
and repair services for natural gas and
petroleum transmission companies
and repair services for natural gas and
petroleum transmission companies
ØMajor customers include Northern Natural,
Consumers Energy, Enbridge Energy and
Minnesota Pipe Line
Consumers Energy, Enbridge Energy and
Minnesota Pipe Line
16
Strategy: Drive business growth through sustainable, long-term customer relationships built
upon high quality construction and customer service, and strategic acquisitions
upon high quality construction and customer service, and strategic acquisitions
• 2011 net revenues of ~$370M
• Approximately 2,650 employees
at peak in 2011
at peak in 2011
• Operates in ~25 states,
primarily in the Upper Midwest,
Midwest, Mid-Atlantic and
Southern regions
primarily in the Upper Midwest,
Midwest, Mid-Atlantic and
Southern regions
• Earnings expected to grow to
~$20M in 2012 vs. ~$15M in
2011 and ~$3M in 2010
~$20M in 2012 vs. ~$15M in
2011 and ~$3M in 2010
Installation of gas service under a road using
horizontal directional drilling
horizontal directional drilling
Lowering of a section of 16-inch pipeline on a
35-mile project in Minnesota
35-mile project in Minnesota
Ø Strong demand for repair & replacement due to safety concerns with aging natural gas & oil pipelines
Ø Additional future opportunities driven by development of oil and natural gas in shale formations
17
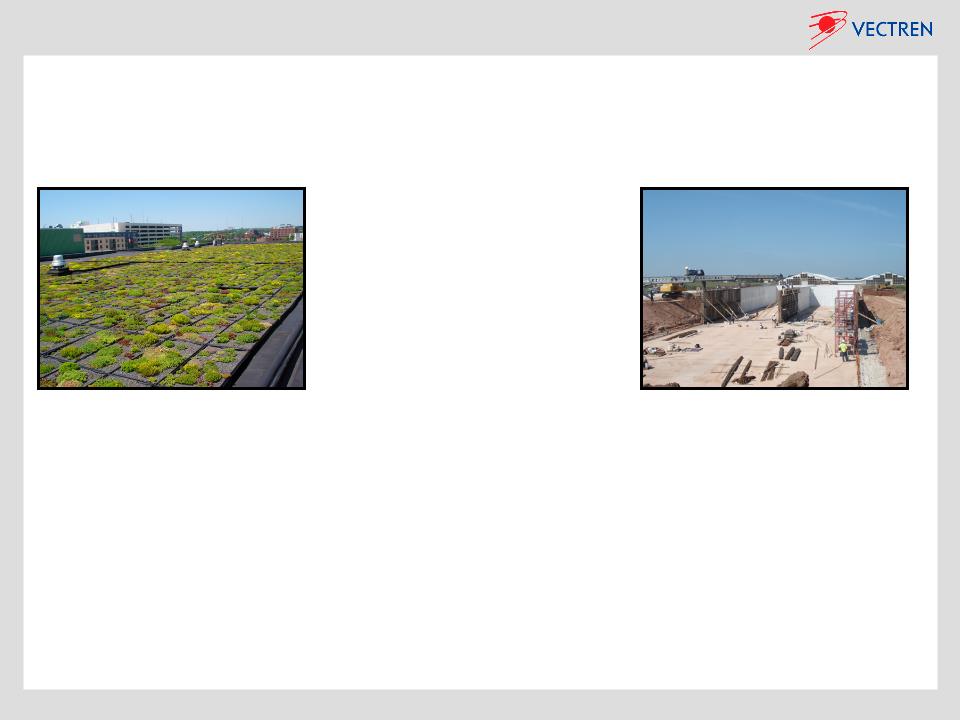
Energy Services - Energy Systems Group (ESG)
Performance Contracting
ØDesigns and constructs facility improvements that
pay for themselves from energy savings and
operational improvements
pay for themselves from energy savings and
operational improvements
• Assist customers with arranging financing (ESG
does not provide financing)
does not provide financing)
ØMajor customers include hospitals, universities,
governments and schools (HUGS)
governments and schools (HUGS)
ØTargeting projects that qualify for the Energy
Efficient Commercial Building federal income tax
deductions (Rev. Code 179D) - available thru 2013
Efficient Commercial Building federal income tax
deductions (Rev. Code 179D) - available thru 2013
Renewable Energy Services
ØDesigns, constructs, and often operates
renewable energy projects
renewable energy projects
• Near-term opportunities include:
– Landfill gas projects
– Anaerobic digester projects
• Tax credits available for certain
renewable energy projects
renewable energy projects
• 2011 revenues of ~$160 million
• Backlog of ~$75 million at 3/31/12
• ~250 employees at 3/31/12
• Licensed to do business in 37
states, primarily in the Midwest,
Mid-Atlantic and Southern regions
states, primarily in the Midwest,
Mid-Atlantic and Southern regions
Strategy: Continue to grow performance contracting and renewable energy business
segments through additional sales force and expanding geographic footprint
segments through additional sales force and expanding geographic footprint
Construction of anaerobic digester at
Wisconsin dairy farm
Wisconsin dairy farm
Campus sustainability and energy conservation
project at the University of Baltimore, MD
project at the University of Baltimore, MD
18
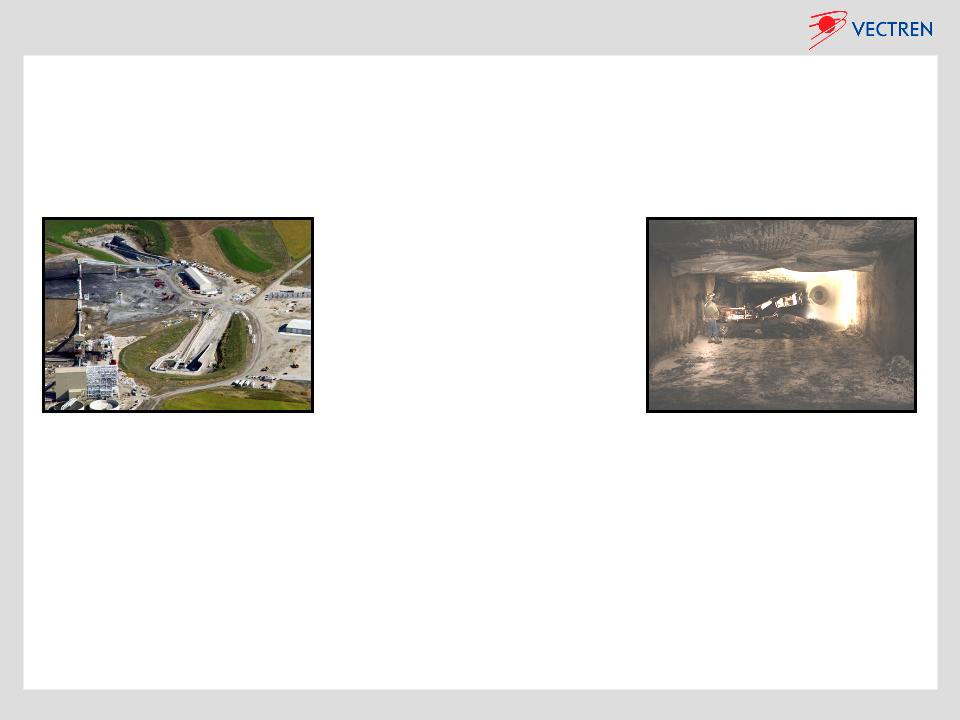
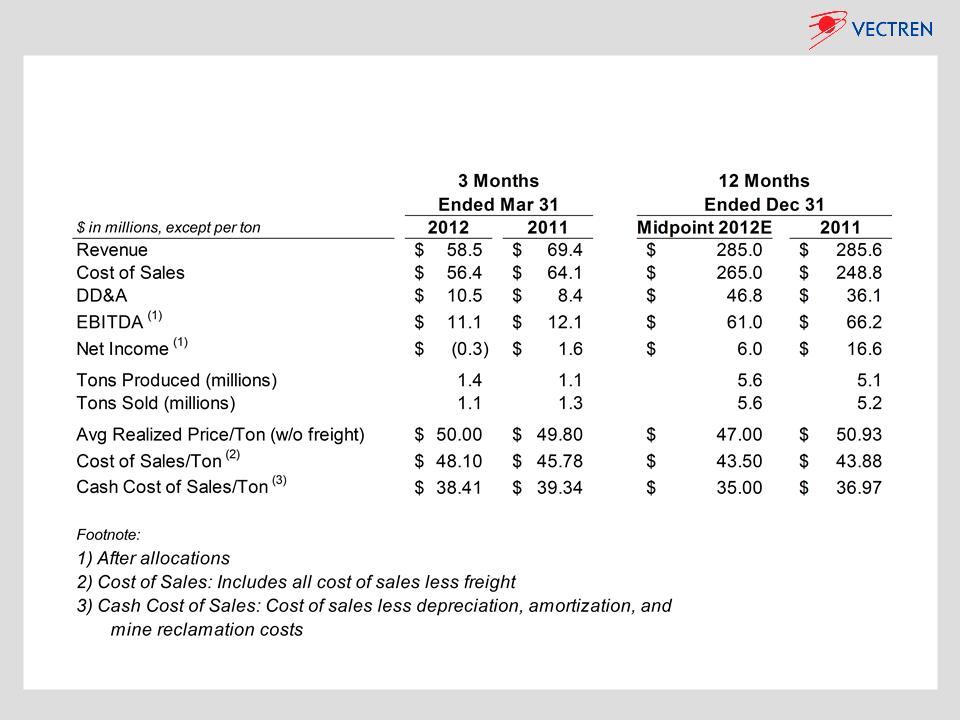
Coal Mining - Vectren Fuels
• 2011 revenues of ~$285 million
• 2011 sales of 5.2 million tons
• ~700 contract mining jobs as of
3/31/12
3/31/12
• ~800 contract mining jobs with
completion of Oaktown #2
completion of Oaktown #2
• 13 power plants within 50 mile
radius
radius
Strategy: Mine and sell Indiana (Illinois Basin) coal to Vectren’s electric utility and other
third parties. Long-term demand expected to increase as economy improves,
inventory levels fall, scrubbers are installed and Appalachian production declines
third parties. Long-term demand expected to increase as economy improves,
inventory levels fall, scrubbers are installed and Appalachian production declines
Continuous Miner at Prosperity Mine
Box Cuts at Oaktown Mines 1 & 2
Prosperity Mine
Ø30 million tons of reserves as of 3/31/12
Ø4.0 lbs SO2 - 11,300 BTU
ØMax annual production of ~2.5 million tons
Oaktown Mine #1
Ø62 million tons of reserves as of 3/31/12
ØApprox. 5.6 lbs. SO2 and 11,100 BTU
ØMax annual production of ~3 million tons
Oaktown Mine #2 (under construction)
Ø39 million tons of reserves as of 3/31/12
ØApprox. 4.8 lbs. SO2 and 11,300 BTU
ØMax annual production of ~2 million tons
ØTargeted opening 4th quarter 2012 (demand dependent)
19
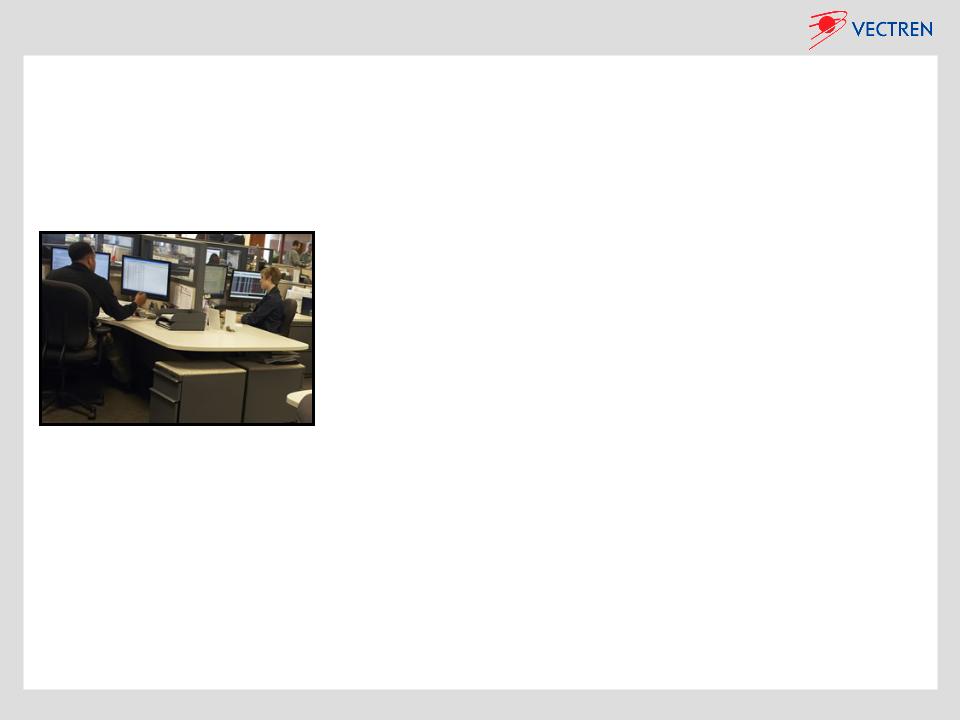
Energy Marketing - ProLiance
Profit Improvement Initiatives
ØFirm transportation and storage demand costs will
decline significantly in 2012 (~$73 million of fixed
demand costs in 2011, ~$55 million in 2012)
decline significantly in 2012 (~$73 million of fixed
demand costs in 2011, ~$55 million in 2012)
ØContracts representing another ~$18 million of
annualized fixed demand costs expire by 2015
annualized fixed demand costs expire by 2015
ØContinued focus on G&A cost control and margin
growth via adding commercial & industrial customers
growth via adding commercial & industrial customers
ProLiance Investment - Recap
Ø Founded in 1996 with initial investment of
$1 million ($500K from each owner)
$1 million ($500K from each owner)
Ø From inception thru 2010, ProLiance has
delivered ~$500 million of pre-tax earnings,
over $200 million of savings for owners’
customers, and nearly $50 million of
dividends to Vectren (plus div’s for taxes)
delivered ~$500 million of pre-tax earnings,
over $200 million of savings for owners’
customers, and nearly $50 million of
dividends to Vectren (plus div’s for taxes)
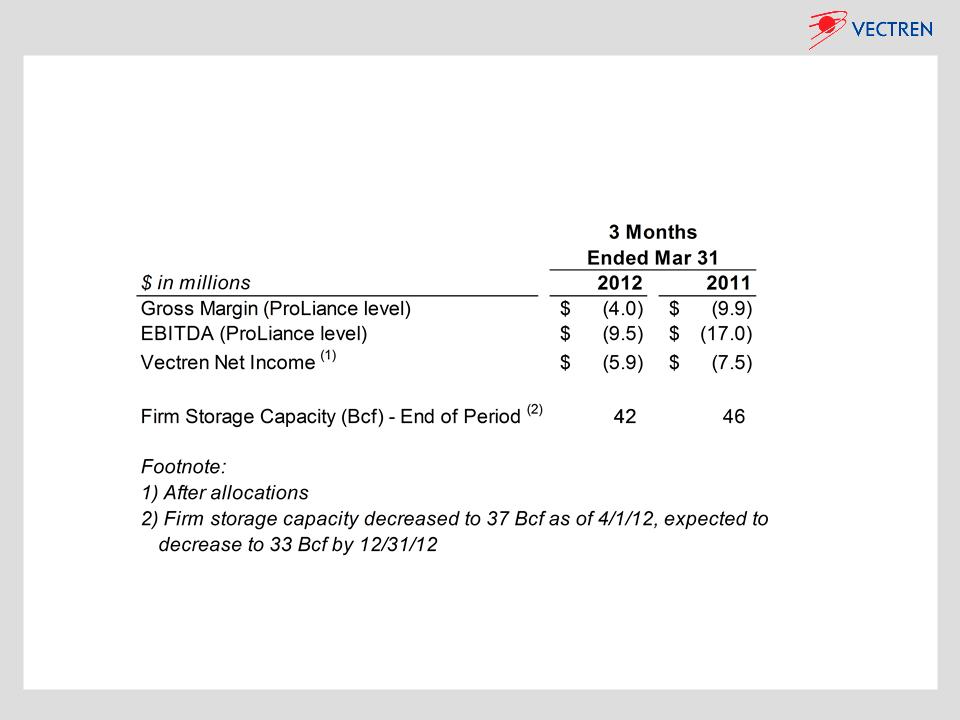
• 2011 revenues of ~$1.4 billion
• At 4/1/12, 37 Bcf of natural gas
storage
storage
• Balanced book approach - VaR
capped at $2.5 million
capped at $2.5 million
• Operates throughout the Midwest
& Southeast
& Southeast
Strategy: Execute profit improvement initiatives currently underway, including efforts to
lower pipeline and storage demand costs through ongoing renegotiations
lower pipeline and storage demand costs through ongoing renegotiations
Gas marketing operations where ProLiance
buys, sells and optimizes gas supplies
• Retail services to ~1,800
commercial and industrial
customers
commercial and industrial
customers
• Wholesale services to utilities,
municipals, power generators
municipals, power generators
Investment: Wholesale gas marketer owned Vectren (61%; equity acctg.) & Citizens Energy Group (39%)
20
Vectren: Strength, Stability, Utility
Utility
~80-90%
Nonutility
~10-20%
Utility: Vectren’s Core Earnings
Electric
~55%
Gas
~45%
Strength
Stability
Ø Earnings & industry reputation both
anchored by solid utility franchises
anchored by solid utility franchises
Ø A-/A3 rated by S&P & Moody’s
Ø Strong utility & nonutility competencies
in infrastructure development are a
vital key to earnings growth
in infrastructure development are a
vital key to earnings growth
Ø Constructive regulatory environments
Ø Improving earnings stability through
mix of nonutility businesses
mix of nonutility businesses
Ø Disciplined spending for consistent
earnings growth and to support an
attractive dividend
earnings growth and to support an
attractive dividend
1.1 million customers,
Indiana and Ohio
Ø A management team that values the importance of financially strong, stable utility
operations in delivering competitive shareholder returns targeted at 8-10% annually
operations in delivering competitive shareholder returns targeted at 8-10% annually

21
Appendix
22
Consolidated First Quarter 2012 Results
Full year 2011 results from
operations were $2.8 million.
Source sold 12/31/11
operations were $2.8 million.
Source sold 12/31/11
Appendix
23
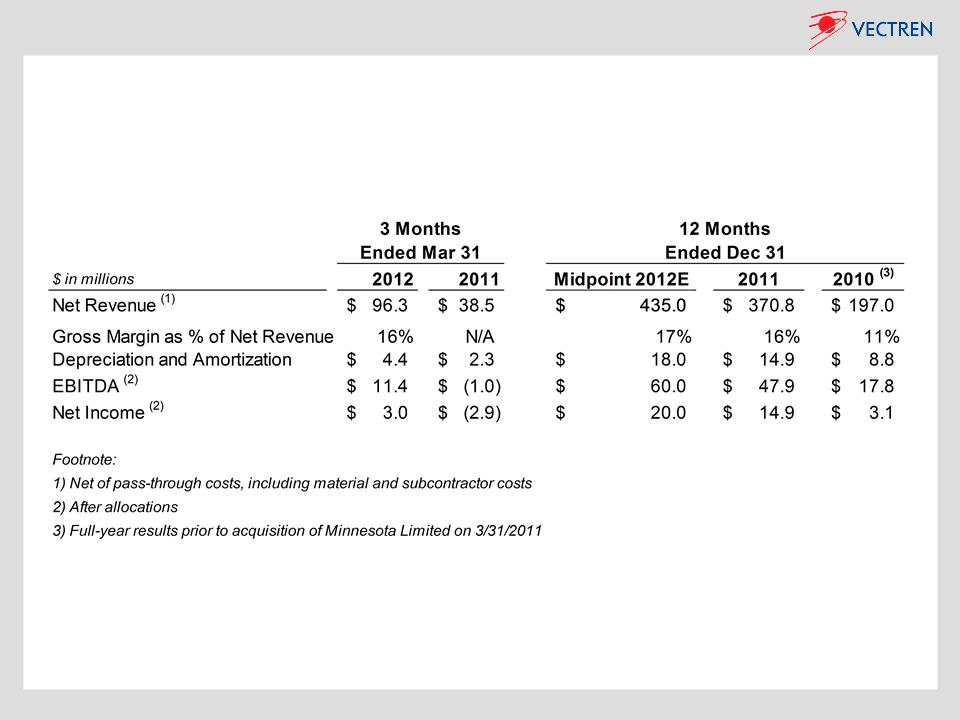
Nonutility Metrics - Infrastructure Services
Appendix
2011 metrics do not include 1st quarter results from Minnesota Limited which was acquired on 3/31/2011
24
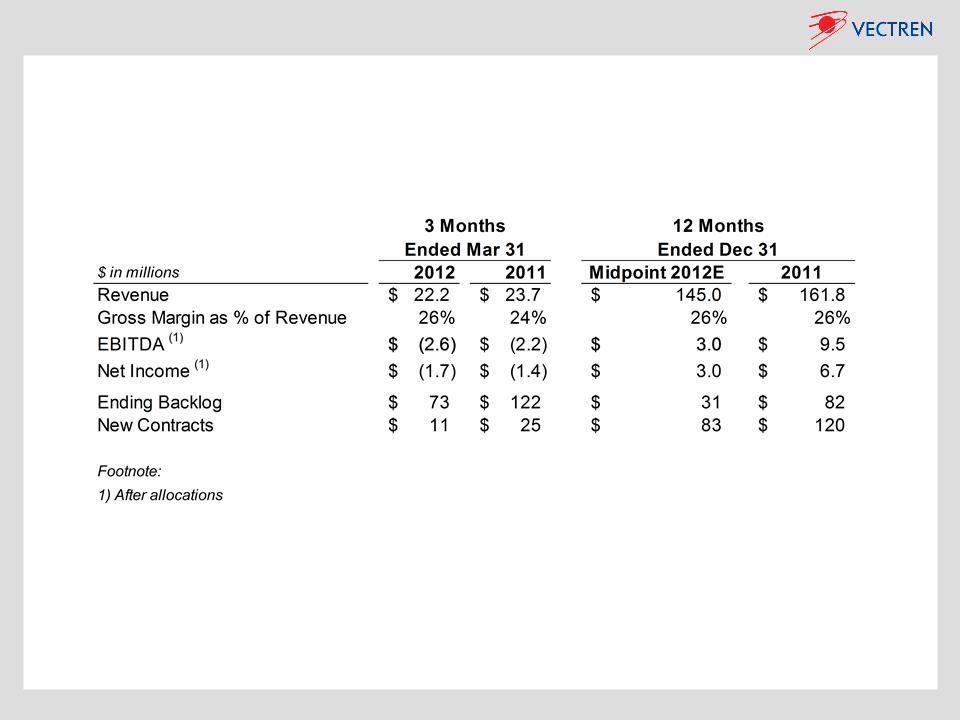
Nonutility Metrics - Energy Services
Appendix
25
Nonutility Metrics - Coal Mining
Appendix
26
Nonutility Metrics - Energy Marketing/ProLiance
Appendix

27
Use of Non-GAAP Performance Measures and Per Share Measures
Per share earnings contributions of the Utility Group, Nonutility Group, and Corporate and Other
are presented herein and are non-GAAP measures. Such per share amounts are based on the
earnings contribution of each group included in Vectren’s consolidated results divided by
Vectren’s basic average shares outstanding during the period. The earnings per share of the
groups do not represent a direct legal interest in the assets and liabilities allocated to the
groups, but rather represent a direct equity interest in Vectren Corporation's assets and
liabilities as a whole. These non-GAAP measures are used by management to evaluate the
performance of individual businesses. In addition, other items giving rise to period over period
variances, such as weather, are presented on an after tax and per share basis. These amounts
are calculated at a statutory tax rate divided by Vectren’s basic average shares outstanding
during the period. Accordingly, management believes these measures are useful to investors in
understanding each business’ contribution to consolidated earnings per share and in analyzing
consolidated period to period changes and the potential for earnings per share contributions in
future periods. Reconciliations of the non-GAAP measures to their most closely related GAAP
measure of consolidated earnings per share are included throughout the presentation
presented. The non-GAAP financial measures disclosed by the Company should not be
considered a substitute for, or superior to, financial measures calculated in accordance with
GAAP, and the financial results calculated in accordance with GAAP.
Appendix