Attached files
| file | filename |
|---|---|
| 8-K - SWN FORM 8-K Q1 2012 EARNINGS RELEASE - SOUTHWESTERN ENERGY CO | swn050312form8k.htm |

NEWS RELEASE
SOUTHWESTERN ENERGY ANNOUNCES FIRST QUARTER 2012
FINANCIAL AND OPERATING RESULTS
Houston, May 3, 2012...Southwestern Energy Company (NYSE: SWN) today announced its financial and operating results for the first quarter of 2012. Highlights include:
·
Gas and oil production of 133.4 Bcfe, up 16% compared to year-ago levels
·
Net income and net cash provided by operating activities before changes in operating assets and liabilities (a non-GAAP measure reconciled below) declined compared to year-ago levels due to lower realized gas prices
·
Encouraging Brown Dense results
For the first quarter of 2012, Southwestern reported net income of $107.7 million, or $0.31 per diluted share, compared to net income of $136.6 million, or $0.39 per diluted share, for the prior year period. Net cash provided by operating activities before changes in operating assets and liabilities (a non-GAAP measure; see reconciliation below) was $370.8 million for the first quarter of 2012, compared to $391.5 million for the same period in 2011.
“While our production continues to grow, our earnings and cash flow decreased due to the recent drop in gas prices,” stated Steve Mueller, President and Chief Executive Officer of Southwestern Energy. “Looking ahead, we continue to respond to current prices and remain vigilant in reducing costs, keeping our balance sheet in good shape and drilling the best projects. Our Fayetteville and Marcellus drilling programs continue to provide economic drilling at today’s prices. Our all-in cash operating costs of $1.31 per Mcfe for the first quarter of 2012 are some of the lowest in the industry and we are confident those can remain low for the foreseeable future. Our balance sheet was strengthened during the quarter and in our New Ventures activities we are growing both in acreage and in learning, particularly in the Brown Dense play where we are seeing better results as we learn more about how to unlock oil from this resource.”
- MORE -
First Quarter 2012 Financial Results
E&P Segment – Operating income from the company’s E&P segment was $116.2 million for the three months ended March 31, 2012, compared to $178.3 million for the same period in 2011. The decrease was primarily due to lower realized natural gas prices and increased operating costs and expenses due to increased activity, partially offset by higher production.
Gas and oil production totaled 133.4 Bcfe in the first quarter of 2012, up 16% from 115.0 Bcfe in the first quarter of 2011, and included 115.8 Bcf from the company’s Fayetteville Shale play, up from 101.1 Bcf in the first quarter of 2011. Production from the Marcellus Shale was 9.3 Bcf in the first quarter of 2012, compared to 2.8 Bcf in the first quarter of 2011. The company expects that its full-year production for 2012 should range between approximately 560 and 570 Bcfe, an increase of approximately 13% compared to 2011.
Including the effect of hedges, Southwestern’s average realized gas price in the first quarter of 2012 was $3.49 per Mcf, down 15% from $4.12 per Mcf in the first quarter of 2011. The company’s commodity hedging activities increased its average gas price by $1.25 per Mcf during the first quarter of 2012, compared to an increase of $0.44 per Mcf during the same period in 2011. At March 31, 2012, Southwestern had NYMEX price hedges in place on notional volumes of approximately 200 Bcf of its remaining 2012 forecasted gas production hedged at an average floor price of $5.16 per Mcf and approximately 185 Bcf of its 2013 forecasted gas production hedged at an average floor price of $5.06 per Mcf.
The company typically sells its natural gas at a discount to NYMEX settlement prices. This discount includes a basis differential, third-party transportation charges and fuel charges. Disregarding the impact of commodity price hedges, the company’s average price received for its gas production during the first quarter of 2012 was approximately $0.50 per Mcf lower than average NYMEX settlement prices, compared to approximately $0.43 per Mcf lower during the first quarter of 2011.
As of April 30, 2012, the company had protected approximately 73 Bcf of its second quarter 2012 expected gas production from the potential of widening basis differentials through hedging activities and sales arrangements at an average basis differential to NYMEX gas prices of approximately ($0.03) per Mcf. In 2012, the company expects its total gas sales discount to NYMEX to be $0.50 to $0.55 per Mcf.
Lease operating expenses per unit of production for the company’s E&P segment were $0.83 per Mcfe in the first quarter of 2012, compared to $0.86 per Mcfe in the first quarter of 2011. The decrease was primarily due to decreased compression costs.
General and administrative expenses per unit of production were $0.30 per Mcfe in the first quarter of 2012, compared to $0.26 per Mcfe in the first quarter of 2011. The increase in general and administrative expenses was primarily a result of increased costs associated with the expansion of the company’s E&P operations due to the continued development of the Fayetteville Shale play and Marcellus Shale play.
- MORE -
Taxes other than income taxes per unit of production were $0.13 per Mcfe in the first quarter of 2012, compared to $0.12 per Mcfe in the first quarter of 2011. In February 2012, the Commonwealth of Pennsylvania passed the Unconventional Gas Well Impact Fee Act which imposes an annual impact fee for a period of up to fifteen years on each natural gas well drilled. The impact fee adjusts annually based on the age of the well, the average NYMEX natural gas price for the year and an inflation index. As a result of this legislation, Southwestern recorded a one-time expense in the first quarter of 2012 of $3.2 million, or approximately $0.024 per Mcfe, based on the required retroactive application of this legislation to all wells drilled in 2011 and previous years. Taxes other than income taxes vary due to changes in severance and ad valorem taxes that result from the mix of the company’s volumes and fluctuations in commodity prices.
The company’s full cost pool amortization rate was $1.33 per Mcfe in the first quarter of 2012, compared to $1.31 per Mcfe in the first quarter of 2011. The amortization rate is impacted by the timing and amount of reserve additions and the costs associated with those additions, revisions of previous reserve estimates due to both price and well performance, write-downs that result from full cost ceiling tests, proceeds from the sale of properties that reduce the full cost pool and the levels of costs subject to amortization.
Midstream Services – Operating income for the company’s Midstream Services segment, which is comprised of natural gas gathering and marketing activities, was $69.3 million for the three months ended March 31, 2012, up from $53.9 million in the same period in 2011. The increase in operating income was primarily due to increased gathering revenues related to the company’s Fayetteville and Marcellus Shale properties, partially offset by increased operating costs and expenses. At March 31, 2012, the company’s midstream segment was gathering approximately 2.2 Bcf per day through 1,801 miles of gathering lines in the Fayetteville Shale play, compared to gathering approximately 1.9 Bcf per day a year ago. Gathering volumes, revenues and expenses for this segment are expected to grow over the next few years largely as a result of development of the company’s acreage in the Fayetteville Shale and Marcellus Shale and the activity undertaken by other operators in those areas.
Capital Structure and Investments – At March 31, 2012, the company had approximately $1.7 billion in long-term debt and its long-term debt-to-total capitalization was 28.7%, compared to 25.3% at December 31, 2011, exclusive of cash and cash equivalents of $206.2 million and $15.6 million, respectively. In March 2012, the company privately placed $1 billion of 4.10% Senior Notes due 2022. A portion of the net proceeds of the offering was used to repay the amounts outstanding under the company’s revolving credit facility.
During the first quarter of 2012, Southwestern invested approximately $573 million, compared to approximately $531 million in capital investments during the first quarter of 2011, and included approximately $533 million invested in its E&P business, $26 million invested in its Midstream Services segment and $14 million invested for corporate and other purposes. The company expects its capital investments program for 2012 to be approximately $2.1 billion, a decrease of approximately 5% compared to 2011. Southwestern is currently planning to shift approximately $50 million of additional capital
- MORE -
investments into New Ventures in 2012, in particular into the company’s Brown Dense play.
E&P Operations Review
Southwestern invested approximately $533 million in its E&P business during the first quarter of 2012, including $362 million invested in its Fayetteville Shale play, $105 million in the Marcellus Shale, $4 million in Ark-La-Tex and $55 million in New Ventures.
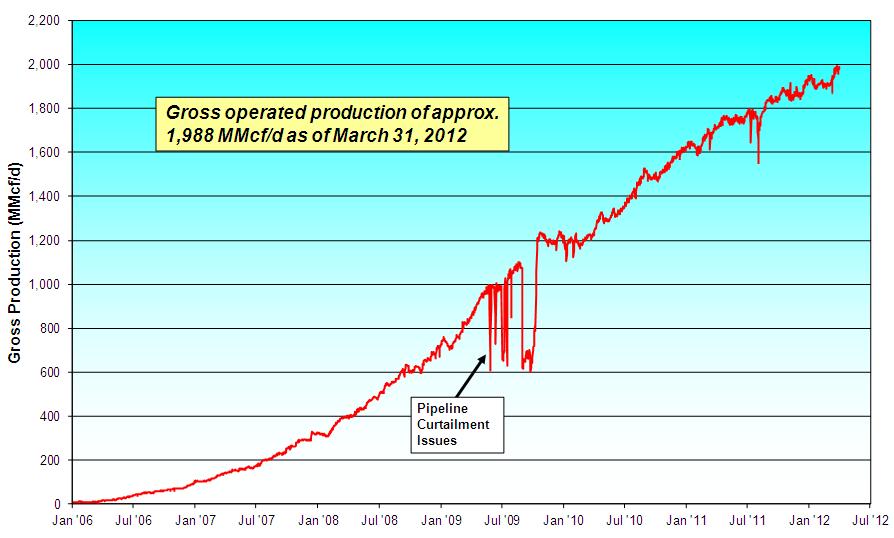
Fayetteville Shale Play – For the first three months of 2012, Southwestern placed a total of 146 operated wells on production in the Fayetteville Shale play, all of which were horizontal wells fracture stimulated using slickwater. At March 31, 2012, the company’s gross production rate from the Fayetteville Shale play was approximately 1,988 MMcf per day, up from approximately 1,725 MMcf per day a year ago. Subsequently, the company surpassed the milestone of 2.0 Bcf per day of gross operated production from the play on April 12 and, on May 2, celebrated the milestone of cumulative gross operated production of 2.0 Tcf of natural gas from the play since 2004. The company is currently utilizing 13 drilling rigs in its Fayetteville Shale play, including 8 that are capable of drilling horizontal wells. The graph below provides gross production data from the company’s operated wells in the Fayetteville Shale play area through March 31, 2012.
During the first quarter of 2012, the company’s horizontal wells had an average completed well cost of $2.8 million per well, average horizontal lateral length of 4,743 feet and average time to drill to total depth of 7.3 days from re-entry to re-entry. This compares to an average completed well cost of $2.8 million per well, average horizontal lateral length of 4,703 feet and average time to drill to total depth of 7.3 days from re-entry to re-entry in the fourth quarter of 2011. In the first quarter of 2012, the company
- MORE -
had 26 operated wells placed on production which had average times to drill to total depth of 5 days or less from re-entry to re-entry. In total, the company has had a total of 130 wells drilled to total depth of 5 days or less from re-entry to re-entry.
In April, the company created SWN Well Services, L.L.C., a wholly-owned subsidiary which began ordering fracture stimulation equipment for two spreads that will be operated in the Fayetteville Shale area. The company estimates that the first of the two frac spreads will be operational in the fourth quarter of 2012, after which incremental cost savings should begin to accrue.
The company’s wells placed on production during the first quarter of 2012 averaged initial production rates of 3,319 Mcf per day. Results from the company’s drilling activities from 2007 by quarter are shown below.
|
Time Frame |
Wells Placed on Production |
Average IP Rate (Mcf/d) |
30th-Day Avg Rate (# of wells) |
60th-Day Avg Rate (# of wells) |
Average Lateral Length |
|
1st Qtr 2007 |
58 |
1,261 |
1,066 (58) |
958 (58) |
2,104 |
|
2nd Qtr 2007 |
46 |
1,497 |
1,254 (46) |
1,034 (46) |
2,512 |
|
3rd Qtr 2007 |
74 |
1,769 |
1,510 (72) |
1,334 (72) |
2,622 |
|
4th Qtr 2007 |
77 |
2,027 |
1,690 (77) |
1,481 (77) |
3,193 |
|
1st Qtr 2008 |
75 |
2,343 |
2,147 (75) |
1,943 (74) |
3,301 |
|
2nd Qtr 2008 |
83 |
2,541 |
2,155 (83) |
1,886 (83) |
3,562 |
|
3rd Qtr 2008 |
97 |
2,882 |
2,560 (97) |
2,349 (97) |
3,736 |
|
4th Qtr 2008(1) |
74 |
3,350(1) |
2,722 (74) |
2,386 (74) |
3,850 |
|
1st Qtr 2009(1) |
120 |
2,992(1) |
2,537 (120) |
2,293 (120) |
3,874 |
|
2nd Qtr 2009 |
111 |
3,611 |
2,833 (111) |
2,556 (111) |
4,123 |
|
3rd Qtr 2009 |
93 |
3,604 |
2,624 (93) |
2,255 (93) |
4,100 |
|
4th Qtr 2009 |
122 |
3,727 |
2,674 (122) |
2,360 (120) |
4,303 |
|
1st Qtr 2010(2) |
106 |
3,197(2) |
2,388 (106) |
2,123 (106) |
4,348 |
|
2nd Qtr 2010 |
143 |
3,449 |
2,554 (143) |
2,321 (142) |
4,532 |
|
3rd Qtr 2010 |
145 |
3,281 |
2,448 (145) |
2,202 (144) |
4,503 |
|
4th Qtr 2010 |
159 |
3,472 |
2,678 (159) |
2,294 (159) |
4,667 |
|
1st Qtr 2011 |
137 |
3,231 |
2,604 (137) |
2,238(137) |
4,985 |
|
2nd Qtr 2011 |
149 |
3,014 |
2,328 (149) |
1,991 (149) |
4,839 |
|
3rd Qtr 2011 |
132 |
3,443 |
2,666 (132) |
2,372 (132) |
4,847 |
|
4th Qtr 2011 |
142 |
3,646 |
2,606 (142) |
2,243 (142) |
4,703 |
|
1st Qtr 2012 |
146 |
3,319 |
2,459 (120) |
2,058 (58) |
4,743 |
Note: Results as of March 31, 2012.
(1)
The significant increase in the average initial production rate for the fourth quarter of 2008 and the subsequent decrease for the first quarter of 2009 primarily reflected the impact of the delay in the Boardwalk Pipeline.
(2)
In the first quarter of 2010, the company’s results were impacted by the shift of all wells to “green completions” and the mix of wells, as a large percentage of wells were placed on production in the shallower northern and far eastern borders of the company’s acreage.
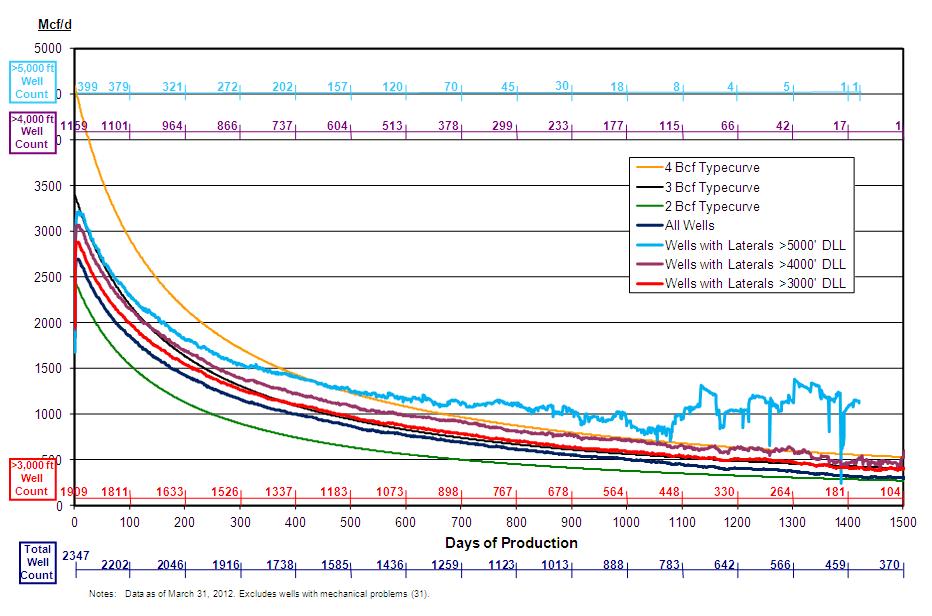
The graph below provides normalized average daily production data through March 31, 2012, for the company’s horizontal wells using slickwater and crosslinked gel fluids. The “dark blue curve” is for horizontal wells fracture stimulated with either slickwater or crosslinked gel fluid. The “red curve” indicates results for the company’s wells with lateral lengths greater than 3,000 feet, while the “purple curve” indicates results for the company’s wells with lateral lengths greater than 4,000 feet and the “light blue curve” indicates results for the company’s wells with lateral lengths greater than 5,000 feet. The normalized production curves are intended to provide a qualitative indication of the company’s Fayetteville Shale wells’ performance and should not be used to estimate an
- MORE -
individual well’s estimated ultimate recovery. The 2, 3 and 4 Bcf typecurves are shown solely for reference purposes and are not intended to be projections of the performance of the company’s wells.
Marcellus Shale – To date, Southwestern has participated in a total of 94 operated horizontal wells in northeast Pennsylvania, of which 24 were producing at March 31, 2012. Net production from the area was 9.3 Bcf in the first quarter of 2012, compared to 2.8 Bcf in the first quarter of 2011. At March 31, 2012, the company’s gross operated production from the area was approximately 122 MMcf per day and was limited by high line pressures.
The company’s marketing subsidiary also increased its firm transportation capacity in the Marcellus Shale area during the first quarter by entering into a precedent agreement with Constitution Pipeline Co. LLC for a proposed 121-mile pipeline connecting to the Iroquois Gas Transmission and Tennessee Gas Pipeline systems in Schoharie County, New York. Subject to the receipt of regulatory approvals and satisfaction of other conditions, the subsidiary agreed to enter a fifteen year firm transportation agreement with a total capacity of 150 MMcf per day. The project is expected to be in-service by the second quarter of 2015.
The graph below provides normalized average daily production data through March 31, 2012, for the company’s horizontal wells in the Marcellus Shale. The “purple curve” indicates results for 10 wells with more than 12 fracture stimulation stages, the “orange curve” indicates results for 13 wells with 9 to 12 fracture stimulation stages and the “green curve” indicates results for 1 well with less than 9 fracture stimulation stages. The normalized production curves are intended to provide a qualitative indication of the
- MORE -
company’s Marcellus Shale wells’ performance and should not be used to estimate an individual well’s estimated ultimate recovery. The 4, 6, 8 and 10 Bcf typecurves are shown solely for reference purposes and are not intended to be projections of the performance of the company’s wells.

Ark-La-Tex – Total net production from the company’s East Texas and conventional Arkoma Basin properties was 8.2 Bcfe in the first quarter of 2012, compared to 11.2 Bcfe in the first quarter of 2011.
On May 1, 2012, Southwestern sold its oil and natural gas leases, wells and gathering equipment in its Overton Field in East Texas for approximately $175 million, excluding typical purchase price adjustments. The sale includes approximately 19,800 net acres in Smith County, Texas. Net production from the field was approximately 23 MMcfe per day and proved net reserves were approximately 138 Bcfe as of year-end 2011.
New Ventures – As of March 31, 2012, Southwestern held 3,645,518 net undeveloped acres in connection with its New Ventures prospects, of which 2,518,518 net acres were located in New Brunswick, Canada.
Southwestern has approximately 540,000 net acres targeting the Lower Smackover Brown Dense formation in southern Arkansas and northern Louisiana. In February 2012, Southwestern completed its first well in the area, the Roberson 18-19 #1-15H located in Columbia County, Arkansas, at a total depth of approximately 9,369 feet and a horizontal lateral length of approximately 3,600 feet. After initially producing the well in February, this well was shut-in for pressure-buildup testing in March. The company
- MORE -
continues to perform testing on the well and is currently re-completing one stage in the heel of the well. The company’s second well, the Garrett 7-23-5H #1 located in Claiborne Parish, Louisiana, was drilled to a vertical depth in February 2012 of approximately 10,863 feet with a 6,536-foot horizontal lateral and was completed with 19 fracture stimulation stages. After 48 days of flowing up casing, this well’s highest 24-hour producing rate to date was 301 barrels of 52 degree API oil per day, 1,700 Mcf per day and 2,200 barrels of water per day (55% of load recovered to date). The company is currently running tubing in the well and believes that the rate could continue to increase until approximately 65% of the fluid load is recovered, which is estimated at the end of May. The company’s third well, the BML #31-22 #1-1H located in Union Parish, Louisiana, is currently drilling to a planned horizontal lateral length of approximately 4,000 feet, after sidetracking the first lateral in March due to stuck pipe. This well is scheduled to be completed in May with 30 fracture stimulation stages. The company plans to allocate more capital to the Brown Dense play in 2012 for the acquisition of additional leasehold and potentially adding another rig in the area in the third quarter. If the company’s drilling program continues to yield positive results, it expects that activity in the play could increase significantly over the next several years.
The company has also leased approximately 264,000 net acres in the Denver-Julesburg Basin in eastern Colorado where the company has begun testing a new unconventional oil play targeting middle and late Pennsylvanian to Permian age carbonates and shales. In April, the company spud its first well, the Ewertz Farms 1-58 #1-26, located in Adams County, Colorado, with a planned total vertical depth of 9,500 feet with a 2,000-foot lateral targeting the Marmaton formation. This well reached a total depth of 9,543 feet and is currently logging. The rig will next move to drill the Staner 5-58 #1-8 well located in Arapahoe County. This well is planned to be drilled 9,000 feet vertically and is expected to spud in May. If the company’s drilling program yields positive results, it expects that activity in the area could increase significantly over the next several years.
Explanation and Reconciliation of Non-GAAP Financial Measures
The company reports its financial results in accordance with accounting principles generally accepted in the United States of America (“GAAP”). However, management believes certain non-GAAP performance measures may provide users of this financial information additional meaningful comparisons between current results and the results of its peers and of prior periods.
One such non-GAAP financial measure is net cash provided by operating activities before changes in operating assets and liabilities. Management presents this measure because (i) it is accepted as an indicator of an oil and gas exploration and production company’s ability to internally fund exploration and development activities and to service or incur additional debt, (ii) changes in operating assets and liabilities relate to the timing of cash receipts and disbursements which the company may not control and (iii) changes in operating assets and liabilities may not relate to the period in which the operating activities occurred.
See the reconciliations below of GAAP financial measures to non-GAAP financial measures for the three months ended March 31, 2012 and March 31, 2011. Non-GAAP
- MORE -
financial measures should not be considered in isolation or as a substitute for the company's reported results prepared in accordance with GAAP.
|
|
3 Months Ended Mar. 31, | ||
|
|
2012 |
|
2011 |
|
|
(in thousands) | ||
|
Cash flow from operating activities: |
|
|
|
|
Net cash provided by operating activities |
$ 444,663 |
|
$ 396,479 |
|
Add back (deduct): |
|
|
|
|
Change in operating assets and liabilities |
(73,843) |
|
(4,947) |
|
Net cash provided by operating activities before changes in operating assets and liabilities |
$ 370,820 |
|
$ 391,532 |
Southwestern will host a teleconference call on Friday, May 4, 2012, at 10:00 a.m. Eastern to discuss the company’s first quarter 2012 results. The toll-free number to call is 877-407-8035 and the international toll-free number is 201-689-8035. The teleconference can also be heard “live” on the Internet at http://www.swn.com.
Southwestern Energy Company is an integrated company whose wholly-owned subsidiaries are engaged in oil and gas exploration and production, natural gas gathering and marketing. Additional information on the company can be found on the Internet at http://www.swn.com.
Contacts:
Greg D. Kerley
Brad D. Sylvester, CFA
Executive Vice President
Vice President, Investor Relations
and Chief Financial Officer
(281) 618-4897
(281) 618-4803
All statements, other than historical facts and financial information, may be deemed to be forward-looking statements within the meaning of Section 27A of the Securities Act of 1933, as amended, and Section 21E of the Securities Exchange Act of 1934, as amended. All statements that address activities, outcomes and other matters that should or may occur in the future, including, without limitation, statements regarding the financial position, business strategy, production and reserve growth and other plans and objectives for the company’s future operations, are forward-looking statements. Although the company believes the expectations expressed in such forward-looking statements are based on reasonable assumptions, such statements are not guarantees of future performance and actual results or developments may differ materially from those in the forward-looking statements. The company has no obligation and makes no undertaking to publicly update or revise any forward-looking statements, other than to the extent set forth below. You should not place undue reliance on forward-looking statements. They are subject to known and unknown risks, uncertainties and other factors that may affect the company’s operations, markets, products, services and prices and cause its actual results, performance or achievements to be materially different from any future results, performance or achievements expressed or implied by the forward-looking statements. In addition to any assumptions and other factors referred to specifically in connection with forward-looking statements, risks, uncertainties and factors that could cause the company’s actual results to differ
- MORE -
materially from those indicated in any forward-looking statement include, but are not limited to: the timing and extent of changes in market conditions and prices for natural gas and oil (including regional basis differentials); the company’s ability to transport its production to the most favorable markets or at all; the timing and extent of the company’s success in discovering, developing, producing and estimating reserves; the economic viability of, and the company’s success in drilling, the company’s large acreage position in the Fayetteville Shale play, overall as well as relative to other productive shale gas areas; the company’s ability to fund the company’s planned capital investments; the impact of federal, state and local government regulation, including any legislation relating to hydraulic fracturing, the climate or over the counter derivatives; the company’s ability to determine the most effective and economic fracture stimulation for the Fayetteville Shale play and the Marcellus Shale play; the costs and availability of oil field personnel services and drilling supplies, raw materials, and equipment and services; the company’s future property acquisition or divestiture activities; increased competition; the financial impact of accounting regulations and critical accounting policies; the comparative cost of alternative fuels; conditions in capital markets, changes in interest rates and the ability of the company’s lenders to provide it with funds as agreed; credit risk relating to the risk of loss as a result of non-performance by the company’s counterparties and any other factors listed in the reports the company has filed and may file with the Securities and Exchange Commission (SEC). For additional information with respect to certain of these and other factors, see the reports filed by the company with the SEC. The company disclaims any intention or obligation to update or revise any forward-looking statements, whether as a result of new information, future events or otherwise.
Financial Summary Follows
# # #

|
OPERATING STATISTICS (Unaudited) |
|
|
|
|
Page 1 of 5 | ||
|
Southwestern Energy Company and Subsidiaries |
|
|
|
|
|
|
|
|
|
|
|
|
|
|
|
|
|
|
|
|
Three Months | ||||
|
Periods Ended March 31 |
|
|
|
|
2012 |
|
2011 |
|
|
|
|
|
|
|
|
|
|
Exploration & Production |
|
|
|
|
|
|
|
|
Production |
|
|
|
|
|
|
|
|
Gas production (Bcf) |
|
|
|
|
133.3 |
|
114.9 |
|
Oil production (MBbls) |
|
|
|
|
24 |
|
30 |
|
Total equivalent production (Bcfe) |
|
|
|
|
133.4 |
|
115.0 |
|
Commodity Prices |
|
|
|
|
|
|
|
|
Average gas price per Mcf, including hedges |
|
|
|
|
$ 3.49 |
|
$ 4.12 |
|
Average gas price per Mcf, excluding hedges |
|
|
|
|
$ 2.24 |
|
$ 3.68 |
|
Average oil price per Bbl |
|
|
|
|
$ 104.39 |
|
$ 92.11 |
|
Operating Expenses per Mcfe |
|
|
|
|
|
|
|
|
Lease operating expenses |
|
|
|
|
$ 0.83 |
|
$ 0.86 |
|
General & administrative expenses |
|
|
|
|
$ 0.30 |
|
$ 0.26 |
|
Taxes, other than income taxes |
|
|
|
|
$ 0.13 |
|
$ 0.12 |
|
Full cost pool amortization |
|
|
|
|
$ 1.33 |
|
$ 1.31 |
|
|
|
|
|
|
|
|
|
|
|
|
|
|
|
|
|
|
|
Midstream |
|
|
|
|
|
|
|
|
Gas volumes marketed (Bcf) |
|
|
|
|
159.5 |
|
143.0 |
|
Gas volumes gathered (Bcf) |
|
|
|
|
202.0 |
|
171.5 |
|
|
|
|
|
|
|
|
|
|
STATEMENTS OF OPERATIONS (Unaudited) |
|
|
|
|
|
|
Page 2 of 5 |
|
Southwestern Energy Company and Subsidiaries |
|
|
|
|
|
|
|
|
|
|
|
Three Months | ||||
|
Periods Ended March 31, |
|
|
|
|
2012 |
|
2011 |
|
|
|
|
|
|
(in thousands, except share/per share amounts) | ||
|
Operating Revenues |
|
|
|
|
|
|
|
|
Gas sales |
|
|
|
|
$ 463,768 |
|
$ 467,929 |
|
Gas marketing |
|
|
|
|
148,051 |
|
171,098 |
|
Oil sales |
|
|
|
|
2,528 |
|
2,727 |
|
Gas gathering |
|
|
|
|
42,122 |
|
34,581 |
|
|
|
|
|
|
656,469 |
|
676,335 |
|
Operating Costs and Expenses |
|
|
|
|
|
|
|
|
Gas purchases – midstream services |
|
|
|
|
146,676 |
|
170,230 |
|
Operating expenses |
|
|
|
|
60,958 |
|
56,798 |
|
General and administrative expenses |
|
|
|
|
48,826 |
|
37,117 |
|
Depreciation, depletion and amortization |
|
|
|
|
193,627 |
|
163,447 |
|
Taxes, other than income taxes |
|
|
|
|
20,422 |
|
16,092 |
|
|
|
|
|
|
470,509 |
|
443,684 |
|
Operating Income |
|
|
|
|
185,960 |
|
232,651 |
|
Interest Expense |
|
|
|
|
|
|
|
|
Interest on debt |
|
|
|
|
19,735 |
|
15,044 |
|
Other interest charges |
|
|
|
|
991 |
|
1,511 |
|
Interest capitalized |
|
|
|
|
(13,388) |
|
(9,119) |
|
|
|
|
|
|
7,338 |
|
7,436 |
|
Other Income (Loss), Net |
|
|
|
|
(200) |
|
374 |
|
Income Before Income Taxes |
|
|
|
|
178,422 |
|
225,589 |
|
Provision for Income Taxes |
|
|
|
|
|
|
|
|
Current |
|
|
|
|
168 |
|
100 |
|
Deferred |
|
|
|
|
70,550 |
|
88,880 |
|
|
|
|
|
|
70,718 |
|
88,980 |
|
Net Income |
|
|
|
|
$ 107,704 |
|
$ 136,609 |
|
Earnings Per Share |
|
|
|
|
|
|
|
|
Net income attributable to Southwestern Energy stockholders – Basic |
|
|
|
$ 0.31 |
|
$ 0.39 | |
Net income attributable to Southwestern Energy stockholders – Diluted |
|
|
|
$ 0.31 |
|
$ 0.39 | |
|
Weighted Average Common Shares Outstanding |
|
|
|
|
|
|
|
|
Basic |
|
|
|
|
348,000,074 |
|
346,833,906 |
|
Diluted |
|
|
|
|
349,990,725 |
|
349,697,327 |
|
BALANCE SHEETS (Unaudited) |
Page 3 of 5 | ||
|
Southwestern Energy Company and Subsidiaries |
|
|
|
|
|
|
|
|
|
March 31, |
2012 |
|
2011 |
|
|
(in thousands) | ||
|
ASSETS |
|
|
|
|
|
|
|
|
|
Current Assets |
$ 1,228,407 |
|
$ 557,145 |
|
Property and Equipment |
11,643,954 |
|
9,516,988 |
|
Less: Accumulated depreciation, depletion and amortization |
4,617,882 |
|
3,861,053 |
|
|
7,026,072 |
|
5,655,935 |
|
Other Assets |
299,682 |
|
127,668 |
|
|
$ 8,554,161 |
|
$ 6,340,748 |
|
|
|
|
|
|
LIABILITIES AND EQUITY |
|
|
|
|
|
|
|
|
|
Current Liabilities |
$ 960,644 |
|
$ 695,191 |
|
Long-Term Debt |
1,669,380 |
|
1,202,900 |
|
Deferred Income Taxes |
1,660,284 |
|
1,203,334 |
|
Long-Term Hedging Liability |
136 |
|
60,651 |
|
Other Long-Term Liabilities |
111,958 |
|
93,379 |
|
Commitments and Contingencies |
|
|
|
|
Equity |
|
|
|
|
Common stock, $0.01 par value; authorized 1,250,000,000 shares; issued 349,227,496 shares in 2012 and 348,033,281 in 2011 |
3,492 |
|
3,480 |
|
Additional paid-in capital |
911,646 |
|
870,065 |
|
Retained earnings |
2,763,918 |
|
2,155,054 |
|
Accumulated other comprehensive income |
474,998 |
|
59,442 |
|
Common stock in treasury, 100,970 shares in 2012 and 125,077 in 2011 |
(2,295) |
|
(2,748) |
|
Total Equity |
4,151,759 |
|
3,085,293 |
|
|
$ 8,554,161 |
|
$ 6,340,748 |
|
STATEMENTS OF CASH FLOWS (Unaudited) |
Page 4 of 5 | |||
|
Southwestern Energy Company and Subsidiaries |
|
|
| |
|
|
Three Months | |||
|
Periods Ended March 31 |
2012 |
|
2011 | |
|
|
(in thousands) | |||
|
Cash Flows From Operating Activities |
|
|
| |
|
Net income |
$ 107,704 |
|
$ 136,609 | |
|
Adjustments to reconcile net income to net cash provided by operating activities: |
|
|
| |
|
Depreciation, depletion and amortization |
194,439 |
|
164,667 | |
|
Deferred income taxes |
70,550 |
|
88,880 | |
|
Unrealized gain on derivatives |
(7,324) |
|
(1,080) | |
|
Stock-based compensation |
2,844 |
|
2,450 | |
|
Other |
2,607 |
|
6 | |
|
Change in assets and liabilities |
73,843 |
|
4,947 | |
|
Net cash provided by operating activities |
444,663 |
|
396,479 | |
|
|
|
|
| |
|
Cash Flows From Investing Activities |
|
|
| |
|
Capital investments |
(557,631) |
|
(526,139) | |
|
Proceeds from sale of property and equipment |
651 |
|
11,056 | |
|
Other |
1,770 |
|
(375) | |
|
Net cash used in investing activities |
(555,210) |
|
(515,458) | |
|
|
|
|
| |
|
Cash Flows From Financing Activities |
|
|
| |
|
Payments on revolving long-term debt |
(1,271,300) |
|
(782,800) | |
|
Borrowings under revolving long-term debt |
599,800 |
|
892,700 | |
|
Proceeds from issuance of long-term debt |
998,780 |
|
— | |
|
Debt issuance costs |
(8,183) |
|
— | |
|
Change in bank drafts outstanding |
(20,520) |
|
17,749 | |
|
Revolving credit facility costs |
— |
|
(10,103) | |
|
Proceeds from exercise of common stock options |
2,540 |
|
2,743 | |
|
Net cash provided by financing activities |
301,117 |
|
120,289 | |
|
|
|
|
| |
|
Effect of exchange rate changes on cash |
(30) |
|
22 | |
|
Increase in cash and cash equivalents |
190,540 |
|
1,332 | |
|
Cash and cash equivalents at beginning of year |
15,627 |
|
16,055 | |
|
Cash and cash equivalents at end of period |
$ 206,167 |
|
$ 17,387 | |
|
SEGMENT INFORMATION (Unaudited) |
|
|
|
|
|
|
Page 5 of 5 | ||
|
Southwestern Energy Company and Subsidiaries | |||||||||
|
|
Exploration |
|
|
|
|
|
|
|
|
|
|
& |
|
Midstream |
|
|
|
|
|
|
|
|
Production |
|
Services |
|
Other |
|
Eliminations |
|
Total |
|
|
(in thousands) | ||||||||
|
Quarter Ending March 31, 2012 |
|
|
|
|
|
|
|
|
|
|
|
|
|
|
|
|
|
|
|
|
|
Revenues |
$ 466,978 |
|
$ 546,454 |
|
$ 850 |
|
$ (357,813) |
|
$ 656,469 |
|
Gas purchases |
— |
|
425,495 |
|
— |
|
(278,819) |
|
146,676 |
|
Operating expenses |
111,176 |
|
27,966 |
|
15 |
|
(78,199) |
|
60,958 |
|
General & administrative expenses |
39,946 |
|
9,605 |
|
70 |
|
(795) |
|
48,826 |
|
Depreciation, depletion & amortization |
182,739 |
|
10,570 |
|
318 |
|
— |
|
193,627 |
|
Taxes, other than income taxes |
16,874 |
|
3,529 |
|
19 |
|
— |
|
20,422 |
|
Operating Income |
$ 116,243 |
|
$ 69,289 |
|
$ 428 |
|
$ — |
|
$ 185,960 |
|
|
|
|
|
|
|
|
|
|
|
|
Capital Investments (1) |
$ 533,139 |
|
$ 26,164 |
|
$ 13,809 |
|
$ — |
|
$ 573,112 |
|
|
|
|
|
|
|
|
|
|
|
|
Quarter Ending March 31, 2011 |
|
|
|
|
|
|
|
|
|
|
|
|
|
|
|
|
|
|
|
|
|
Revenues |
$ 476,170 |
|
$ 679,268 |
|
$ 776 |
|
$ (479,879) |
|
$ 676,335 |
|
Gas purchases |
— |
|
579,320 |
|
— |
|
(409,090) |
|
170,230 |
|
Operating expenses |
98,945 |
|
27,866 |
|
— |
|
(70,013) |
|
56,798 |
|
General & administrative expenses |
30,462 |
|
7,368 |
|
63 |
|
(776) |
|
37,117 |
|
Depreciation, depletion & amortization |
154,810 |
|
8,391 |
|
246 |
|
— |
|
163,447 |
|
Taxes, other than income taxes |
13,670 |
|
2,406 |
|
16 |
|
— |
|
16,092 |
|
Operating Income |
$ 178,283 |
|
$ 53,917 |
|
$ 451 |
|
$ — |
|
$ 232,651 |
|
|
|
|
|
|
|
|
|
|
|
|
Capital Investments (1) |
$ 468,212 |
|
$ 45,978 |
|
$ 16,339 |
|
$ — |
|
$ 530,529 |
|
|
|
|
|
|
|
|
|
|
|
(1)
Capital investments include increases of $15.3 million and $1.5 million for the three-month periods ended March 31, 2012 and 2011, respectively, relating to the change in accrued expenditures between periods.