Attached files
| file | filename |
|---|---|
| EX-99.1 - EXHIBIT 99.1 - ITT Inc. | a50265176_ex991.htm |
| 8-K - ITT CORPORATION 8-K - ITT Inc. | a50265176.htm |
Exhibit 99.2
ITT Corporation Selected Historical Quarterly Financial Data Fiscal Years 2011 & 2010 May 4, 2012
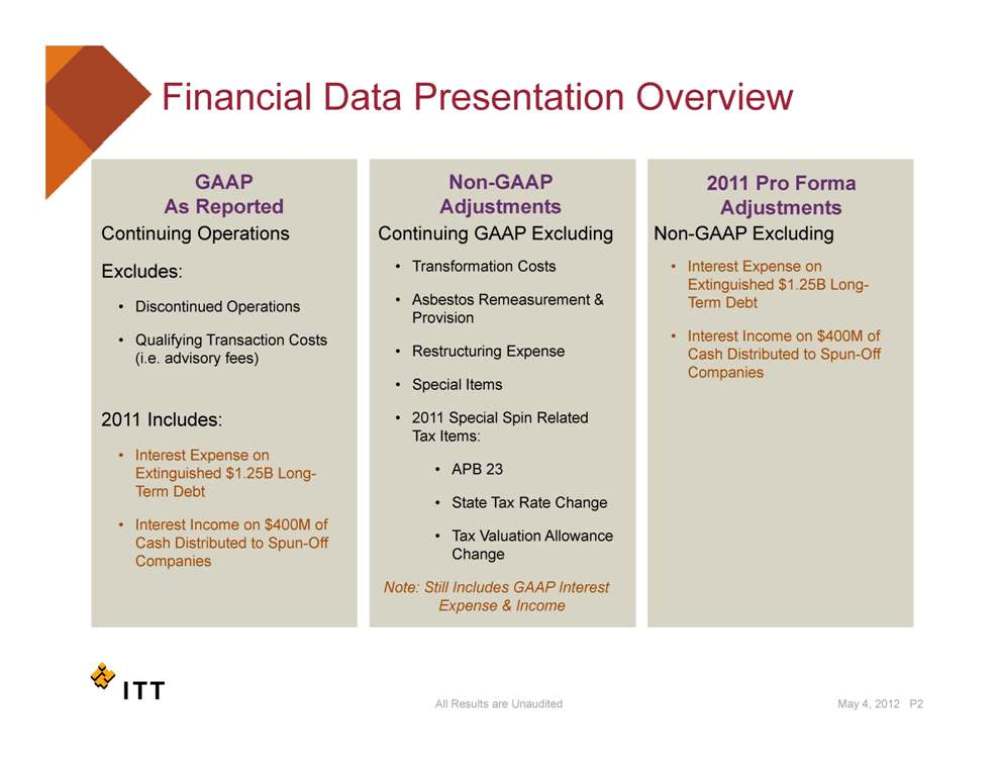
Financial Data Presentation Overview 2011 Pro Forma Adjustments GAAP As Reported Non-GAAP Adjustments Continuing Operations Continuing GAAP Excluding Non-GAAP Excluding Excludes: • Discontinued Operations Qualifying Transaction • Transformation Costs • Asbestos Remeasurement & Provision • Interest Expense on Extinguished $1.25B Long-Term Debt • • Costs (i.e. advisory fees) 2011 Includes: • Restructuring Expense • Special Items • 2011 Special Spin Related Tax Interest Income on $400M of Cash Distributed to Spun-Off Companies • Interest Expense on Extinguished $1.25B Long-Term Debt • Interest Income on $400M of Items: • APB 23 • State Tax Rate Change T V l ti All Cash Distributed to Spun-Off Companies • Tax Valuation Allowance Change Note: Still Includes GAAP Interest Expense & Income May 4, 2012 P2 All Results are Unaudited
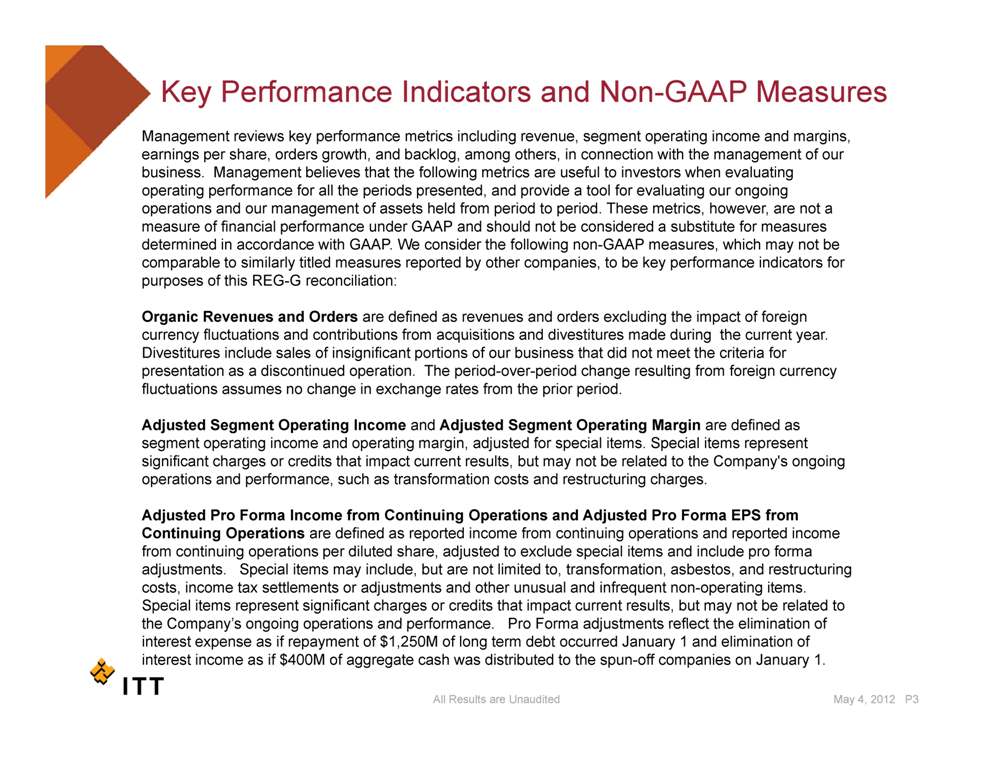
Key Performance Indicators and Non-GAAP Measures Management reviews key performance metrics including revenue, segment operating income and margins, earnings per share, orders growth, and backlog, among others, in connection with the management of our business. Management believes that the following metrics are useful to investors when evaluating operating performance for all the periods presented, and provide a tool for evaluating our ongoing operations and our management of assets held from period to period. These metrics, however, are not a measure of financial performance under GAAP and should not be considered a substitute for measures determined in accordance with GAAP. We consider the following non-GAAP measures, which may not be comparable to similarly titled measures reported by other companies, to be key performance indicators for purposes of this REG-G reconciliation: Organic Revenues and Orders are defined as revenues and orders excluding the impact of foreign acquisitions and year currency fluctuations and contributions from divestitures made during the current year. Divestitures include sales of insignificant portions of our business that did not meet the criteria for presentation as a discontinued operation. The period-over-period change resulting from foreign currency fluctuations assumes no change in exchange rates from the prior period. Adjusted Segment Operating Income and Adjusted Segment Operating Margin are defined as segment operating income and operating margin, adjusted for special items. Special items represent significant charges or credits that impact current results, but may not be related to the Company's ongoing operations and performance, such as transformation costs and restructuring charges. Adjusted Pro Forma Income from Continuing Operations and Adjusted Pro Forma EPS from Continuing Operations are defined as reported income from continuing operations and reported income from continuing operations per diluted share, adjusted to exclude special items and include pro forma adjustments. Special items may include, but are not limited to, transformation, asbestos, and restructuring costs, income tax settlements or adjustments and other unusual and infrequent non-operating items. Special items represent significant charges or credits that impact current results, but may not be related to Company’s ongoing operations and performance Pro May 4, 2012 P3 All Results are Unaudited the Company s performance. Forma adjustments reflect the elimination of interest expense as if repayment of $1,250M of long term debt occurred January 1 and elimination of interest income as if $400M of aggregate cash was distributed to the spun-off companies on January 1.
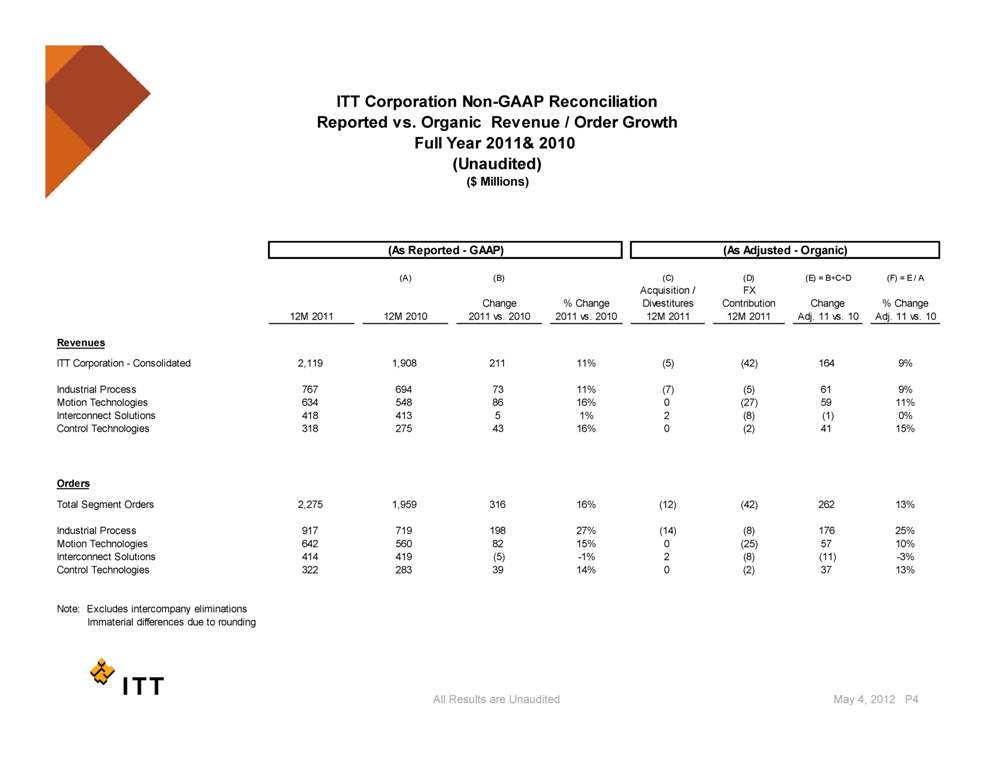
ITT Corporation Non-GAAP Reconciliation Reported vs. Organic Revenue / Order Growth Year 2011& Full 2010 (Unaudited) ($ Millions) (A) (B) (C) (D) (E) = B+C+D (F) = E / A Change % Change Acquisition / Divestitures FX Contribution Change % Change 12M 2011 12M 2010 2011 vs. 2010 2011 vs. 2010 12M 2011 12M 2011 Adj. 11 vs. 10 Adj. 11 vs. 10 (As Reported - GAAP) (As Adjusted - Organic) Revenues ITT Corporation - Consolidated 2,119 1,908 211 11% (5) (42) 164 9% Industrial Process 767 694 73 11% (7) (5) 61 9% Motion Technologies 634 548 86 16% 0 (27) 59 11% Interconnect Solutions 418 413 5 1% 2 (8) (1) 0% Control Technologies 318 275 43 16% 0 ( 2) 41 15% Co o ec o og es 3 8 5 3 6% ) 5% Orders Total Segment Orders 2,275 1,959 316 16% (12) (42) 262 13% P 917 719 198 27% (14) (8) 176 25% Industrial Process Motion Technologies 642 560 82 15% 0 (25) 57 10% Interconnect Solutions 414 419 (5) -1% 2 (8) (11) -3% Control Technologies 322 283 39 14% 0 (2) 37 13% Note: Excludes intercompany eliminations May 4, 2012 P4 All Results are Unaudited Immaterial differences due to rounding
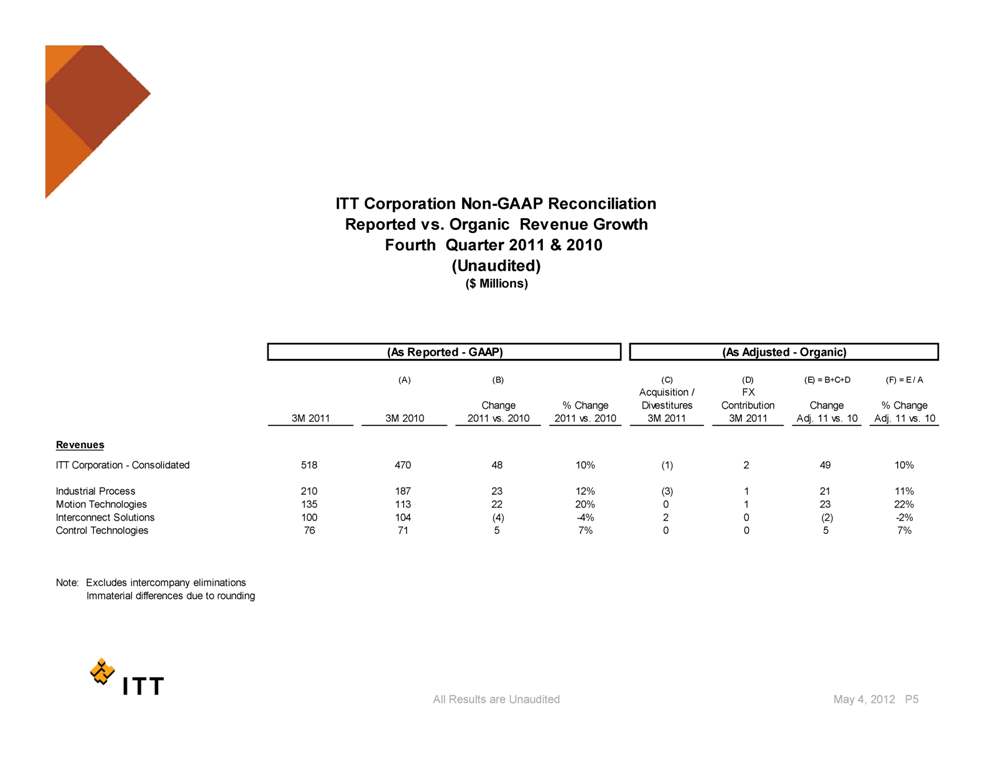
ITT Corporation Non-GAAP Reconciliation Reported vs. Organic Revenue Growth Q & Fourth Quarter 2011 & 2010 ($ Millions) (Unaudited) (A) (B) (C) (D) (E) = B+C+D (F) = E / A Change % Change Acquisition / Divestitures FX Contribution Change % Change 3M 2011 3M 2010 2011 vs. 2010 2011 vs. 2010 3M 2011 3M 2011 Adj. 11 vs. 10 Adj. 11 vs. 10 (As Reported - GAAP) (As Adjusted - Organic) Revenues ITT Corporation - Consolidated 518 470 48 10% (1) 2 49 10% Industrial Process 210 187 23 12% (3) 1 21 11% Motion Technologies 135 113 22 20% 0 1 23 22% Interconnect Solutions 100 104 (4) -4% 2 0 (2) -2% Control 76 71 5 7% 0 0 5 7% Technologies Note: Excludes intercompany eliminations Immaterial differences due to rounding All Results are Unaudited May 4, 2012 P5
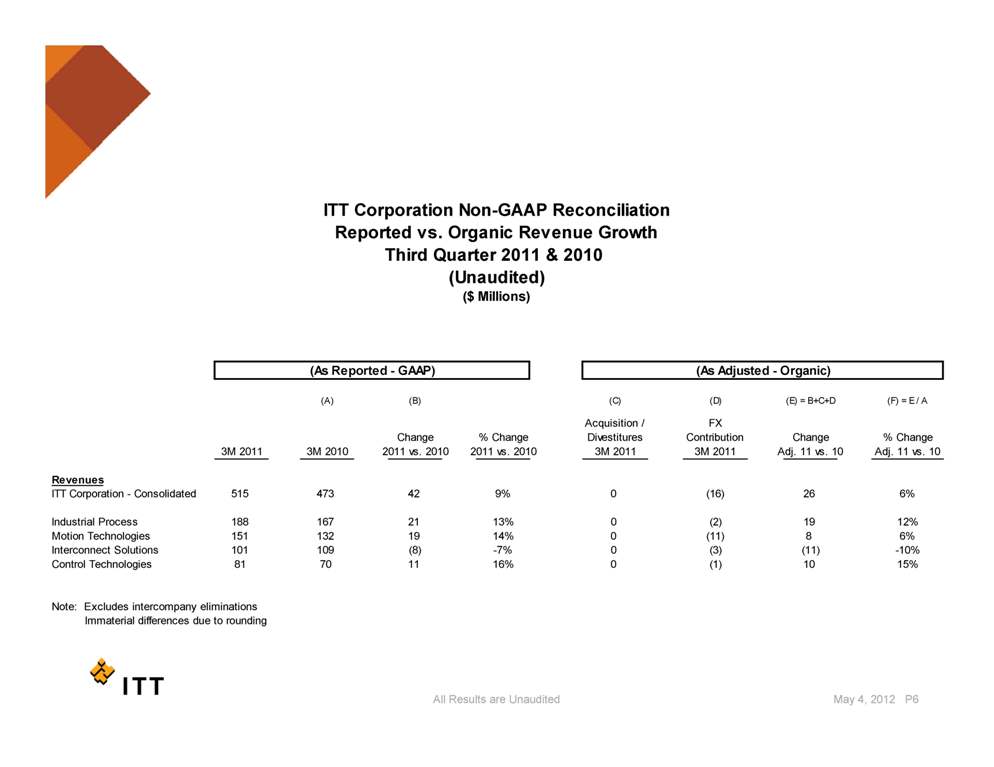
ITT Corporation Non-GAAP Reconciliation Reported vs. Organic Revenue Growth Third Quarter 2011 & 2010 (Unaudited) ($ Millions) (A) (B) (C) (D) (E) = B+C+D (F) = E / A Acquisition / FX (As Reported - GAAP) (As Adjusted - Organic) Change % Change Divestitures Contribution Change % Change 3M 2011 3M 2010 2011 vs. 2010 2011 vs. 2010 3M 2011 3M 2011 Adj. 11 vs. 10 Adj. 11 vs. 10 Revenues ITT Corporation - Consolidated 515 473 42 9% 0 (16) 26 6% Industrial Process 188 167 21 13% 0 (2) 19 12% Motion Technologies 151 132 19 14% 0 (11) 8 6% Interconnect Solutions 101 109 (8) -7% 0 (3) (11) -10% Control Technologies 81 70 11 16% 0 (1) 10 15% Note: Excludes intercompany eliminations Immaterial differences due to rounding All Results are Unaudited May 4, 2012 P6
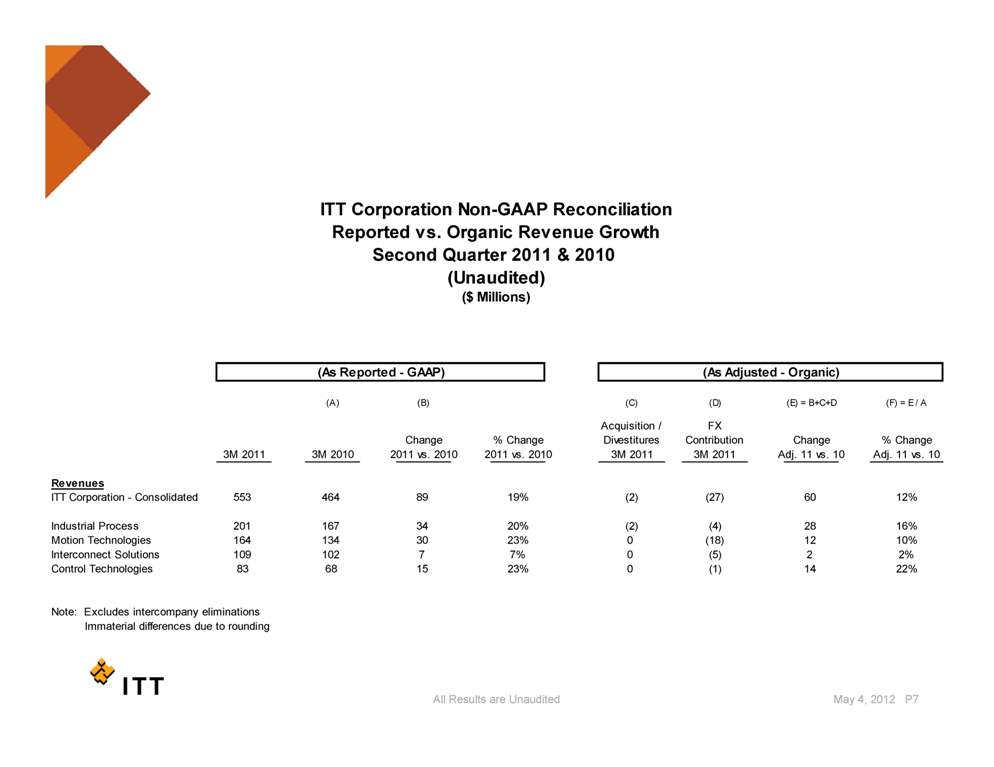
ITT Corporation Non-GAAP Reconciliation Reported vs. Organic Revenue Growth Second Quarter 2011 & 2010 (Unaudited) ($ Millions) (A) (B) (C) (D) (E) = B+C+D (F) = E / A Acquisition / FX (As Reported - GAAP) (As Adjusted - Organic) Change % Change Divestitures Contribution Change % Change 3M 2011 3M 2010 2011 vs. 2010 2011 vs. 2010 3M 2011 3M 2011 Adj. 11 vs. 10 Adj. 11 vs. 10 Revenues ITT Corporation - Consolidated 553 464 89 19% (2) (27) 60 12% Industrial 201 167 34 20% (2) (4) 28 16% Process Motion Technologies 164 134 30 23% 0 (18) 12 10% Interconnect Solutions 109 102 7 7% 0 (5) 2 2% Control Technologies 83 68 15 23% 0 (1) 14 22% Note: Excludes intercompany eliminations Immaterial differences due to All Results are Unaudited May 4, 2012 P7 rounding
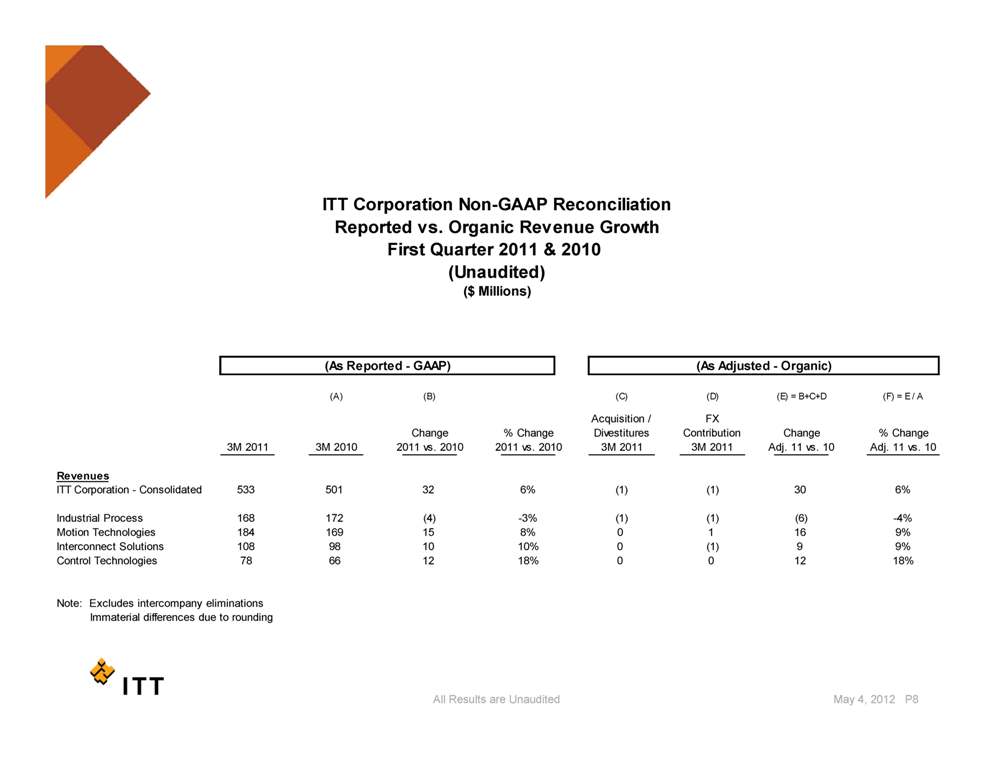
ITT Corporation Non-GAAP Reconciliation Reported vs. Organic Revenue Growth First Quarter 2011 & 2010 (Unaudited) ($ Millions) (A) (B) (C) (D) (E) = B+C+D (F) = E / A Change % Acquisition / Divestitures FX Contribution Change % (As Reported - GAAP) (As Adjusted - Organic) Change Change 3M 2011 3M 2010 2011 vs. 2010 2011 vs. 2010 3M 2011 3M 2011 Adj. 11 vs. 10 Adj. 11 vs. 10 Revenues ITT Corporation - Consolidated 533 501 32 6% (1) (1) 30 6% Industrial Process 168 172 (4) -3% (1) (1) (6) -4% 184 169 15 8% 0 1 16 9% Motion Technologies Interconnect Solutions 108 98 10 10% 0 (1) 9 9% Control Technologies 78 66 12 18% 0 0 12 18% Note: Excludes intercompany eliminations Immaterial differences due to rounding All Results are Unaudited May 4, 2012 P8
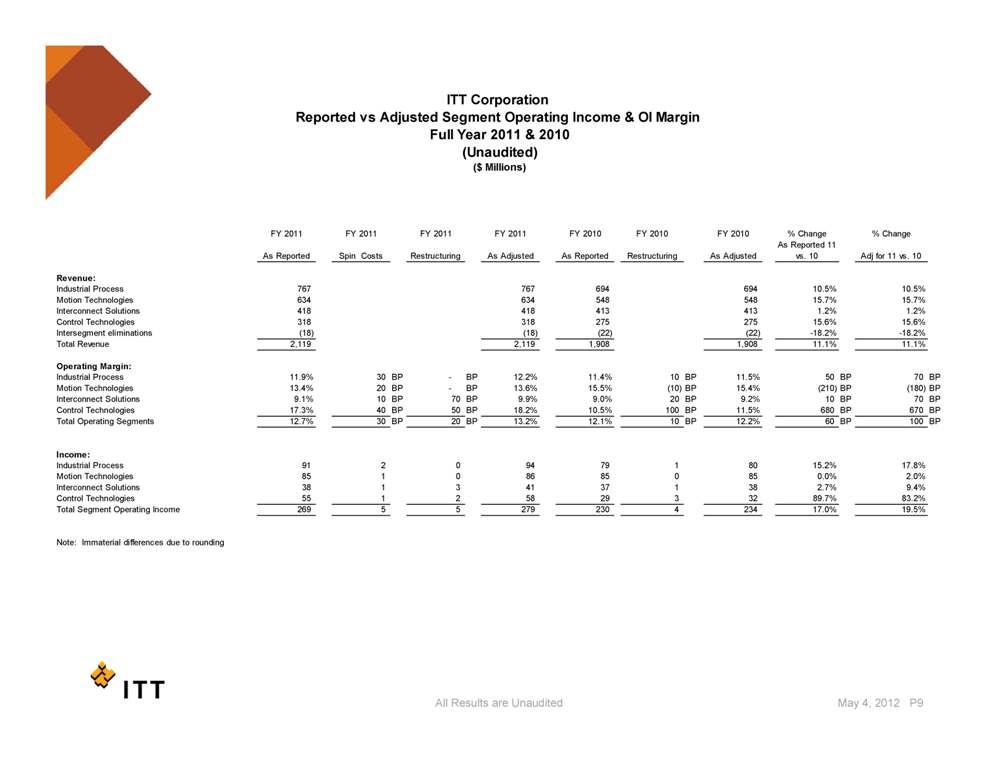
ITT Corporation Reported vs Adjusted Segment Operating Income & OI Margin Full Year 2011 & 2010 FY 2011 FY 2011 FY 2011 FY 2011 FY 2010 FY 2010 FY 2010 % Change % Change (Unaudited) ($ Millions) As Reported Spin Costs Restructuring As Adjusted As Reported Restructuring As Adjusted As Reported 11 vs. 10 Adj for 11 vs. 10 Revenue: Industrial Process 767 767 694 694 10.5% 10.5% Motion Technologies 634 634 548 548 15.7% 15.7% Interconnect Solutions 418 418 413 413 1.2% 1.2% Control Technologies 318 318 275 275 15.6% 15.6% Intersegment eliminations ( 18) ( 18) ( 22) ( 22) -18.2% -18.2% Total Revenue 2,119 2,119 1,908 1,908 11.1% 11.1% Operating Margin: Industrial Process 11.9% 30 BP - BP 12.2% 11.4% 10 BP 11.5% 50 BP 70 BP Motion Technologies 13.4% 20 BP - BP 13.6% 15.5% (10) BP 15.4% (210) BP (180) BP Interconnect Solutions 9.1% 10 BP 70 BP 9.9% 9.0% 20 BP 9.2% 10 BP 70 BP Control Technologies 17.3% 40 BP 50 BP 18.2% 10.5% 100 BP 11.5% 680 BP 670 BP Total Operating Segments 12.7% 30 BP 20 BP 13.2% 12.1% 10 BP 12.2% 60 BP 100 BP Income: Industrial Process 91 2 0 94 79 1 80 15.2% 17.8% Motion Technologies 85 1 0 86 85 0 85 0.0% 2.0% Interconnect Solutions 38 1 3 41 37 1 38 2.7% 9.4% Control Technologies 55 1 2 58 29 3 32 89.7% 83.2% Total Segment Operating Income 269 5 5 279 230 4 234 17.0% 19.5% Note: Immaterial differences due to rounding All Results are Unaudited May 4, 2012 P9
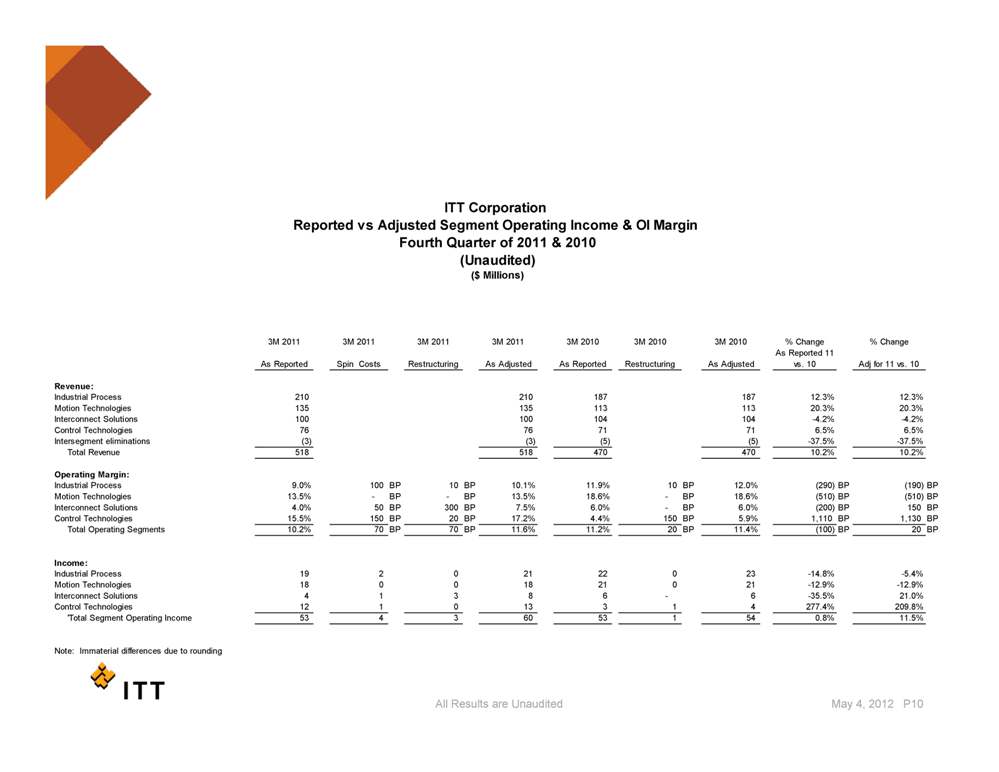
ITT Corporation Reported vs Adjusted Segment Operating Income & OI Margin Fourth Quarter of 2011 & 2010 ($ Millions) (Unaudited) 3M 2011 3M 2011 3M 2011 3M 2011 3M 2010 3M 2010 3M 2010 % Change % Change As Reported Spin Costs Restructuring As Adjusted As Reported Restructuring As Adjusted As Reported 11 vs. 10 Adj for 11 vs. 10 Revenue: Industrial Process 210 210 187 187 12.3% 12.3% Motion Technologies 135 135 113 113 20.3% 20.3% Interconnect Solutions 100 100 104 104 -4.2% -4.2% Control Technologies 76 76 71 71 6.5% 6.5% Intersegment eliminations (3) (3) (5) (5) -37.5% -37.5% Total Revenue 518 518 470 470 10.2% 10.2% Operating Margin: Industrial Process 9.0% 100 BP 10 BP 10.1% 11.9% 10 BP 12.0% (290) BP (190) BP Motion Technologies 13.5% - BP - BP 13.5% 18.6% - BP 18.6% (510) BP (510) BP Interconnect Solutions 4.0% 50 BP 300 BP 7.5% 6.0% - BP 6.0% (200) BP 150 BP Control Technologies 15.5% 150 BP 20 BP 17.2% 4.4% 150 BP 5.9% 1,110 BP 1,130 BP Total 10.2% 70 BP 70 BP 11.6% 11.2% 20 BP 11.4% (100) BP 20 BP Operating Segments Income: Industrial Process 19 2 0 21 22 0 23 -14.8% -5.4% Motion Technologies 18 0 0 18 21 0 21 -12.9% -12.9% Interconnect Solutions 4 1 3 8 6 - 6 -35.5% 21.0% Control Technologies 12 1 0 13 3 1 4 277.4% 209.8% 'Total Segment Operating Income 53 4 3 60 53 1 54 0.8% 11.5% All Results are Unaudited Note: Immaterial differences due to rounding May 4, 2012 P10
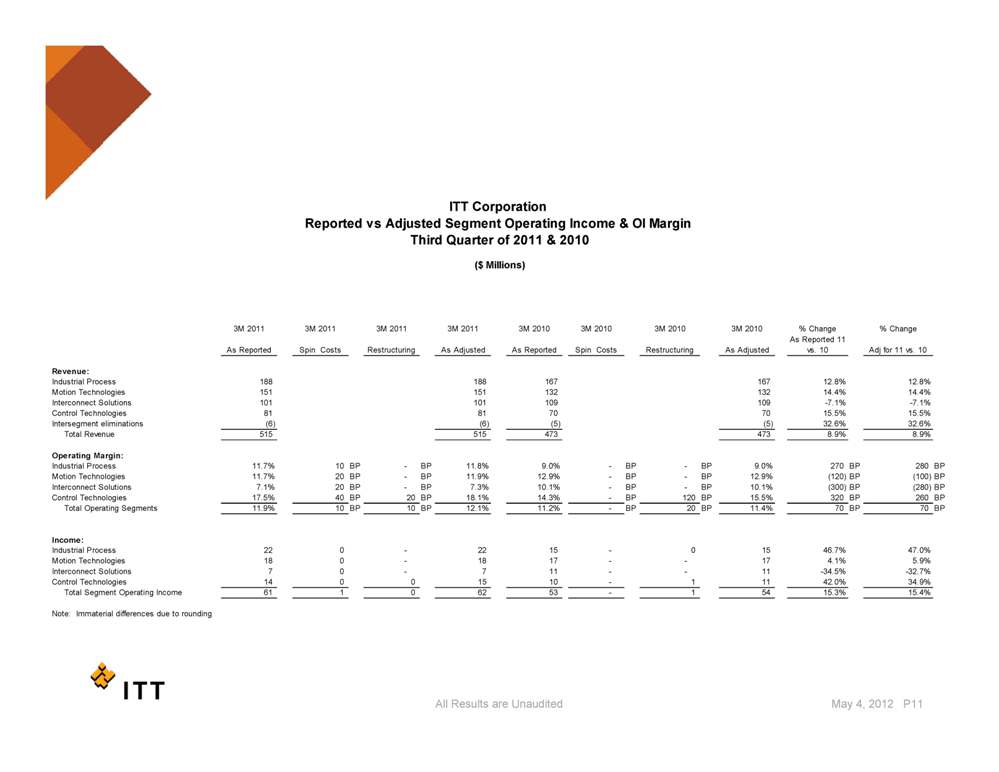
ITT Corporation Reported vs Adjusted Segment Operating Income & OI Margin Quarter of 2011 & 2010 Third 3M 2011 3M 2011 3M 2011 3M 2011 3M 2010 3M 2010 3M 2010 3M 2010 % Change % Change ($ Millions) As Reported Spin Costs Restructuring As Adjusted As Reported Spin Costs Restructuring As Adjusted As Reported 11 vs. 10 Adj for 11 vs. 10 Revenue: Industrial Process 188 188 167 167 12.8% 12.8% Motion Technologies 151 151 132 132 14.4% 14.4% Interconnect Solutions 101 101 109 109 -7.1% -7.1% Control Technologies 81 81 70 70 15.5% 15.5% Intersegment eliminations (6) (6) (5) (5) 32.6% 32.6% 515 8 9% 8 9% Total Revenue 515 473 473 8.9% 8.9% Operating Margin: Industrial Process 11.7% 10 BP - BP 11.8% 9.0% - BP - BP 9.0% 270 BP 280 BP Motion Technologies 11.7% 20 BP - BP 11.9% 12.9% - BP - BP 12.9% (120) BP (100) BP Interconnect Solutions 7.1% 20 BP - BP 7.3% 10.1% - BP - BP 10.1% (300) BP (280) BP Control Technologies 17.5% 40 BP 20 BP 18.1% 14.3% - BP 120 BP 15.5% 320 BP 260 BP Total Operating Segments 11.9% 10 BP 10 BP 12.1% 11.2% - BP 20 BP 11.4% 70 BP 70 BP Income: Industrial Process 22 0 - 22 15 - 0 15 46.7% 47.0% Motion Technologies 18 0 - 18 17 - - 17 4.1% 5.9% Interconnect Solutions 7 0 - 7 11 - - 11 -34.5% -32.7% Control Technologies 14 0 0 15 10 - 1 11 42.0% 34.9% Total Segment Operating Income 61 1 0 62 53 - 1 54 15.3% 15.4% Note: Immaterial differences due to rounding All Results are Unaudited May 4, 2012 P11

ITT Corporation Reported vs Adjusted Segment Operating Income & OI Margin Second Quarter of 2011 & 20110 3M 2011 3M 2011 3M 2011 3M 2011 3M 2010 3M 2010 3M 2010 3M 2010 % Change % Change ($ Millions) As Reported Spin Costs Restructuring As Adjusted As Reported Spin Costs Restructuring As Adjusted As Reported 11 vs. 10 Adj for 11 vs. 10 Revenue: Industrial Process 201 201 167 167 19.9% 19.9% Motion Technologies 164 164 134 134 22.9% 22.9% Interconnect Solutions 109 109 102 102 6.9% 6.9% Control Technologies 83 83 68 68 22.9% 22.9% Intersegment eliminations (3) (3) (6) (6) -45.0% -45.0% T t l R 553 553 464 19 2% 19 2% Total Revenue 464 19.2% 19.2% Operating Margin: Industrial Process 14.6% - BP - BP 14.6% 14.3% - BP - BP 14.3% 30 BP 30 BP Motion Technologies 13.1% - BP - BP 13.1% 13.2% - BP - BP 13.2% (10) BP (10) BP Interconnect Solutions 14.0% - BP - BP 14.0% 10.3% - BP 20 BP 10.5% 370 BP 350 BP Control Technologies 18.5% - BP 40 BP 18.9% 13.3% - BP 30 BP 13.6% 520 BP 530 BP Total Operating Segments 14.7% - BP 10 BP 14.8% 13.1% - BP 10 BP 13.2% 160 BP 160 BP Income: Industrial Process 29 - - 29 24 - - 24 22.2% 22.2% Motion Technologies 22 - - 22 18 - - 18 22.2% 22.2% Interconnect Solutions 15 - - 15 11 - 0 11 44.8% 42.1% Control Technologies 15 - 0 16 9 - - 9 71.1% 70.7% Total Segment Operating Income 81 - 0 81 61 - 0 61 33.3% 32.7% Note: Immaterial differences due to rounding All Results are Unaudited May 4, 2012 P12
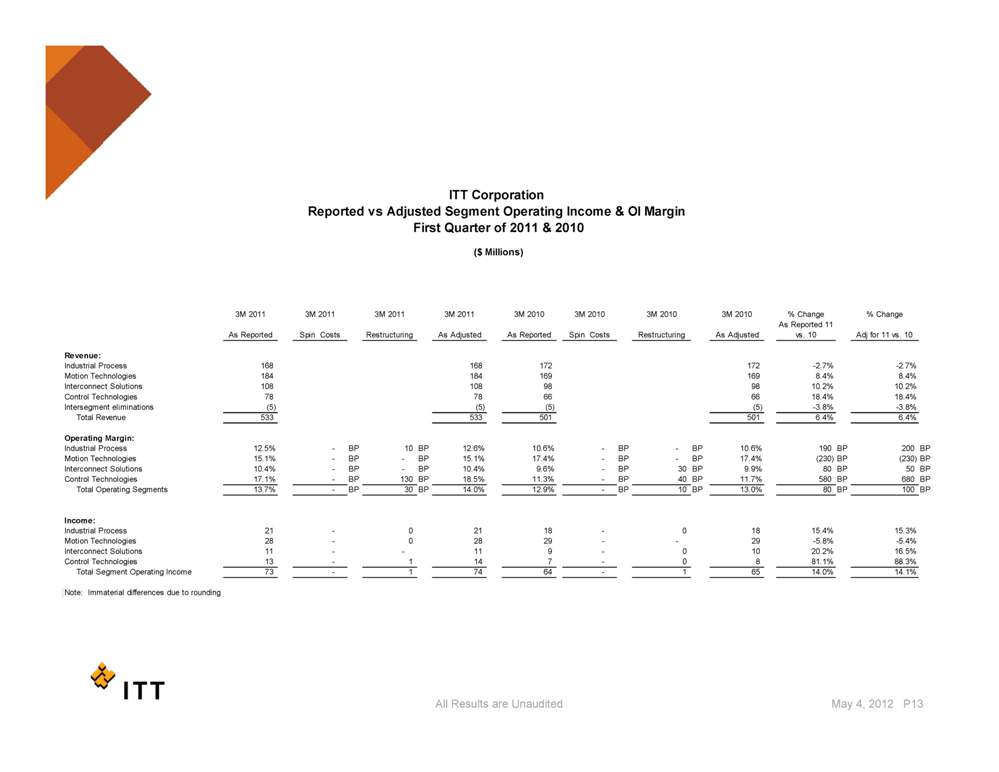
ITT Corporation Reported vs Adjusted Segment Operating Income & OI Margin First Quarter of 2011 & 2010 3M 2011 3M 2011 3M 2011 3M 2011 3M 2010 3M 2010 3M 2010 3M 2010 % Change % Change As Reported Spin Costs Restructuring As Adjusted As Reported Spin Costs Restructuring As Adjusted As Reported 11 vs. 10 Adj for 11 vs. 10 ($ Millions) s epoted Sp est uctu g s djusted s epo ted Sp est uctu g s djusted s 0 dj o s 0 Revenue: Industrial Process 168 168 172 172 -2.7% -2.7% Motion Technologies 184 184 169 169 8.4% 8.4% Interconnect Solutions 108 108 98 98 10.2% 10.2% Control Technologies 78 78 66 66 18.4% 18.4% Intersegment eliminations (5) (5) (5) (5) -3.8% -3.8% Total Revenue 533 533 501 501 6.4% 6.4% Operating Margin: Industrial Process 12.5% - BP 10 BP 12.6% 10.6% - BP - BP 10.6% 190 BP 200 BP Motion Technologies 15.1% - BP - BP 15.1% 17.4% - BP - BP 17.4% (230) BP (230) BP Interconnect Solutions 10.4% - BP - BP 10.4% 9.6% - BP 30 BP 9.9% 80 BP 50 BP Control Technologies 17.1% - BP 130 BP 18.5% 11.3% - BP 40 BP 11.7% 580 BP 680 BP Total Operating Segments 13.7% - BP 30 BP 14.0% 12.9% - BP 10 BP 13.0% 80 BP 100 BP Income: Industrial 21 - 0 21 18 - 0 18 15 4% 15 3% Process 15.4% 15.3% Motion Technologies 28 - 0 28 29 - - 29 -5.8% -5.4% Interconnect Solutions 11 - - 11 9 - 0 10 20.2% 16.5% Control Technologies 13 - 1 14 7 - 0 8 81.1% 88.3% Total Segment Operating Income 73 - 1 74 64 - 1 65 14.0% 14.1% Note: Immaterial differences due to rounding All Results are Unaudited May 4, 2012 P13
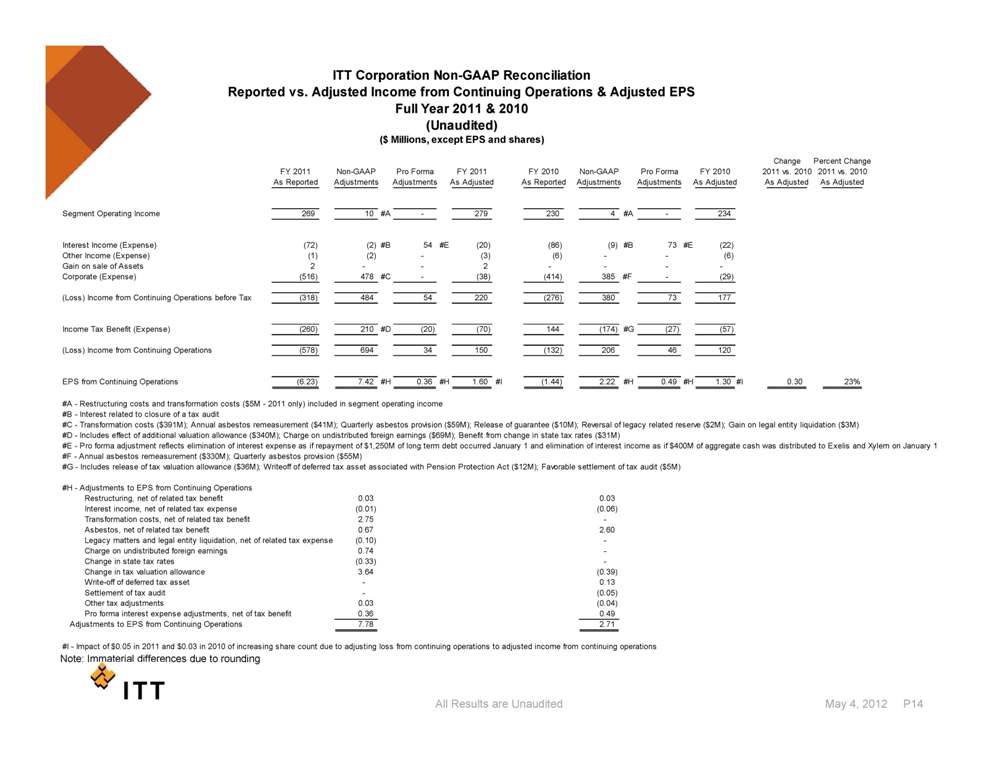
ITT Corporation Non-GAAP Reconciliation Reported vs. Adjusted Income from Continuing Operations & Adjusted EPS Full Year 2011 & 2010 ($ Millions, except EPS and shares) (Unaudited) Change Percent Change FY 2011 Non-GAAP Pro Forma FY 2011 FY 2010 Non-GAAP Pro Forma FY 2010 2011 vs. 2010 2011 vs. 2010 As Reported Adjustments Adjustments As Adjusted As Reported Adjustments Adjustments As Adjusted As Adjusted As Adjusted Segment Operating Income 269 10 #A - 279 230 4 #A - 234 , p ) Interest Income (Expense) (72) (2) #B 54 #E (20) (86) (9) #B 73 #E (22)Other Income (Expense) (1) (2) - (3) (6) - - (6) Gain on sale of Assets 2 - - 2 - - - - Corporate (Expense) (516) 478 #C - (38) (414) 385 #F - (29) (Loss) Income from Continuing Operations before Tax (318) 484 54 220 (276) 380 73 177 Income Tax Benefit (Expense) (260) 210 #D (20) (70) 144 (174) #G (27) (57) (Loss) Income from Continuing Operations (578) 694 34 150 (132) 206 46 120 EPS from Continuing Operations (6.23) 7.42 #H 0.36 #H 1.60 #I (1.44) 2.22 #H 0.49 #H 1.30 #I 0.30 23% #A - Restructuring costs and transformation costs ($5M - 2011 only) included in segment operating income #B - Interest related to closure of a tax audit #C - Transformation costs ($391M); Annual asbestos remeasurement ($41M); Quarterly asbestos provision ($59M); Release of guarantee ($10M); Reversal of legacy related reserve ($2M); Gain on legal entity liquidation ($3M) #31M) D - Includes effect of additional valuation allowance ($340M); Charge on undistributed foreign earnings ($69M); Benefit from change in state tax rates ($#E - Pro forma adjustment reflects elimination of interest expense as if repayment of $1,250M of long term debt occurred January 1 and elimination of interest income as if $400M of aggregate cash was distributed to Exelis and Xylem on January 1 #F - Annual asbestos remeasurement ($330M); Quarterly asbestos provision ($55M) #G - Includes release of tax valuation allowance ($36M); Writeoff of deferred tax asset associated with Pension Protection Act ($12M); Favorable settlement of tax audit ($5M) #H - Adjustments to EPS from Continuing Operations Restructuring, net of related tax benefit 0.03 0.03 Interest income, net of related tax expense (0.01) (0.06) Transformation costs, net of related tax benefit 2.75 - Asbestos, 0.67 2.60 net of related tax benefit Legacy matters and legal entity liquidation, net of related tax expense (0.10) - Charge on undistributed foreign earnings 0.74 - Change in state tax rates (0.33) - Change in tax valuation allowance 3.64 (0.39) Write-off of deferred tax asset - 0.13 Settlement of tax audit - (0.05) Other tax adjustments 0.03 (0.04) Pro forma interest expense adjustments, net of tax benefit 0.36 0.49 Adjustments to EPS from Continuing Operations 7.78 2.71 #I - Impact of $0.05 in 2011 and $0.03 in 2010 of increasing share count due to adjusting loss from continuing operations to adjusted income from continuing operations All Results are Unaudited May 4, 2012 P14 Note: Immaterial differences due to rounding
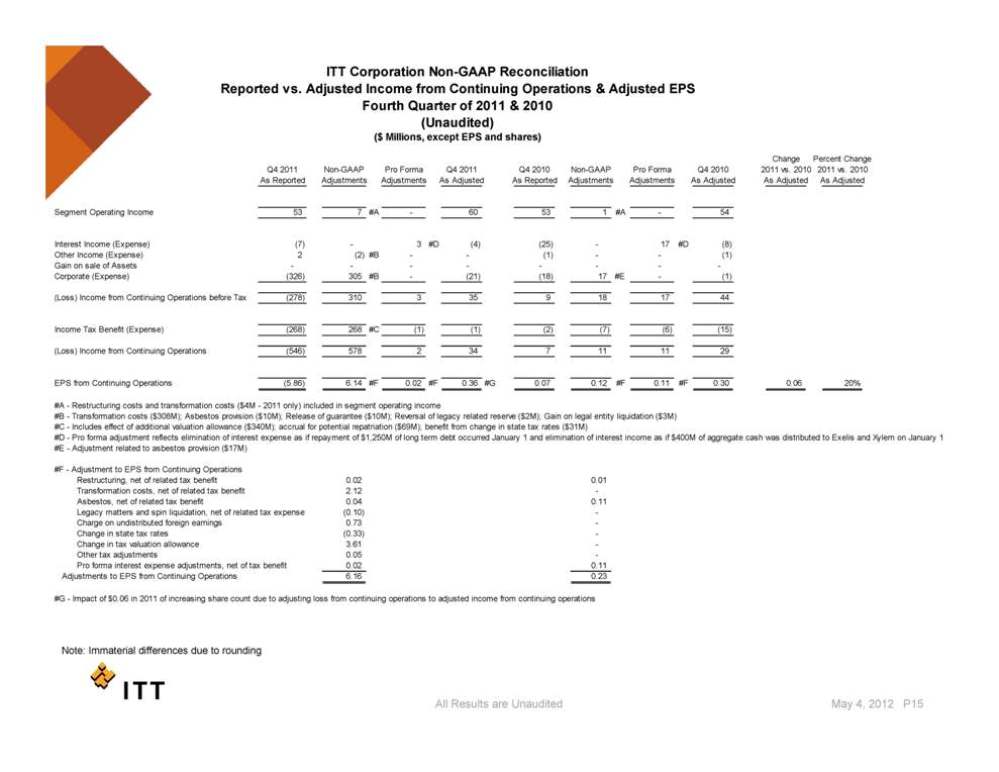
ITT Corporation Non-GAAP Reconciliation Reported vs. Adjusted Income from Continuing Operations & Adjusted EPS Fourth Quarter of 2011 & 2010 ($ Millions, except EPS and shares) (Unaudited) Change Percent Change Q4 2011 Non-GAAP Pro Forma Q4 2011 Q4 2010 Non-GAAP Pro Forma Q4 2010 2011 vs. 2010 2011 vs. 2010 As Reported Adjustments Adjustments As Adjusted As Reported Adjustments Adjustments As Adjusted As Adjusted As Adjusted Segment Operating Income 53 7 #A - 60 53 1 #A – 54 Interest Income (Expense) (7) - 3 #D (4) (25) - 17 #D (8) Other Income (Expense) 2 (2) #B - - (1) - - (1) Gain on sale of Assets - - - - - - - - Corporate (Expense) (326) 305 #B - (21) (18) 17 #E - (1) (Loss) Income from Continuing Operations before Tax (278) 310 3 35 9 18 17 44 Income Tax Benefit (Expense) (268) 268 #C (1) (1) (2) (7) (6) (15) (Loss) Income from Continuing Operations (546) 578 2 34 7 11 11 29 EPS from Continuing Operations (5.86) 6.14 #F 0.02 #F 0.36 #G 0.07 0.12 #F 0.11 #F 0.30 0.06 20% #A - Restructuring costs and transformation costs ($4M - 2011 only) included in segment operating income #B - Transformation costs ($308M); Asbestos provision ($10M); Release of guarantee ($10M); Reversal of legacy related reserve ($2M); Gain on legal entity liquidation ($3M) #C - Includes effect of additional valuation allowance ($340M); accrual for potential repatriation ($69M); benefit from change in state tax rates ($31M) - Pro forma adjustment reflects elimination of interest expense as if repayment of 1,250M of long term debt occurred January 1 and elimination of interest income as if $400M of aggregate cash was distributed to Exelis and Xylem on January #E - Adjustment related to asbestos provision ($17M) #F - Adjustment to EPS from Continuing Operations Restructuring, net of related tax benefit 0.02 0.01 Transformation costs, net of related tax benefit 2.12 - Asbestos, net of related tax benefit 0.04 0.11 Legacy matters and spin liquidation, net of related tax expense (0.10) - Charge on undistributed foreign earnings 0.73 - Change (0 33) in state tax rates 0.33) - Change in tax valuation allowance 3.61 - Other tax adjustments 0.05 - Pro forma interest expense adjustments, net of tax benefit 0.02 0.11 Adjustments to EPS from Continuing Operations 6.16 0.23 #G - Impact of $0.06 in 2011 of increasing share count due to adjusting loss from continuing operations to adjusted income from continuing operations All Results are Unaudited Note: Immaterial differences due to rounding May 4, 2012 P15
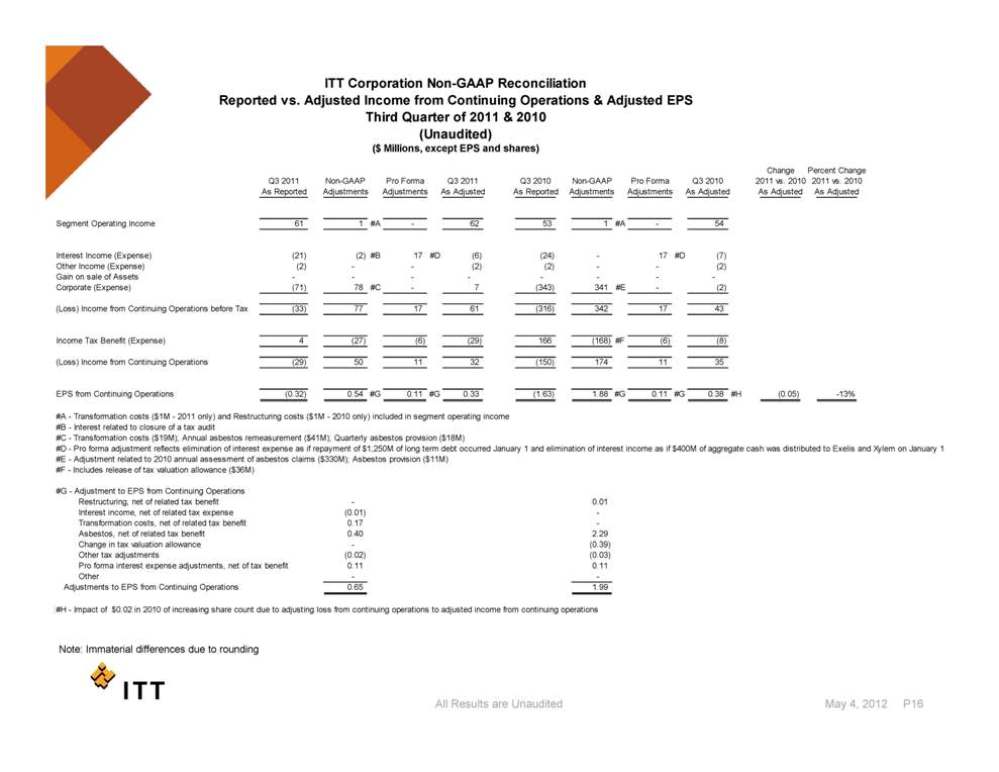
ITT Corporation Non-GAAP Reconciliation Reported vs. Adjusted Income from Continuing Operations & Adjusted EPS Third Quarter of 2011 & 2010 (Unaudited) Change Percent Change Q3 2011 Non-GAAP Pro Forma Q3 2011 Q3 2010 Non-GAAP Pro Forma Q3 2010 2011 vs. 2010 2011 vs. 2010 As Reported Adjustments Adjustments As Adjusted As Reported Adjustments Adjustments As Adjusted As Adjusted As Adjusted Segment Operating Income 61 1 #A - 62 53 1 #A – 54 ($ Millions, except EPS and shares) Interest Income (Expense) (21) (2) #B 17 #D (6) (24) - 17 #D (7) Other Income (Expense) (2) - - (2) (2) - - (2) Gain on sale of Assets - - - - - - - - Corporate (Expense) (71) 78 #C - 7 (343) 341 #E - (2) (Loss) Income from Continuing Operations before Tax (33) 77 17 61 (316) 342 17 43 f ( ) ( ) ( ) ( ) ( ) # ( ) ( ) Income Tax Benefit Expense) 4 27) 6) 29) 166 168) F 6) 8) (Loss) Income from Continuing Operations (29) 50 11 32 (150) 174 11 35 EPS from Continuing Operations (0.32) 0.54 #G 0.11 #G 0.33 (1.63) 1.88 #G 0.11 #G 0.38 #H (0.05) -13% #A - Transformation costs ($1M - 2011 only) and Restructuring costs ($1M - 2010 only) included in segment operating income #B - Interest related to closure of a tax audit #C T f i 19M) A l b 41M) Q l b i i - Transformation costs ($19M); Annual asbestos remeasurement ($41M); Quarterly asbestos provision ($18M) #D - Pro forma adjustment reflects elimination of interest expense as if repayment of $1,250M of long term debt occurred January 1 and elimination of interest income as if $400M of aggregate cash was distributed to Exelis and Xylem on January #E - Adjustment related to 2010 annual assessment of asbestos claims ($330M); Asbestos provision ($11M) #F - Includes release of tax valuation allowance ($36M) #G - Adjustment to EPS from Continuing Operations Restructuring, net of related tax benefit - 0.01 Interest income, net of related tax expense (0.01) - Transformation costs, net of related tax benefit 0.17 - Asbestos ta 0 40 2 29 Asbestos, net of related tax benefit 0.40 2.29 Change in tax valuation allowance - (0.39) Other tax adjustments (0.02) (0.03) Pro forma interest expense adjustments, net of tax benefit 0.11 0.11 Other - - Adjustments to EPS from Continuing Operations 0.65 1.99 #H - Impact of $0.02 in 2010 of increasing share count due to adjusting loss from continuing operations to adjusted income from continuing operations All Results are Unaudited May 4, 2012 P16 Note: Immaterial differences due to rounding
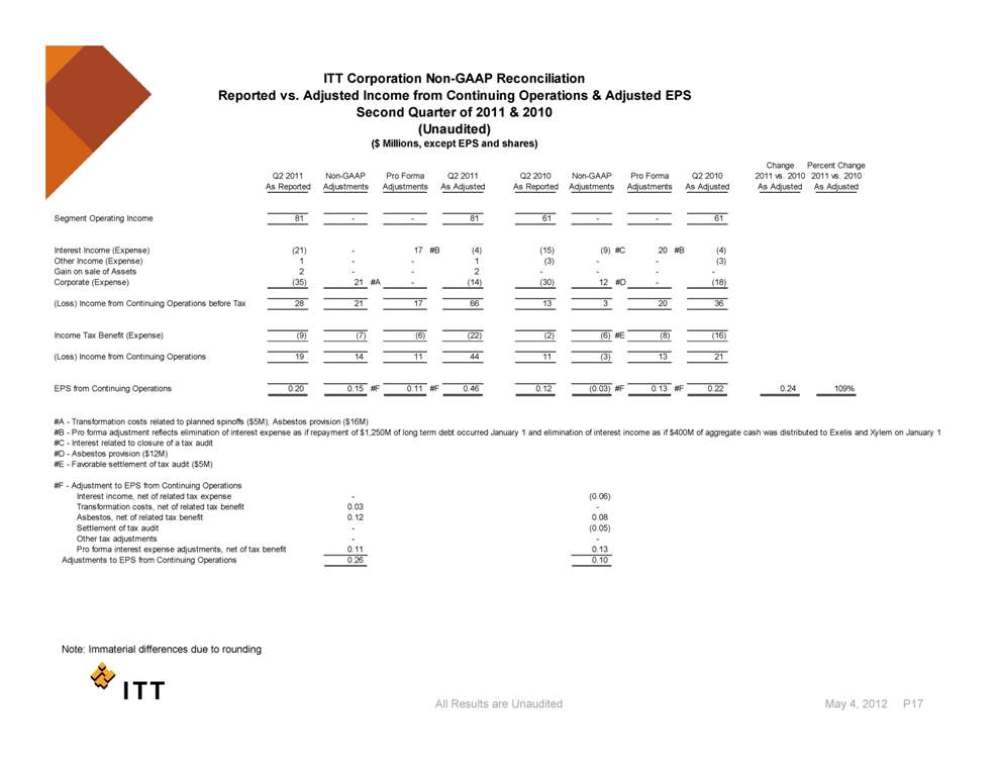
($ Millions except ITT Corporation Non-GAAP Reconciliation Reported vs. Adjusted Income from Continuing Operations & Adjusted EPS Second Quarter of 2011 & 2010 (Unaudited) Change Percent Change Q2 2011 Non-GAAP Pro Forma Q2 2011 Q2 2010 Non-GAAP Pro Forma Q2 2010 2011 vs. 2010 2011 vs. 2010 As Reported Adjustments Adjustments As Adjusted As Reported Adjustments Adjustments As Adjusted As Adjusted As Adjusted Segment Operating Income 81 - - 81 61 - - 61 Millions, EPS and shares) Interest Income (Expense) (21) - 17 #B (4) (15) (9) #C 20 #B (4) Other Income (Expense) 1 - - 1 (3) - - (3) Gain on sale of Assets 2 - - 2 - - - - Corporate (Expense) (35) 21 #A - (14) (30) 12 #D - (18) (Loss) Income from Continuing Operations before Tax 28 21 17 66 13 3 20 36 Income (9) (7) (6) (22) (2) (6) #E (8) (16) Tax Benefit (Expense) (Loss) Income from Continuing Operations 19 14 11 44 11 (3) 13 21 EPS from Continuing Operations 0.20 0.15 #F 0.11 #F 0.46 0.12 (0.03) #F 0.13 #F 0.22 0.24 109% #A - Transformation costs related to planned spinoffs ($5M); Asbestos provision ($16M) #B - interest income as if $400M of aggregate cash was distributed to Exelis and Xylem on January Pro forma adjustment reflects elimination of interest expense as if repayment of $1,250M of long term debt occurred January 1 and elimination of #C - Interest related to closure of a tax audit #D - Asbestos provision ($12M) #E - Favorable settlement of tax audit ($5M) #F - Adjustment to EPS from Continuing Operations Interest income, net of related tax expense - (0.06) Transformation costs, net of related tax benefit 0.03 - Asbestos, net of related tax benefit 0.12 0.08 Settlement of tax audit - ( 0.05) ) Other tax adjustments - - Pro forma interest expense adjustments, net of tax benefit 0.11 0.13 Adjustments to EPS from Continuing Operations 0.26 0.10 All Results are Unaudited May 4, 2012 P17 Note: Immaterial differences due to rounding

Millions except shares) ITT Corporation Non-GAAP Reconciliation Reported vs. Adjusted Income from Continuing Operations & Adjusted EPS First Quarter of 2011 & 2010 (Unaudited) Change Percent Change Q1 2011 Non-GAAP Pro Forma Q1 2011 Q1 2010 Non-GAAP Pro Forma Q1 2010 2011 vs. 2010 2011 vs. 2010 As Reported Adjustments Adjustments As Adjusted As Reported Adjustments Adjustments As Adjusted As Adjusted As Adjusted Segment Operating Income 73 1 #A - 74 64 1 #A – 65 ($ Millions, EPS and Interest Income (Expense) (24) - 17 #C (7) (23) - 18 #C (5) Other Income (Expense) (1) - - (1) (1) - - (1) Gain on sale of Assets - - - - - - - - Corporate (Expense) (83) 76 #B - (7) (22) 15 #D - (7) (Loss) Income from Continuing Operations before Tax (35) 77 17 59 18 16 18 52 Income 13 (24) (6) (17) (18) 6 #E (7) (19) Tax Benefit (Expense) (Loss) Income from Continuing Operations (22) 53 11 42 - 22 11 33 EPS from Continuing Operations (0.23) 0.57 #F 0.11 #F 0.45 - 0.24 #F 0.12 #F 0.36 0.09 25% #A - Restructuring costs included in segment operating income #B - Transformation costs ($ 60M); Quarterly asbestos provision ($ 16M) ); y p ) #C - Pro forma adjustment reflects elimination of interest expense as if repayment of $1,250M of long term debt occurred January 1 and elimination of interest income as if 400M of aggregate cash was distributed to Exelis and Xylem on January 1 #D - Asbestos provision ($15M) #E - Includes writeoff of deferred tax asset associated with Pension Protection Act ($12M) #F - Adjustments to EPS from Continuing Operations Restructuring, net of related tax benefit 0.01 0.01 Transformation costs, net of related tax benefit 0.43 - Asbestos, net of related tax benefit 0.13 0.10 Write-off of deferred tax asset - 0.13 Pro forma interest expense adjustments, net of tax benefit 0.11 0.12 Adjustments to EPS from Continuing Operations 0.68 0.36 All Results are Unaudited May 4, 2012 P18 Note: Immaterial differences due to rounding