Attached files
| file | filename |
|---|---|
| 8-K - FORM 8-K - FRANKLIN ELECTRIC CO INC | a2012548-kshareownersprese.htm |

Annual Shareowners’ Meeting May 4, 2012

2011 Financial Highlights Sales $821 M + 15% EPS $2.65 + 61% ROIC1 21.5% + 52% Net Debt/Capital 2% – 1 Operating income/net debt + equity 2
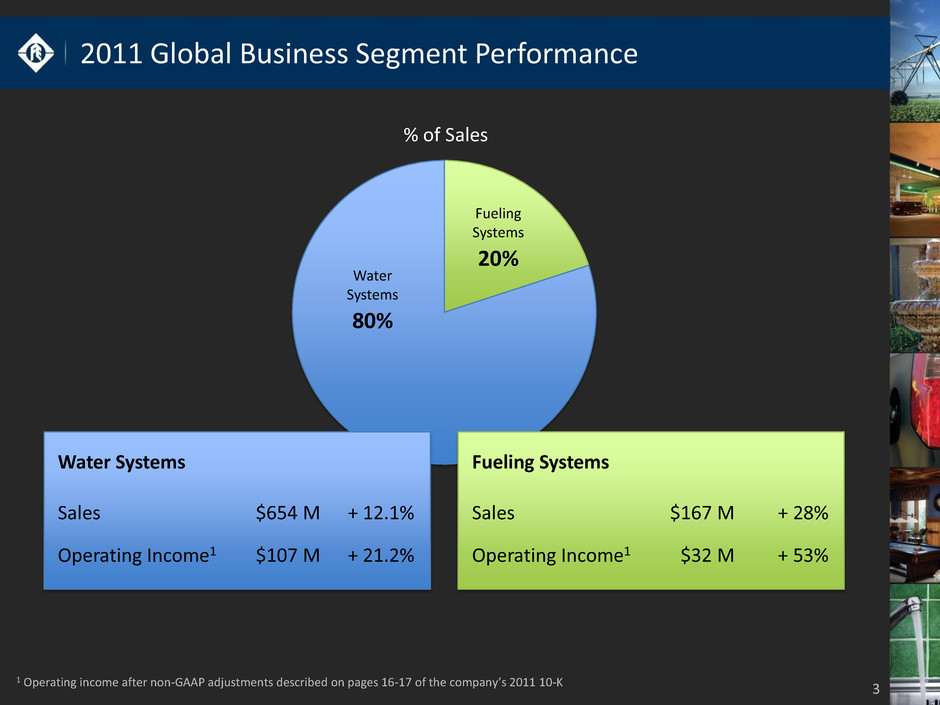
2011 Global Business Segment Performance % of Sales Water Systems 80% Fueling Systems 20% Fueling Systems Sales $167 M + 28% Operating Income1 $32 M + 53% 1 Operating income after non-GAAP adjustments described on pages 16-17 of the company’s 2011 10-K Water Systems Sales $654 M + 12.1% Operating Income1 $107 M + 21.2% 3

Increased Dividend for the 19th Consecutive Year 4 $0 1993 $0.20 $0.40 $0.40 $0.50 $0.60 $0.10 1994 1995 1996 1997 1998 1999 2000 2002 2009 2003 2004 2005 2006 2007 2008 2010 2001 2011

Increased Dividend for the 19th Consecutive Year 20th 5 $0 1993 $0.20 $0.40 $0.40 $0.50 $0.60 $0.10 1994 1995 1996 1997 1998 1999 2000 2002 2009 2003 2004 2005 2006 2007 2008 2010 2001 2011 2012
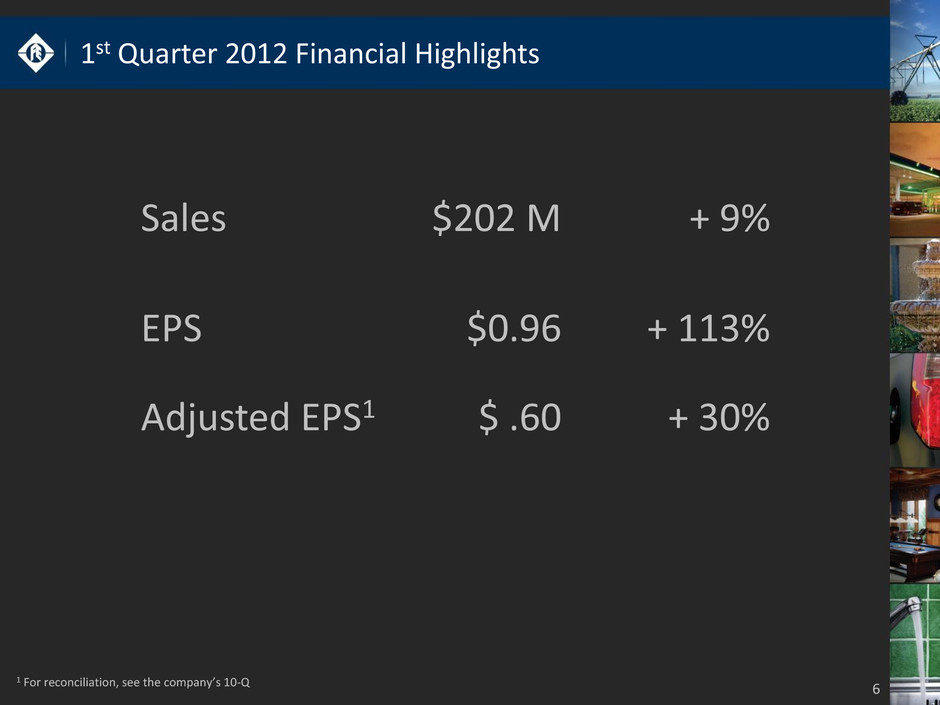
1st Quarter 2012 Financial Highlights Sales $202 M + 9% EPS $0.96 + 113% Adjusted EPS1 $ .60 + 30% 6 1 For reconciliation, see the company’s 10-Q

Strategic Imperatives • Continuously improve quality and cost 7 • Grow through product line extensions and geographic expansion

North American Water Systems Manufacturing Restructuring Program (2005-2011) • 8 factories consolidated to 2 factories • 1.3 M ft2 consolidated to 0.66 M ft2 Western Pump Monarch Pump Linares Little Giant Pump Siloam Springs Jonesboro JBD Pump 8 Wilburton

North American Water Systems Manufacturing 9 Restructuring Program 2005-2011 Cumulative Capital Investment $45 M Approx. Annual Direct Labor and Fixed Cost Reduction $30 M

North American Pump & Motor Manufacturing Facilities 10 Two World Class Manufacturing Facilities Wilburton, Oklahoma High Horsepower Motors & Pumps Linares, Mexico Low Horsepower Motors & Pumps • “15 Best Plants in North America” – Industry Week Magazine • “Best Plant in Mexico” – Great Places to Work Institute

Upgraded and Expanded Facilities During 2011 11 Johannesburg, South Africa Izmir, Turkey Portland, Oregon (Pioneer Pump) Joinville, Brazil

Upgraded and Expanded Facilities During 2011 12 Johannesburg, South Africa Izmir, Turkey Portland, Oregon (Pioneer Pump) Joinville, Brazil

New Corporate Headquarters 13

Water Systems Product Line Extensions 14 Motors, Controls and Drives 1990s Motors, Pumps, Drives and Controls 2004 Franklin Submersible Motor 1950s Adjacent Pumping Systems 2006 Pre-Packaged Pumping Systems Global Addressable Market: ≈ $1.2 B ≈ $1.7 B ≈ $2.7 B ≈ $5.5 B ≈ $7.5 B

Oil and Gas Well Deliquification System 15 Annual Pumping Equipment Purchases ≈ $0.5 B / year (US, Canada, Australia) Natural gas to pipeline. Typical Water Well Depth (40 to 600 feet) Typical Oil/Gas Well Depth (2000 to 6000 feet) Natural gas released from seam. Coal or shale seam.

Other Packaged Systems Development Initiatives 2011 16 Solar Groundwater Pumping Systems Water Pressure Boosting/Control Systems

Pioneer Pump Acquisition – March 2012 17 Mobile Pumping Systems - 2011 Sales - $70 M • Oil and gas fracking liquids • Dewatering mines and construction sites • Wastewater by-pass • Flood control

Water Systems Geographic Expansion 18 US/Canada Western Europe Latin America Eastern Europe2 Mideast/Africa Asia Pacific Total km3/year 700 400 350 200 400 2,100 4,150 Water Withdrawals by Region1 1 Source UNESCO and management estimates 2 Russia, Ukraine, Belarus 74% in Developing Regions
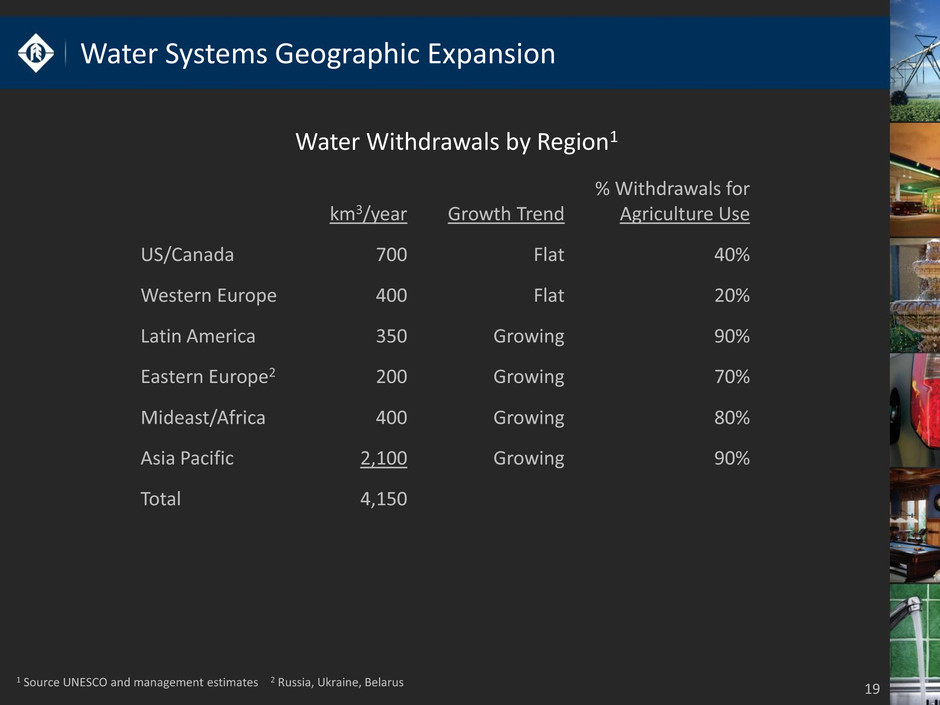
Water Systems Geographic Expansion 19 US/Canada Western Europe Latin America Eastern Europe2 Mideast/Africa Asia Pacific Total km3/year 700 400 350 200 400 2,100 4,150 % Withdrawals for Agriculture Use 40% 20% 90% 70% 80% 90% Growth Trend Flat Flat Growing Growing Growing Growing Water Withdrawals by Region1 1 Source UNESCO and management estimates 2 Russia, Ukraine, Belarus

Water Systems Sales to Developing Regions 20 $48M 2003 2010 $0 $50 $75 $100 $125 $150 $175 $200 $225 2004 2005 2006 2007 2008 2009 $55M $77M $94M $135M $204M $188M $228M 12% Share of Addressable Market % of Total Franklin Water Sales 16% 40% $25 2011E $270M $250 $275
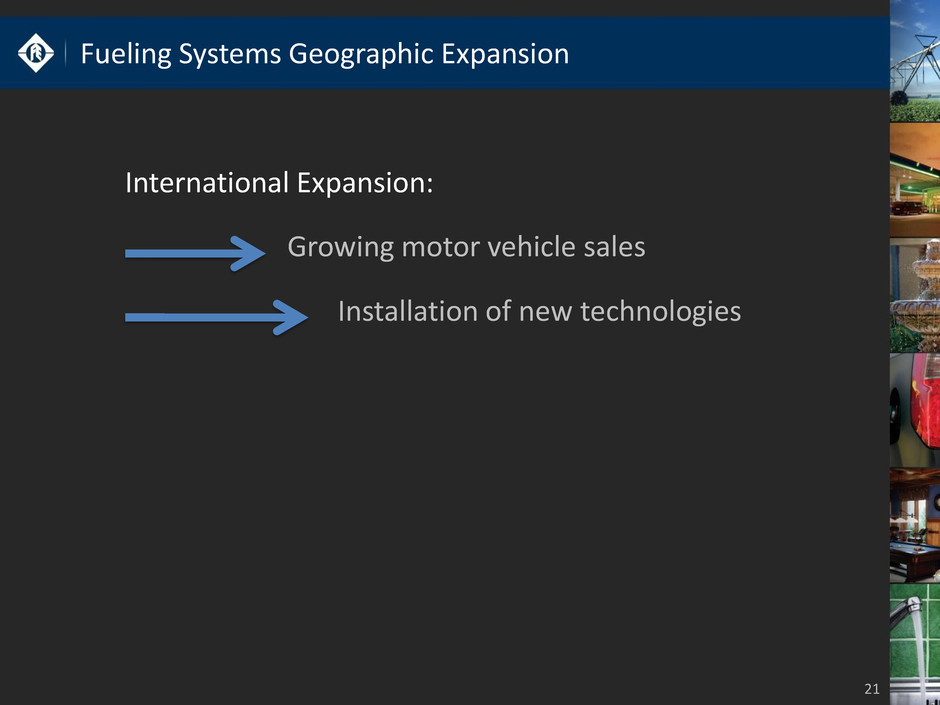
Fueling Systems Geographic Expansion 21 Growing motor vehicle sales Installation of new technologies International Expansion:

Fueling Systems Annual Sales of Cars and Light Trucks 22 Up 5.5x North America 2000 Est. 2011 20 M 15.2 M 3 M 16.6 M China, India & Latin America 1 Source Scotiabank Group Global Auto Report

Fueling Systems Installation of New Technologies 23 United States Rest of World Number of Stations 175,000 500,000 Stations with pressure pumping technology 97% 23% Stations with vapor recovery systems 80% 17% Stations with fuel management systems 75% 36% * Franklin management estimates International Markets (on board)

Fueling Systems International Sales Growth 24 2011 $0 $20 $40 $100 2005 $60 $80 $17 M $71 M % of Franklin Fueling Sales: 22% 42%

25 The Problem: 5000 children per day die in Africa from lack of access to clean, safe drinking water
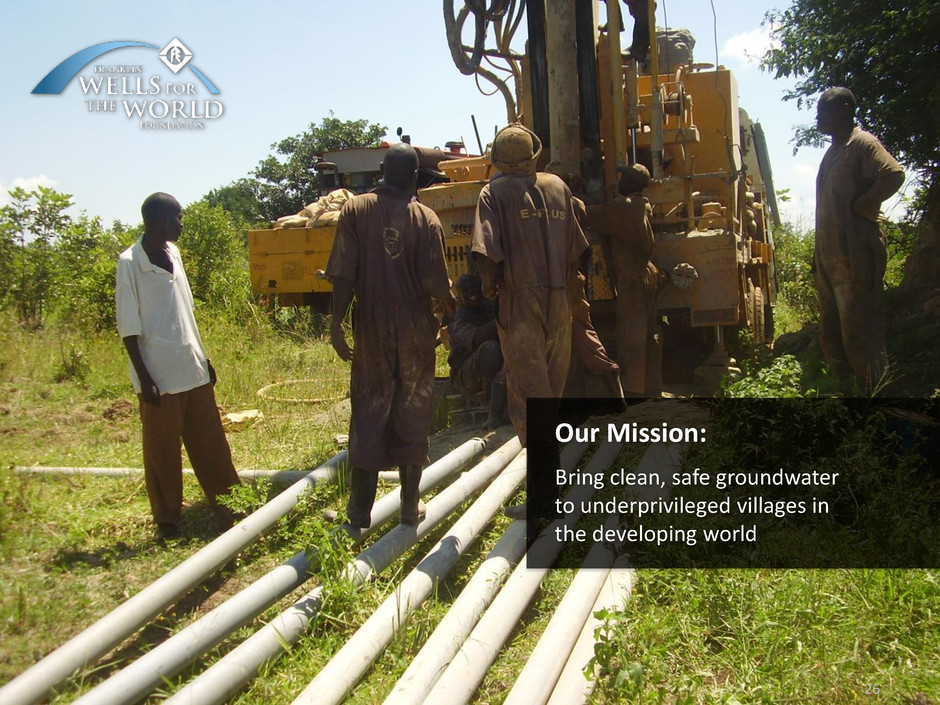
26 Our Mission: Bring clean, safe groundwater to underprivileged villages in the developing world

27 Our Approach: Partner with governments so we provide the water system infrastructure and the government provides ongoing maintenance

28 Hlabisa, Kwa-Zulu Natal – 1,500 People Emfilweni – 2,500 People Southern Sudan – 4,000 People Zimbabwe – 3,000 People Kenya Nakura – 10,000 People Botswana – 3,000 People

Annual Shareowners’ Meeting May 4, 2012
