Attached files
| file | filename |
|---|---|
| 8-K - FORM 8-K - CAREFUSION Corp | d343049d8k.htm |
| EX-99.1 - NEWS RELEASE - CAREFUSION Corp | d343049dex991.htm |
 ©
2012 CareFusion Corporation or one of its subsidiaries. All rights reserved.
Q3 and 9-Months Fiscal 2012
Investor/Analyst Call
May 3, 2012
Exhibit 99.2 |
 ©
2012 CareFusion Corporation or one of its subsidiaries. All rights reserved.
2
Safe Harbor and Additional
Information
“Safe
Harbor”
Statement
under
the
Private
Securities
Litigation
Reform
Act
of
1995:
This
presentation
contains
forward-looking
statements addressing expectations, prospects, estimates and other matters that are dependent
upon future events or developments. The matters discussed in these
forward-looking statements are subject to risks and uncertainties that could cause actual results to differ
materially from those projected, anticipated or implied. The most significant of these
uncertainties are described in CareFusion’s Form 10-K, Form 10-Q and Form
8-K reports (including all amendments to those reports) and exhibits to those reports, and include (but are not limited
to) the following: we may be unable to effectively enhance our existing products or introduce
and market new products or may fail to keep pace with advances in technology; we are
subject to complex and costly regulation; cost containment efforts of our customers, purchasing
groups, third-party payers and governmental organizations could adversely affect our sales
and profitability; current economic conditions have and may continue to adversely
affect our results of operations and financial condition; we may be unable to realize any benefit from our
cost reduction and restructuring efforts and our profitability may be hurt or our business
otherwise might be adversely affected; we may be unable to protect our intellectual
property rights or may infringe on the intellectual property rights of others; defects or failures associated
with our products and/or our quality system could lead to the filing of adverse event reports,
recalls or safety alerts and negative publicity and could subject us to regulatory
actions; we are currently operating under an amended consent decree with the FDA and our failure to
comply with the requirements of the amended consent decree may have an adverse effect on our
business; and our success depends on our key personnel, and the loss of key personnel
or the transition of key personnel, including our chief executive officer, could disrupt our
business. This presentation reflects management’s views as of May 3, 2012. Except to the
extent required by applicable law, we undertake no obligation to update or revise any
forward-looking statement. Non-GAAP
Financial
Measures:
The
financial
information
included
in
this
presentation
includes
Non-GAAP
financial
measures.
Reconciliations
can
be
found
on
slides
19
and
20
of
this
presentation.
In
addition,
definitions
and
reconciling
information
can
be
found
on
CareFusion’s
website
at
www.carefusion.com
under
the
Investors
tab.
New Reporting
Segments:
Commencing
with
the
quarter
ended
September
30,
2011,
CareFusion
began
reporting
financial
results
based
on its two new operating and reportable segments, Medical Systems and Procedural Solutions.
The financial information contained in this presentation reflects these new segments,
which replaced the Critical Care Technologies and Medical Technologies and Services segments
under which the company had previously reported. The Medical Systems segment includes the
company’s Dispensing Technologies, Infusion Systems and Respiratory Technologies
business lines. The Procedural Solutions segment includes the company’s Infection Prevention, Medical
Specialties and Specialty Disposables business lines. The company has separately provided
summary historical financial data for the new reportable segments in a report on Form
8-K filed with the Securities and Exchange Commission on November 2, 2011. Nicolet
Divestiture: On April 23, 2012, the company announced it had entered into an agreement
to sell its Nicolet neurodiagnostic and monitoring business. Results from the
Nicolet business, which had been included in the Other sub-segment of the Procedural Solutions
segment have been classified as discontinued operations as of March 31, 2012. Reported
results for continuing operations and comparisons to prior periods exclude the
historical results of the Nicolet business. Previously reported results have been
adjusted to reflect the impact of the re-segmentation of CareFusion’s businesses and the divestiture of
the International Surgical Products (ISP) business. The ISP business was divested in
April 2011, and has been classified as discontinued operations. Comparisons to
prior periods exclude the historical results of the ISP business.
|
| ©
2012 CareFusion Corporation or one of its subsidiaries. All rights reserved.
3
Today’s Speakers
•
Kieran Gallahue, Chairman and Chief Executive
Officer
•
Jim Hinrichs, Chief Financial Officer |
 ©
2012 CareFusion Corporation or one of its subsidiaries. All rights reserved.
Agenda
Q&A
4
Updated Fiscal 2012 Guidance
Q3 and 9-Months Fiscal 2012 Results |
 ©
2012 CareFusion Corporation or one of its subsidiaries. All rights reserved.
Q3 and 9-Months Fiscal 2012
Results |
 ©
2012 CareFusion Corporation or one of its subsidiaries. All rights reserved.
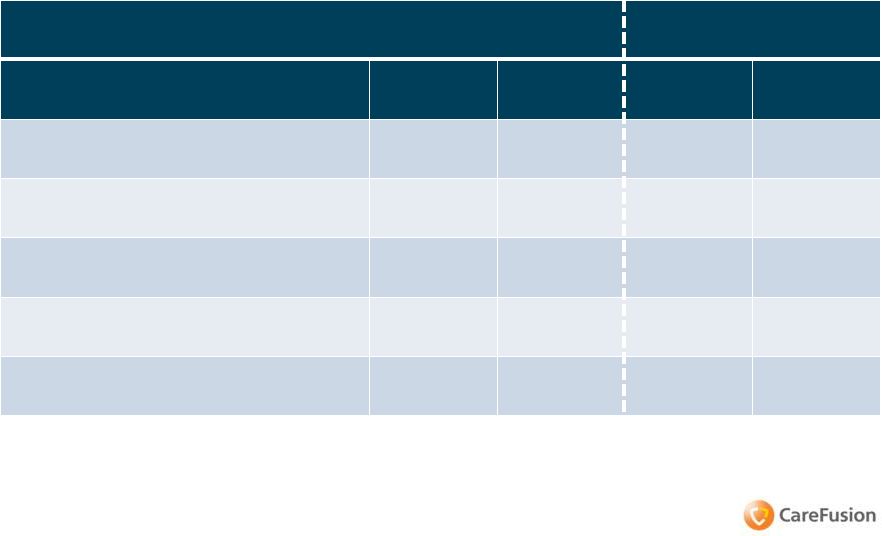
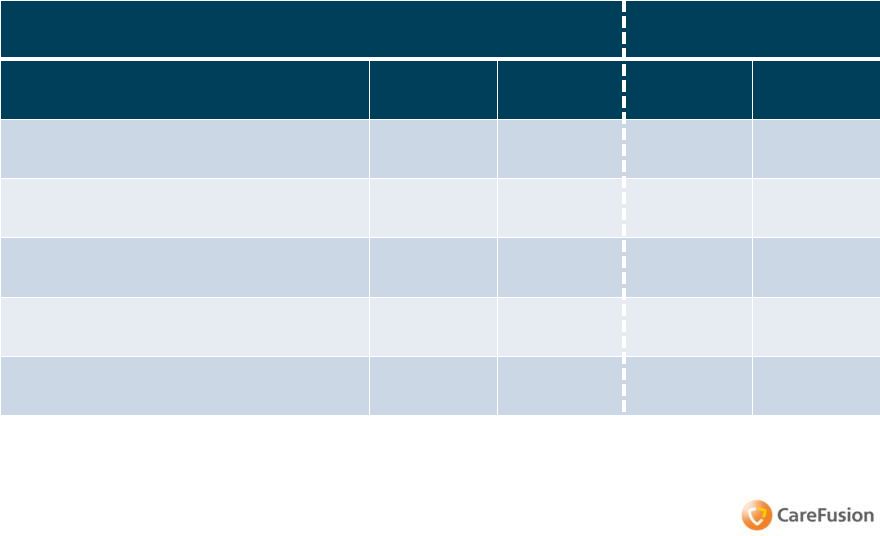
Q3 FY12 Year-Over-Year
Quarterly Review
GAAP
Adjusted
$M
% Change¹
$M
% Change¹
Revenue
$919
9%
$919
9%
Operating Expenses²
,
³
$298
(3)%
$286
1%
Operating Income³
$161
10%
$173
12%
Income From Continuing
Operations³
$103
20%
$112
19%
Diluted EPS From Continuing
Operations³
$0.45
18%
$0.49
17%
6
1
2
3
% Change over prior year period.
Operating expenses consist of selling, general and administrative, research and development, and
restructuring and acquisition integration expenses. Adjusted amounts are non-GAAP financial
measures that exclude items primarily related to nonrecurring restructuring and acquisition integration
charges and nonrecurring items related to the spinoff. Additionally, in the case of adjusted
income from continuing operations and adjusted diluted earnings per share from continuing
operations, nonrecurring tax items are also excluded. |
 ©
2012 CareFusion Corporation or one of its subsidiaries. All rights reserved.
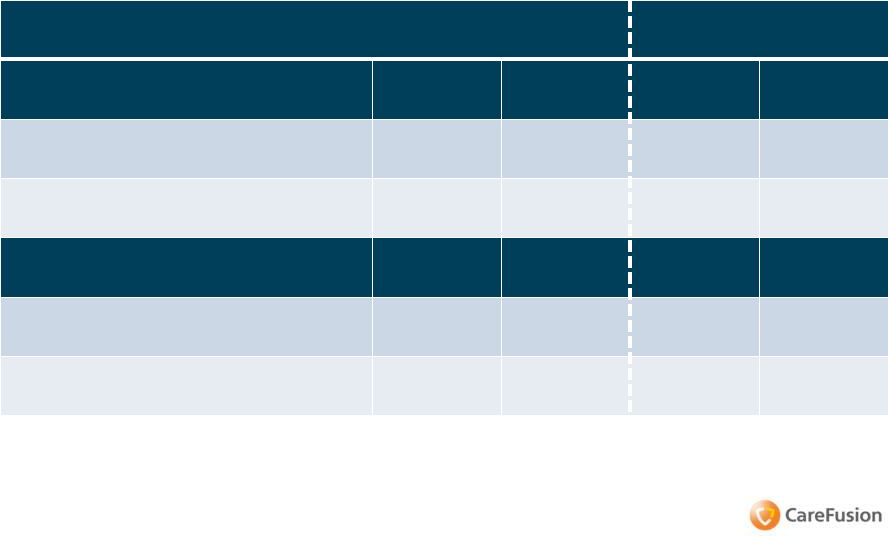
Q3 FY12 Year-Over-Year
Quarterly Segment Review
GAAP
Adjusted
Medical Systems
$M
% Change¹
$M
% Change¹
Revenues
$591
19%
$591
19%
Segment Profit²
$125
29%
$132
21%
Procedural Solutions
$M
% Change¹
$M
% Change¹
Revenues
$328
(5)%
$328
(5)%
Segment Profit²
$36
6%
$41
(11)%
7
1
% Change over prior year period.
2
Adjusted segment profit is a non-GAAP financial measure that excludes items
primarily related to nonrecurring restructuring and acquisition integration
charges
and
nonrecurring
items
relating
to
the
spinoff.
During
the
quarter
ended
March
31,
2011,
the
company
recognized
a
$15
million
gain
on
the
sale
of
assets related to the divestiture of its OnSite Services business, which was not
allocated to the segments and is not reflected in the above results. |
 ©
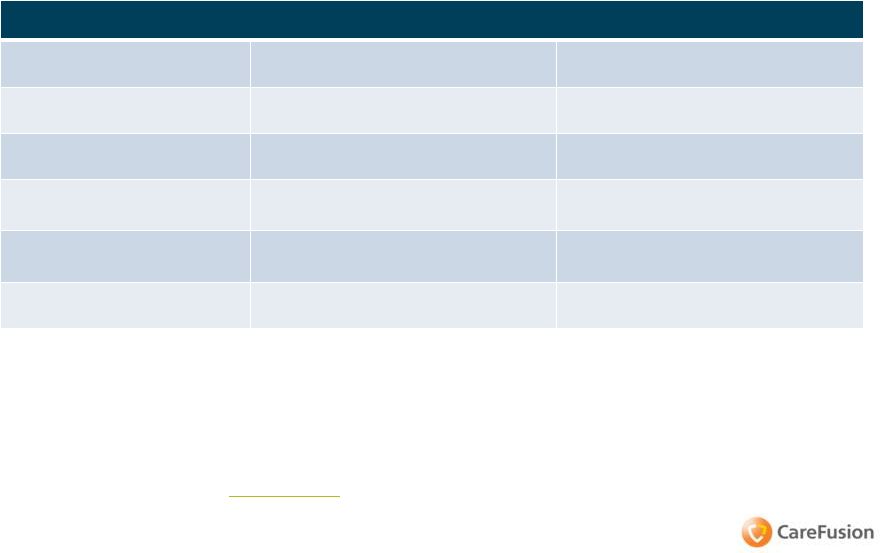
2012 CareFusion Corporation or one of its subsidiaries. All rights reserved.
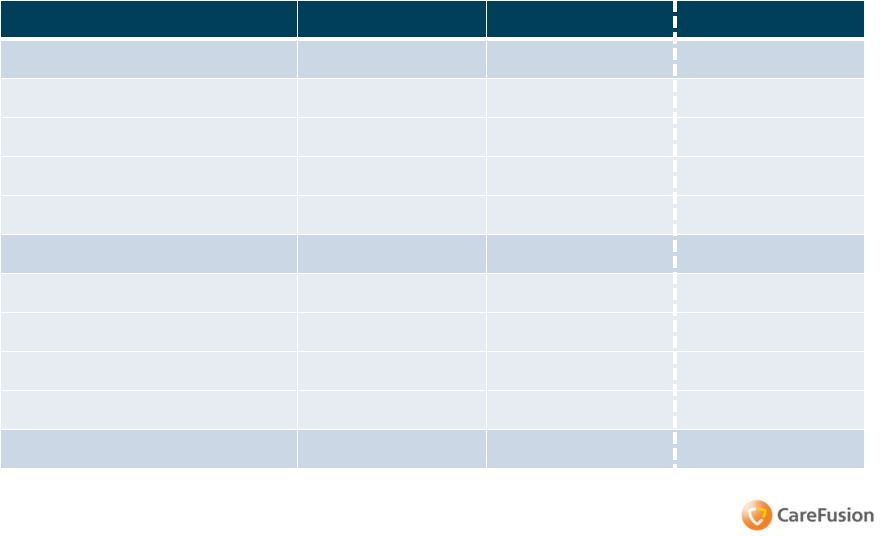
Q3 FY12 Year-Over-Year
Quarterly Sub-Segment Revenues
$ in millions
Q3 FY12
Q3 FY11
% Change
Medical Systems
$591
$498
19%
Dispensing Technologies
$261
$210
24%
Infusion Systems
$245
$213
15%
Respiratory Technologies
$78
$69
13%
Other
$7
$6
17%
Procedural Solutions
$328
$344
(5)%
Infection Prevention
$150
$144
4%
Medical Specialties
$80
$82
(2)%
Specialty Disposables
$70
$78
(10)%
Other
$28
$40
(30)%
Total CareFusion
$919
$842
9%
8 |
 ©
2012 CareFusion Corporation or one of its subsidiaries. All rights reserved.
9-Months FY12 Year-Over-Year
Review
GAAP
Adjusted
$M
% Change¹
$M
% Change¹
Revenue
$2,633
6%
$2,633
6%
Operating Expenses²
,
³
$910
(3)%
$880
4%
Operating Income³
$414
19%
$444
5%
Income From Continuing
Operations³
$266
34%
$288
13%
Diluted EPS From Continuing
Operations³
$1.17
33%
$1.27
11%
9
1
% Change over prior year period.
2
Operating
expenses
consist
of
selling,
general
and
administrative,
research
and
development,
and
restructuring
and
acquisition
integration
expenses.
3
Adjusted amounts are non-GAAP financial measures that exclude items primarily
related to nonrecurring restructuring and acquisition integration charges
and nonrecurring items related to the spinoff. Additionally,
in the case of adjusted income from continuing operations and adjusted diluted
earnings per share from continuing operations, nonrecurring tax items are
also excluded. |
 ©
2012 CareFusion Corporation or one of its subsidiaries. All rights reserved.
9-Months FY12 Year-Over-Year
Segment Review
GAAP
Adjusted
Medical Systems
$M
% Change¹
$M
% Change¹
Revenues
$1,672
12%
$1,672
12%
Segment Profit²
$334
28%
$352
14%
Procedural Solutions
$M
% Change¹
$M
% Change¹
Revenues
$961
(4)%
$961
(4)%
Segment Profit²
$80
10%
$92
(19)%
10
1
% Change over prior year period.
2
Adjusted segment profit is a non-GAAP financial measure that excludes items
primarily related to nonrecurring restructuring and acquisition integration
charges
and
nonrecurring
items
relating
to
the
spinoff.
During
the
quarter
ended
March
31,
2011,
the
company
recognized
a
$15
million
gain
on
the
sale
of
assets related to the divestiture of its OnSite Services business, which was not
allocated to the segments and is not reflected in the above results. |
 ©
2012 CareFusion Corporation or one of its subsidiaries. All rights reserved.
9-Months FY12 Year-Over-Year
Sub-Segment Revenues
$M
9-Mo. FY12
9-Mo. FY11
% Change
Medical Systems
$1,672
$1,489
12%
Dispensing Technologies
$756
$644
17%
Infusion Systems
$690
$628
10%
Respiratory Technologies
$207
$199
4%
Other
$19
$18
6%
Procedural Solutions
$961
$1,003
(4)%
Infection Prevention
$430
$421
2%
Medical Specialties
$237
$238
0%
Specialty Disposables
$201
$221
(9)%
Other
$93
$123
(24)%
Total CareFusion
$2,633
$2,492
6%
11 |
 ©
2012 CareFusion Corporation or one of its subsidiaries. All rights reserved.
Updated Fiscal 2012
Guidance |
 ©
2012 CareFusion Corporation or one of its subsidiaries. All rights reserved.
Updated FY12 Financial Guidance
May 3, 2012
Previous FY12 Outlook¹
Updated FY12 Outlook
2,3
Total Revenue
3-5% growth over FY11 revenue of $3.5B
on a constant currency basis
4-5% growth over FY11 revenue of $3.4B
on a constant currency basis
Adjusted
Operating
Margin
4
~17.1%
~17.3%
Adjusted
Effective
Tax
Rate
4
24 –
26%
24 –
26%
Adjusted Diluted EPS From
Continuing
Operations
4
$1.75 –
$1.85
$1.75 –
$1.80
Diluted Weighted Average Shares
Outstanding
5
~227M
~226M
Capital Expenditures
$130M -
$140M
~$100M
13
1
Provided by CareFusion on February 2, 2012, inclusive of the Nicolet
business. 2
Provided by CareFusion on May 3, 2012, exclusive of the Nicolet business.
3
The reclassification of the Nicolet business to discontinued operations reduces
outlook for total revenue by approximately $100M and outlook for adjusted diluted EPS
from continuing operations by approximately $0.02. All other impacts to outlook
resulting from the planned Nicolet divestiture are expected to be immaterial.
4
Adjusted amounts are non-GAAP financial measures that exclude items primarily
related to nonrecurring restructuring and acquisition integration charges and
nonrecurring items related to the spinoff. Additionally, in the case of adjusted
diluted earnings per share from continuing operations, nonrecurring tax items
are also excluded.
5
On February 10, 2012 CareFusion announced a $500M share repurchase program. Outlook
for diluted weighted average shares outstanding has been updated to reflect
the impact of expected repurchases during fiscal 2012.
Note: A full GAAP to non-GAAP reconciliation can be found in the company’s
Q3FY12 earnings release, which was furnished to the SEC on Form 8-K on May 3,
2012
and
is
posted
on
CareFusion’s
website
at
www.carefusion.com
under
the
Investors
tab.
The
Form
8-K
also
includes
a
discussion
of
the
reasons
why
management
believes
that
the
presentation
of
non-GAAP
financial
measures
provides
useful
information
to
investors
regarding
the
company’s
financial
condition and
results of operations. |
| ©
2012 CareFusion Corporation or one of its subsidiaries. All rights reserved.
FY12 Revenue and Adjusted EPS
Guidance and Assumptions
•
Guidance
O
Revenue growth of 4 to 5 percent over FY11 revenues of
$3.4B on a constant currency basis
O
Adjusted diluted EPS of $1.75 to $1.80
•
Assumptions
O
CareFusion markets grow low single digits; expect to do
better based on differentiation we have in certain segments
of the market
O
Excludes results of Nicolet business due to classification as
discontinued operations and anticipated sale; previous
guidance assumed Nicolet contributed approximately $100
million of revenue and approximately $0.02 in adjusted
diluted EPS from continuing operations in FY12
14 |
| ©
2012 CareFusion Corporation or one of its subsidiaries. All rights reserved.
FY12 Medical Systems Segment-
Related Assumptions vs. FY11 Results
•
Revenue grows on a percentage basis by high
single digits
O
Dispensing Technologies:
Revenue grows on a
percentage basis by low to mid teens
•
Assumes contributions from Rowa for approximately 11 months
of the year
O
Infusion
Systems:
Revenue
grows
on
a
percentage
basis
by mid single digits
•
Discounted infusion pump installations impact margins through
Q4
•
Q4 FY12 margins benefit as dedicated disposable revenue
increases
O
Respiratory Technologies:
Revenue grows on a
percentage basis by high single digits
15 |
| ©
2012 CareFusion Corporation or one of its subsidiaries. All rights reserved.
FY12 Procedural Solutions Segment-
Related Assumptions vs. FY11 Results
•
Revenue on a percentage basis declines low
single digits
O
Infection
Prevention:
Revenue
grows
on
a
percentage
basis by low to mid single digits
O
Medical
Specialties:
Revenue
is
flat
O
Specialty Disposables:
Revenue on a percentage basis
declines high single digits
O
OnSite Services Divestiture:
Negatively impacts
Procedural Solutions revenue by $32 million
16 |
 ©
2012 CareFusion Corporation or one of its subsidiaries. All rights reserved.
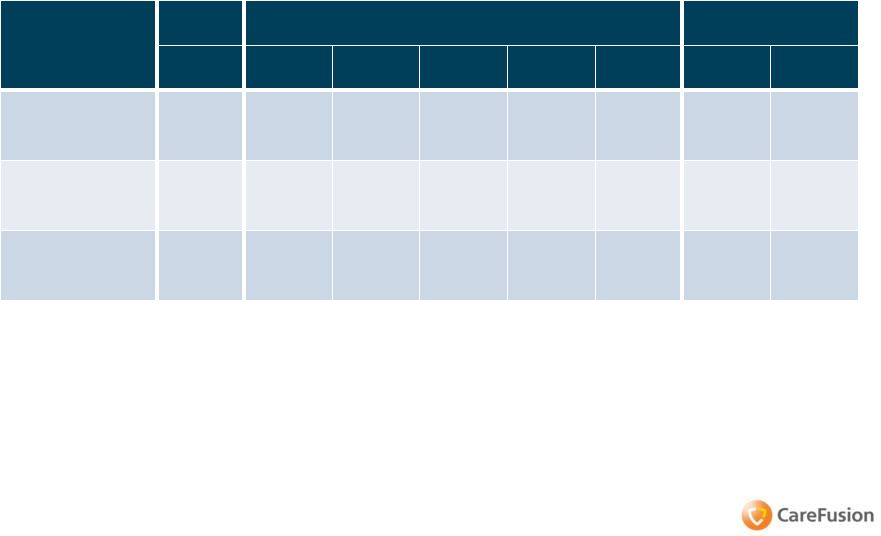
Historical Continuing Operations
Financial
Highlights
1
17
GAAP
$M
FY 2010
FY 2011
FY 2012
FY10
Q1 FY11
Q2 FY11
Q3 FY11
Q4 FY11
FY11
Q1 FY12
Q2 FY12
Revenue
$3,376
$790
$860
$842
$940
$3,432
$824
$890
Gross Margin
50.1%
51.0%
50.3%
51.9%
51.9%
51.3%
50.8%
50.1%
Operating Income
$450
$80
$122
$146
$149
$497
$111
$142
1
Reflects the impact of the reclassification to discontinued operations of the
Nicolet business, ISP business and Audiology business for all periods presented. |
 ©
2012 CareFusion Corporation or one of its subsidiaries. All rights reserved.
Q&A |
 ©
2012 CareFusion Corporation or one of its subsidiaries. All rights reserved.
Q3 FY12 Non-GAAP Reconciliations
$M
Q3 FY12
GAAP
Nonrecurring
Items¹
Q3 FY12
Adjusted¹
Operating Expenses
$298
$(12)
$286
Operating Income
$161
$12
$173
Income From Continuing Operations
$103
$9
$112
Diluted EPS From Continuing
Operations²
$0.45
$0.04
$0.49
Medical Systems Segment Profit
$125
$7
$132
Procedural Solutions Segment Profit
$36
$5
$41
19
1
The nonrecurring items in the table above include items primarily related to
restructuring and acquisition integration charges and items related to the spinoff.
Additionally, in the case of income from continuing operations and diluted earnings
per share from continuing operations, nonrecurring items also include tax
items.
2
Diluted
earnings
per
share
calculations
are
performed
separately
for
each
component
presented.
Therefore,
the
sum
of
the
per
share
components
from
the
table may not equal the per share amounts presented.
Note: A full GAAP to non-GAAP reconciliation can be found in the company’s
Q3FY12 earnings release, which was furnished to the SEC on Form 8-K on May 3,
2012
and
is
posted
on
CareFusion’s
website
at
www.carefusion.com
under
the
Investors
tab.
The
Form
8-K
also
includes
a
discussion
of
the
reasons
why
management
believes
that
the
presentation
of
non-GAAP
financial
measures
provides
useful
information
to
investors
regarding
the
company’s
financial
condition
and results of operations. |
 ©
2012 CareFusion Corporation or one of its subsidiaries. All rights reserved.
9-Months FY12 Non-GAAP
Reconciliations
$M
9-Mo. FY12
GAAP
Nonrecurring
Items¹
9-Mo. FY12
Adjusted¹
Operating Expenses
$910
$(30)
$880
Operating Income
$414
$30
$444
Income From Continuing Operations
$266
$22
$288
Diluted EPS From Continuing
Operations²
$1.17
$0.10
$1.27
Medical Systems Segment Profit
$334
$18
$352
Procedural Solutions Segment Profit
$80
$12
$92
20
1
The nonrecurring items in the table above include items primarily related to
restructuring and acquisition integration charges and items related to the spinoff.
Additionally, in the case of income from continuing operations and diluted earnings
per share from continuing operations, nonrecurring items also include tax
items.
2
Diluted
earnings
per
share
calculations
are
performed
separately
for
each
component
presented.
Therefore,
the
sum
of
the
per
share
components
from
the
table may not equal the per share amounts presented.
Note: A full GAAP to non-GAAP reconciliation can be found in the company’s
Q3FY12 earnings release, which was furnished to the SEC on Form 8-K on May 3,
2012
and
is
posted
on
CareFusion’s
website
at
www.carefusion.com
under
the
Investors
tab.
The
Form
8-K
also
includes
a
discussion
of
the
reasons
why
management
believes
that
the
presentation
of
non-GAAP
financial
measures
provides
useful
information
to
investors
regarding
the
company’s
financial
condition
and results of operations. |