Attached files
| file | filename |
|---|---|
| 8-K - 8-K - ACNB CORP | a12-10869_18k.htm |
| EX-99.2 - EX-99.2 - ACNB CORP | a12-10869_1ex99d2.htm |
Exhibit 99.1
|
|
Annual Meeting of Shareholders May 1, 2012 |
|
|
Special Cautionary Notice Regarding Forward-Looking Statements During the course of this presentation, there may be projections and forward-looking statements regarding events or the future financial performance of ACNB Corporation. We wish to caution you that these forward-looking statements involve certain risks and uncertainties, including a variety of factors that may cause actual results to differ materially from the anticipated results expressed in these forward-looking statements. ACNB Corporation assumes no duty to update the forward-looking statements made in this presentation. |
|
|
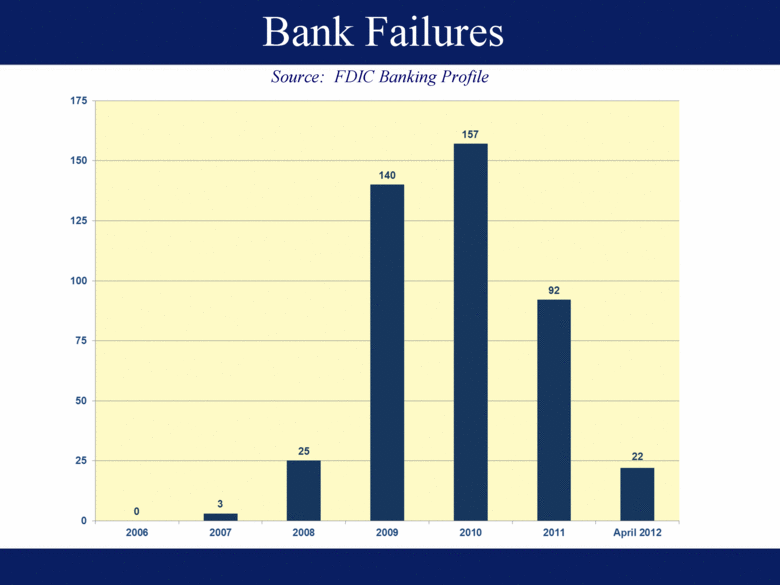
Bank Failures Source: FDIC Banking Profile |
|
|
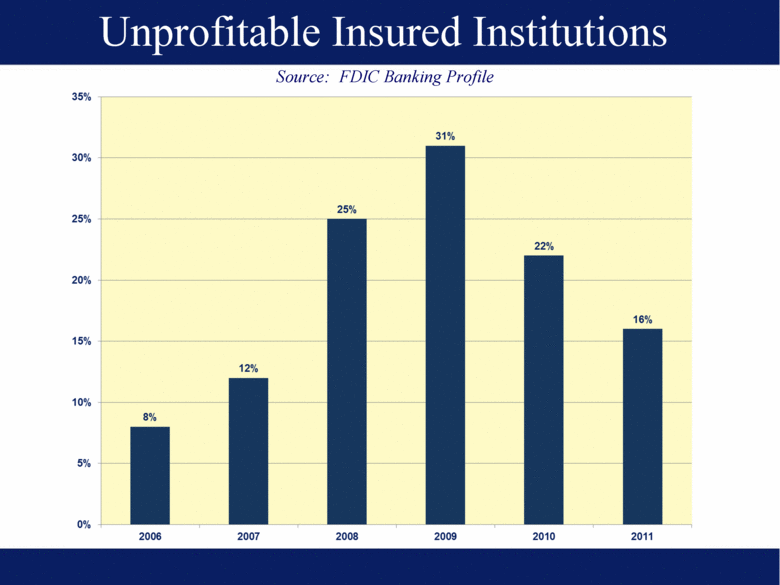
Unprofitable Insured Institutions Source: FDIC Banking Profile |
|
|
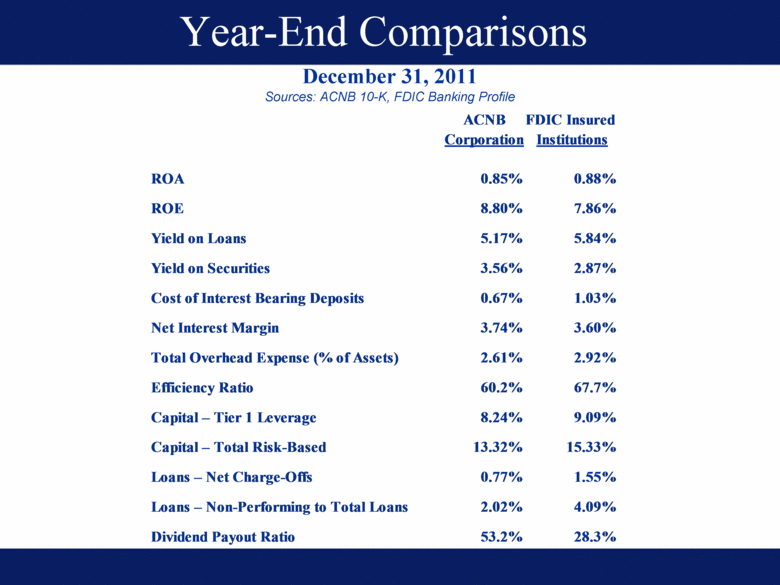
Year-End Comparisons December 31, 2011 Sources: ACNB 10-K, FDIC Banking Profile ACNB FDIC Insured Corporation Institutions ROA 0.85% 0.88% ROE 8.80% 7.86% Yield on Loans 5.17% 5.84% Yield on Securities 3.56% 2.87% Cost of Interest Bearing Deposits 0.67% 1.03% Net Interest Margin 3.74% 3.60% Total Overhead Expense (% of Assets) 2.61% 2.92% Efficiency Ratio 60.2% 67.7% Capital – Tier 1 Leverage 8.24% 9.09% Capital – Total Risk-Based 13.32% 15.33% Loans – Net Charge-Offs 0.77% 1.55% Loans – Non-Performing to Total Loans 2.02% 4.09% Dividend Payout Ratio 53.2% 28.3% |
|
|
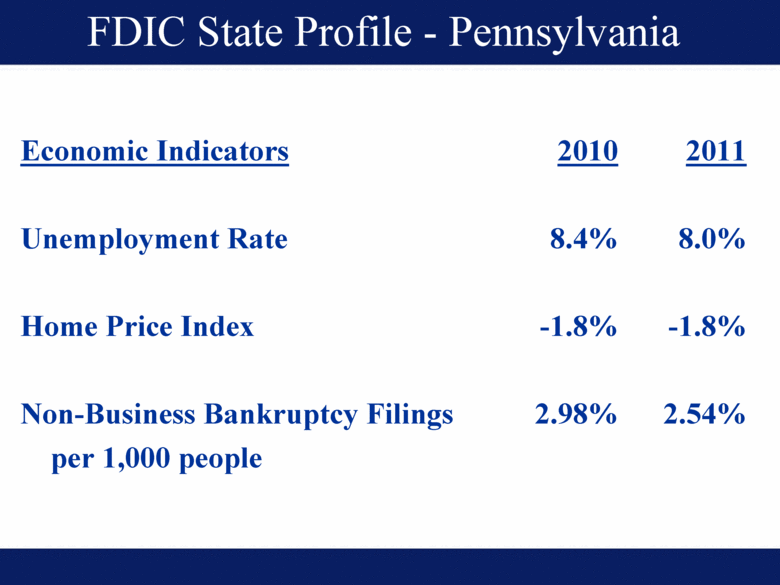
FDIC State Profile - Pennsylvania Economic Indicators 2010 2011 Unemployment Rate 8.4% 8.0% Home Price Index -1.8% -1.8% Non-Business Bankruptcy Filings 2.98% 2.54% per 1,000 people |
|
|
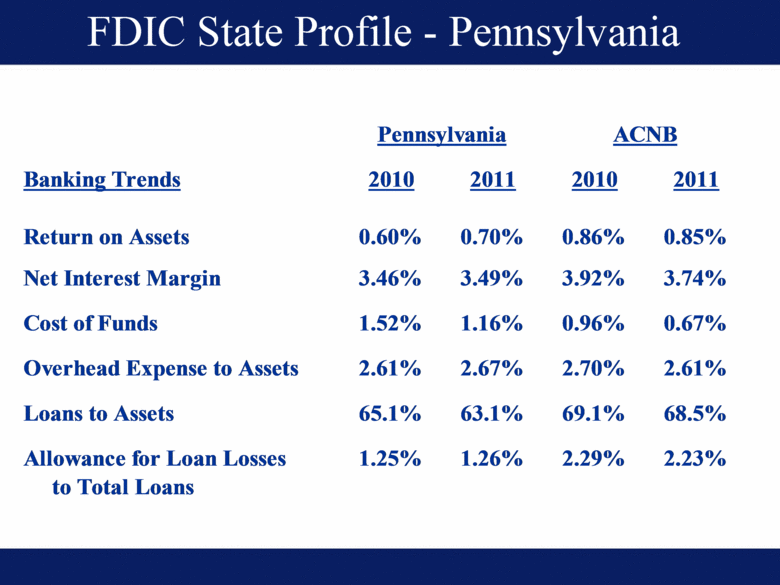
FDIC State Profile - Pennsylvania Banking Trends 2010 2011 2010 2011 Return on Assets 0.60% 0.70% 0.86% 0.85% Net Interest Margin 3.46% 3.49% 3.92% 3.74% Cost of Funds 1.52% 1.16% 0.96% 0.67% Overhead Expense to Assets 2.61% 2.67% 2.70% 2.61% Loans to Assets 65.1% 63.1% 69.1% 68.5% Allowance for Loan Losses 1.25% 1.26% 2.29% 2.23% to Total Loans Pennsylvania ACNB |
|
|
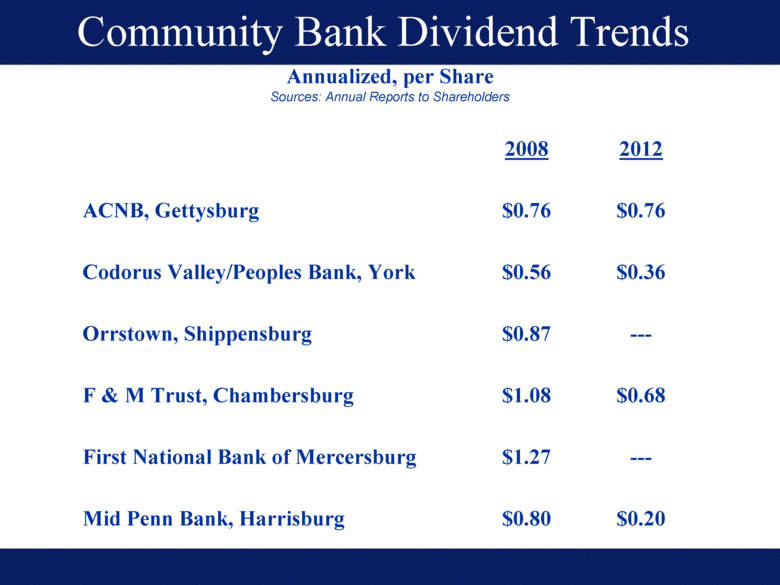
Community Bank Dividend Trends Annualized, per Share Sources: Annual Reports to Shareholders 2008 2012 ACNB, Gettysburg $0.76 $0.76 Codorus Valley/Peoples Bank, York $0.56 $0.36 Orrstown, Shippensburg $0.87 --- F & M Trust, Chambersburg $1.08 $0.68 First National Bank of Mercersburg $1.27 --- Mid Penn Bank, Harrisburg $0.80 $0.20 |
|
|
David W. Cathell EVP, Treasurer & Chief Financial Officer |
|
|
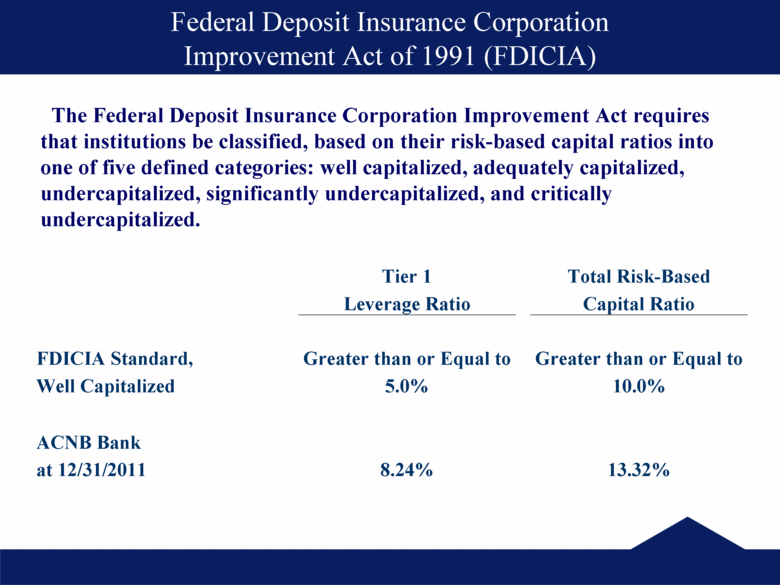
Federal Deposit Insurance Corporation Improvement Act of 1991 (FDICIA) The Federal Deposit Insurance Corporation Improvement Act requires that institutions be classified, based on their risk-based capital ratios into one of five defined categories: well capitalized, adequately capitalized, undercapitalized, significantly undercapitalized, and critically undercapitalized. Tier 1 Total Risk-Based Leverage Ratio Capital Ratio FDICIA Standard, Greater than or Equal to Greater than or Equal to Well Capitalized 5.0% 10.0% ACNB Bank at 12/31/2011 8.24% 13.32% |
|
|
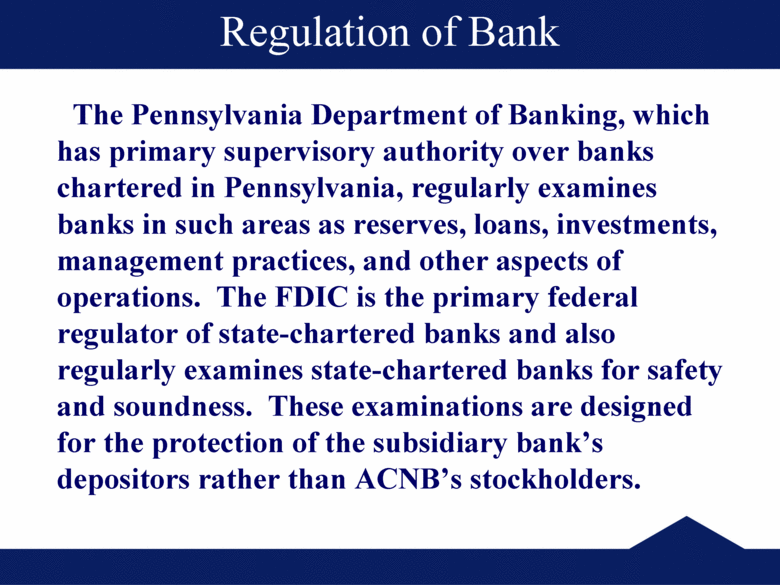
Regulation of Bank The Pennsylvania Department of Banking, which has primary supervisory authority over banks chartered in Pennsylvania, regularly examines banks in such areas as reserves, loans, investments, management practices, and other aspects of operations. The FDIC is the primary federal regulator of state-chartered banks and also regularly examines state-chartered banks for safety and soundness. These examinations are designed for the protection of the subsidiary bank’s depositors rather than ACNB’s stockholders. |
|
|
In our opinion, the consolidated financial statements present fairly, in all material respects, the financial position of ACNB Corporation and Subsidiaries as of December 31, 2011 and 2010, and the results of their operations and their cash flows for each of the years in the three-year period ended December 31, 2011, in conformity with accounting principles generally accepted in the United States of America. ParenteBeard LLC Report on Financial Statements Report of Independent Auditors |
|
|
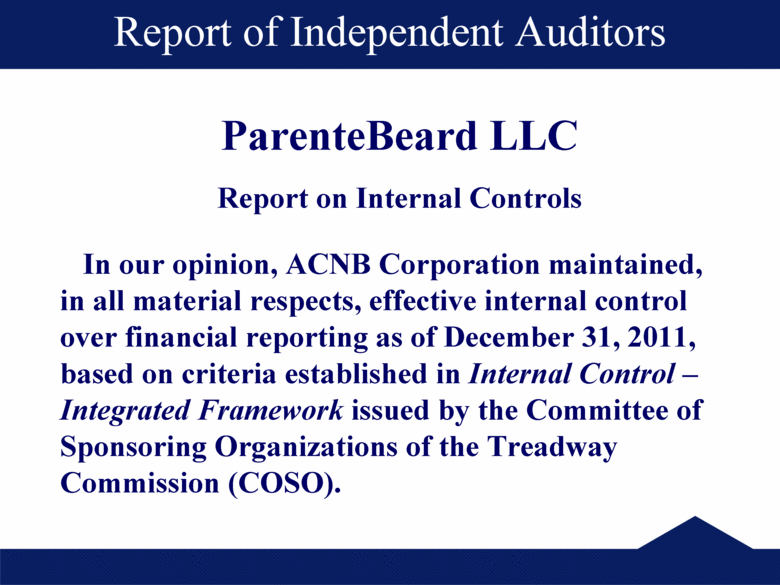
ParenteBeard LLC Report on Internal Controls Report of Independent Auditors In our opinion, ACNB Corporation maintained, in all material respects, effective internal control over financial reporting as of December 31, 2011, based on criteria established in Internal Control – Integrated Framework issued by the Committee of Sponsoring Organizations of the Treadway Commission (COSO). |
|
|
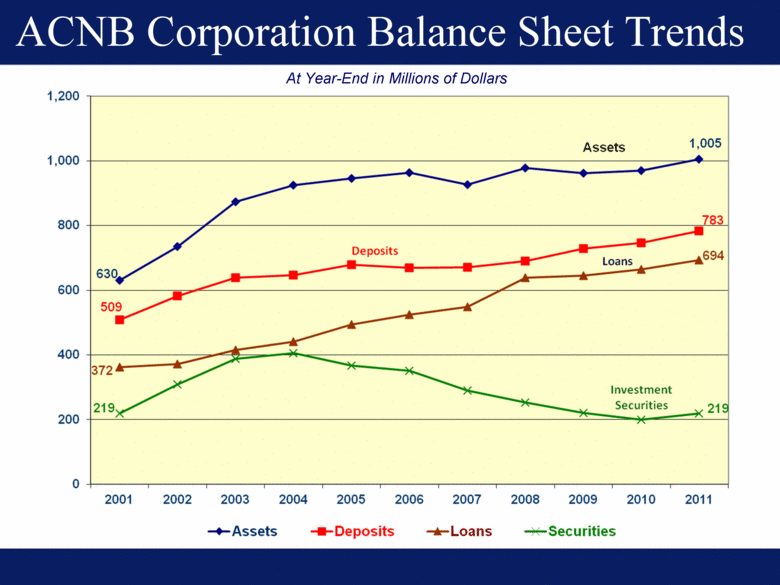
ACNB Corporation Balance Sheet Trends At Year-End in Millions of Dollars |
|
|
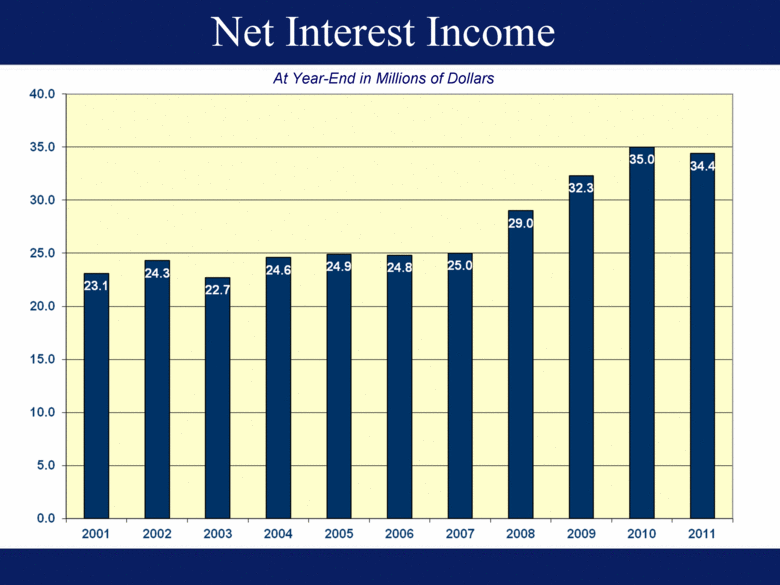
Net Interest Income At Year-End in Millions of Dollars |
|
|
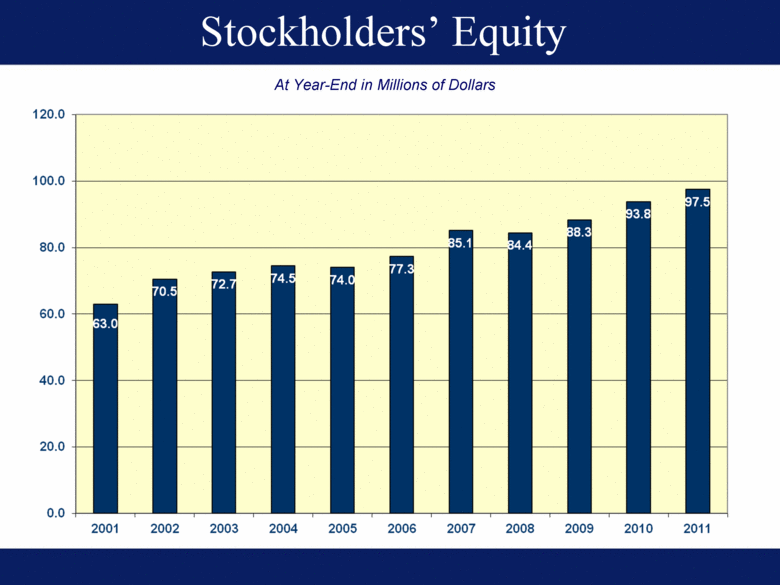
Stockholders’ Equity At Year-End in Millions of Dollars |
|
|
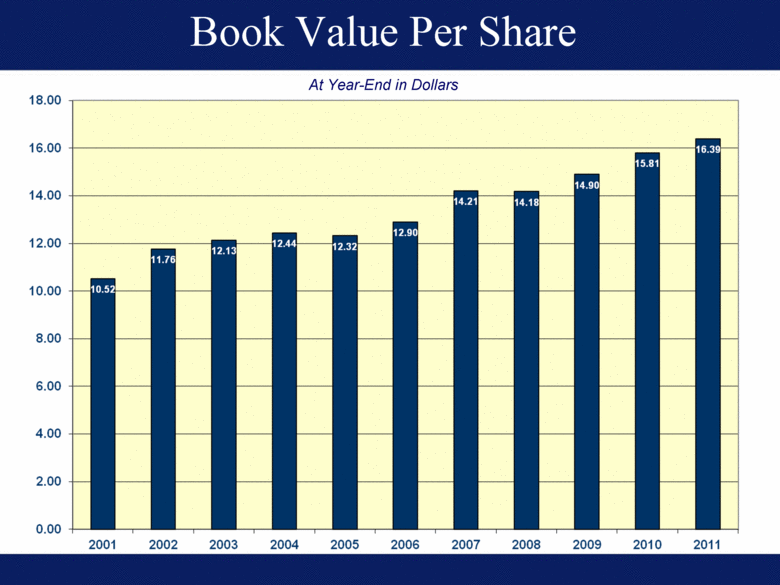
Book Value Per Share At Year-End in Dollars |
|
|
James P. Helt EVP/Banking Services |
|
|
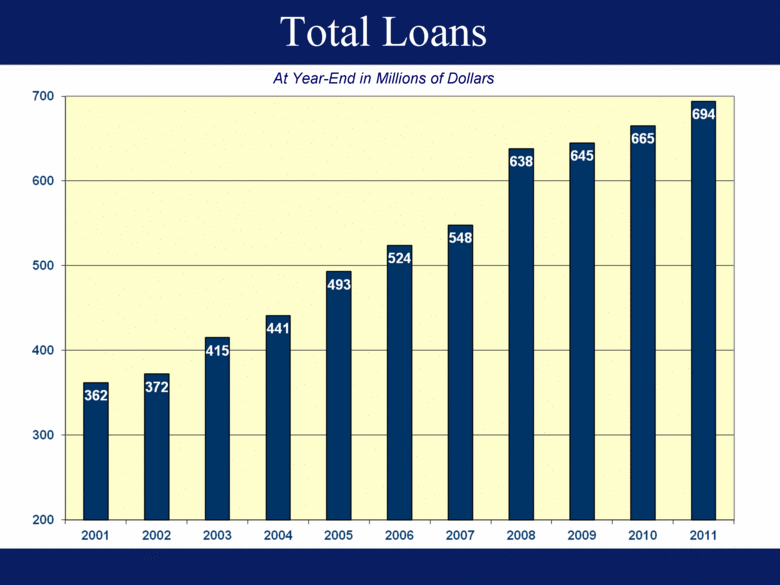
Total Loans At Year-End in Millions of Dollars |
|
|
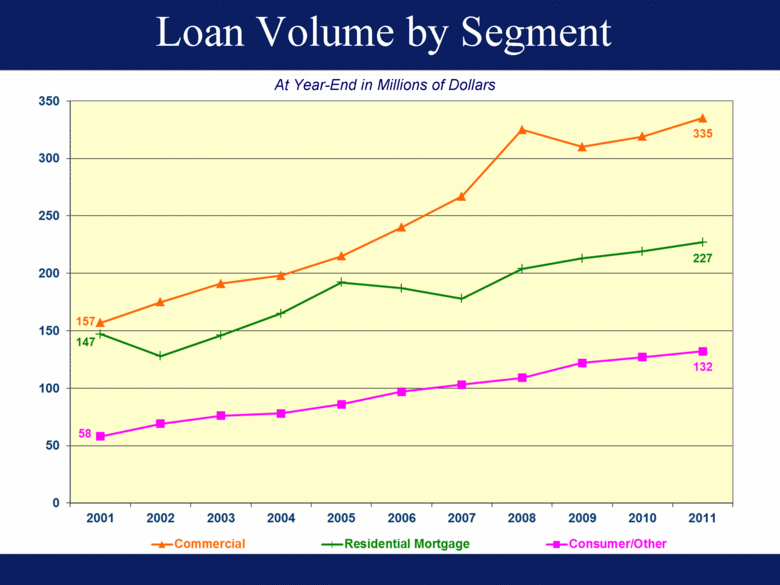
Loan Volume by Segment At Year-End in Millions of Dollars |
|
|
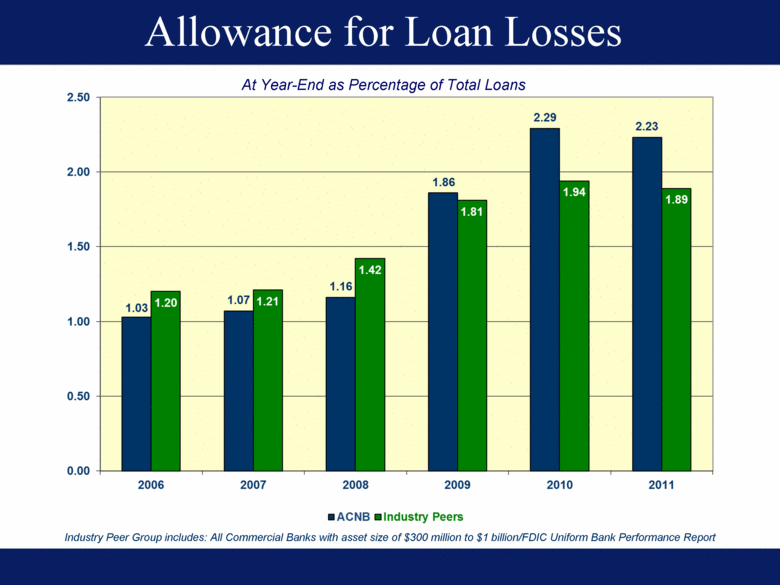
Allowance for Loan Losses At Year-End as Percentage of Total Loans Industry Peer Group includes: All Commercial Banks with asset size of $300 million to $1 billion/FDIC Uniform Bank Performance Report |
|
|
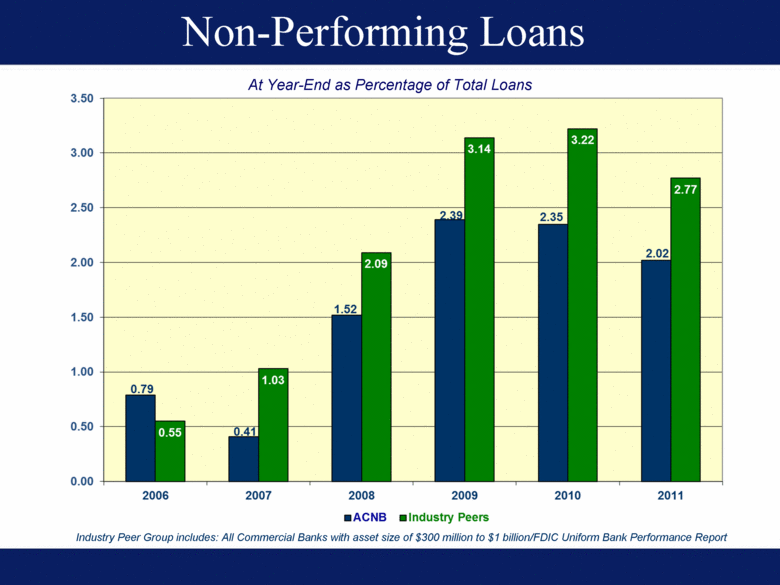
Non-Performing Loans At Year-End as Percentage of Total Loans Industry Peer Group includes: All Commercial Banks with asset size of $300 million to $1 billion/FDIC Uniform Bank Performance Report |
|
|
Other Real Estate Owned At Period-End in Thousands of Dollars |
|
|
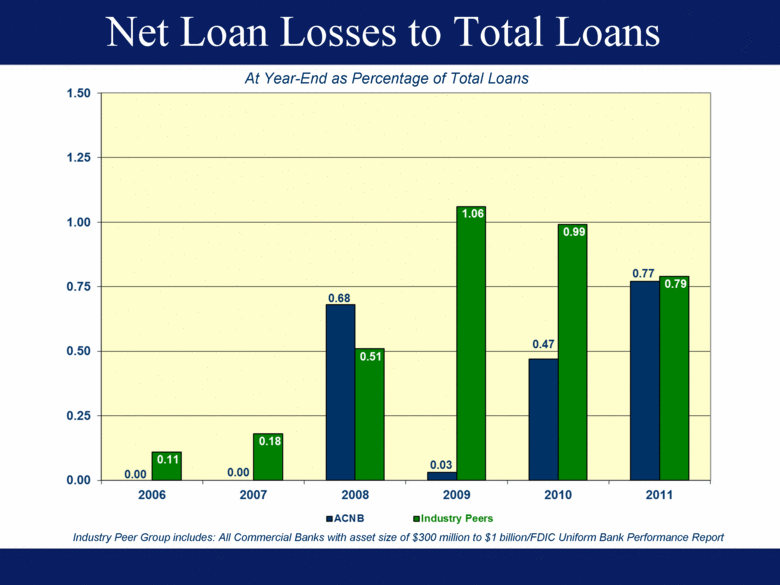
Net Loan Losses to Total Loans Industry Peer Group includes: All Commercial Banks with asset size of $300 million to $1 billion/FDIC Uniform Bank Performance Report At Year-End as Percentage of Total Loans |
|
|
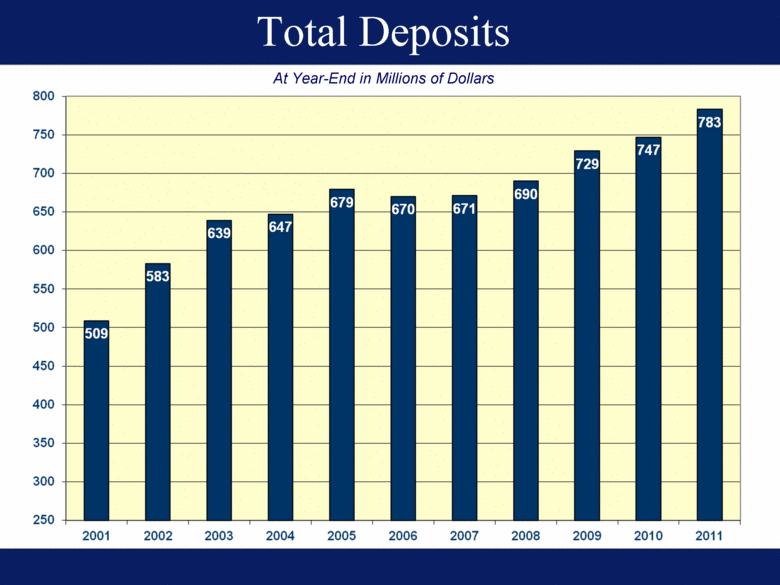
Total Deposits At Year-End in Millions of Dollars |
|
|
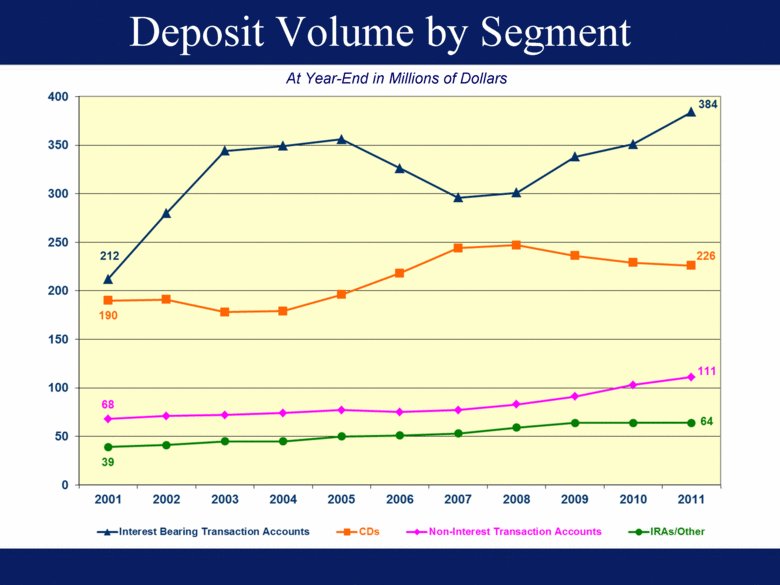
Deposit Volume by Segment At Year-End in Millions of Dollars |
|
|
Spring Grove Office |
|
|
Lynda L. Glass EVP, Secretary & Chief Governance Officer |
|
|
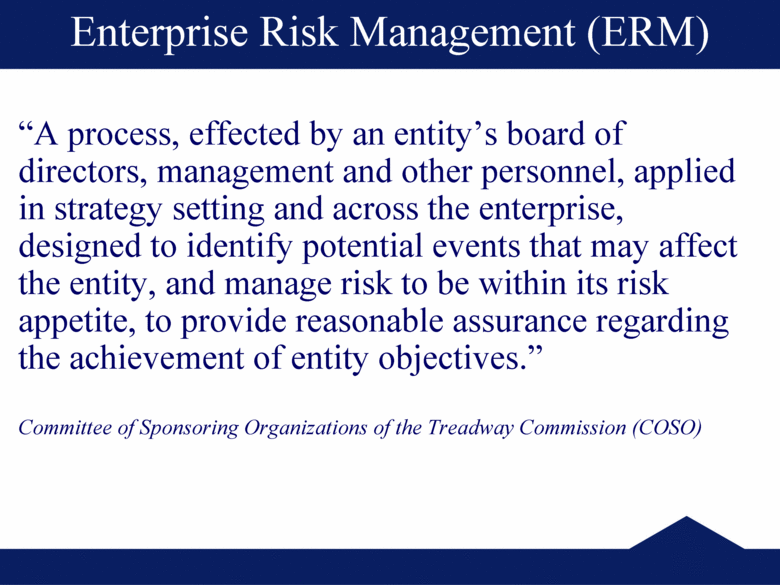
Enterprise Risk Management (ERM) “A process, effected by an entity’s board of directors, management and other personnel, applied in strategy setting and across the enterprise, designed to identify potential events that may affect the entity, and manage risk to be within its risk appetite, to provide reasonable assurance regarding the achievement of entity objectives.” Committee of Sponsoring Organizations of the Treadway Commission (COSO) |
|
|
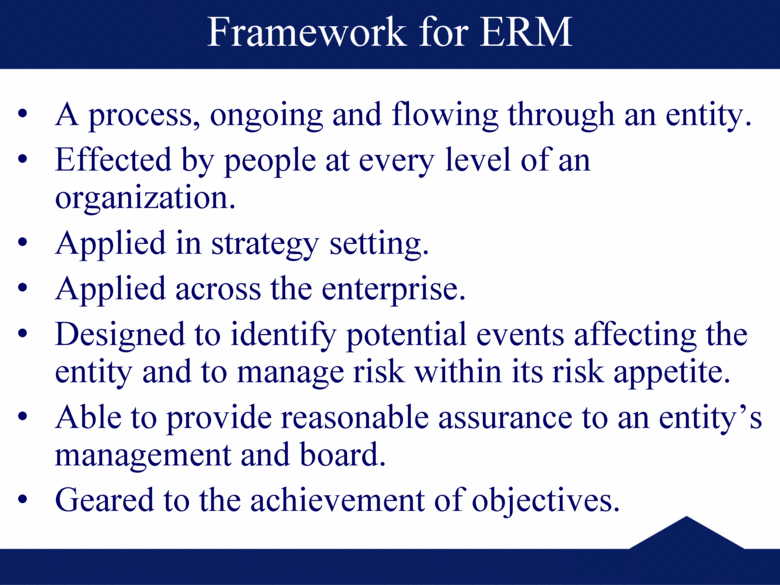
Framework for ERM A process, ongoing and flowing through an entity. Effected by people at every level of an organization. Applied in strategy setting. Applied across the enterprise. Designed to identify potential events affecting the entity and to manage risk within its risk appetite. Able to provide reasonable assurance to an entity’s management and board. Geared to the achievement of objectives. |
|
|
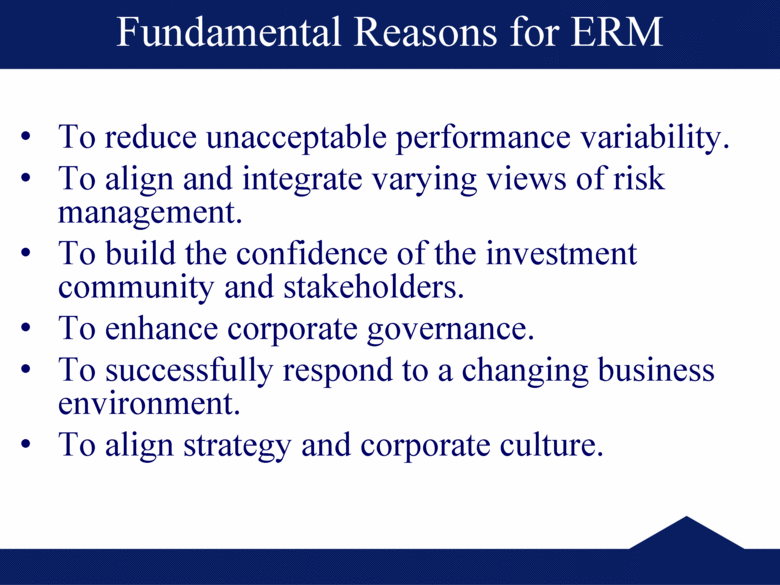
Fundamental Reasons for ERM To reduce unacceptable performance variability. To align and integrate varying views of risk management. To build the confidence of the investment community and stakeholders. To enhance corporate governance. To successfully respond to a changing business environment. To align strategy and corporate culture. |
|
|
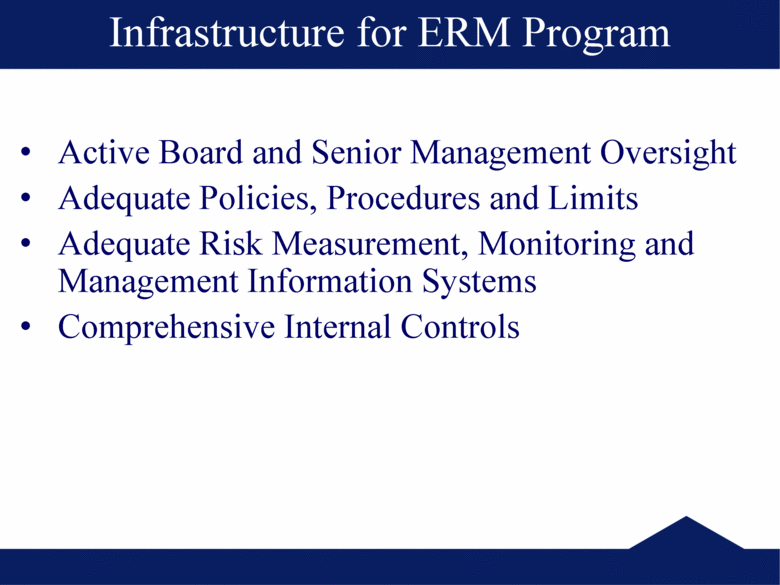
Infrastructure for ERM Program Active Board and Senior Management Oversight Adequate Policies, Procedures and Limits Adequate Risk Measurement, Monitoring and Management Information Systems Comprehensive Internal Controls |
|
|
Bank Risk Management Taking and managing risks are fundamental to the business of banking. Generally, risk is the potential that events---planned or unanticipated---may have an adverse impact on bank capital and earnings. A bank director’s major responsibility regarding risk is to provide a management structure that adequately identifies, measures, controls and monitors risk in a cost effective manner to achieve strategic business objectives and profitability. |
|
|
Categories of Risk Identification Credit Risk Interest Rate and Market Risk Liquidity Risk Transaction and Operational Risk Legal and Compliance Risk Strategic Risk Reputation Risk |
|
|
Credit Risk Risk to earnings and capital arising from an obligor’s failure to meet the terms of any contract with the Bank, or otherwise fail to perform as agreed. Any time Bank funds are extended, committed, invested, or otherwise exposed through contractual agreements with performance dependent upon counterparties, issuers or borrowers. |
|
|
Interest Rate and Market Risk Risk to the Bank’s condition resulting from adverse movements in market rates or prices, such as interest rates, foreign exchange rates, and equity prices. Focuses on economic scenarios relative to current values versus the sensitivity of those values to changes in interest rates or market prices. |
|
|
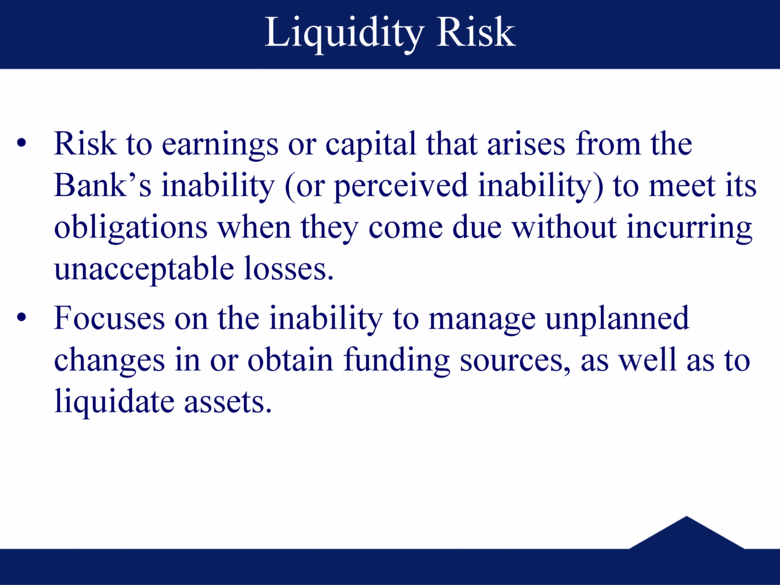
Liquidity Risk Risk to earnings or capital that arises from the Bank’s inability (or perceived inability) to meet its obligations when they come due without incurring unacceptable losses. Focuses on the inability to manage unplanned changes in or obtain funding sources, as well as to liquidate assets. |
|
|
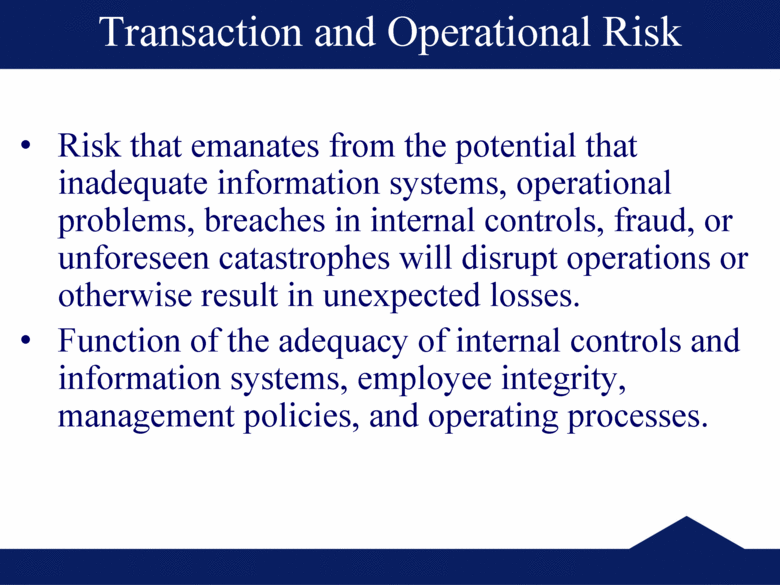
Transaction and Operational Risk Risk that emanates from the potential that inadequate information systems, operational problems, breaches in internal controls, fraud, or unforeseen catastrophes will disrupt operations or otherwise result in unexpected losses. Function of the adequacy of internal controls and information systems, employee integrity, management policies, and operating processes. |
|
|
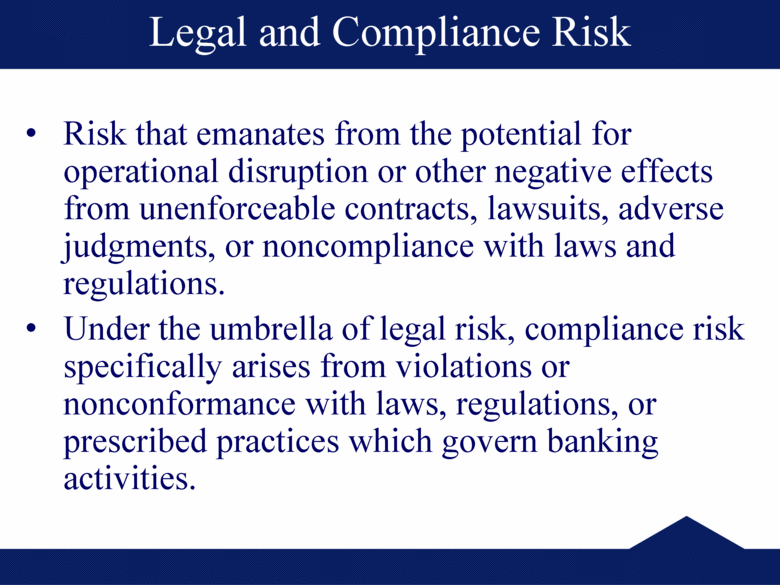
Legal and Compliance Risk Risk that emanates from the potential for operational disruption or other negative effects from unenforceable contracts, lawsuits, adverse judgments, or noncompliance with laws and regulations. Under the umbrella of legal risk, compliance risk specifically arises from violations or nonconformance with laws, regulations, or prescribed practices which govern banking activities. |
|
|
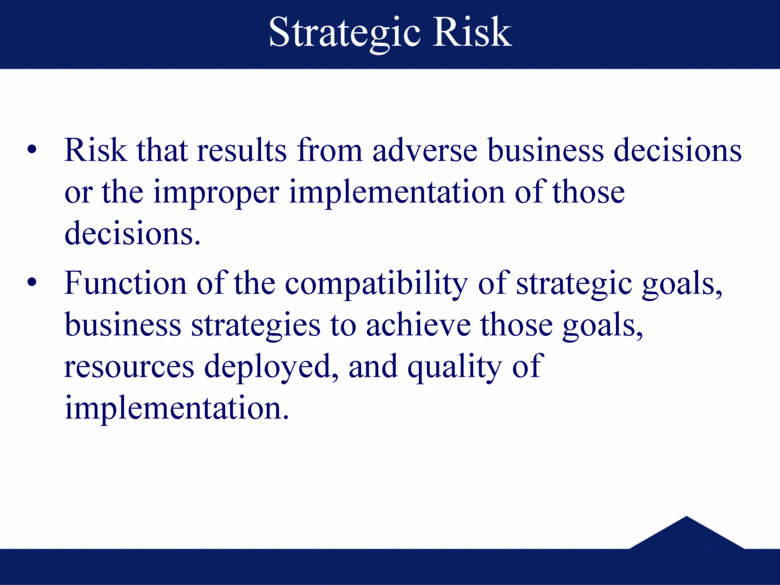
Strategic Risk Risk that results from adverse business decisions or the improper implementation of those decisions. Function of the compatibility of strategic goals, business strategies to achieve those goals, resources deployed, and quality of implementation. |
|
|
Reputation Risk Risk related to the potential for negative publicity, whether true or not, from the Bank’s business practices such as to cause a decline in the customer base, costly litigation, or revenue reductions. Risk exposure driven primarily by the Bank’s actions to manage other risk factors such as those related to credit, liquidity, interest rates, compliance, operations, and/or strategy. |
|
|
Key ERM Principles Is an evolving and ongoing management process. Involves risk identification, assessment, measurement, control and monitoring. Is not intended to eliminate risk, but to mitigate risk. Provides a business model for evaluating opportunities and challenges and for achieving strategic objectives. Results in an integrated and unified approach for balancing risk and reward in decision making. |
|
|
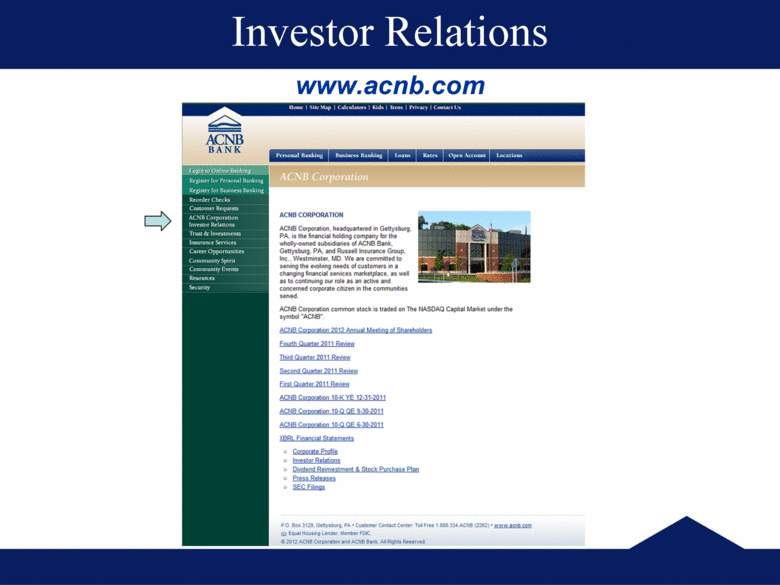
www.acnb.com Investor Relations |
|
|
Karen B. Arthur FVP & Senior Trust Officer |
|
|
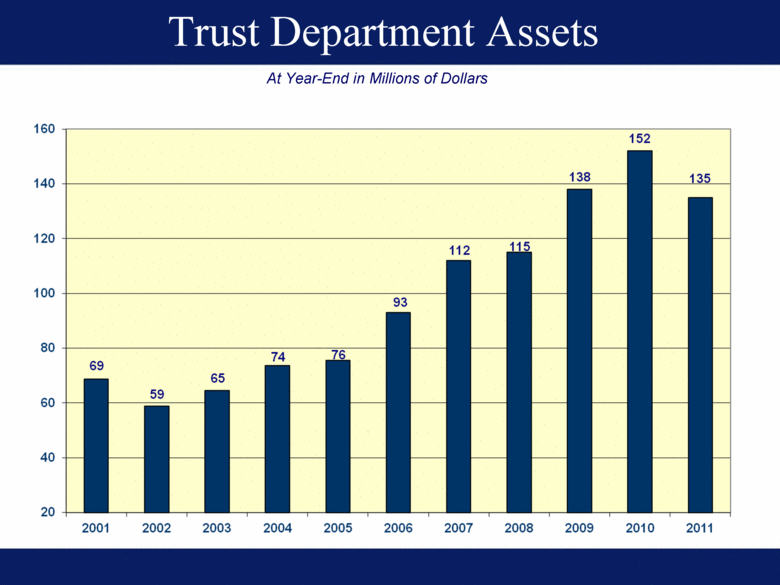
Trust Department Assets At Year-End in Millions of Dollars |
|
|
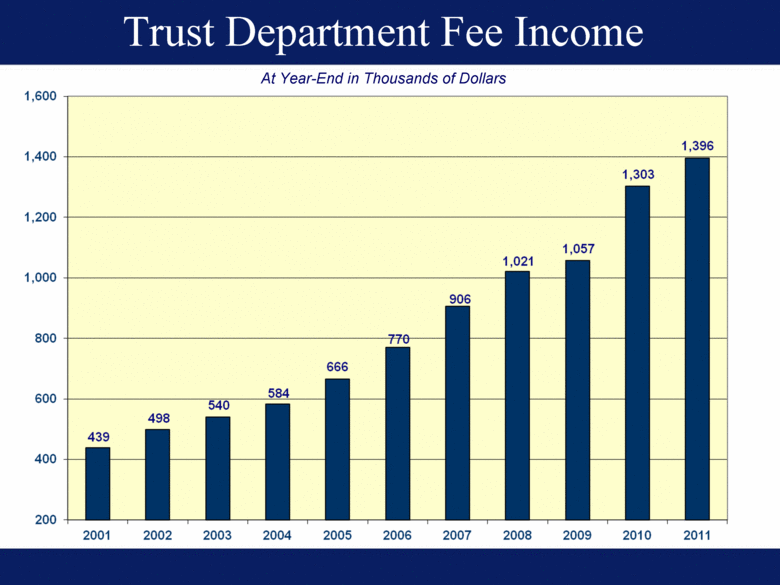
Trust Department Fee Income At Year-End in Thousands of Dollars |
|
|
Frank C. Russell, Jr. President & CEO |
|
|
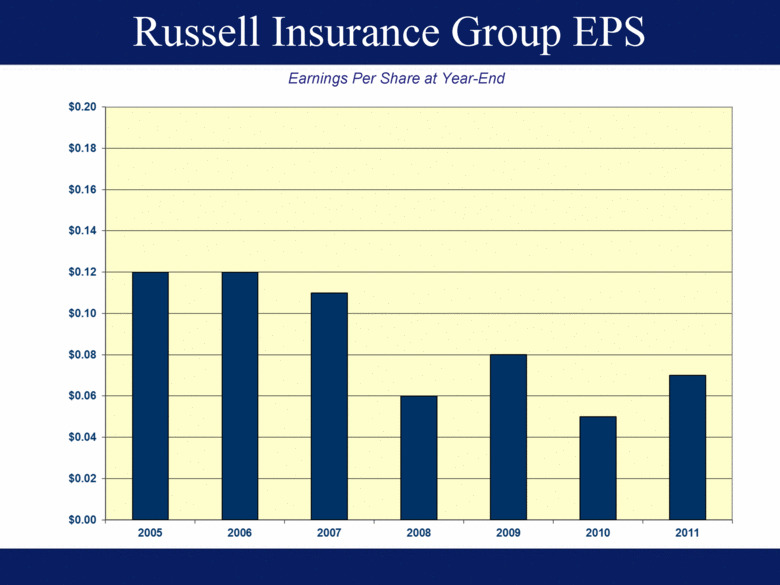
Russell Insurance Group EPS Earnings Per Share at Year-End |
|
|
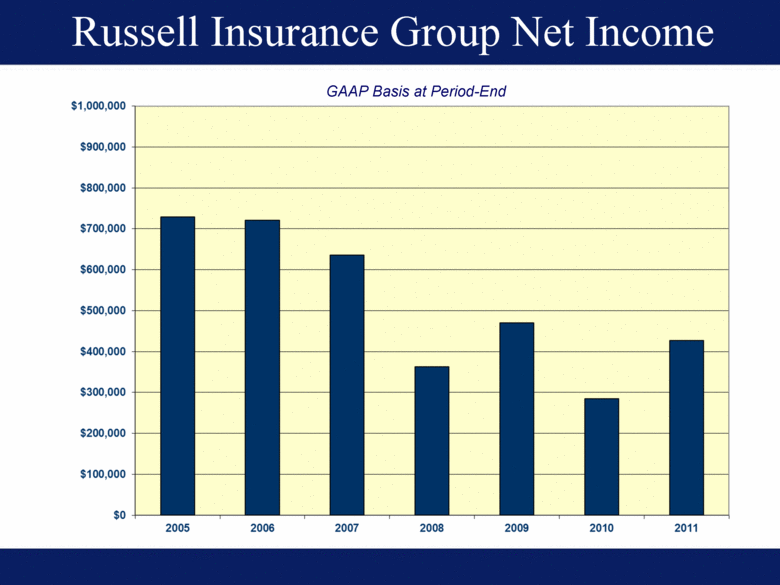
Russell Insurance Group Net Income GAAP Basis at Period-End |
|
|
[LOGO] |

