Attached files
| file | filename |
|---|---|
| 8-K - MSCI INC. 8-K - MSCI Inc. | a50261564.htm |
| EX-99.1 - EXHIBIT 99.1 - MSCI Inc. | a50261564ex99-1.htm |
Exhibit 99.2

First Quarter 2012 Earnings Presentation May 2, 2012

Forward-Looking Statements – Safe Harbor Statement This presentation may contain forward-looking statements within the meaning of the Private Securities Litigation Reform Act of 1995. You should not place undue reliance on forward-looking statements because they involve known and unknown risks, uncertainties and other factors that are, in some cases, beyond our control and that could materially affect actual results, levels of activity, performance, or achievements. For a discussion of risk and uncertainties that could materially affect actual results, levels of activity, performance or achievements, please see the Company’s Annual Report on Form 10-K for the fiscal year ended December 31, 2011 and its other reports filed with the SEC. The forward-looking statements included in this presentation represent the Company’s view as of the date of the presentation. The Company assumes no obligation to publicly update or revise these forward-looking statements for any reason, whether as a result of new information, future events, or otherwise.
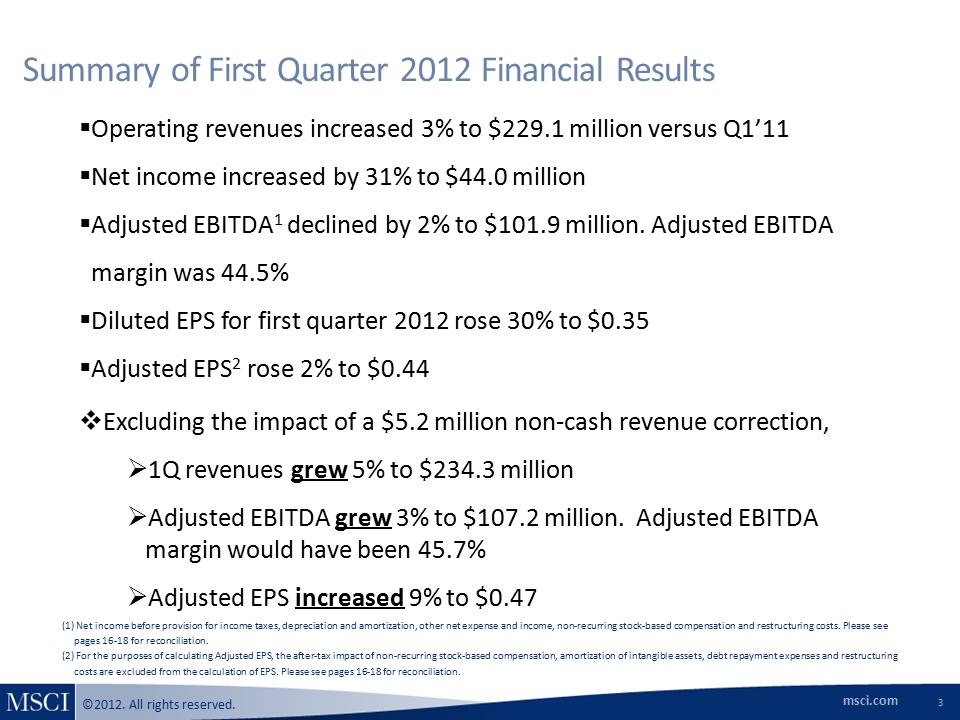
Summary of First Quarter 2012 Financial Results Operating revenues increased 3% to $229.1 million versus Q1’11 Net income increased by 31% to $44.0 millionAdjusted EBITDA1 declined by 2% to $101.9 million. Adjusted EBITDA margin was 44.5% Diluted EPS for first quarter 2012 rose 30% to $0.35Adjusted EPS2 rose 2% to $0.44Excluding the impact of a $5.2 million non-cash revenue correction,1Q revenues grew 5% to $234.3 millionAdjusted EBITDA grew 3% to $107.2 million. Adjusted EBITDA margin would have been 45.7% Adjusted EPS increased 9% to $0.47 (1) Net income before provision for income taxes, depreciation and amortization, other net expense and income, non-recurring stock-based compensation and restructuring costs. Please see pages 16-18 for reconciliation.(2) For the purposes of calculating Adjusted EPS, the after-tax impact of non-recurring stock-based compensation, amortization of intangible assets, debt repayment expenses and restructuring costs are excluded from the calculation of EPS. Please see pages 16-18 for reconciliation.
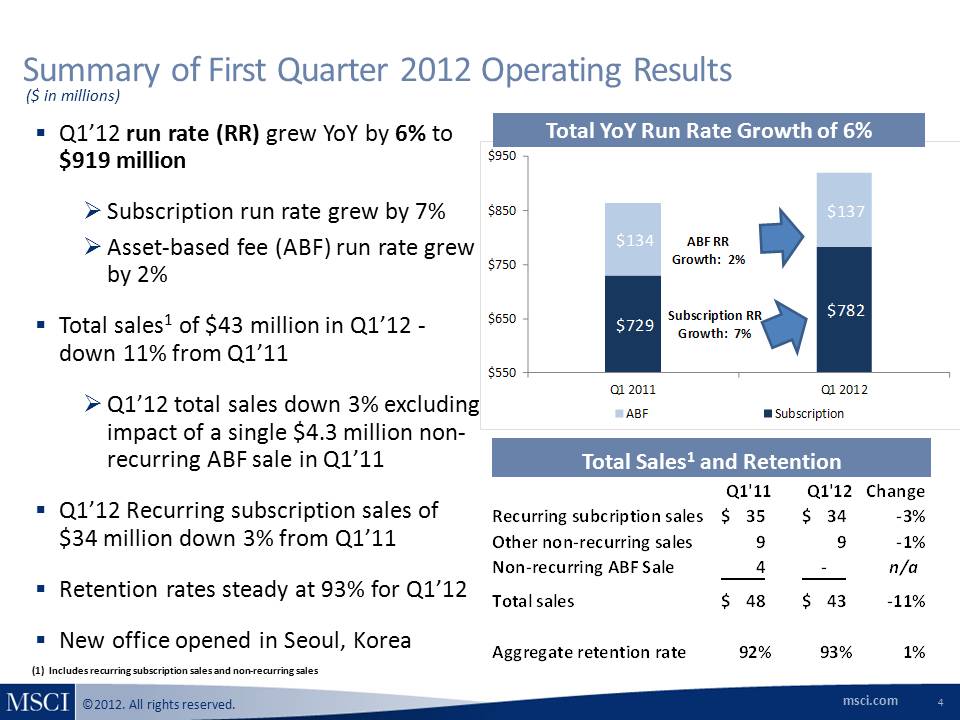
Summary of First Quarter 2012 Operating Results Total YoY Run Rate Growth of 6% Total Sales1 and Retention Q1’12 run rate (RR) grew YoY by 6% to $919 million Subscription run rate grew by 7% Asset-based fee (ABF) run rate grew by 2% Total sales1 of $43 million in Q1’12 -down 11% from Q1’11 Q1’12 total sales down 3% excluding impact of a single $4.3 million non-recurring ABF sale in Q1’11 Q1’12 Recurring subscription sales of $34 million down 3% from Q1’11 Retention rates steady at 93% for Q1’12 New office opened in Seoul, Korea ($ in millions) (1) Includes recurring subscription sales and non-recurring sales
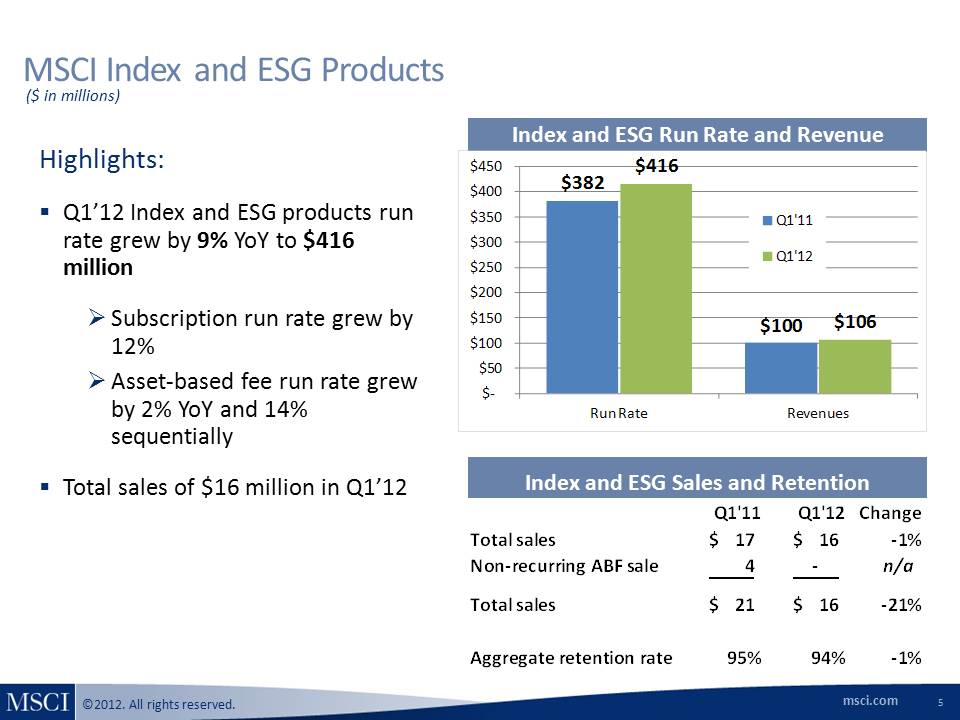
MSCI Index and ESG Products Other Placeholder: 5 Index and ESG Run Rate and Revenue Highlights: Q1’12 Index and ESG products run rate grew by 9% YoY to $416 million Subscription run rate grew by 12% Asset-based fee run rate grew by 2% YoY and 14% sequentially Total sales of $16 million in Q1’12 ($ in millions) Index and ESG Sales and Retention
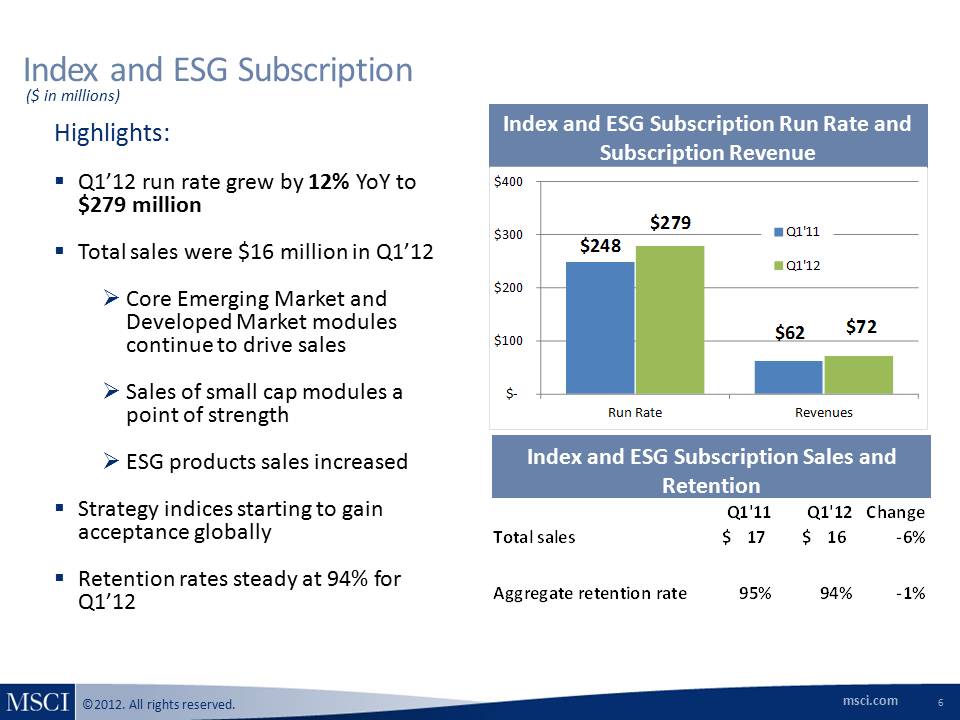
Index and ESG Subscription Index and ESG Subscription Run Rate and Subscription Revenue Highlights: Q1’12 run rate grew by 12% YoY to $279 million Total sales were $16 million in Q1’12 Core Emerging Market and Developed Market modules continue to drive sales Sales of small cap modules a point of strength ESG products sales increased Strategy indices starting to gain acceptance globally Retention rates steady at 94% for Q1’12 ($ in millions) Index and ESG Subscription Sales and Retention
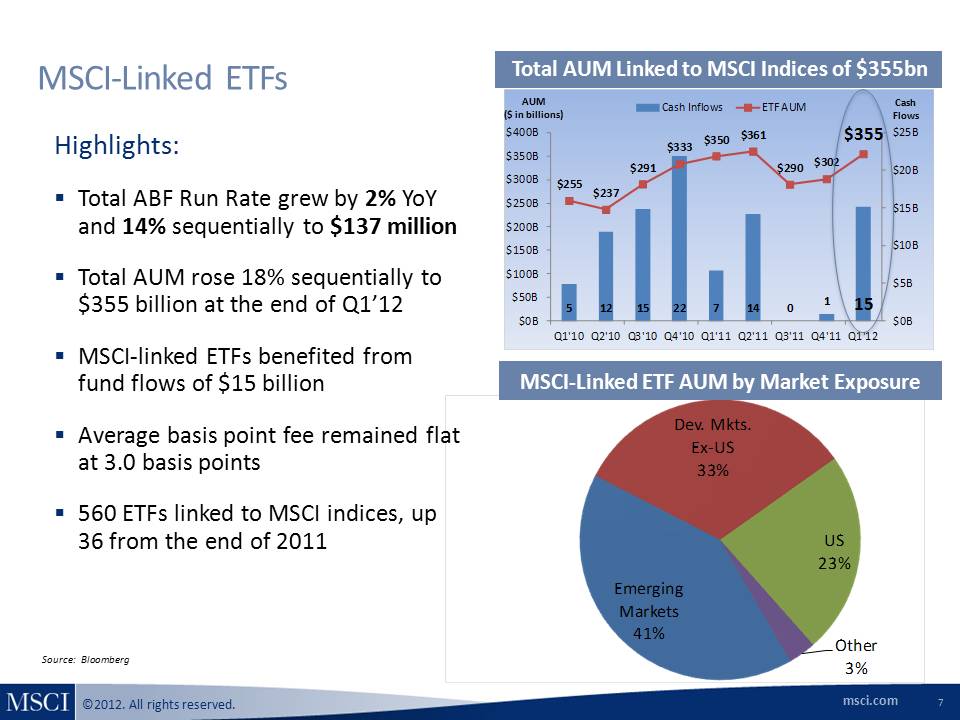
MSCI-Linked ETFs Total AUM Linked to MSCI Indices of $355bn Source: Bloomberg MSCI-Linked ETF AUM by Market Exposure Highlights: Total ABF Run Rate grew by 2% YoY and 14% sequentially to $137 million Total AUM rose 18% sequentially to $355 billion at the end of Q1’12 MSCI-linked ETFs benefited from fund flows of $15 billion Average basis point fee remained flat at 3.0 basis points 560 ETFs linked to MSCI indices, up 36 from the end of 2011 AUM ($ in billions) Cash Flows
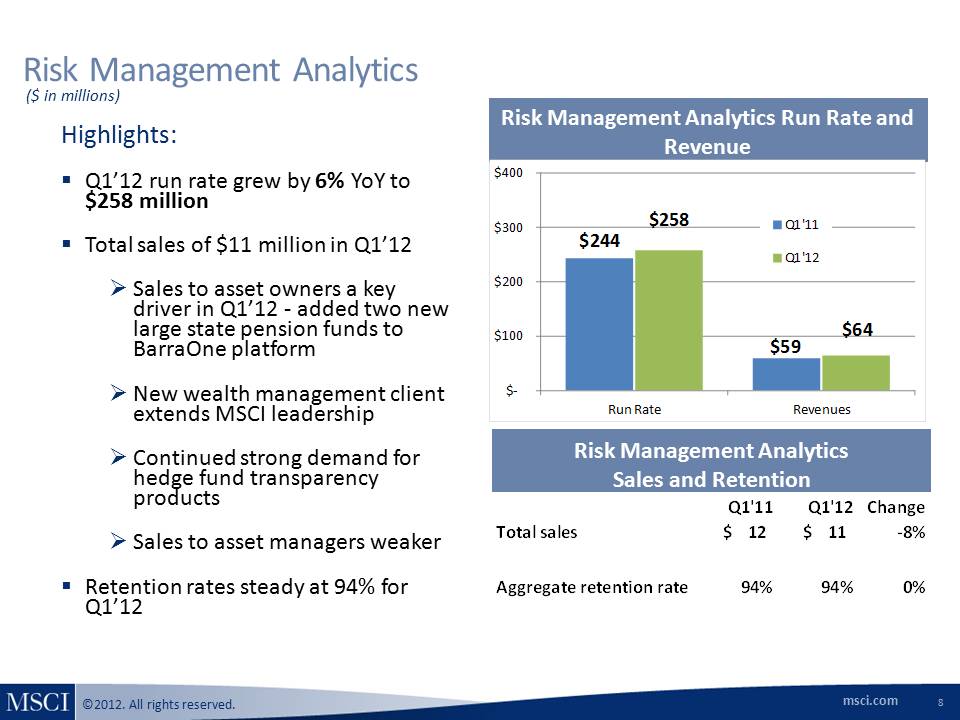
Risk Management Analytics Risk Management Analytics Run Rate and Revenue Highlights:Q1’12 run rate grew by 6% YoY to $258 millionTotal sales of $11 million in Q1’12Sales to asset owners a key driver in Q1’12 - added two new large state pension funds to BarraOne platformNew wealth management client extends MSCI leadershipContinued strong demand for hedge fund transparency productsSales to asset managers weakerRetention rates steady at 94% for Q1’12 ($ in millions) Risk Management Analytics Sales and Retention
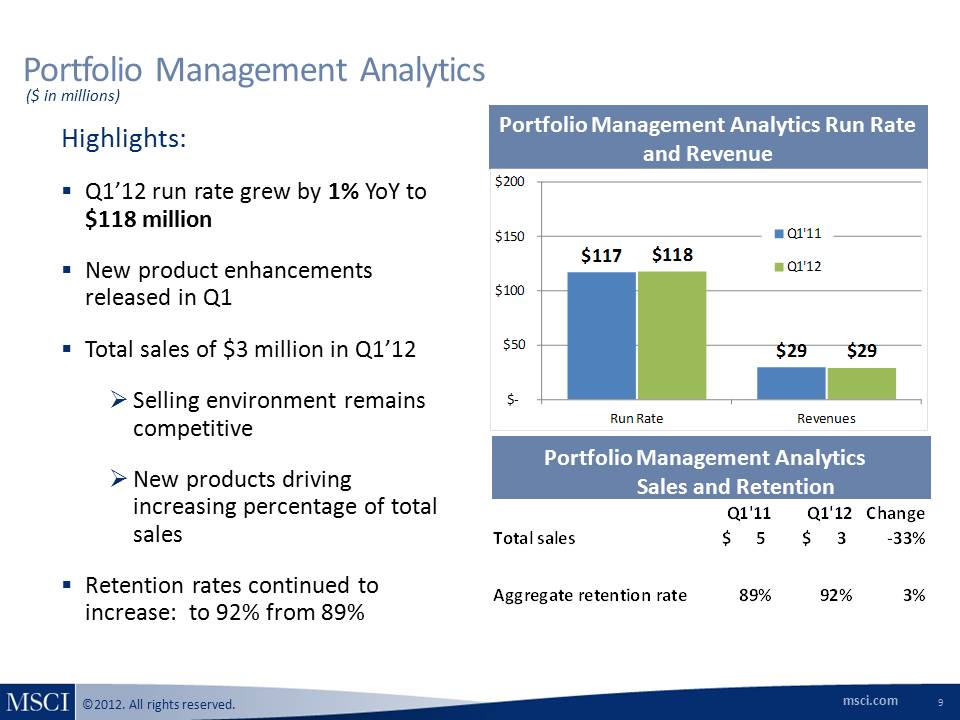
Portfolio Management Analytics Portfolio Management Analytics Run Rate and Revenue Highlights: Q1’12 run rate grew by 1% YoY to $118 million New product enhancements released in Q1 Total sales of $3 million in Q1’12 Selling environment remains competitive New products driving increasing percentage of total sales Retention rates continued to increase: to 92% from 89% ($ in millions) Portfolio Management Analytics Sales and Retention
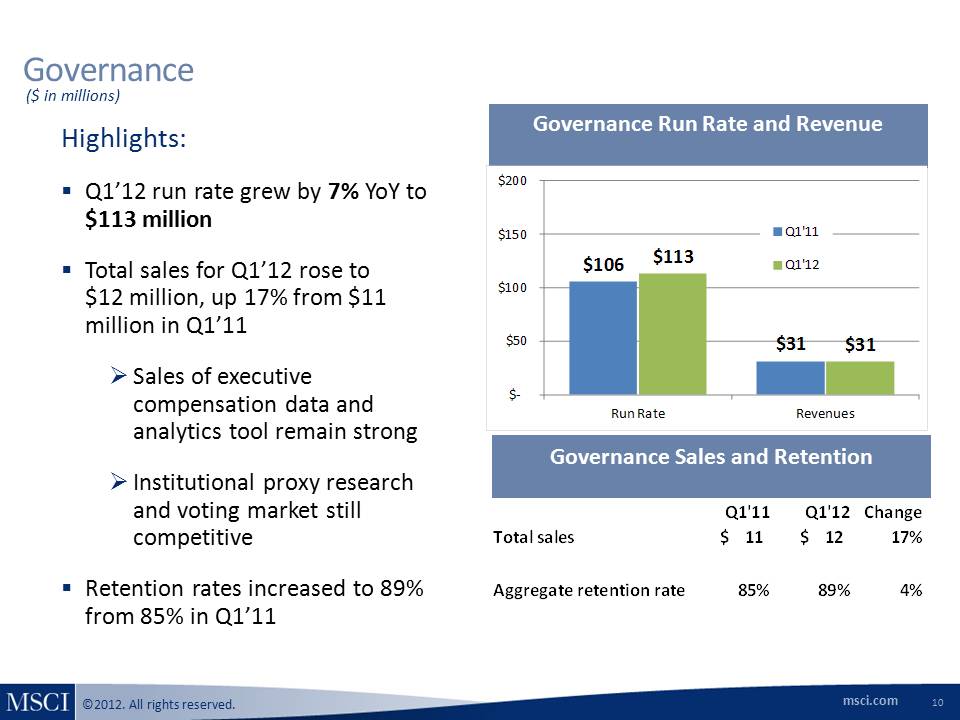
Governance Governance Run Rate and Revenue Highlights: Q1’12 run rate grew by 7% YoY to $113 million Total sales for Q1’12 rose to $12 million, up 17% from $11 million in Q1’11 Sales of executive compensation data and analytics tool remain strong Institutional proxy research and voting market still competitive Retention rates increased to 89% from 85% in Q1’11 ($ in millions) Governance Sales and Retention
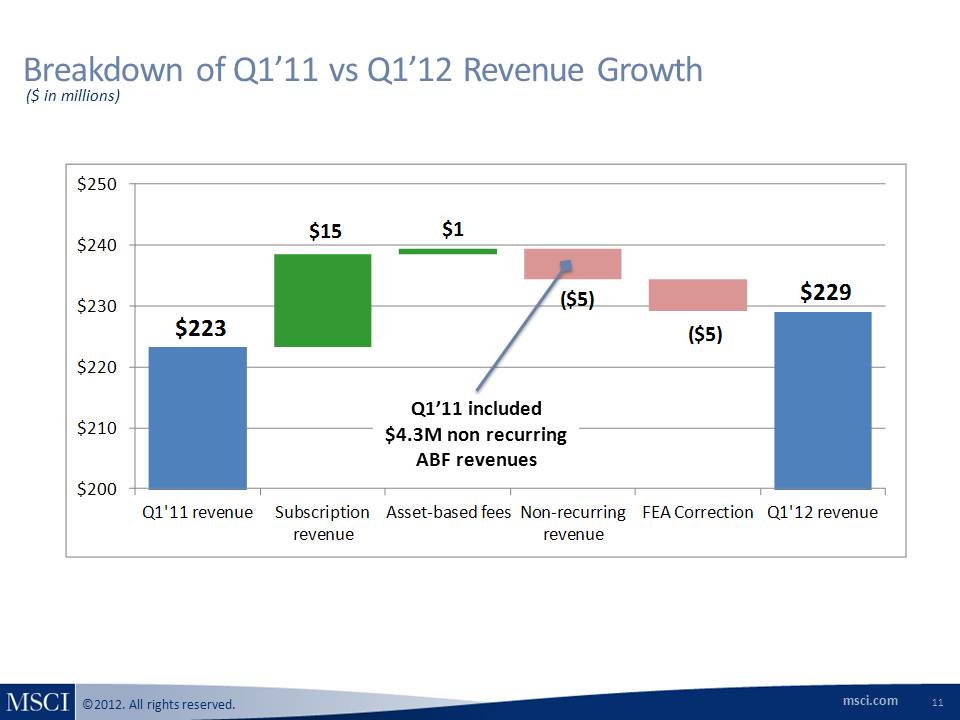
Breakdown of Q1’11 vs Q1’12 Revenue Growth ($ in millions) Q1’11 included $4.3M non recurring ABF revenues
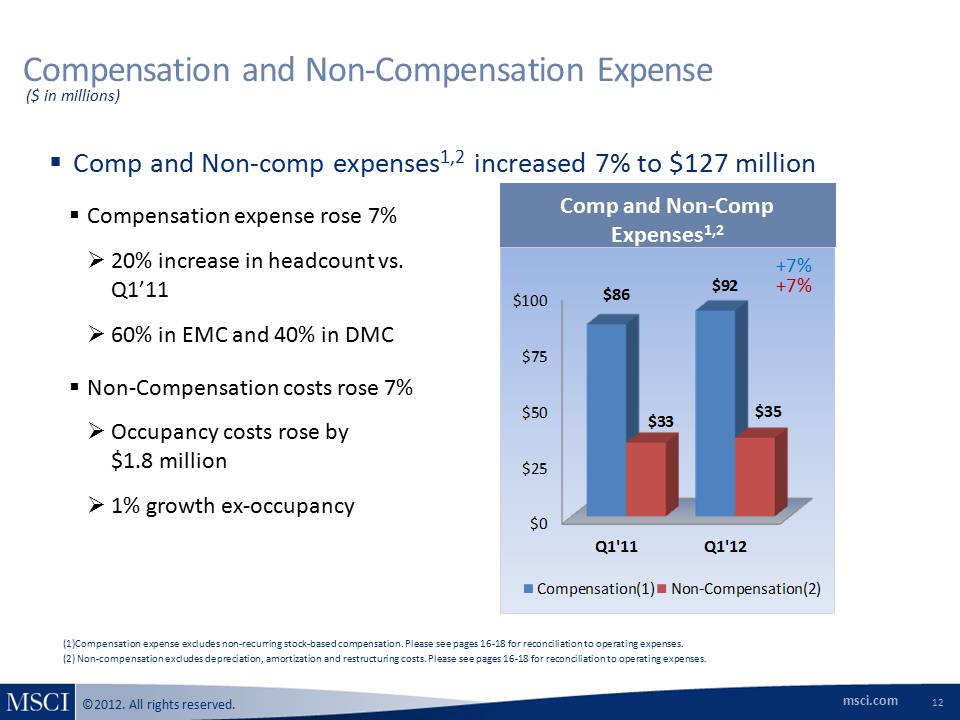
Compensation and Non-Compensation Expense Comp and Non-Comp Expenses1,2 +7% ($ in millions) Compensation expense excludes non-recurring stock-based compensation. Please see pages 16-18 for reconciliation to operating expenses. (2) Non-compensation excludes depreciation, amortization and restructuring costs. Please see pages 16-18 for reconciliation to operating expenses. +7% Other Placeholder: Comp and Non-comp expenses1,2 increased 7% to $127 million Compensation expense rose 7% 20% increase in headcount vs. Q1’11 60% in EMC and 40% in DMC Non-Compensation costs rose 7% Occupancy costs rose by $1.8 million 1% growth ex-occupancy
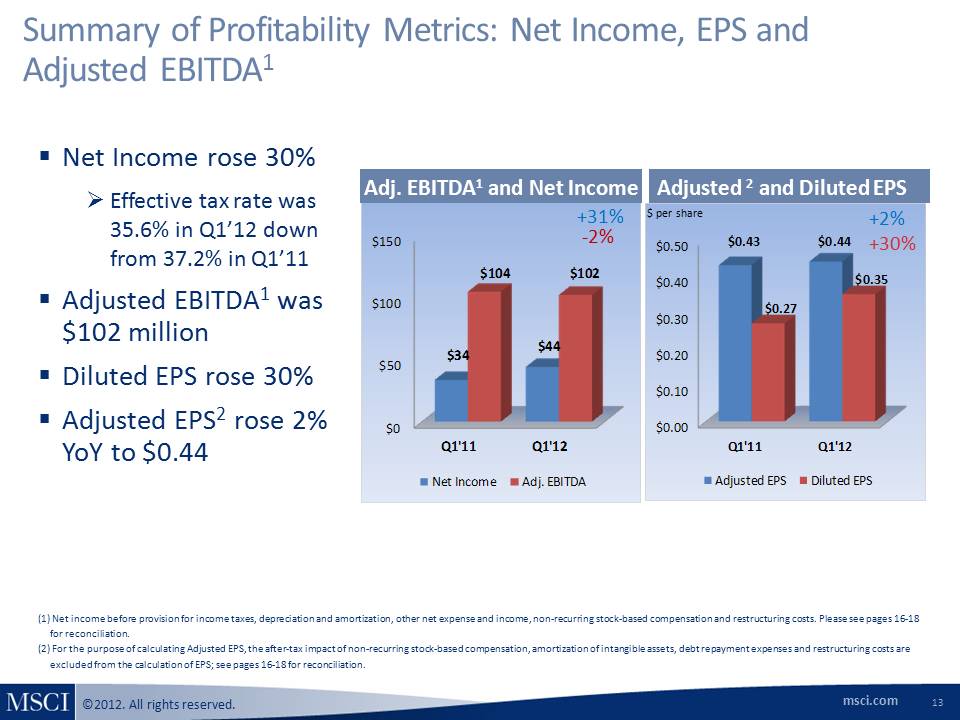
Summary of Profitability Metrics: Net Income, EPS and Adjusted EBITDA1 Other Placeholder: 13 $ per share +2% +30% Adjusted 2 and Diluted EPS Other Placeholder: Net Income rose 30% Effective tax rate was 35.6% in Q1’12 down from 37.2% in Q1’11 Adjusted EBITDA1 was $102 million Diluted EPS rose 30% Adjusted EPS2 rose 2% YoY to $0.44 Adj. EBITDA1 and Net Income +31% -2% Net income before provision for income taxes, depreciation and amortization, other net expense and income, non-recurring stock-based compensation and restructuring costs. Please see pages 16-18 for reconciliation. For the purpose of calculating Adjusted EPS, the after-tax impact of non-recurring stock-based compensation, amortization of intangible assets, debt repayment expenses and restructuring costs are excluded from the calculation of EPS; see pages 16-18 for reconciliation.
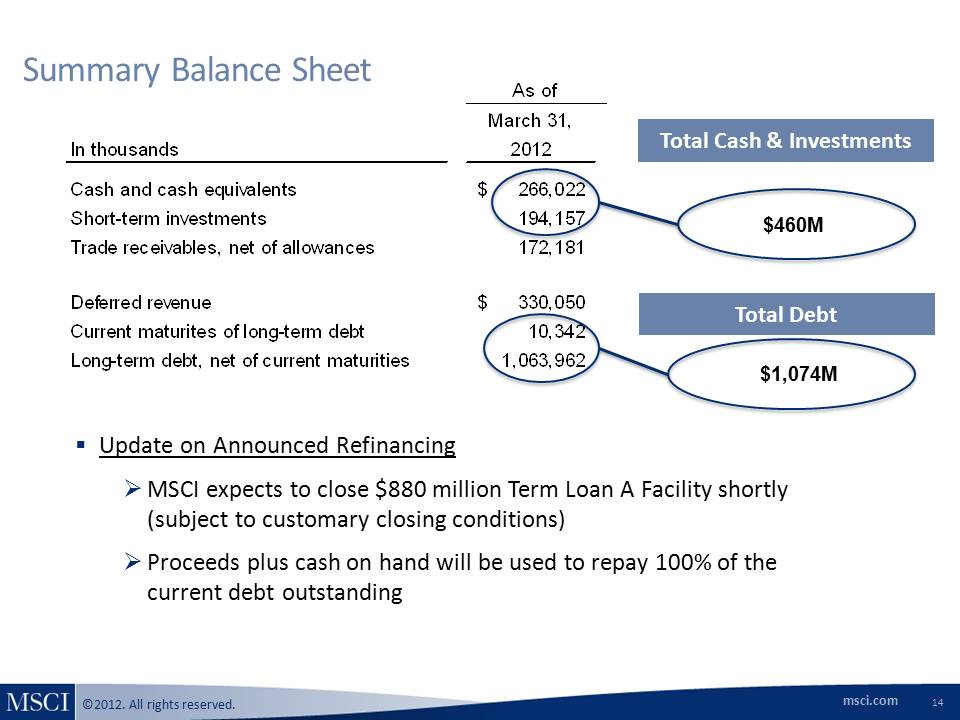
Other Placeholder: 14 $1,074M Summary Balance Sheet $460M Other Placeholder: Update on Announced Refinancing MSCI expects to close $880 million Term Loan A Facility shortly (subject to customary closing conditions) Proceeds plus cash on hand will be used to repay 100% of the current debt outstanding Total Cash & Investments Total Debt
Use of Non-GAAP Financial Measures Other Placeholder: MSCI has presented supplemental non-GAAP financial measures as part of this presentation. A reconciliation is provided that reconciles each non-GAAP financial measure with the most comparable GAAP measure. The presentation of non-GAAP financial measures should not be considered as alternative measures for the most directly comparable GAAP financial measures. These measures are used by management to monitor the financial performance of the business, inform business decision making and forecast future results.Adjusted EBITDA is defined as net income before provision for income taxes, other net expense and income, depreciation and amortization, non-recurring stock-based compensation and restructuring costs . Adjusted Net Income and Adjusted EPS are defined as net income and EPS, respectively, before provision for non-recurring stock-based compensation expenses, amortization of intangible assets, restructuring costs and the accelerated interest expense resulting from the termination of an interest rate swap and the accelerated amortization of deferred financing and debt discount costs (debt repayment expenses and refinancing expenses), as well as for any related tax effects. We believe that adjustments related to restructuring costs and debt repayment and refinancing expenses are useful to management and investors because it allows for an evaluation of MSCI’s underlying operating performance by excluding the costs incurred in connection with the acquisition of RiskMetrics. Additionally, we believe that adjusting for non-recurring stock-based compensation and amortization of intangible assets may help investors compare our performance to that of other companies in our industry as we do not believe that other companies in our industry have as significant a portion of their operating expenses represented by non-recurring stock-based compensation and amortization of intangible assets. We believe that the non-GAAP financial measures presented in this presentation facilitate meaningful period-to-period comparisons and provide a baseline for the evaluation of future results.Adjusted EBITDA and Adjusted EPS are not defined in the same manner by all companies and may not be comparable to other similarly titled measures of other companies.During first quarter 2012, MSCI recorded a non-cash $5.2 million cumulative revenue reduction to correct an error related to energy and commodity analytics revenues previously reported prior to January 1, 2012. Because the revenue that was corrected as part of this adjustment is a non-recurring charge related to prior periods, we believe that excluding it from revenue, Adjusted EBITDA and Adjusted EPS supports a more accurate understanding of MSCI’s underlying operating performance for the current period.
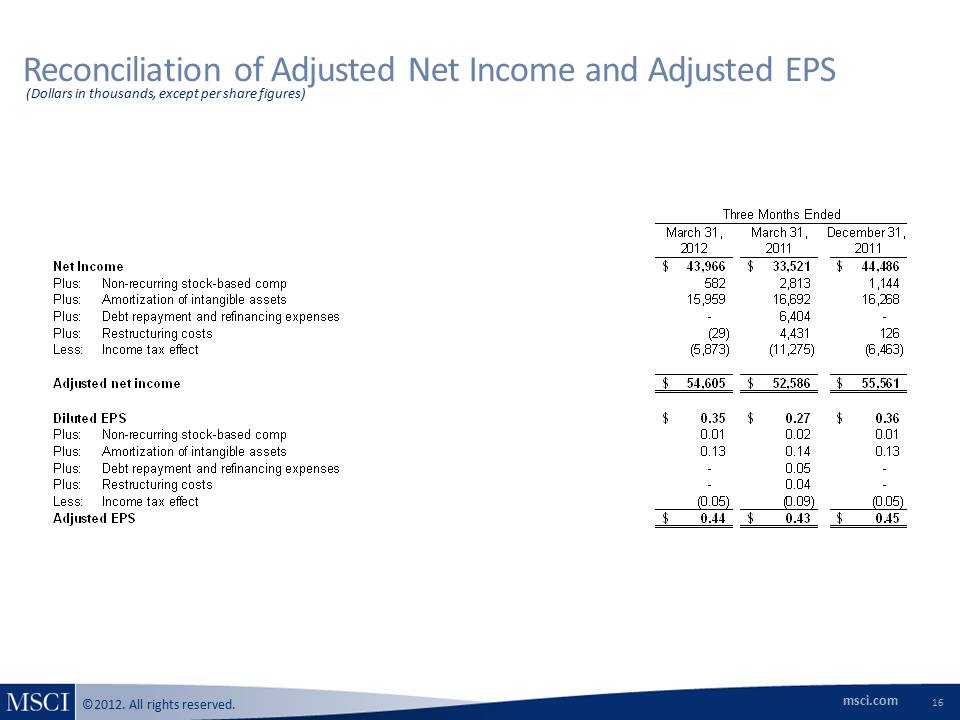
Reconciliation of Adjusted Net Income and Adjusted EPS (Dollars in thousands, except per share figures)
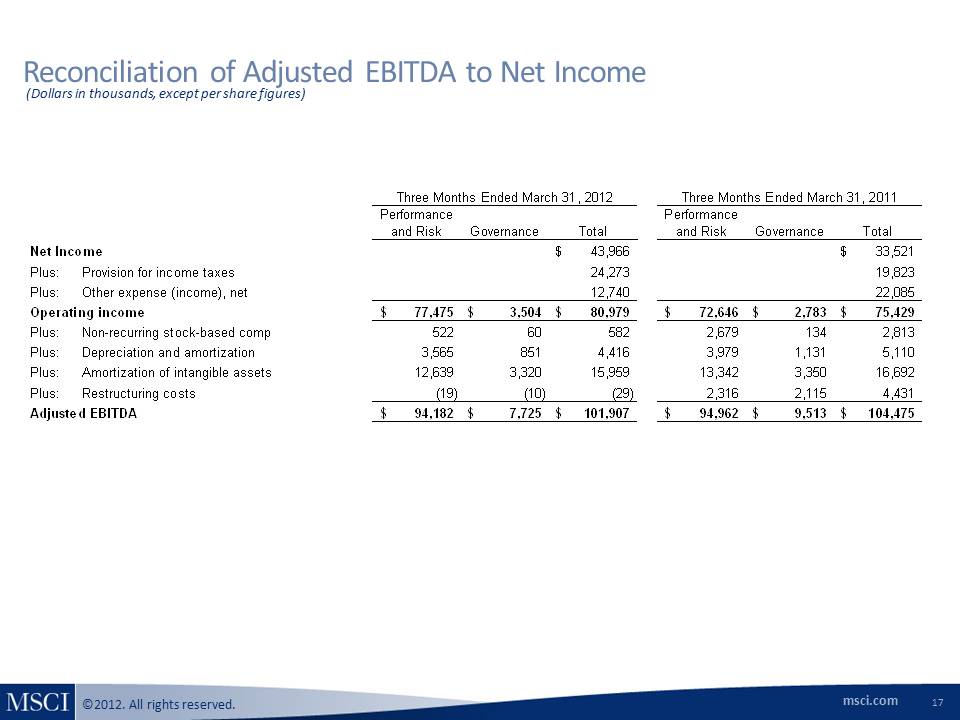
Reconciliation of Adjusted EBITDA to Net Income (Dollars in thousands, except per share figures)
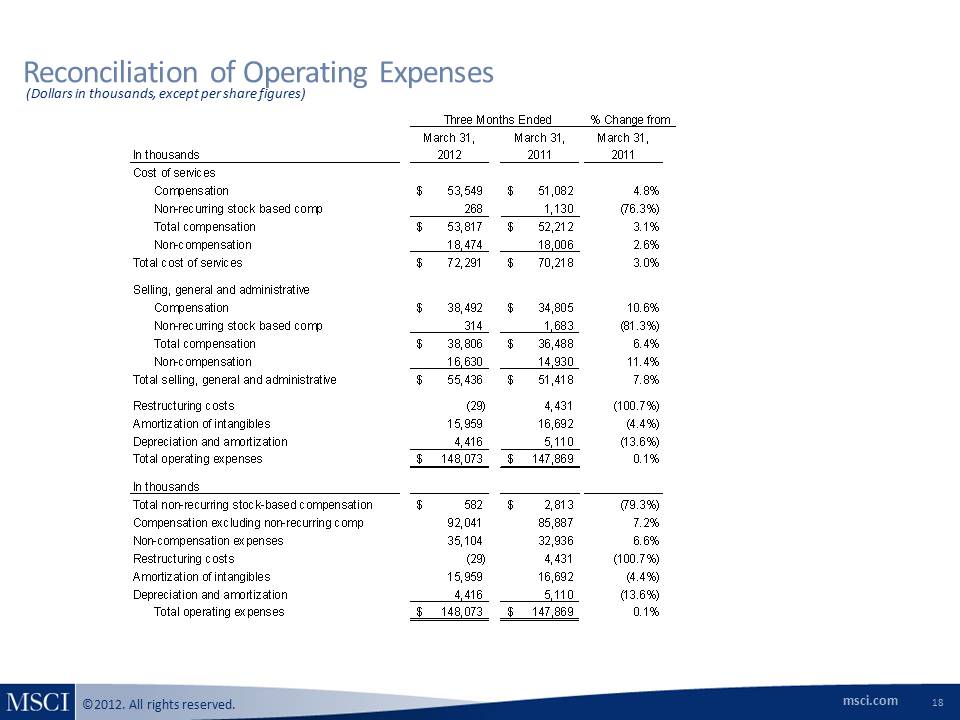
Reconciliation of Operating Expenses (Dollars in thousands, except per share figures)