Attached files
| file | filename |
|---|---|
| 8-K - FORM 8-K - JONES LANG LASALLE INC | d342256d8k.htm |
| EX-99.1 - PRESS RELEASE - JONES LANG LASALLE INC | d342256dex991.htm |
 Supplemental Information
First Quarter
Earnings Call
2012
Exhibit 99.2 |
 Market & Financial Overview |
 3
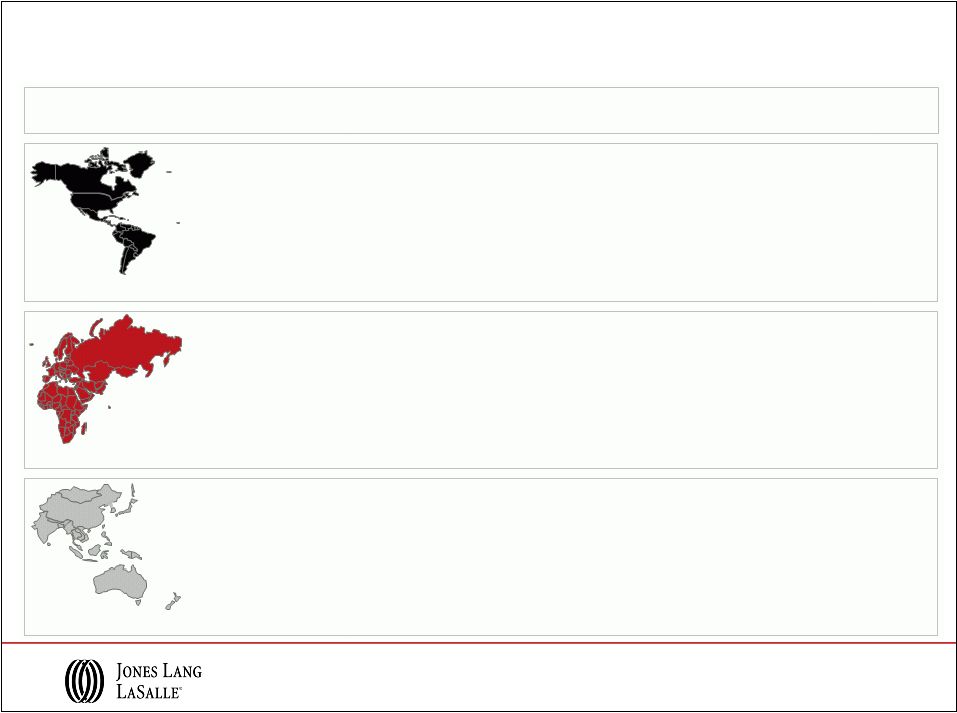
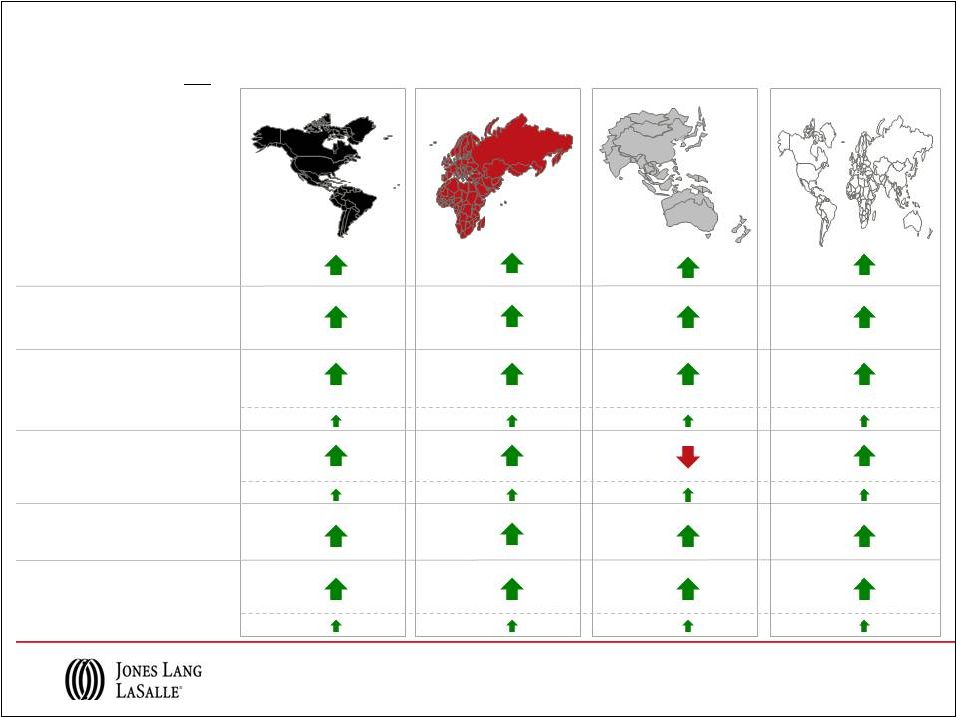
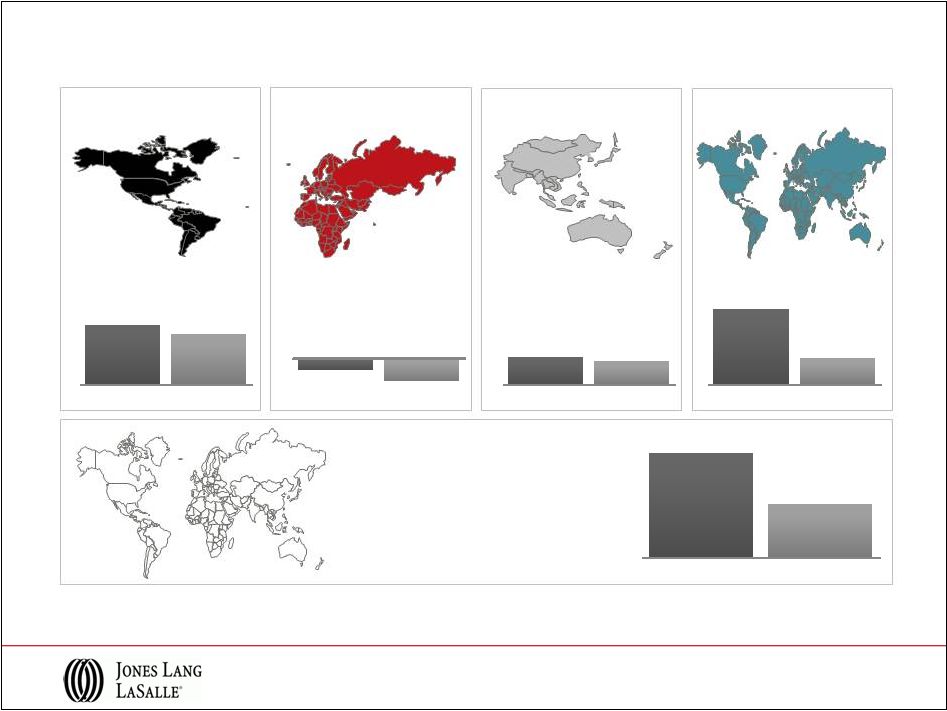
Prime Offices -
Capital Value Clock
As of Q1 2012
Capital Value
growth slowing
Capital Value
growth
accelerating
Capital Value
bottoming out
Capital Value
falling
Q1 2011
Washington
DC, Sao Paulo
Amsterdam,
Hong Kong
New York, San Francisco
Toronto,
Moscow
Chicago
Los Angeles, Stockholm
Dallas, Mexico City
Frankfurt, Milan
Atlanta,
Berlin
Paris, Sydney
Detroit
Seoul, Tokyo
Brussels,
Mumbai
Shanghai
Beijing
Singapore
London
Madrid
Capital Value
growth slowing
Capital Value
growth
accelerating
Capital Values
bottoming out
Capital Values
falling
Q1 2012
Beijing,
Milan
Shanghai
Hong Kong, Singapore,
Amsterdam
Mumbai
Sydney
Tokyo
Dallas
Detroit, Mexico City
Brussels,
Seoul
Washington DC, New York
Los Angeles
San Francisco, Sao
Paulo, Toronto
Chicago
Atlanta
Berlin, Moscow
Frankfurt
London, Paris
Madrid
Stockholm
Americas
EMEA
Asia Pacific
The
Jones
Lang
LaSalle
Property
Clocks
SM |
 4
Prime Offices –
Rental Clock
As of Q1 2012
The
Jones
Lang
LaSalle
Property
Clocks
SM
Q1 2011
Rental Value
growth slowing
Rental Value
growth
accelerating
Rental Values
bottoming out
Rental Values
falling
Toronto
Beijing, Hong Kong
Washington DC
San Francisco
Singapore
New York,
Shanghai
Atlanta,
Chicago
Madrid
Los Angeles
Dallas,
Amsterdam,
Tokyo
Sao Paulo
London
Detroit
Mexico City
Dubai
Seoul
Mumbai
Frankfurt, Milan
Johannesburg
Sydney
Moscow
Stockholm
Berlin, Paris
Brussels, Rome
Americas
EMEA
Asia Pacific
Q1 2012
Rental Value
growth slowing
Rental Value
growth
accelerating
Rental Values
bottoming out
Rental Values
falling
Beijing,
Stockholm
Shanghai
Sydney
Hong Kong
Singapore
Mumbai
New York
Johannesburg, Milan
Washington DC, Rome
Detroit
Dubai
Sao Paulo
Toronto
San Francisco
Dallas
Atlanta, Chicago
Los Angeles
Frankfurt
Mexico City
Amsterdam
Berlin
Brussels, Madrid,
Seoul
London
Moscow
Paris
Tokyo |
 Q1 Selected Business Wins and Expansions
5
Americas
EMEA
Asia Pacific
Global
–
Ericsson –
26M sf
–
Howard Hughes Medical Institute,
Virgina –
1M sf
–
516-520
Fifth
Avenue,
New
York
–
$132M
–
12
West
57th
Street,
New
York
–
$120M
–
Gansevoort,
South
Miami
Beach
–
$200M+
–
Novotel
Times
Square,
New
York
–
$92M
–
ION
Trading,
New
York
–
57K
sf
–
Gibson
Dunn,
Washington
D.C.
–
200K
sf
–
Riverbed Technology, San Francisco –
168K sf
–
High Tech Campus Eindhoven,
Netherlands
–
€425M
–
1
Bunhill
Road,
London
–
£185M
–
Westland
Shopping
Centre,
Brussels
–
€81M
–
Westend
Frankfurt
Hotel,
Germany
–
€100M+
–
Vinci
La
Defense,
Paris
–
€100M+
–
Merck/Schering
Plough,
Ireland
–
355K
sf
–
AXA
Real
Estate,
Slovakia
–
915K
sf
–
Societe
Generale,
Milan
–
269K
sf
–
New
York
University,
Shanghai
–
570K
sf
–
Twenty
Anson,
Singapore
–
US$
341M
–
Myer
Centre,
Brisbane
–
AUD
366M
–
Mumbai
land
parcel,
India
–
US$
95M
–
Growthpoint
Properties,
Australia
–
8.9M
sf
–
Chongqing Tian Fu Square, China –
1.9M sf
–
The
Asia
Society,
Hong
Kong
–
80K
sf
–
Eden
City
Group,
India
–
1.9M
sf
–
MetLife –
14M sf |
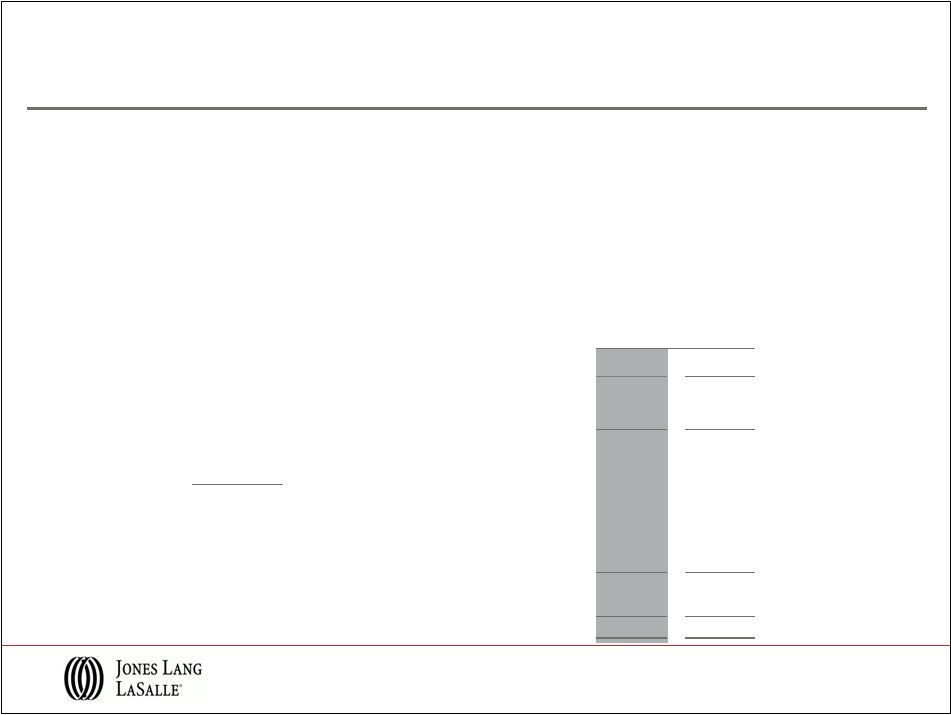
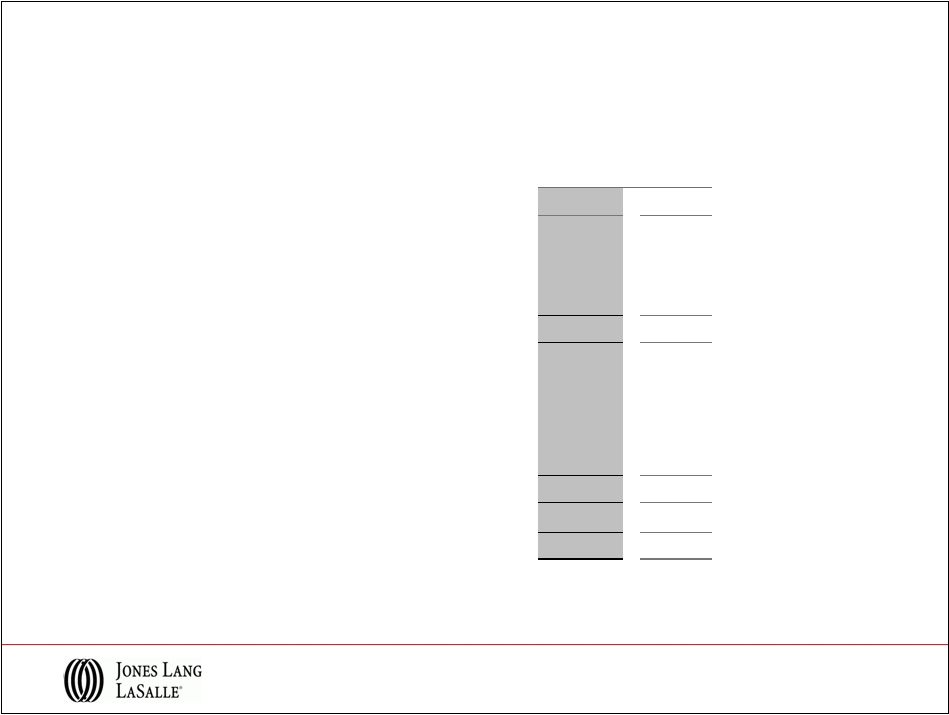
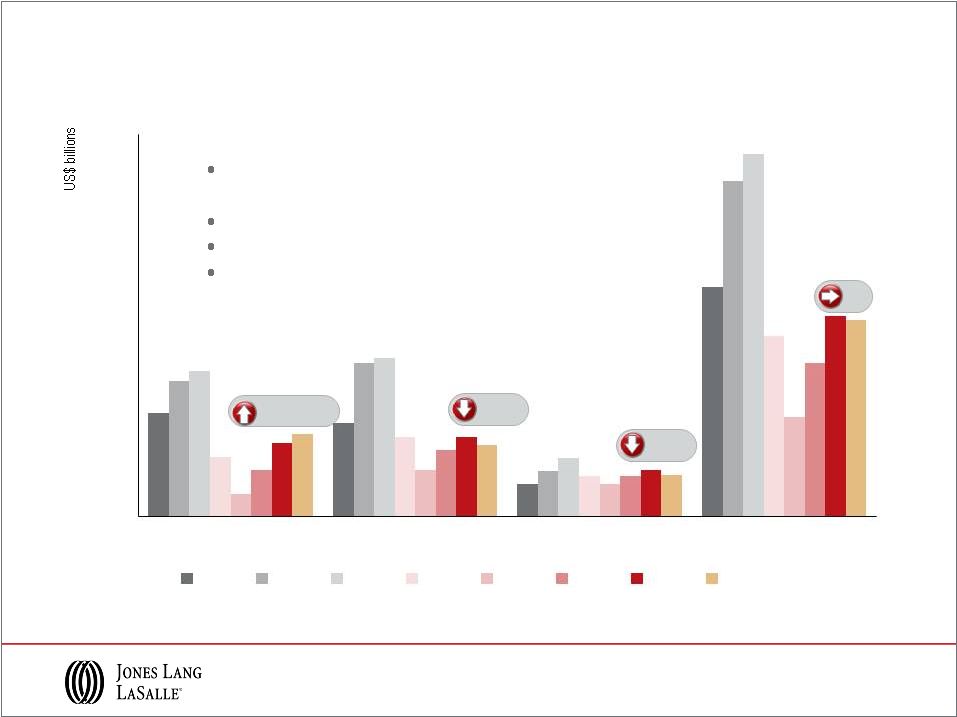 Direct
Commercial
Real
Estate
Investment,
2005
-
2012
Source: Jones Lang LaSalle, April 2012
+10-15%
-10%
=
-10%
2012 volumes forecasted at approximately $400
billion, in line with 2011
Americas -
projections unchanged
EMEA -
lower end of previous forecast
Asia Pacific -
down 10% from previous forecast
6
0
100
200
300
400
500
600
700
800
Americas
EMEA
Asia Pacific
Global
2005
2006
2007
2008
2009
2010
2011
Projection
2012 |
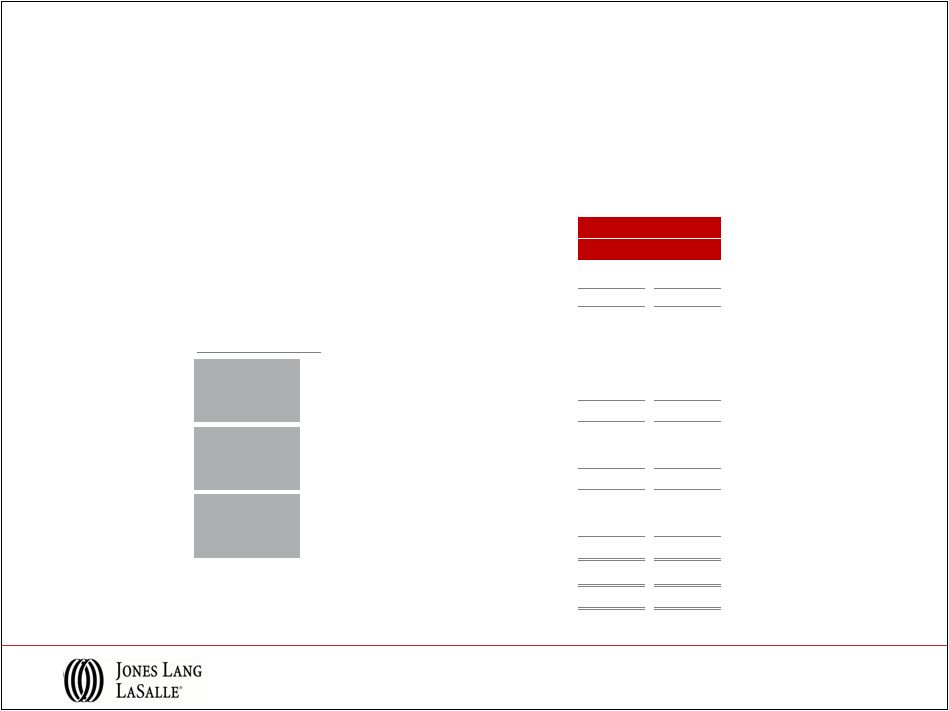
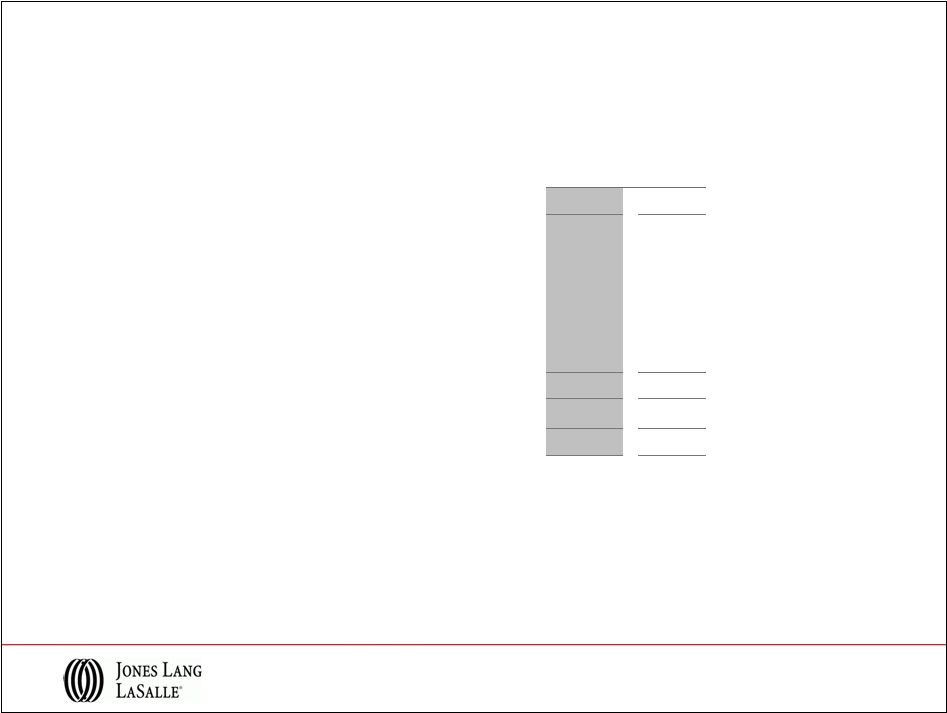
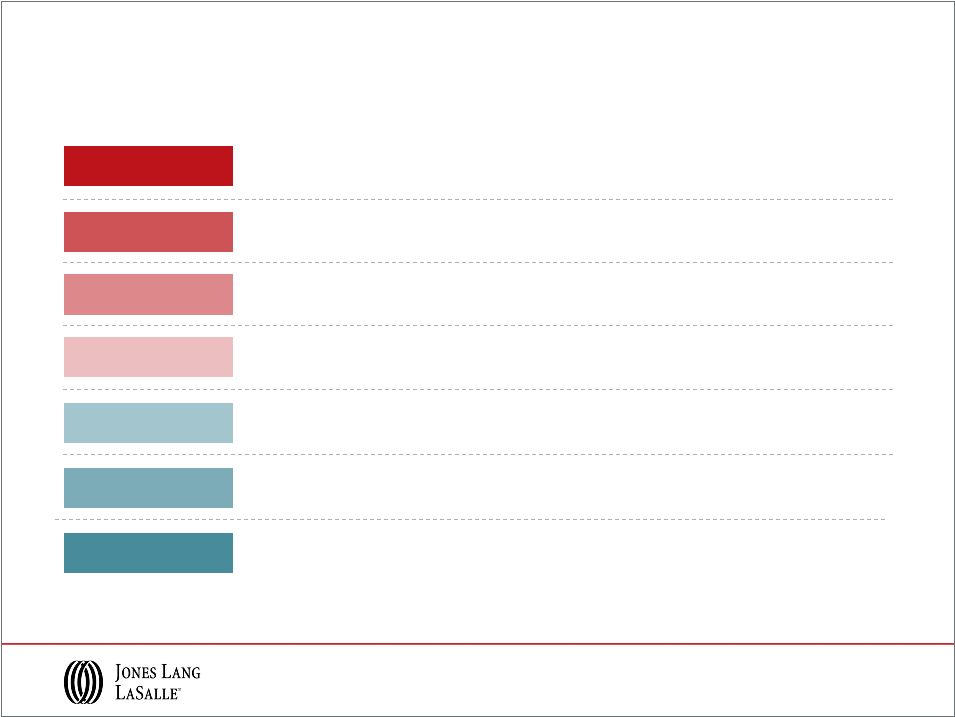 Prime Offices –
Projected Changes in Values, 2012
+ 10-20%
Capital Values
Rental Values
+ 5-10%
+ 0-5%
-
0-5%
-
5-10%
Shanghai, Mumbai, Tokyo
Boston, New York*, Moscow
Frankfurt, Paris, London*, Stockholm
Chicago, Los Angeles, Washington DC
Sydney
+ 20%
Beijing, Toronto, San Francisco
Sao Paulo
Shanghai, Mumbai, Tokyo, Sydney
Boston, New York*
Moscow
Chicago, Los Angeles, Washington DC
Frankfurt, Paris, London*, Stockholm,
Hong Kong
Provisional. *New York –
Midtown, London –
West End. Nominal rates in local currency.
Source: Jones Lang LaSalle, April 2012
-
10-20%
Dubai
Brussels, Madrid, Mexico City
Brussels, Mexico City
Dubai, Madrid
Singapore
Toronto, San Francisco, Sao Paulo
Hong Kong, Singapore
Beijing
7 |
 Financial Information |
 9
Q1 2012 Revenue Performance
Note: Equity earnings (losses) of $11.8M and ($2.0M) in 2012 and
2011, respectively, are included in segment results, however,
are excluded from Consolidated totals. Year-over-year increases shown
“fee”-based have been calculated using Fee Revenue, which
excludes gross contract costs. Americas
EMEA
Asia Pacific
LIM
Consolidated
($ in millions; % change in USD)
20% (14% fee)
27% (27% fee)
13% (15% fee)
23%
18% (16% fee)
Fee revenue
Gross contract costs
$346.3
$288.1
$213.2
$168.1
$186.4
$165.5
$813.3
$687.9
$327.4
$286.6
2012
2011
$186.9
$147.5
2012
2011
$162.6
$140.9
2012
2011
$79.2
$64.2
2012
2011
$744.3
$641.2
2012
2011 |
 Q1 2012 Real Estate Services Revenue
Note: Segment and Consolidated Real Estate Services (“RES”) operating
revenue exclude equity earnings (losses). Fee Revenue presentation of
Property & Facility Management, Project & Development Services and Total RES Operating Revenue
excludes gross contract costs.
Asia Pacific
($
in
millions;
%
change
in
USD
over
March
YTD
2011)
Americas
EMEA
Leasing
Capital Markets &
Hotels
Property & Facility
Management
Fee Revenue
Project &
Development Services
Fee Revenue
Advisory, Consulting
& Other
Total RES
Operating Revenue
Fee Revenue
$149.7
$27.8
$104.4
$39.6
$24.8
$346.3
5%
40%
56%
6%
20%
20%
$47.3
$39.2
$37.7
$50.6
$38.4
$213.2
27%
37%
5%
32%
37%
27%
$33.3
$21.6
$96.4
$14.9
$20.1
$186.3
13%
22%
15%
18%
23%
13%
$230.3
$88.6
$238.5
$105.1
$83.3
$745.8
10%
34%
28%
12%
28%
20%
Total RES
$85.6
31%
$74.3
$37.7
$197.6
5%
14%
19%
$39.5
6%
$13.2
$24.3
$77.0
37%
8%
15%
$327.4
14%
$162.5
$186.9
$676.8
27%
15%
18%
10 |
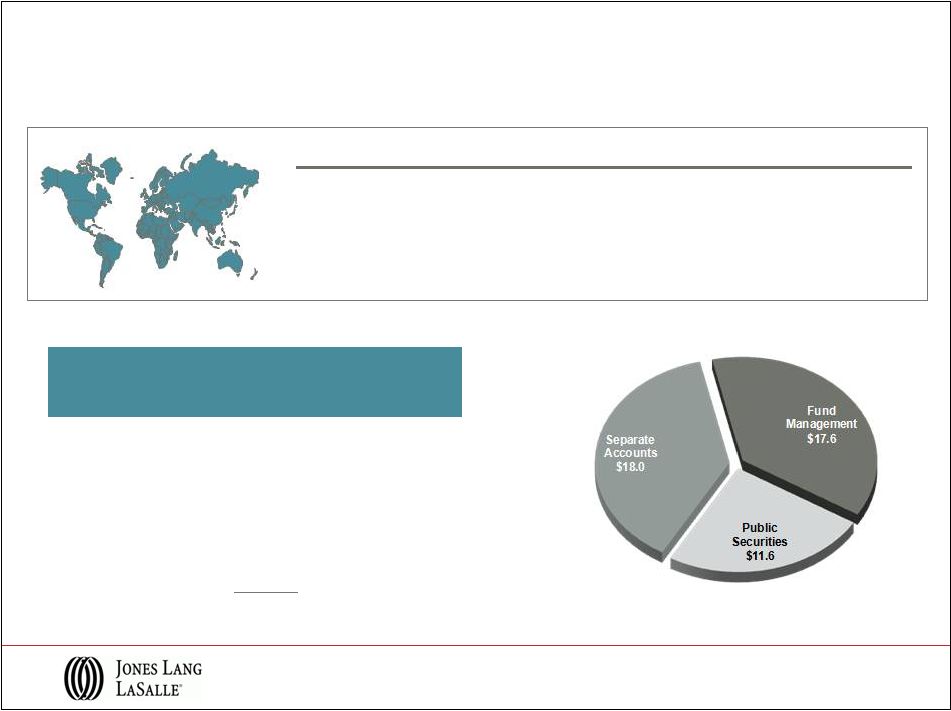 LaSalle Investment Management
Note: AUM data reported on a one-quarter lag.
Q1 2012 Highlights
AUM by Fund type
($ in billions)
11
Product
Assets Under
Management
($ in billions)
Average
Performance
Private Equity
U.K.
$11.9
Above benchmark
Continental Europe
$4.2
Return: >1x equity
North America
$11.1
Above benchmark
Asia Pacific
$8.4
Return: >1x equity
Public Securities
$11.6
Above benchmark
Total Q1 2012 AUM
$47.2 B
•
Operating income margin of 34.2%, including equity earnings
•
Solid incentive fees and equity earnings resulting from the performance
of vintage funds
•
New fundraising activities in progress as vintage funds mature
|
 Solid Cash Flows and Balance Sheet Position
•
Healthy position after Q1 2012 incentive compensation payments
-
Cash from earnings, excluding restructuring and acquisition charges, increased $14
million versus Q1 2011
•
Semi-annual dividend increased 33% to $0.20/share from $0.15/share
-
To be paid June 15, 2012
•
Investment grade balance sheet; Baa2 / BBB-
(Stable)
-
Low debt cost: Q1 2012 net interest expense of $7.4 million vs. $8.0 million in Q1
2011 -
Total net debt of $868 million, including deferred acquisition obligations of $309
million Q1 2012 Highlights
($ in millions)
First Quarter
2012
2011
Cash from Earnings
$47
$42
Working Capital
(243)
(239)
Cash used in Operations
($196)
($197)
Primary Uses
Capital Expenses
(12)
(17)
Acquisitions & Deferred Payment Obligations
(5)
(25)
Co-Investment
1
(2)
Dividends
-
-
Net Cash Outflows
($16)
($44)
Net Share Activity & Other Financing
(3)
(4)
Net Bank Debt Borrowings
($215)
($245)
12 |
 Appendix |
 Fee Revenue / Expense Reconciliation
Note: Consolidated Revenue and Fee Revenue exclude equity earnings (losses).
Restructuring and acquisition charges and intangible amortization related to
the King Sturge acquisition are excluded from operating expenses when calculating adjusted
operating income margin.
•
Reimbursable vendor, subcontractor and out-of-pocket costs reported as revenue
and expense in JLL financial statements have been steadily increasing
•
Margins diluted as gross accounting requirements increase revenue and costs without
corresponding profit •
Business
managed
on
a
“fee”
basis
to
focus
on
margin
expansion
in
the
base
business
14
($ in millions)
2012
2011
Consolidated Revenue
813.3
$
687.9
$
Consolidated Operating Expenses
798.7
675.8
Adjusted Operating Income Margin
3.1%
1.8%
Gross Contract Costs:
Property & Facility Management
18.8
1.5
Project & Development Services
0.1
-
Total Gross Contract Costs
18.9
1.5
Property & Facility Management
-
-
Project & Development Services
26.3
20.6
Total Gross Contract Costs
26.3
20.6
Property & Facility Management
22.1
18.7
Project & Development Services
1.7
5.9
Total Gross Contract Costs
23.8
24.6
Consolidated Fee Revenue
744.3
$
641.2
$
Consolidated Fee-based Operating Expenses
729.7
$
629.1
$
Adjusted Operating Income Margin
("fee"-based) 3.4%
1.9%
Asia Pacific
Americas
EMEA
Q1 |
 15
Q1 2012 Adjusted EBITDA* Performance
Americas
EMEA
Asia Pacific
LIM
Consolidated
* Refer to slide 17 for Reconciliation of GAAP Net Income to Adjusted EBITDA for the
three months ended March 31, 2012, and 2011, for details relative to these adjusted EBITDA
calculations. Segment EBITDA is calculated by adding the segment’s depreciation
and amortization to its reported operating income, which excludes restructuring and acquisition
charges. Consolidated adjusted EBITDA is the sum of the EBITDA of the four segments
less net income attributable to non-controlling interest. ($ in
millions) $21.7
$18.5
2012
2011
$54.9
$28.3
2012
2011
$10.1
$8.5
2012
2011
$27.5
$9.6
2012
2011
($4.3)
($8.2)
2012
2011 |
 16
Reconciliation of GAAP Net Income to Adjusted Net Income
Three Months Ended
March 31,
($ in millions)
2012
2011
GAAP Net income attributable to common
shareholders
$ 14.0
$ 1.5
Shares (in 000s)
44,685
44,359
GAAP earnings per share
$ 0.31
$ 0.03
GAAP Net income attributable to common
shareholders
$ 14.0
$ 1.5
Restructuring and acquisition charges, net
6.7
-
Intangible amortization, net
1.6
-
Adjusted net income
$ 22.3
$ 1.5
Shares (in 000s)
44,685
44,359
Adjusted earnings per share
$ 0.50
$ 0.03
and Earnings per Share |
 17
Reconciliation of GAAP Net Income to Adjusted EBITDA
Three Months Ended
March 31,
($ in millions)
2012
2011
GAAP Net income attributable to common
shareholders
$ 14.0
$1.5
Interest expense, net of interest income
7.4
8.0
Provision for income taxes
4.8
0.5
Depreciation and amortization
19.7
18.3
EBITDA
$ 45.9
$ 28.3
Restructuring and acquisition charges
9.0
-
Adjusted EBITDA
$ 54.9
$ 28.3
|