Attached files
| file | filename |
|---|---|
| 8-K - FORM 8-K - Douglas Emmett Inc | form8k.htm |
|
Douglas Emmett, Inc.
|
EXECUTIVE SUMMARY
|
|
|
|
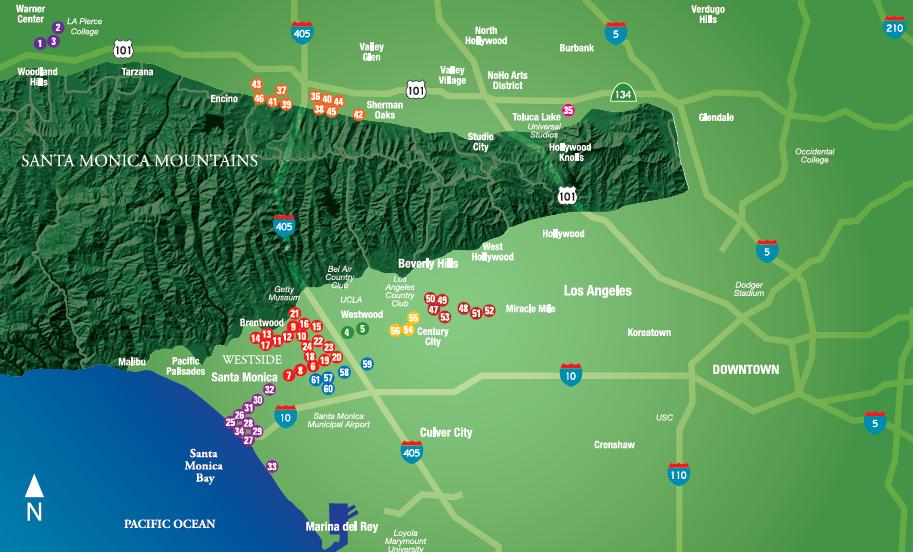
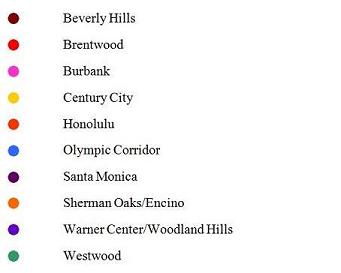
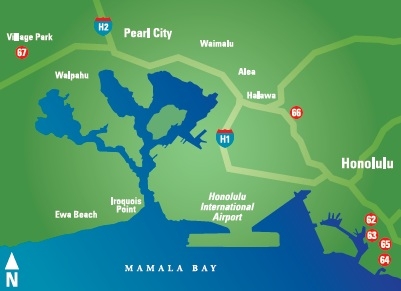
We are one of the largest owners and operators of high-quality office and multifamily properties located in the premier coastal submarkets of Southern California and Hawaii. Our properties are concentrated in ten submarkets – Beverly Hills, Brentwood, Burbank, Century City, Honolulu, Olympic Corridor, Santa Monica, Sherman Oaks/Encino, Warner Center/Woodland Hills and Westwood. We focus on owning and acquiring a substantial share of top-tier office properties and premier multifamily communities in neighborhoods that possess significant supply constraints, high-end executive housing and key lifestyle amenities. We operate as a REIT and are listed on the New York Stock Exchange under the symbol DEI.
First Quarter 2012 Executive Summary
|
·
|
Leasing. In our office portfolio, the almost 69,000 square feet of positive absorption we achieved in the first quarter was our fifth consecutive quarter of positive absorption and our best since the first quarter of 2007. Our multifamily portfolio remains fully leased, with average asking rents 7.2% higher than in the first quarter of 2011.
|
|
·
|
Funds From Operations: Funds From Operations (FFO) (adjusted1) for the quarter ended March 31, 2012 totaled $59.9 million, or $0.35 per diluted share, compared to $64.4 million, or $0.41 per diluted share, for the quarter ended March 31, 2011. GAAP net income attributable to common stockholders for the three months ended March 31, 2012 was $5.4 million.
|
|
·
|
Same Property Cash NOI. Our same property cash NOI in the first quarter of 2012 was 2.4% higher than in the first quarter of 2011.
|
|
·
|
Acquisitions: On March 1, 2012, we acquired a 16.3% equity interest in one of our institutional funds for approximately $33.4 million from a European investor that was rebalancing its portfolio. The fund involved owns six Class A office buildings, aggregating approximately 1.4 million square feet, in our submarkets, as well as an interest of approximately 10% in our second fund.
|
|
·
|
Financings: During the first quarter of 2012, we significantly reduced our leverage:
|
|
o
|
We sold 6.9 million shares of our common stock in open market transactions through our “at the market” stock offering program for net proceeds of approximately $128.2 million.
|
|
o
|
We closed a seven year, secured, non-recourse $155 million dollar term loan with fixed interest at 4% per annum.
|
|
o
|
We used these proceeds and a portion of our cash on hand to reduce our outstanding consolidated debt by $367 million, including all of our debt scheduled to mature in 2012.
|
|
·
|
Dividends: We increased our quarterly cash dividend by 15% to $0.15 per share, or an annualized $0.60 per share. We paid the dividend on April 13, 2012 to shareholders of record as of March 30, 2012.
|
|
·
|
Annual Meeting: Our Annual Meeting of Stockholders will be held at 9:00 a.m. Pacific Time on Thursday, May 24, 2012 at the Sheraton Delfina Hotel, located at 530 West Pico Blvd., Santa Monica, California 90405. Shareholders of record as of March 30, 2012 will be entitled to vote in person or by proxy at the meeting.
|
|
·
|
Guidance: We maintained our 2012 FFO guidance range at $1.33 - $1.39 per diluted share. Further details on the guidance and the underlying assumptions will be discussed in more detail on our quarterly call on Wednesday, May 2, 2012. A rebroadcast will be available for 90 days on our website at www.douglasemmett.com.
|
1 We calculate funds from operations before noncontrolling interest (FFO) in accordance with the standards established by the National Association of Real Estate Investment Trusts (NAREIT), adjusted to treat debt interest rate swaps as terminated for all purposes in the quarter of termination. Please see the page titled "Definitions" at the end of this quarterly package for this and other definitions.
|
Douglas Emmett, Inc.
|
TABLE OF CONTENTS
|
|
|
|
|
PAGE
|
|||||
|
COMPANY OVERVIEW
|
|||||
|
Corporate Data
|
3 | ||||
| 4 | |||||
|
Board of Directors and Executive Officers
|
5 | ||||
|
CONSOLIDATED FINANCIAL RESULTS
|
|||||
|
Balance Sheets
|
6 | ||||
|
Quarterly Operating Results
|
7 | ||||
|
Funds from Operations and Adjusted Funds from Operations
|
8 | ||||
|
Same Property Statistical and Financial Data
|
9 | ||||
|
Reconciliation of Same Property NOI to GAAP Net Income (Loss)
|
10 | ||||
|
Operating Results of Unconsolidated Real Estate Funds
|
11 | ||||
|
Debt Balances
|
12 | ||||
|
PORTFOLIO DATA
|
|||||
|
Office Portfolio Summary
|
13 | ||||
|
Office Portfolio Percent Leased and In-Place Rents
|
14 | ||||
|
Multifamily Portfolio Summary
|
15 | ||||
|
Office Tenant Diversification
|
16 | ||||
|
Industry Diversification
|
17 | ||||
|
Office Lease Distribution
|
18 | ||||
|
Office Lease Expirations
|
19 | ||||
|
Quarterly Office Lease Expirations – Next Four Quarters
|
20 | ||||
|
Office Portfolio Leasing Activity
|
21 | ||||
|
Definitions
|
22 | ||||
This First Quarter 2012 Earnings Results and Operating Information supplements the information provided in our reports filed with the Securities and Exchange Commission. It contains forward-looking statements within the meaning of Section 27A of the Securities Act of 1933, as amended, and Section 21E of the Securities Exchange Act of 1934, as amended. Future events and actual results, financial and otherwise, may differ materially from the results discussed in the forward-looking statements. You should not rely on forward looking statements as predictions of future events. Forward-looking statements involve numerous risks and uncertainties that could significantly affect anticipated results in the future and, accordingly, such results may differ materially from those expressed in any forward-looking statement made by us. These risks and uncertainties include, but are not limited to: adverse economic and real estate developments in Southern California and Honolulu; decreased rental rates or increased tenant incentives and vacancy rates; defaults on, early terminations of, or non-renewal of leases by tenants; increased interest rates and operating costs; failure to generate sufficient cash flows to service our outstanding indebtedness; difficulties in identifying properties to acquire and completing acquisitions; failure to successfully operate acquired properties and operations; failure to maintain our status as a REIT under the Internal Revenue Code of 1986, as amended; possible adverse changes in rent control laws and regulations; environmental uncertainties; risks related to natural disasters; lack or insufficient amount of insurance; inability to successfully expand into new markets or submarkets; risks associated with property development; conflicts of interest with our officers; changes in real estate and zoning laws and increases in real property tax rates; the consequences of any possible future terrorist attacks; and other risks and uncertainties detailed in our Annual Report on Form 10-K filed with the Securities and Exchange Commission.
|
Douglas Emmett, Inc.
|
CORPORATE DATA
as of March 31. 2012
|
|
|
|
|
Number of office properties owned
|
58 | ||||
|
Square feet owned (in thousands)
|
14,674 | ||||
|
Office leased rate
|
89.8 | % | |||
|
Office occupied rate
|
87.9 | % | |||
|
Office leased rate (excluding 8 properties owned by our unconsolidated real estate funds)
|
90.6 | % | |||
|
Office occupied rate (excluding 8 properties owned by our unconsolidated real estate funds)
|
88.8 | % | |||
|
Number of multifamily properties owned
|
9 | ||||
|
Number of multifamily units owned
|
2,868 | ||||
|
Multifamily leased rate
|
99.8 | % | |||
|
Market capitalization (in thousands, except price per share):
|
|||||
|
Closing price per share of common stock (NYSE:DEI)
|
$ | 22.81 | |||
|
Shares of common stock outstanding
|
139,631 | ||||
|
Fully diluted shares outstanding
|
173,013 | ||||
|
Equity capitalization (1)
|
$ | 3,946,417 | |||
|
Net debt(2)
|
$ | 3,100,612 | |||
|
Total enterprise value
|
$ | 7,047,029 | |||
|
Net debt/total enterprise value
|
44 | % |
|
(1)
|
Common equity capitalization represents our fully diluted shares multiplied by the closing price of our stock.
|
|
(2)
|
Net Debt consists of our consolidated debt, net of our existing cash and cash equivalents. It excludes the debt of our unconsolidated real estate funds.
|
NOTE: Please see the page titled "Definitions" at the end of this quarterly package for certain definitions.
3
|
Douglas Emmett, Inc.
|
PROPERTY SUMMARY
as of March 31, 2012
|
|
|
|
 |
 |
4
|
Douglas Emmett, Inc.
|
BOARD OF DIRECTORS AND EXECUTIVE OFFICERS
as of March 31, 2012
|
|
|
|
Corporate Offices
|
|
808 Wilshire Boulevard, Suite 200, Santa Monica, California 90401
|
|
|
Phone: (310) 255-7700
|
Our Board of Directors
|
Dan A. Emmett
|
Chairman of the Board – Douglas Emmett, Inc
|
|
|
Jordan L. Kaplan
|
Chief Executive Officer and President – Douglas Emmett, Inc.
|
|
|
Kenneth M. Panzer
|
Chief Operating Officer – Douglas Emmett, Inc.
|
|
|
Christopher Anderson
|
Retired Real Estate Executive and Investor
|
|
|
Leslie E. Bider
|
Chief Executive Officer – PinnacleCare
|
|
|
Dr. David T. Feinberg
|
Chief Executive Officer – University of California, Los Angeles (UCLA) Hospital System
Associate Vice Chancellor – UCLA Health Sciences
|
|
|
Ghebre Selassie Mehreteab
|
Former Chief Executive Officer – NHP Foundation
|
|
|
Thomas E. O’Hern
|
Senior Executive Vice President, Chief Financial Officer & Treasurer – Macerich Company
|
|
|
Dr. Andrea L. Rich
|
Former President and Chief Executive Officer – Los Angeles County Museum of Art (LACMA)
Former Executive Vice Chancellor and Chief Operating Officer – UCLA
|
Our Executive Officers
|
Dan A. Emmett
|
Chairman of the Board
|
|
|
Jordan L. Kaplan
|
Chief Executive Officer and President
|
|
|
Kenneth M. Panzer
|
Chief Operating Officer
|
|
|
William Kamer
|
Chief Investment Officer
|
|
|
Theodore E. Guth
|
Chief Financial Officer
|
For more information, please visit our website at www.douglasemmett.com or contact:
Stuart McElhinney, Vice President, Investor Relations
(310) 255-7745
smcelhinney@douglasemmett.com
5
|
Douglas Emmett, Inc.
|
|
|
|
|
CONSOLIDATED
FINANCIAL RESULTS
|
Douglas Emmett, Inc.
|
BALANCE SHEETS
(in thousands)
|
|
|
|
|
March 31, 2012
|
December 31, 2011
|
||||||||
|
(unaudited)
|
|||||||||
|
Assets
|
|||||||||
|
Investment in real estate:
|
|||||||||
|
Land
|
$ | 851,679 | $ | 851,679 | |||||
|
Buildings and improvements
|
5,234,806 | 5,233,692 | |||||||
|
Tenant improvements and lease intangibles
|
656,584 | 640,647 | |||||||
|
Investment in real estate, gross
|
6,743,069 | 6,726,018 | |||||||
|
Less: accumulated depreciation
|
(1,165,416 | ) | (1,119,619 | ) | |||||
|
Investment in real estate, net
|
5,577,653 | 5,606,399 | |||||||
|
Cash and cash equivalents
|
155,528 | 406,977 | |||||||
|
Tenant receivables, net
|
1,495 | 1,722 | |||||||
|
Deferred rent receivables, net
|
60,739 | 58,681 | |||||||
|
Interest rate contracts
|
58 | 699 | |||||||
|
Acquired lease intangible assets, net
|
5,929 | 6,379 | |||||||
|
Investment in unconsolidated real estate funds
|
151,025 | 117,055 | |||||||
|
Other assets
|
29,949 | 33,690 | |||||||
|
Total assets
|
$ | 5,982,376 | $ | 6,231,602 | |||||
|
Liabilities
|
|||||||||
|
Secured notes payable
|
$ | 3,256,140 | $ | 3,623,096 | |||||
|
Unamortized non-cash debt premium
|
- | 1,060 | |||||||
|
Interest rate contracts
|
92,545 | 98,417 | |||||||
|
Accrued interest payable
|
10,100 | 10,781 | |||||||
|
Accounts payable and accrued expenses
|
46,573 | 44,499 | |||||||
|
Acquired lease intangible liabilities, net
|
81,474 | 86,801 | |||||||
|
Security deposits
|
34,200 | 33,954 | |||||||
|
Dividends payable
|
20,945 | 17,039 | |||||||
|
Total liabilities
|
3,541,977 | 3,915,647 | |||||||
|
Equity
|
|||||||||
|
Douglas Emmett, Inc. stockholders' equity:
|
|||||||||
|
Common stock
|
1,396 | 1,311 | |||||||
|
Additional paid-in capital
|
2,612,542 | 2,461,649 | |||||||
|
Accumulated other comprehensive income (loss)
|
(82,743 | ) | (89,180 | ) | |||||
|
Accumulated deficit
|
(524,232 | ) | (508,674 | ) | |||||
|
Total Douglas Emmett, Inc. stockholders' equity
|
2,006,963 | 1,865,106 | |||||||
|
Noncontrolling interests
|
433,436 | 450,849 | |||||||
|
Total equity
|
2,440,399 | 2,315,955 | |||||||
|
Total liabilities and equity
|
$ | 5,982,376 | $ | 6,231,602 | |||||
6
|
Douglas Emmett, Inc.
|
QUARTERLY OPERATING RESULTS
(unaudited and in thousands, except per share data)
|
|
|
|
|
Three Months Ended March 31,
|
|||||||||
| 2012 | 2011 | ||||||||
|
Revenues:
|
|||||||||
|
Office rental:
|
|||||||||
|
Rental revenues
|
$ | 98,038 | $ | 99,210 | |||||
|
Tenant recoveries
|
9,975 | 9,325 | |||||||
|
Parking and other income
|
17,257 | 16,860 | |||||||
|
Total office revenues
|
125,270 | 125,395 | |||||||
|
Multifamily rental:
|
|||||||||
|
Rental revenues
|
16,748 | 16,045 | |||||||
|
Parking and other income
|
1,370 | 1,151 | |||||||
|
Total multifamily revenues
|
18,118 | 17,196 | |||||||
|
Total revenues
|
143,388 | 142,591 | |||||||
|
Operating Expenses:
|
|||||||||
|
Office expenses
|
40,947 | 40,604 | |||||||
|
Multifamily expenses
|
4,930 | 4,749 | |||||||
|
General and administrative
|
6,700 | 7,486 | |||||||
|
Depreciation and amortization
|
45,797 | 57,153 | |||||||
|
Total operating expenses
|
98,374 | 109,992 | |||||||
|
Operating income
|
45,014 | 32,599 | |||||||
|
Other income
|
233 | 256 | |||||||
|
Loss, including depreciation, from unconsolidated real estate funds
|
(984 | ) | (1,524 | ) | |||||
|
Interest expense
|
(37,561 | ) | (31,676 | ) | |||||
|
Net income (loss)
|
6,702 | (345 | ) | ||||||
|
Less: Net income attributable to noncontrolling interests
|
(1,316 | ) | (4 | ) | |||||
|
Net income (loss) attributable to common stockholders
|
$ | 5,386 | $ | (349 | ) | ||||
|
Net income per common share – basic
|
$ | 0.04 | $ | (0.00 | ) | ||||
|
Net income per common share – fully diluted
|
$ | 0.04 | $ | (0.00 | ) | ||||
|
Weighted average shares of common stock outstanding – basic
|
138,399 | 124,210 | |||||||
|
Weighted average shares of common stock outstanding – fully diluted
|
171,816 | 124,210 | (1) |
|
|||||
|
(1)
|
For the three months ended March 31, 2011, all potentially dilutive instruments, including OP units, stock options, and LTIP units have been excluded from the computation of weighted average dilutive shares outstanding because they were not dilutive.
|
NOTE: Please see the page titled "Definitions" at the end of this quarterly package for certain definitions.
7
|
Douglas Emmett, Inc.
|
FUNDS FROM OPERATIONS AND
ADJUSTED FUNDS FROM OPERATIONS
(unaudited and in thousands, except per share data)
|
|
|
|
|
Three Months Ended March 31,
|
|||||||||
| 2012 | 2011 | ||||||||
|
Funds From Operations (FFO)
|
|||||||||
|
Net income (loss) attributable to common stockholders
|
$ | 5,386 | $ | (349 | ) | ||||
|
Depreciation and amortization of real estate assets
|
45,797 | 57,153 | |||||||
|
Net income attributable to noncontrolling interests
|
1,316 | 4 | |||||||
|
Less: adjustments attributable to consolidated joint venture and
unconsolidated investment in real estate funds
|
3,074 | 3,120 | |||||||
|
FFO (before adjustments for terminated swaps)
|
55,573 | 59,928 | |||||||
|
Amortization of accumulated other comprehensive income
as a result of terminated swaps (1)
|
4,347 | 4,430 | |||||||
|
FFO (after adjustments for terminated swaps)
|
$ | 59,920 | $ | 64,358 | |||||
|
Adjusted Funds From Operations (AFFO)
|
|||||||||
|
FFO (after adjustments for terminated swaps)
|
$ | 59,920 | $ | 64,358 | |||||
|
Straight-line rent adjustment
|
(2,058 | ) | (3,425 | ) | |||||
|
Amortization of acquired above and below market leases
|
(4,877 | ) | (5,362 | ) | |||||
|
Amortization of interest rate contracts and loan premium
|
(996 | ) | (3,189 | ) | |||||
|
Amortization of prepaid financing
|
1,155 | 1,379 | |||||||
|
Recurring capital expenditures, tenant improvements and
leasing commissions
|
(13,827 | ) | (7,838 | ) | |||||
|
Non-cash compensation expense
|
2,181 | 2,479 | |||||||
|
Less: adjustments attributable to consolidated joint venture and
unconsolidated investment in real estate funds
|
(349 | ) | (569 | ) | |||||
|
AFFO
|
$ | 41,149 | $ | 47,833 | |||||
|
Weighted average share equivalents outstanding - fully diluted
|
171,816 | 157,983 | |||||||
|
FFO per share- fully diluted
|
$ | 0.35 | $ | 0.41 | |||||
|
Dividends per share declared
|
$ | 0.15 | $ | 0.10 | |||||
|
AFFO payout ratio
|
62.04 | 32.69 | % | ||||||
|
|
|
(1)
|
We terminated certain interest rate swaps in November 2010 and December 2011 in connection with the refinancing of related loans. In calculating FFO, we make an adjustment to treat debt interest rate swaps as terminated for all purposes in the quarter of termination. In contrast, under GAAP, terminated swaps can continue to impact net income over their original lives as if they were still outstanding. In the first quarter of 2011, GAAP net income was reduced by $4.4 million as a result of swaps terminated in November 2010. However, we offset that by an equivalent amount in calculating FFO, leaving a net zero impact as a result of terminated swaps on our first quarter 2011 FFO. Similarly, in the first quarter of 2012, GAAP net income was reduced by $4.3 million with respect to the swaps terminated in December 2011. However, we offset that by an equivalent amount in calculating FFO, leaving a net zero impact as a result of terminated swaps on our first quarter 2012 FFO.
|
NOTE: Please see the page titled "Definitions" at the end of this quarterly package for certain definitions.
8
|
Douglas Emmett, Inc.
|
SAME PROPERTY STATISTICAL AND FINANCIAL DATA
(unaudited and in thousands, except statistics)
|
|
|
|
|
As of March 31,
|
||||||
|
2012
|
2011
|
|||||
|
Same Property Office Statistics
|
||||||
|
Number of properties
|
50
|
50
|
||||
|
Rentable square feet
|
12,851,200
|
12,849,908
|
||||
|
Ending % leased
|
90.6
|
%
|
89.8
|
%
|
||
|
Ending % occupied
|
88.8
|
%
|
87.9
|
%
|
||
|
Quarterly average % occupied
|
88.6
|
%
|
88.0
|
%
|
||
|
Same Property Multifamily Statistics
|
||||||
|
Number of properties
|
9
|
9
|
||||
|
Number of units
|
2,868
|
2,868
|
||||
|
Ending % leased
|
99.8
|
%
|
99.6
|
%
|
||
|
Three Months Ended March 31,
|
% Favorable
|
||||||||||||
| 2012 | 2011 |
(Unfavorable)
|
|||||||||||
|
Same Property Net Operating Income - GAAP Basis
|
|||||||||||||
|
Total office revenues
|
$ | 125,270 | $ | 125,395 | (0.1 | ) % | |||||||
|
Total multifamily revenues
|
18,118 | 17,196 | 5.4 | ||||||||||
|
Total revenues
|
143,388 | 142,591 | 0.6 | ||||||||||
|
Total office expense
|
(40,947 | ) | (40,604 | ) | (0.8 | ) | |||||||
|
Total multifamily expense
|
(4,930 | ) | (4,749 | ) | (3.8 | ) | |||||||
|
Total property expense
|
(45,877 | ) | (45,353 | ) | (1.2 | ) | |||||||
|
Same Property NOI - GAAP basis
|
$ | 97,511 | $ | 97,238 | 0.3 | % | |||||||
|
Same Property Net Operating Income - Cash Basis
|
|||||||||||||
|
Total office revenues
|
$ | 119,224 | $ | 117,510 | 1.5 | % | |||||||
|
Total multifamily revenues
|
17,273 | 16,339 | 5.7 | ||||||||||
|
Total revenues
|
136,497 | 133,849 | 2.0 | ||||||||||
|
Total office expense
|
(40,992 | ) | (40,649 | ) | (0.8 | ) | |||||||
|
Total multifamily expense
|
(4,930 | ) | (4,749 | ) | (3.8 | ) | |||||||
|
Total property expense
|
(45,922 | ) | (45,398 | ) | (1.2 | ) | |||||||
|
Same Property NOI - cash basis
|
$ | 90,575 | $ | 88,451 | 2.4 | % | |||||||
NOTE: Please see the page titled "Definitions" at the end of this quarterly package for certain definitions.
9
|
Douglas Emmett, Inc.
|
RECONCILIATION OF SAME PROPERTY NOI
TO GAAP NET INCOME (LOSS)
(unaudited and in thousands)
|
|
|
|
|
Three Months Ended March 31,
|
|||||||||
| 2012 | 2011 | ||||||||
|
Same property office revenues - cash basis
|
$ | 119,224 | $ | 117,510 | |||||
|
GAAP adjustments
|
6,046 | 7,885 | |||||||
|
Same property office revenues - GAAP basis
|
125,270 | 125,395 | |||||||
|
Same property multifamily revenues - cash basis
|
17,273 | 16,339 | |||||||
|
GAAP adjustments
|
845 | 857 | |||||||
|
Same property multifamily revenues - GAAP basis
|
18,118 | 17,196 | |||||||
|
Same property revenues - GAAP basis
|
143,388 | 142,591 | |||||||
|
Same property office expenses - cash basis
|
(40,992 | ) | (40,649 | ) | |||||
|
GAAP adjustments
|
45 | 45 | |||||||
|
Same property office expenses - GAAP basis
|
(40,947 | ) | (40,604 | ) | |||||
|
Same property multifamily expenses - cash basis
|
(4,930 | ) | (4,749 | ) | |||||
|
GAAP adjustments
|
- | - | |||||||
|
Same property multifamily expenses - GAAP basis
|
(4,930 | ) | (4,749 | ) | |||||
|
Same property expenses - GAAP basis
|
(45,877 | ) | (45,353 | ) | |||||
|
Same property Net Operating Income (NOI) - GAAP basis
|
97,511 | 97,238 | |||||||
|
General and administrative expenses
|
(6,700 | ) | (7,486 | ) | |||||
|
Depreciation and amortization
|
(45,797 | ) | (57,153 | ) | |||||
|
Operating income
|
45,014 | 32,599 | |||||||
|
Other income
|
233 | 256 | |||||||
|
Loss, including depreciation, from unconsolidated real estate funds
|
(984 | ) | (1,524 | ) | |||||
|
Interest expense
|
(37,561 | ) | (31,676 | ) | |||||
|
Net income (loss)
|
6,702 | (345 | ) | ||||||
|
Less: Net income attributable to noncontrolling interests
|
(1,316 | ) | (4 | ) | |||||
|
Net income (loss) attributable to common stockholders
|
$ | 5,386 | $ | (349 | ) | ||||
NOTE: Please see the page titled "Definitions" at the end of this quarterly package for certain definitions.
10
|
Douglas Emmett, Inc.
|
OPERATING RESULTS OF
UNCONSOLIDATED REAL ESTATE FUNDS(1)
(unaudited and in thousands)
|
|
|
|
|
Three Months Ended March 31,
|
||||||||||
|
Summary Income Statement of Unconsolidated Real Estate Funds
|
2012 | 2011 | ||||||||
|
Office revenues
|
$ | 15,116 | $ | 14,198 | ||||||
|
Office expenses
|
(5,799 | ) | (5,866 | ) | ||||||
|
NOI
|
9,317 | 8,332 | ||||||||
|
General and administrative
|
(64 | ) | (54 | ) | ||||||
|
Depreciation and amortization
|
(6,812 | ) | (7,249 | ) | ||||||
|
Operating income
|
2,441 | 1,029 | ||||||||
|
Other income (expense)
|
3 | (36 | ) | |||||||
|
Interest expense
|
(5,926 | ) | (5,875 | ) | ||||||
|
Net loss
|
$ | (3,482 | ) | $ | (4,882 | ) | ||||
|
FFO of Unconsolidated Real Estate Funds
|
||||||||||
|
Net loss
|
$ | (3,482 | ) | $ | (4,882 | ) | ||||
|
Add back: depreciation and amortization
|
6,812 | 7,249 | ||||||||
|
FFO
|
$ | 3,330 | $ | 2,367 | ||||||
|
Three Months Ended March 31,
|
||||||||||
|
Douglas Emmett's Share of the Unconsolidated Real Estate Funds (2)
|
2012 | 2011 | ||||||||
|
Our share of the unconsolidated real estate funds' net loss
|
$ | (1,856 | ) | $ | (2,268 | ) | ||||
|
Add back: our share of the funds' depreciation and amortization
|
3,246 | 3,274 | ||||||||
|
Equity allocation and basis difference
|
872 | 744 | ||||||||
|
Our share of the unconsolidated real estate funds' FFO
|
$ | 2,262 | $ | 1,750 | ||||||
|
|
||
|
(1)
|
We manage, and have a significant investment in, two unconsolidated institutional real estate funds which owned 8 properties at March 31, 2012. With limited exceptions, these unconsolidated Funds are our exclusive investment vehicle until October 2012, using our same underwriting and leverage principles and focusing primarily on our same markets. Our unconsolidated Funds have combined equity commitments totaling $554.7 million, of which approximately $167.3 million remained undrawn as of March 31, 2012. These amounts included commitments from us of $246.4 million, of which $38.5 million remained undrawn as of March 31, 2012. We receive a pro rata share of any distributions based on our investment, additional distributions based on the total committed capital and a carried interest if the investors’ distributions exceed a hurdle rate. We also receive fees and reimbursement of expenses for managing our unconsolidated Funds’ properties.
|
|
|
(2)
|
We acquired a 16.3% interest in Douglas Emmett Fund X, LLC on March 1, 2012, increasing (i) our weighted average interest in that fund to 54.24% for the quarter ended March 31, 2012 from 48.82% for the quarter ended March 31, 2011, and (ii) our weighted average interest in Douglas Emmett Partnership X, LP to 22.01% for the quarter ended March 31, 2012 from 21.52% for the quarter ended March 31, 2011.
|
|
NOTE: Please see the page titled "Definitions" at the end of this quarterly package for certain definitions.
11
|
Douglas Emmett, Inc.
|
DEBT BALANCES
(unaudited and in thousands)
|
|
|
|
|
at March 31, 2012
|
Effective Annual Rate (2)(3)
|
Maturity Date
|
|||||||||
| $ |
16,140
|
(4)
|
LIBOR + 1.85%
|
03/03/14
|
|||||||
|
111,920
|
(5)
|
DMBS + 0.707%
|
02/01/15
|
||||||||
|
340,000
|
4.77%
|
04/01/15
|
|||||||||
|
82,000
|
LIBOR + 0.62%
|
02/01/16
|
|||||||||
|
18,000
|
5.82%
|
06/01/17
|
|||||||||
|
400,000
|
4.45%
|
10/02/17
|
|||||||||
|
510,000
|
4.12%
|
04/02/18
|
|||||||||
|
530,000
|
3.74%
|
08/01/18
|
|||||||||
|
355,000
|
(6)
|
4.14%
|
08/05/18
|
||||||||
|
155,000
|
(7)
|
4.00%
|
02/01/19
|
||||||||
|
350,000
|
(8)
|
4.46%
|
03/01/20
|
(9)
|
|||||||
|
388,080
|
3.65%
|
11/02/20
|
|||||||||
| $ |
3,256,140
|
||||||||||
|
(1)
|
As of March 31, 2012, the weighted average remaining life of our outstanding debt was 6.1 years. Of the $3.05 billion of debt on which the interest rate was fixed under the terms of the loan or a swap, the weighted average remaining life was 6.3 years, the weighted average remaining period during which interest was fixed was 4.6 years and the weighted average annual interest rate was 4.16%. Including the non-cash amortization of interest rate contracts and prepaid financing, the effective weighted average interest rate was 4.44%. Except as otherwise noted, each loan is secured by a separate collateral pool consisting of one or more properties, requiring monthly payments of interest only with outstanding principal due upon maturity.
|
|
(2)
|
Includes the effect of interest rate contracts and excludes amortization of prepaid financing, all shown on an actual/360-day basis.
|
|
(3)
|
The termination date of swaps fixing the rate on these loans is generally one to two years prior to the maturity of the loan as follows: $340 million loan, Jan-2013; $18 million loan, Jun-2012; $400 million loan, Jul-2015; $510 million loan, Apr-2016; $530 million loan, Aug-2016; and $388.08 million loan, Nov-2017.
|
|
(4)
|
The borrower is a consolidated entity in which our Operating Partnership owns a two-thirds interest.
|
|
(5)
|
The loan has a $75 million tranche bearing interest at DMBS + 0.76% and a $36.92 million tranche bearing interest at DMBS + 0.60%
|
|
(6)
|
Interest-only until February 2016, with principal amortization thereafter based upon a 30-year amortization table.
|
|
(7)
|
Interest-only until February 2015, with principal amortization thereafter based upon a 30-year amortization table.
|
|
(8)
|
Interest at a fixed interest rate until March 1, 2018 and a floating rate thereafter, with interest-only payments until March 2014 and payments thereafter based upon a 30-year amortization table.
|
|
(9)
|
Extension of the maturity date past March 1, 2018 is subject to certain conditions.
|
|
Our Share of Unconsolidated Fund Debt
|
at Mar. 31, 2012
|
Effective Annual Fixed Rate
|
Maturity Date
|
||||||||||
| $ | 237,592 | (1) | 5.52 | % |
08/19/13
|
||||||||
| 12,661 | (2) | 5.67 | % |
04/01/16
|
|||||||||
| $ | 250,253 | ||||||||||||
|
|
|
(1)
|
Represents our share of a $365 million loan to one of our unconsolidated real estate Funds. Secured by six properties in a collateralized pool. Requires monthly payments of interest only, with outstanding principal due upon maturity. The termination date of the swaps fixing the rate on this loan is September 2012.
|
|
(2)
|
Represents our share of a $55.0 million amortizing loan to one of our unconsolidated real estate Funds. Secured by one property. Requires monthly payments of principal and interest.
|
12
|
Douglas Emmett, Inc.
|
|
|
|
|
PORTFOLIO DATA
|
Douglas Emmett, Inc.
|
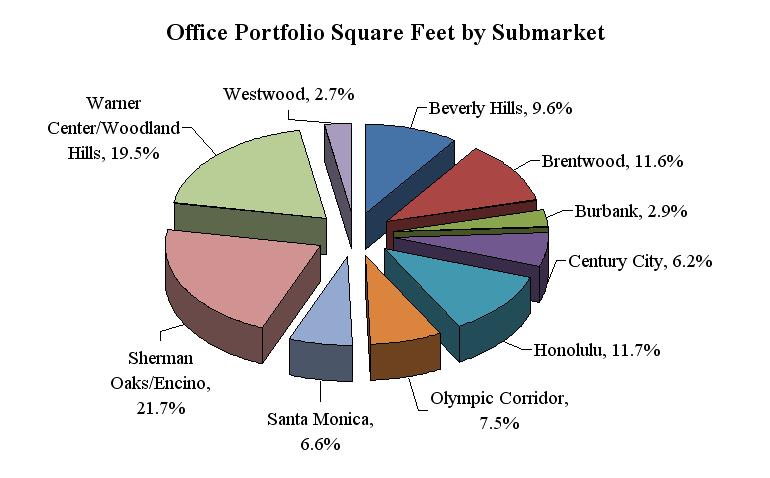
OFFICE PORTFOLIO SUMMARY
as of March 31, 2012
|
|
|
|
|
Number of Properties
|
Rentable Square
Feet
|
Square Feet as a Percent of Total
|
|||||||||||||
|
Beverly Hills
|
7 | 1,416,762 | 9.6 | % | |||||||||||
|
Brentwood
|
14 | 1,700,885 | 11.6 | ||||||||||||
|
Burbank
|
1 | 420,949 | 2.9 | ||||||||||||
|
Century City
|
3 | 916,059 | 6.2 | ||||||||||||
|
Honolulu
|
4 | 1,716,698 | 11.7 | ||||||||||||
|
Olympic Corridor
|
5 | 1,098,068 | 7.5 | ||||||||||||
|
Santa Monica
|
8 | 970,704 | 6.6 | ||||||||||||
|
Sherman Oaks/Encino
|
11 | 3,181,254 | 21.7 | ||||||||||||
|
Warner Center/Woodland Hills
|
3 | 2,855,909 | 19.5 | ||||||||||||
|
Westwood
|
2 | 396,807 | 2.7 | ||||||||||||
|
Total
|
58 | 14,674,095 | 100.0 | % | |||||||||||
NOTE: Please see the page titled "Definitions" at the end of this quarterly package for certain definitions.
13
|
Douglas Emmett, Inc.
|
OFFICE PORTFOLIO PERCENT LEASED AND IN-PLACE RENTS
as of March 31, 2012
|
|
|
|
|
Percent Leased(1)
|
Annualized Rent
|
Annualized Rent Per Leased Square Foot (2)
|
Monthly Rent Per Leased Square Foot
|
|||||||||||||||
|
Beverly Hills
|
90.8 | % | $ | 50,914,353 | $ | 42.20 | $ | 3.52 | ||||||||||
|
Brentwood
|
85.9 | 54,854,796 | 38.92 | 3.24 | ||||||||||||||
|
Burbank
|
100.0 | 14,325,620 | 34.03 | 2.84 | ||||||||||||||
|
Century City
|
95.5 | 32,360,312 | 37.54 | 3.13 | ||||||||||||||
|
Honolulu
|
90.4 | 47,807,389 | 32.59 | 2.72 | ||||||||||||||
|
Olympic Corridor
|
90.7 | 32,048,281 | 32.94 | 2.75 | ||||||||||||||
|
Santa Monica (3)
|
97.7 | 50,619,392 | 54.24 | 4.52 | ||||||||||||||
|
Sherman Oaks/Encino
|
93.2 | 91,432,921 | 32.04 | 2.67 | ||||||||||||||
|
Warner Center/Woodland Hills
|
80.8 | 66,103,552 | 29.55 | 2.46 | ||||||||||||||
|
Westwood
|
91.2 | 12,984,348 | 37.28 | 3.11 | ||||||||||||||
|
Total / Weighted Average
|
89.8 | $ | 453,450,964 | 35.67 | 2.97 | |||||||||||||
|
Recurring Capital Expenditures
|
||||||||||||||||||
|
- Office (per rentable square foot) for the three months ended March 31, 2012
|
$ | 0.04 | ||||||||||||||||
|
|
|
(1)
|
Includes 277,858 square feet with respect to signed leases not yet commenced.
|
|
(2)
|
Represents annualized rent divided by leased square feet (excluding 277,858 square feet with respect to signed leases not commenced).
|
|
(3)
|
Includes $1,332,386 of annualized rent attributable to our corporate headquarters at our Lincoln/Wilshire property.
|
NOTE: Please see the page titled "Definitions" at the end of this quarterly package for certain definitions.
14
|
Douglas Emmett, Inc.
|
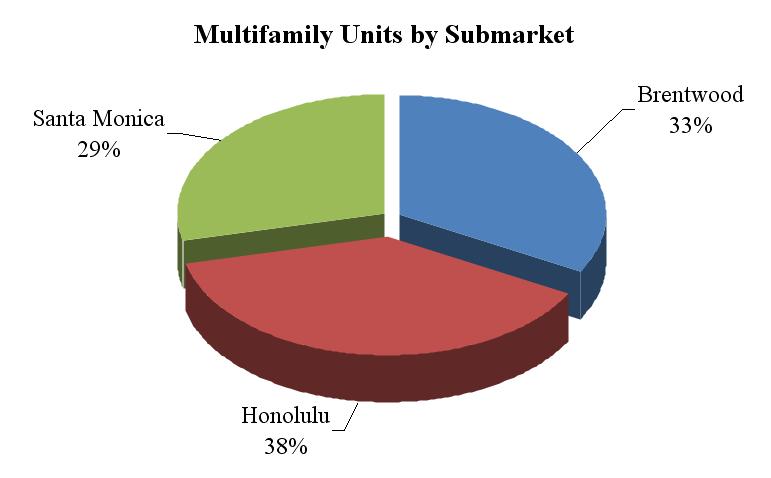
MULTIFAMILY PORTFOLIO SUMMARY
as of March 31, 2012
|
|
|
|
|
Submarket
|
Number of Properties
|
Number of Units
|
Units as a Percent of Total
|
|||||||||||
|
Brentwood
|
5
|
950
|
33
|
%
|
||||||||||
|
Honolulu
|
2
|
1,098
|
38
|
|||||||||||
|
Santa Monica
|
2
|
820
|
29
|
|||||||||||
|
Total
|
9
|
2,868
|
100
|
%
|
||||||||||
|
Submarket
|
Percent Leased
|
Annualized Rent
|
Monthly Rent Per Leased Unit
|
|||||||||||
|
Brentwood
|
99.6
|
%
|
$
|
23,261,441
|
$
|
2,049
|
||||||||
|
Honolulu
|
100.0
|
18,995,028
|
1,442
|
|||||||||||
|
Santa Monica(1)
|
99.8
|
22,387,296
|
2,281
|
|||||||||||
|
Total / Weighted Average
|
99.8
|
$
|
64,643,765
|
$
|
1,882
|
|||||||||
|
Recurring Capital Expenditures
|
|||||
|
- Multifamily (per unit) for the three months ended March 31, 2012
|
$ | 110 | |||
|
|
|
(1)
|
Excludes 8,013 square feet of ancillary retail space generating annualized rent of $221,971.
|
NOTE: Please see the page titled "Definitions" at the end of this quarterly package for certain definitions.
15
|
Douglas Emmett, Inc.
|
OFFICE TENANT DIVERSIFICATION
(1.0% or Greater of Annualized Rent)
as of March 31, 2012
|
|
|
|
|
Number of Leases
|
Number of Properties
|
Lease Expiration(1)
|
Total
Leased Square
Feet
|
Percent of Rentable Square Feet
|
Annualized Rent
|
Percent of Annualized Rent
|
||||||||||
|
Time Warner (2)
|
4
|
4
|
2013-2020
|
625,748
|
4.3
|
%
|
$21,409,630
|
4.7
|
%
|
|||||||
|
William Morris Endeavor (3)
|
2
|
1
|
2027
|
159,333
|
1.1
|
7,775,553
|
1.7
|
|||||||||
|
AIG (Sun America Life Insurance)
|
1
|
1
|
2013
|
182,010
|
1.2
|
6,052,536
|
1.4
|
|||||||||
|
Bank of America (4)
|
12
|
9
|
2012-2018
|
132,508
|
0.9
|
5,447,280
|
1.2
|
|||||||||
|
The Macerich Partnership, L.P.
|
1
|
1
|
2018
|
90,832
|
0.6
|
4,579,779
|
1.0
|
|||||||||
|
Total
|
20
|
16
|
1,190,431
|
8.1
|
%
|
$45,264,778
|
10.0
|
%
|
||||||||
|
|
|
(1)
|
Expiration dates are per leases and do not assume exercise of renewal, extension or termination options. For tenants with multiple leases, other than storage, ATM and similar leases, expirations are shown as a range.
|
|
(2)
|
Includes a 10,000 square foot lease expiring in October 2013, a 150,000 square foot lease expiring in April 2016, a 421,000 square foot lease expiring in September 2019 and a 45,000 square foot lease expiring in December 2020.
|
|
(3)
|
Includes a 157,000 square foot lease expiring in June 2027 and a 2,000 square foot month-to-month storage lease. Does not include an additional 19,000 square feet under leases that commence in 2012 and 2013, expiring in 2027.
|
|
(4)
|
Includes a 21,000 square foot lease expiring in September 2012, an 8,000 square foot lease expiring in July 2013, a 7,000 square foot lease expiring in March 2014, a 9,000 square foot lease expiring in September 2014, an 11,000 square foot lease expiring in October 2014, an 11,000 square foot lease expiring in November 2014, a 4,000 square foot lease expiring in February 2015, a 21,000 square foot lease expiring in February 2015, a 6,000 square foot lease expiring in May 2015, a 23,000 square foot lease expiring in December 2015, a 12,000 square foot lease expiring in March 2018 and a small ATM lease.
|
NOTE: Please see the page titled "Definitions" at the end of this quarterly package for certain definitions.
16
|
Douglas Emmett, Inc.
|
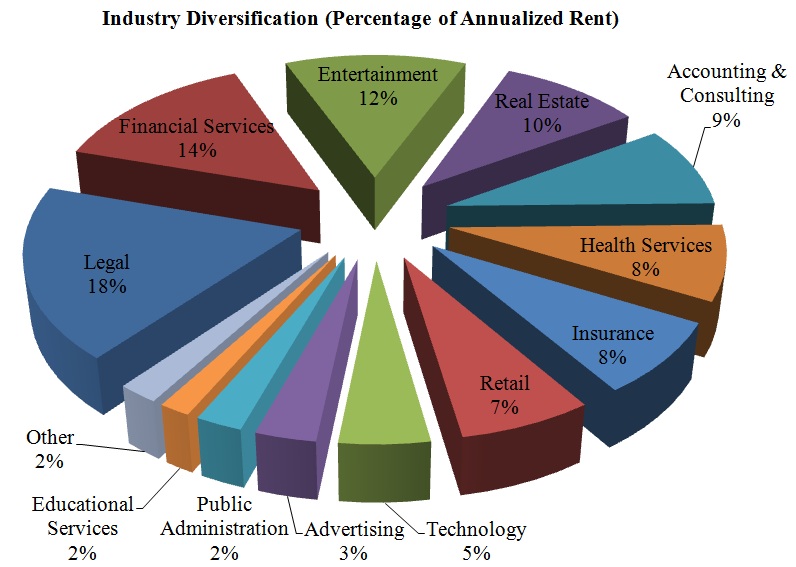
INDUSTRY DIVERSIFICATION
as of March 31, 2012
|
|
|
|
|
Industry
|
Number of Leases
|
Annualized Rent as a Percent of Total
|
|||||||
|
Legal
|
463
|
18.5
|
%
|
||||||
|
Financial Services
|
300
|
14.2
|
|||||||
|
Entertainment
|
141
|
12.5
|
|||||||
|
Real Estate
|
170
|
9.7
|
|||||||
|
Accounting & Consulting
|
283
|
8.7
|
|||||||
|
Health Services
|
310
|
8.0
|
|||||||
|
Insurance
|
104
|
7.8
|
|||||||
|
Retail
|
185
|
6.8
|
|||||||
|
Technology
|
103
|
4.6
|
|||||||
|
Advertising
|
69
|
3.1
|
|||||||
|
Public Administration
|
66
|
2.4
|
|||||||
|
Educational Services
|
22
|
1.6
|
|||||||
|
Other
|
94
|
2.1
|
|||||||
|
Total
|
2,310
|
100.0
|
%
|
||||||
NOTE: Please see the page titled "Definitions" at the end of this quarterly package for certain definitions.
.
17
|
Douglas Emmett, Inc.
|
OFFICE LEASE DISTRIBUTION
as of March 31, 2012
|
|
|
|
|
Number of Leases
|
Leases as a Percent of Total
|
Rentable Square Feet
|
Square Feet as a Percent of Total
|
Annualized Rent
|
Annualized Rent as a Percent of Total
|
||||||||||||
|
2,500 or less
|
1,199
|
51.9
|
% |
1,617,906
|
11.0
|
% |
$57,706,604
|
12.7
|
% | ||||||||
|
2,501-10,000
|
804
|
34.8
|
3,873,641
|
26.4
|
136,443,305
|
30.1
|
|||||||||||
|
10,001-20,000
|
202
|
8.8
|
2,795,921
|
19.0
|
101,572,587
|
22.4
|
|||||||||||
|
20,001-40,000
|
81
|
3.5
|
2,190,384
|
14.9
|
76,249,294
|
16.8
|
|||||||||||
|
40,001-100,000
|
19
|
0.8
|
1,197,708
|
8.2
|
45,140,164
|
10.0
|
|||||||||||
|
Greater than 100,000
|
5
|
0.2
|
1,035,794
|
7.1
|
36,339,010
|
8.0
|
|||||||||||
|
Subtotal
|
2,310
|
100
|
% |
12,711,354
|
(2)
|
86.6
|
% |
453,450,964
|
100
|
% | |||||||
|
Signed leases not commenced
|
-
|
-
|
277,858
|
1.9
|
-
|
-
|
|||||||||||
|
Available
|
-
|
-
|
1,499,193
|
10.2
|
-
|
-
|
|||||||||||
|
Building Management Use
|
-
|
-
|
100,629
|
0.7
|
-
|
-
|
|||||||||||
|
BOMA Adjustment(1)
|
-
|
-
|
85,061
|
0.6
|
-
|
-
|
|||||||||||
|
Total
|
2,310
|
100
|
% |
14,674,095
|
100
|
% |
$453,450,964
|
100
|
% |
|
|
|
(1)
|
Represents square footage adjustments for leases that do not reflect BOMA 1996 remeasurement.
|
|
(2)
|
Average tenant size is approximately 5,500 square feet. Median tenant size is approximately 2,400 square feet.
|
NOTE: Please see the page titled "Definitions" at the end of this quarterly package for certain definitions.
18
|
Douglas Emmett, Inc.
|
OFFICE LEASE EXPIRATIONS
as of March 31, 2012
|
|
|
|
|
Year of Lease Expiration
|
Number of Leases Expiring
|
Rentable Square Feet
|
Expiring Square Feet as a Percent of Total
|
Annualized Rent
|
Annualized Rent as a Percent of Total
|
Annualized Rent Per Leased Square Foot(1)
|
Annualized Rent Per Leased Square Foot at Expiration(2)
|
|||||||||||||||||||||||
| 2012 | 380 | 1,267,722 | 8.6 | % | $ | 45,287,353 | 10.0 | % | $ | 35.72 | $ | 35.86 | ||||||||||||||||||
| 2013 | 455 | 1,895,201 | 12.9 | 73,526,533 | 16.2 | 38.80 | 39.95 | |||||||||||||||||||||||
| 2014 | 404 | 1,904,094 | 13.0 | 67,570,724 | 14.9 | 35.49 | 37.45 | |||||||||||||||||||||||
| 2015 | 317 | 1,677,500 | 11.4 | 56,983,202 | 12.6 | 33.97 | 36.93 | |||||||||||||||||||||||
| 2016 | 303 | 1,760,066 | 12.0 | 58,960,675 | 13.0 | 33.50 | 36.84 | |||||||||||||||||||||||
| 2017 | 219 | 1,390,030 | 9.5 | 46,583,471 | 10.3 | 33.51 | 37.10 | |||||||||||||||||||||||
| 2018 | 88 | 698,664 | 4.8 | 28,410,306 | 6.3 | 40.66 | 47.11 | |||||||||||||||||||||||
| 2019 | 47 | 844,275 | 5.8 | 29,597,518 | 6.5 | 35.06 | 42.15 | |||||||||||||||||||||||
| 2020 | 45 | 447,625 | 3.0 | 15,143,816 | 3.3 | 33.83 | 42.28 | |||||||||||||||||||||||
| 2021 | 35 | 395,036 | 2.7 | 13,310,147 | 2.9 | 33.69 | 41.02 | |||||||||||||||||||||||
|
Thereafter
|
17 | 431,141 | 2.9 | 18,077,219 | 4.0 | 41.93 | 58.11 | |||||||||||||||||||||||
|
Subtotal/Weighted Average
|
2,310 | 12,711,354 | 86.6 | 453,450,964 | 100.0 | 35.67 | 39.30 | |||||||||||||||||||||||
|
Signed leases not commenced
|
- | 277,858 | 1.9 | - | - | - | - | |||||||||||||||||||||||
|
Available
|
- | 1,499,193 | 10.2 | - | - | - | - | |||||||||||||||||||||||
|
Building Management Use
|
- | 100,629 | 0.7 | - | - | - | - | |||||||||||||||||||||||
|
BOMA Adjustment(3)
|
- | 85,061 | 0.6 | - | - | - | - | |||||||||||||||||||||||
|
Total/Weighted Average
|
2,310 | 14,674,095 | 100.0 | % | $ | 453,450,964 | 100.0 | % | $ | 35.67 | $ | 39.30 | ||||||||||||||||||
|
|
|
(1)
|
Represents annualized base rent divided by leased square feet.
|
|
(2)
|
Represents annualized base rent at expiration divided by leased square feet.
|
|
(3)
|
Represents the square footage adjustments for leases that do not reflect BOMA 1996 remeasurement.
|
NOTE: Please see the page titled "Definitions" at the end of this quarterly package for certain definitions.
19
|
Douglas Emmett, Inc.
|
QUARTERLY OFFICE LEASE EXPIRATIONS – NEXT FOUR QUARTERS
as of March 31, 2012
|
|
|
|
|
Submarket
|
Q2 2012 | Q3 2012 | Q4 2012 | Q1 2013 | |||||||||||||||||||
|
Beverly Hills
|
Expiring SF(1)
|
49,914 | 24,509 | 38,342 | 26,824 | ||||||||||||||||||
|
Rent per SF
|
$ | 35.66 | $ | 47.87 | $ | 41.81 | $ | 46.26 | |||||||||||||||
|
Brentwood
|
Expiring SF(1)
|
63,673 | 39,084 | 97,056 | 62,297 | ||||||||||||||||||
|
Rent per SF
|
$ | 42.81 | $ | 45.07 | $ | 40.11 | $ | 38.54 | |||||||||||||||
|
Burbank
|
Expiring SF(1)
|
- | - | - | - | ||||||||||||||||||
|
Rent per SF
|
- | - | - | - | |||||||||||||||||||
|
Century City
|
Expiring SF(1)
|
16,122 | 23,635 | 42,441 | 41,160 | ||||||||||||||||||
|
Rent per SF
|
$ | 36.90 | $ | 33.45 | $ | 40.44 | $ | 36.78 | |||||||||||||||
|
Honolulu
|
Expiring SF(1)
|
80,265 | 21,352 | 43,522 | 47,498 | ||||||||||||||||||
|
Rent per SF
|
$ | 30.50 | $ | 34.89 | $ | 33.72 | $ | 34.00 | |||||||||||||||
|
Olympic Corridor
|
Expiring SF(1)
|
23,427 | 23,818 | 63,529 | 79,070 | ||||||||||||||||||
|
Rent per SF
|
$ | 32.82 | $ | 35.05 | $ | 38.44 | $ | 33.66 | |||||||||||||||
|
Santa Monica
|
Expiring SF(1)
|
8,822 | 34,993 | 41,280 | 18,493 | ||||||||||||||||||
|
Rent per SF
|
$ | 38.49 | $ | 55.51 | $ | 41.78 | $ | 64.41 | |||||||||||||||
|
Sherman Oaks/Encino
|
Expiring SF(1)
|
77,888 | 85,258 | 126,998 | 21,452 | ||||||||||||||||||
|
Rent per SF
|
$ | 27.72 | $ | 34.13 | $ | 31.62 | $ | 30.56 | |||||||||||||||
|
Warner Center/Woodland Hills
|
Expiring SF(1)
|
73,829 | 63,232 | 69,833 | 23,428 | ||||||||||||||||||
|
Rent per SF
|
$ | 30.84 | $ | 31.07 | $ | 28.96 | $ | 31.90 | |||||||||||||||
|
Westwood
|
Expiring SF(1)
|
2,954 | 10,259 | 21,687 | - | ||||||||||||||||||
|
Rent per SF
|
$ | 33.60 | $ | 45.22 | $ | 36.87 | - | ||||||||||||||||
|
Total
|
Expiring SF(1)
|
396,894 | 326,140 | 544,688 | 320,222 | ||||||||||||||||||
|
Rent per SF
|
$ | 33.24 | $ | 38.59 | $ | 36.14 | $ | 37.56 | |||||||||||||||
|
|
|
(1)
|
Includes all remaining leases which have an expiration date in the applicable quarter and which had not been renewed or extended as of March 31, 2012, including leases where someone other than the tenant (for example a subtenant) had already executed a new lease for the space as of March 31, 2012. All month-to-month tenants are included in the expiring leases in the first quarter listed.
|
NOTE: Please see the page titled "Definitions" at the end of this quarterly package for certain definitions.
20
|
Douglas Emmett, Inc.
|
OFFICE PORTFOLIO LEASING ACTIVITY
for the three months ended March 31, 2012
|
|
|
|
|
Net Absorption (1)
|
|||||||||||
|
Leased rentable square feet
|
68,730 | ||||||||||
|
Net absorption % of leased rentable square feet
|
0.47 | % | |||||||||
|
Gross Leasing Activity
|
Number of leases
|
Rentable square feet
|
|||||||||
|
New
|
70 | 218,190 | |||||||||
|
Renewal
|
92 | 390,464 | |||||||||
|
Total
|
162 | 608,654 | |||||||||
|
Weighted Average Lease Terms
|
|||||||||||
|
New (in months)
|
53 | ||||||||||
|
Renewal (in months)
|
59 | ||||||||||
|
Blended (in months)
|
57 | ||||||||||
|
Quarterly Rent Change
|
Cash Rent(2)
|
Straight-Line Rent(3)
|
|||||||||
|
Expiring Rate
|
$ | 37.45 | $ | 35.29 | |||||||
|
New/Renewal Rate
|
$ | 31.83 | $ | 32.86 | |||||||
|
Change
|
(15.0 | %) | (6.9 | %) | |||||||
|
Tenant Improvement and Leasing Commissions (4)
|
Total Lease Transaction Costs
|
Annual Lease Transaction Costs
|
|||||||||
|
New leases
|
$ | 21.39 | $ | 4.86 | |||||||
|
Renewal leases
|
$ | 14.84 | $ | 3.02 | |||||||
|
Blended
|
$ | 17.19 | $ | 3.63 | |||||||
|
|
|
(1)
|
Excludes any property acquired during the quarter.
|
|
(2)
|
Represents the difference between initial stabilized cash rents on new and renewal leases as compared to the expiring cash rents on the same space.
|
|
(3)
|
Represents a comparison between straight-line rent on expiring leases and the straight-line rent for new and renewal leases on the same space.
|
|
(4)
|
Per rentable square foot. Represents weighted average lease transaction costs based on the leases executed in the current quarter in our properties.
|
NOTE: Please see the page titled "Definitions" at the end of this quarterly package for certain definitions.
21
|
Douglas Emmett, Inc.
|
DEFINITIONS
|
|
|
|
|
Adjusted Funds From Operations (AFFO): Adjusted Funds From Operations (AFFO) is a non-GAAP financial measure we believe can be a useful supplemental measure of our performance. We compute AFFO by adding to FFO the non-cash compensation expense, amortization of prepaid financing costs and straight-line rents, and then subtracting recurring capital expenditures, tenant improvements and leasing commissions. AFFO is not intended to represent cash flow for the period, and it only provides an additional perspective on our ability to fund cash needs and make distributions to stockholders by adjusting the effect of the non-cash items included in FFO, as well as recurring capital expenditures and leasing costs. We believe that net income is the most directly comparable GAAP financial measure to AFFO. We also believe that AFFO provides useful information to the investment community about our financial position as compared to other REITs since AFFO is a widely reported measure used by other REITs. However, other REITs may use different methodologies for calculating AFFO and, accordingly, our AFFO may not be comparable to that of other REITs.
|
|
Annualized Rent: Represents annualized monthly cash base rent (i.e., excludes tenant reimbursements, parking and other revenue) before abatements under leases commenced as of the measurement date (does not include 277,858 square feet with respect to signed leases not yet commenced at March 31, 2012). For our triple net Burbank and Honolulu office properties, annualized rent is calculated by adding expense reimbursements to base rent.
|
|
Fully Diluted Shares: Represents ownership in our company through shares of common stock, units in our Operating Partnership and other convertible equity instruments. Basic and diluted shares are calculated in accordance with GAAP and include common stock plus dilutive equity instruments, as appropriate. During the three months ended March 31, 2011 , for GAAP purposes, all potentially dilutive instruments, including stock options, OP units and LTIP units (Long-Term Incentive Plan units that are limited partnership units in our Operating Partnership) have been excluded from our computation of weighted average dilutive shares outstanding because they were not dilutive.
|
|
Funds From Operations (FFO): We calculate funds from operations before noncontrolling interest (FFO) in accordance with the standards established by the National Association of Real Estate Investment Trusts (NAREIT), adjusted to treat debt interest rate swaps as terminated for all purposes in the quarter of termination. FFO represents net income (loss), computed in accordance with accounting principles generally accepted in the United States (GAAP), excluding gains (or losses) from sales of depreciable operating property, real estate depreciation and amortization (other than amortization of deferred financing costs) and after adjustments for unconsolidated partnerships and joint ventures. We provide FFO as a supplemental performance measure because, by excluding real estate depreciation, amortization and gains and losses from property dispositions, it can illustrate trends in occupancy rates, rental rates and operating costs from year to year. We also believe that, as a widely recognized measure of the performance of REITs, FFO can be used by investors as a basis to compare our operating performance with that of other REITs. However, FFO has limitations as a measure of our performance because it excludes depreciation and amortization and captures neither the changes in the value of our properties that result from use or market conditions nor the level of capital expenditures and leasing commissions necessary to maintain the operating performance of our properties, all of which have real economic effect and could materially impact our results from operations. Other equity REITs may not calculate FFO in accordance with the NAREIT definition and, accordingly, our FFO may not be comparable to those other REITs’ FFO. Accordingly, FFO should be considered only as a supplement to net income as a measure of our performance. FFO should not be used as a measure of our liquidity, nor is it indicative of funds available to fund our cash needs, including our ability to pay dividends. FFO should not be used as a supplement to or substitute measure for cash flow from operating activities computed in accordance with GAAP.
|
22
|
Douglas Emmett, Inc.
|
DEFINITIONS
|
|
|
|
|
Net Operating Income (NOI): Net operating income (NOI) is a non-GAAP measure consisting of the revenue and expense attributable to the real estate properties that we own and operate. We present two forms of NOI:
· “NOI--GAAP basis” is calculated by excluding the following from our net income (or loss): general and administrative expense, depreciation and amortization expense, interest income, interest expense, income (or loss) from unconsolidated partnerships, income (or loss) attributable to noncontrolling interests, gains (or losses) from sales of depreciable operating properties, net income (or loss) from discontinued operations and extraordinary items.
· “NOI--Cash basis” is calculated by excluding from GAAP basis NOI our straight-line rent adjustments and the amortization of above/below market lease intangible assets and liabilities.
We provide NOI as a supplemental performance measure because, by excluding real estate depreciation and amortization expense and gains (or losses) from property dispositions, some investors use it to illustrate trends in occupancy rates, rental rates and operating costs from year to year. We also believe that NOI can be useful to investors as a basis to compare our operating performance with that of other REITs. However, NOI has limitations as a measure of our performance because it excludes depreciation and amortization expense and captures neither the changes in the value of our properties that result from use or market conditions, nor the level of capital expenditures and leasing commissions necessary to maintain the operating performance of our properties (all of which have real economic effect and could materially impact our results from operations). Other equity REITs may not calculate NOI in a similar manner and, accordingly, our NOI may not be comparable to those other REITs’ NOI. Accordingly, NOI should be considered only as a supplement to net income as a measure of our performance. NOI should not be used as a measure of our liquidity, nor is it indicative of funds available to fund our cash needs, including our ability to pay dividends. NOI should not be used as a substitute measure for cash flow from operating activities computed in accordance with GAAP.
|
|
Occupied: Represents percent leased less signed leases not yet commenced.
|
|
Properties Owned: All properties included are 100% owned except 8 properties totaling 1.8 million square feet owned by our unconsolidated real estate Funds and a 79,000 square foot property owned by a joint venture in which we own a 66.7% interest.
|
|
Quarterly Average Percent Occupied: Represents the average of the percentage occupied on the last day of the period and the percent occupied on the last day of the prior period.
|
|
Rentable Square Feet: Based on BOMA 1996 remeasurement. Total consists of 12,989,212 leased square feet (includes 277,858 square feet with respect to signed leases not commenced), 1,499,193 available square feet, 100,629 building management use square feet, and 85,061 square feet of BOMA 1996 adjustment on leased space.
|
|
Same Property NOI: To facilitate a comparison of NOI between periods, we calculate comparable amounts for a subset of our owned properties referred to as our “same properties.” Same property amounts are calculated as the amounts attributable to properties which have been owned and operated by us, and reported in our consolidated results, during the entire span of both periods compared. Therefore, any properties either acquired after the first day of the earlier comparison period or sold, contributed or otherwise removed from our consolidated financial statements before the last day of the later comparison period are excluded from same properties. We may also exclude from the same property set any property that is undergoing a major repositioning project that would impact the comparability of its results between two periods.
|
|
Shares of Common Stock outstanding: Represents undiluted shares, and so does not include OP units or other convertible equity instruments.
|