Attached files
| file | filename |
|---|---|
| 8-K - FORM 8-K - VALLEY NATIONAL BANCORP | d343191d8k.htm |
 Investor
Presentation EXHIBIT 99.1
©
2012 Valley National Bank. Member FDIC. Equal Opportunity Lender.
|
 The foregoing
contains forward-looking statements within the meaning of the Private Securities Litigation Reform Act of 1995. Such
statements are not historical facts and include expressions about management’s confidence
and strategies and management’s expectations about new and existing programs and
products, acquisitions, relationships, opportunities, taxation, technology, market
conditions and economic expectations. These statements may be identified by such
forward-looking terminology as “should,” “expect,”
“believe,” “view,” “opportunity,” “allow,” “continues,” “reflects,” “typically,” “usually,” “anticipate,” or similar statements or
variations of such terms. Such forward-looking statements involve certain risks and
uncertainties. Actual results may differ materially from such forward-looking
statements. Factors that may cause actual results to differ materially from those contemplated by such
forward-looking statements include, but are not limited to: a continued weakness or
unexpected decline in the U.S. economy, in particular in New Jersey and the New York
Metropolitan area; other-than-temporary impairment charges on our investment
securities; higher than expected increases in our allowance for loan losses; higher than
expected increases in loan losses or in the level of nonperforming loans; unexpected
changes in interest rates; higher than expected tax rates, including increases resulting from
changes in tax laws, regulations and case law; a continued or unexpected decline in real
estate values within our market areas; declines in value in our investment portfolio;
charges against earnings related to the change in fair value of our junior subordinated
debentures; higher than expected FDIC insurance assessments; the failure of other financial
institutions with whom we have trading, clearing, counterparty and other financial
relationships; lack of liquidity to fund our various cash obligations; unanticipated reduction
in our deposit base; potential acquisitions that may disrupt our business; government
intervention in the U.S. financial system and the effects of and changes in trade and
monetary and fiscal policies and laws, including the interest rate policies of the Federal
Reserve; legislative and regulatory actions (including the impact of the Dodd-Frank Wall
Street Reform and Consumer Protection Act and related regulations) subject us to
additional regulatory oversight which may result in increased compliance costs and/or require
us to change our business model; changes in accounting policies or accounting standards; our
inability to promptly adapt to technological changes; our internal controls and
procedures may not be adequate to prevent losses;
claims and litigation pertaining to fiduciary responsibility, environmental laws and other
matters; the possibility that the expected benefits of acquisitions will not be fully
realized, including lower than expected cash flows from loan pools acquired in FDIC-assisted
transactions, the State Bancorp, Inc. acquisition and other purchased loan transactions; the
inability to realize expected cost savings and revenue synergies from the merger of
State Bancorp with Valley in the amounts or in the timeframe anticipated; inability to
retain State Bancorp’s customers and employees; and other unexpected material adverse
changes in our operations and earnings.
A detailed discussion of factors that could affect our results is included in our SEC filings,
including the “Risk Factors” section of our Annual Report on Form 10-K
for the year ended December 31, 2011 and our Current Report on Form 8-K filed on April 26, 2012. We
undertake no duty to update any forward-looking statement to conform the statement to
actual results or changes in our expectations. Although we believe that the
expectations reflected in the forward-looking statements are reasonable, we cannot
guarantee future results, levels of activity, performance or achievements. Forward
Looking Statements ©
2010 Valley National Bank. Member FDIC. Equal Opportunity Lender.
|
 ©
2012 Valley National Bank. Member FDIC. Equal Opportunity Lender.
Historical Financial Data (1)
(Dollars in millions, except for share data)
3/2012
15,950
$
34.5
$
$0.18
0.88
%
9.34
%
$0.16
5/12 -
5%
Stock Dividend
2011
14,245
133.7
0.75
0.94
10.20
0.66
5/11 -
5%
Stock Dividend
2010
14,144
131.2
0.74
0.93
10.32
0.65
5/10 -
5%
Stock Dividend
2009
14,284
116.1
0.58
0.81
8.64
0.66
5/09 -
5%
Stock Dividend
2008
14,718
93.6
0.58
0.69
8.74
0.66
5/08 -
5%
Stock Dividend
2007
12,749
153.2
1.00
1.25
16.43
0.65
5/07 -
5%
Stock Dividend
2006
12,395
163.7
1.04
1.33
17.24
0.64
5/06 -
5%
Stock Dividend
2005
12,436
163.4
1.06
1.39
19.17
0.62
5/05 -
5%
Stock Dividend
2004
10,763
154.4
1.05
1.51
22.77
0.60
5/04 -
5%
Stock Dividend
2003
9,873
153.4
1.05
1.63
24.21
0.57
5/03 -
5%
Stock Dividend
2002
9,148
154.6
1.01
1.78
23.59
0.54
5/02 -
5:4
Stock Split
2001
8,590
135.2
0.85
1.68
19.70
0.51
5/01 -
5%
Stock Dividend
2000
6,426
106.8
0.82
1.72
20.28
0.48
5/00 -
5%
Stock Dividend
1999
6,360
106.3
0.77
1.75
18.35
0.45
5/99 -
5%
Stock Dividend
1998
5,541
97.3
0.74
1.82
18.47
0.41
5/98 -
5:4
Stock Split
1997
5,091
85.0
0.68
1.67
18.88
0.36
5/97 -
5%
Stock Dividend
1996
4,687
67.5
0.59
1.47
17.23
0.32
5/96 -
5%
Stock Dividend
1995
4,586
62.6
0.54
1.40
16.60
0.30
5/95 -
5%
Stock Dividend
1994
3,744
59.0
0.60
1.60
20.03
0.29
5/94 -
10%
Stock Dividend
1993
3,605
56.4
0.59
1.62
21.42
0.23
4/93 -
5:4
Stock Split
1992
3,357
43.4
0.46
1.36
19.17
0.20
4/92 -
3:2
Stock Split
Years Ended
Total Assets
Net Income
(2)
Common Stock Splits and Dividends
Diluted
Earnings Per
Common
Share
Return on
Average
Assets
Return on
Average
Equity
Cash Dividends
Declared Per
Common Share
Shareholder Returns
3
(1) All per share amounts have been adjusted retroactively for stock splits and stock
dividends during the periods presented. Data for the years prior to 2001 in the table above
exclude certain prior year results for merger transactions accounted for using the
pooling-of-interests method.
(2) Net income includes other-than-temporary impairment charges on investment
securities, net of tax benefit, totaling $12.2 million, $2.9 million, $4.0 million, $49.9 million, $10.4
million, and $3.0 million for years ended 2011, 2010, 2009, 2008, 2007, and 2006, respectively. |
 ©
2012 Valley National Bank. Member FDIC. Equal Opportunity Lender.
Valley National Bank Today
About Valley
Regional Bank Holding Company
Approximately $16 Billion in Assets
Headquartered in Wayne, New
Jersey
39
th
Largest United States
Chartered
Commercial Bank
One of the Largest Chartered
Commercial Banks
Headquartered in
New Jersey
Operates 211 Branches in 147
Communities Serving 16 counties
throughout Northern and Central
New Jersey, Manhattan, Brooklyn,
Queens and Long Island
Traded on the NYSE (VLY)
Significant Attributes
Consistent Shareholder Returns
Focus on Credit Quality
Conservative Strategies
Affluent and Heavily Populated
Footprint
Strong Customer Service
Experienced Senior and Executive
Management
4 |
 ©
2012 Valley National Bank. Member FDIC. Equal Opportunity Lender.
Management Approach
Large percentage of retail ownership
Long-term investment approach
Focus on cash and stock dividends
Large insider ownership, family members, retired
employees and retired directors
Market Cap of $2.4 Billion
Approximately 275 institutional holders
Source: Bloomberg as of 4/26/2012
Large Bank that Operates and Feels Like a Small Closely Held Company
5 |
 ©
2012 Valley National Bank. Member FDIC. Equal Opportunity Lender.
Valley’s 1Q 2012 Highlights
6
*Loan Growth excludes loans acquired from State Bancorp, Inc. and a $37.0 million
short-term commercial loan made to State Bancorp, Inc .during 4Q 2011. Net
Income 1Q net income available to common shareholders was $34.5 million
($0.18 Diluted EPS) adjusted for a five percent stock
dividend declared by our Board of Directors on April 18, 2012, payable on May 25,2012 to
shareholders of record on May 11, 2012.
Net Interest Margin for 1Q 2012 was 3.70% on a tax equivalent basis
Loan Growth*
Total non-covered loans increased by $247 million or 15.1% on an annualized basis
Residential Mortgage: 39.7% annualized growth linked quarter
Commercial Real Estate: 12.4% annualized growth linked quarter
Commercial & Industrial: 4.7% annualized growth linked quarter
Consumer Loans: (4.1%) annualized decline linked quarter
Total 30+ day delinquencies were 1.52% of entire loan portfolio
Total non-accrual loans were 1.12% of total loans
Out of approximately 25,000 residential mortgages and home equity loans, only 261 loans were
past due 30 days or
more at March 31, 2012.
Net charge-offs were $6.3 million or 0.23% of average total loans during 1Q
2012 on an annualized basis compared with
$14.4 million or 0.59% during 4Q 2011.
Capital
Strong capital ratios
Acquisitions
State Bancorp, Inc. acquired by Valley National Bank effective 1/1/2012
$112 million in commercial real estate loans purchased from another financial
institution Credit Quality |
 ©
2012 Valley National Bank. Member FDIC. Equal Opportunity Lender.
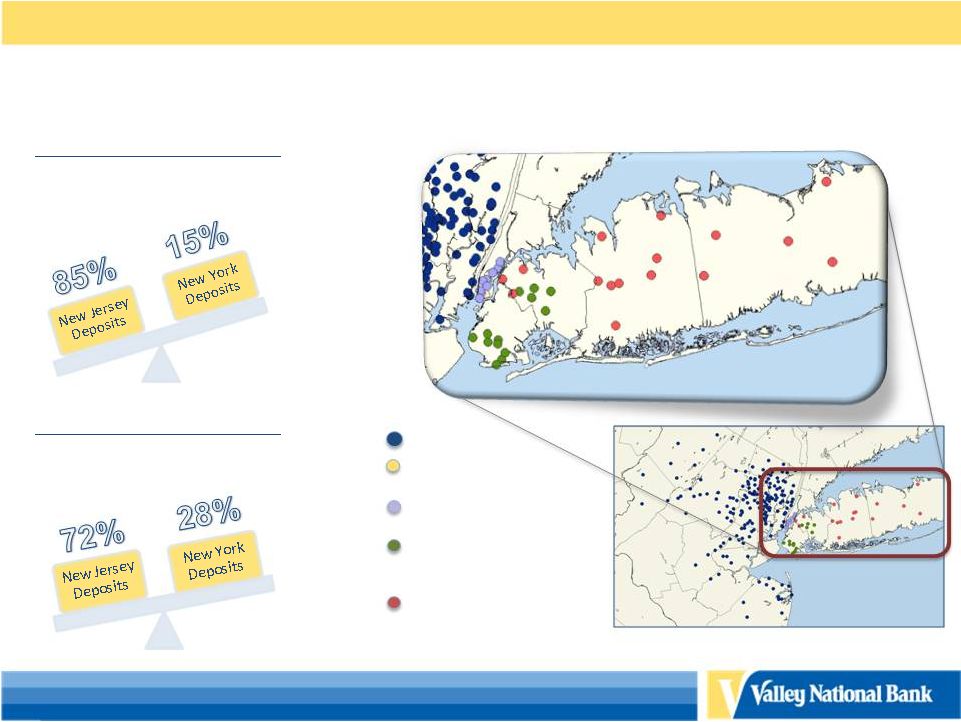
Valley’s New York Franchise
2012 Total NY Relationships
•$2.9 billion in NY
deposits •$2.1 billion in
NY loans 2001+ De Novo Branches
Manhattan -
9
2007+ Brooklyn/Queens
Brooklyn –
8
Queens -
5
2012 State Bank
Queens –
2
Nassau –
8
Suffolk –
5
VLY NJ Branches -
167
2001 Merchant’s Branches
Manhattan -
7
2001 Total NY Relationships
•$950 million in NY deposits
•$473 million in NY
loans * NY loans include C&I loans only
7 |
 ©
2012 Valley National Bank. Member FDIC. Equal Opportunity Lender.
Future Opportunities
•
Ability to lever Valley’s capital to grow Long Island Franchise
–
Opportunity to fill in Nassau and Suffolk county geography
•
Consumer Lending
–
Opportunity to introduce new products (State Bancorp does
not actively pursue consumer lending relationships)
•
Valley’s residential mortgage products
•
Valley’s consumer lending (auto & home equity) products
•
Commercial Lending
–
Opportunity to expand relationships
•
Larger lending limit
8 |
 ©
2012 Valley National Bank. Member FDIC. Equal Opportunity Lender.
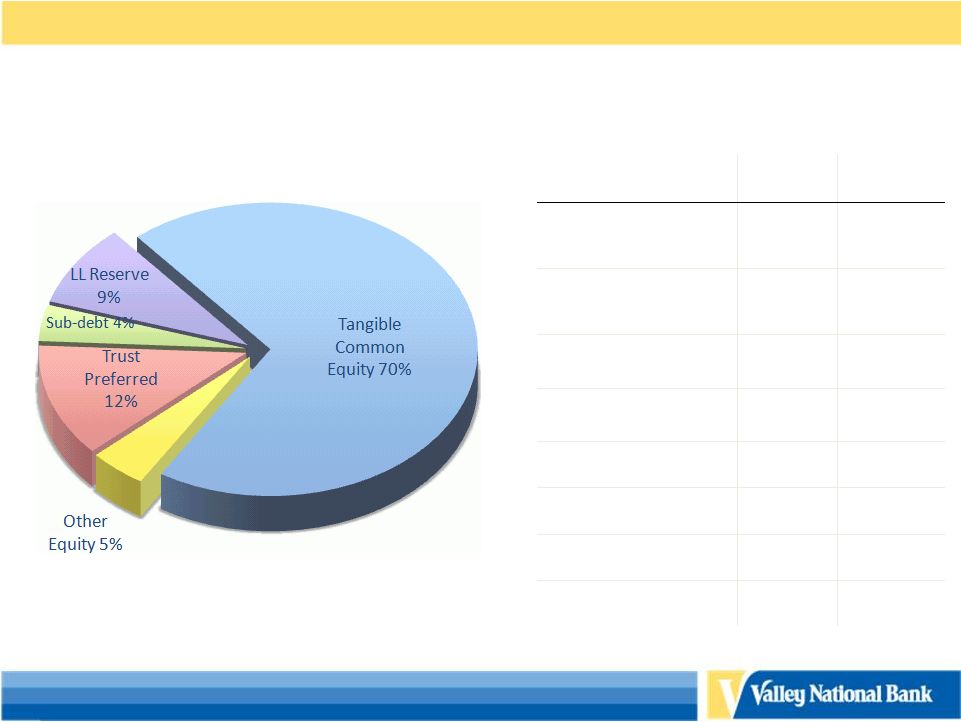
Significant unrealized gain on facilities, referenced in slide 10,
not incorporated in capital ratios reflected above.
Equity Composition / Ratios*
Total Tier II Equity = $1.5 Billion
As of 3/31/2012
*Non-GAAP reconciliations shown on slide 19-20.
Capital Ratios
As of
3/31/2012
“Well
Capitalized”
Tangible Common Equity /
Tangible Assets
6.74%
N/A
Tangible Common Equity /
Risk-Weighted Assets
9.00%
N/A
Tier I Common Ratio
8.99%
N/A
Tier I
10.59%
6.00%
Tier II
12.27%
10.00%
Leverage
8.08%
5.00%
Book Value
$7.58
N/A
Tangible Book Value
$5.30
N/A
9 |
 ©
2012 Valley National Bank. Member FDIC. Equal Opportunity Lender.
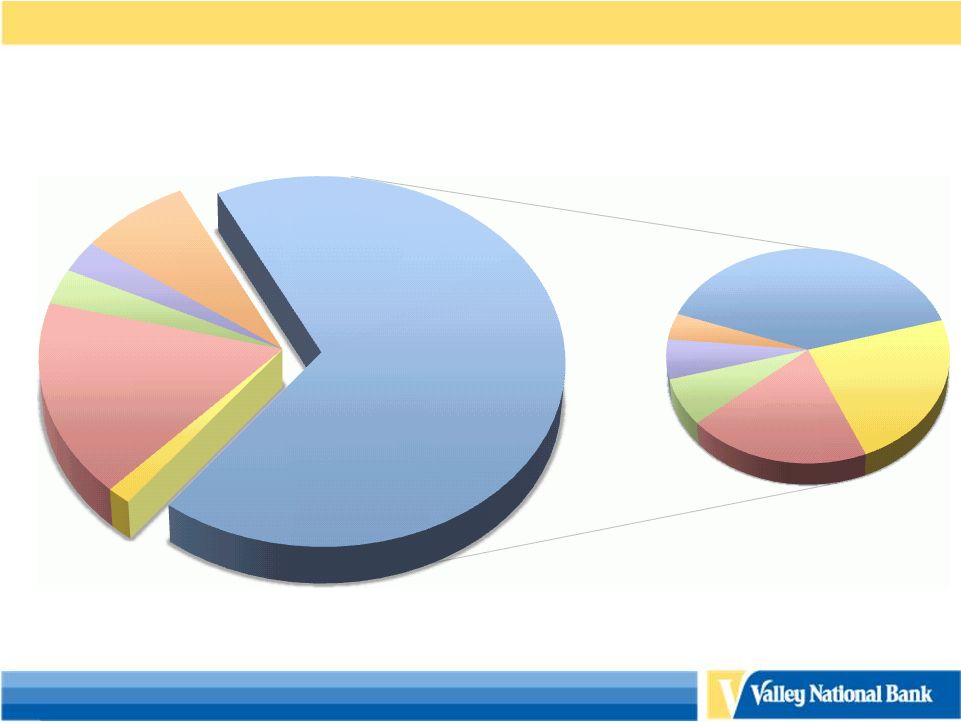
*Other Assets includes bank owned branch locations carried at a
cost estimated by management to be significantly less than the
current market value.
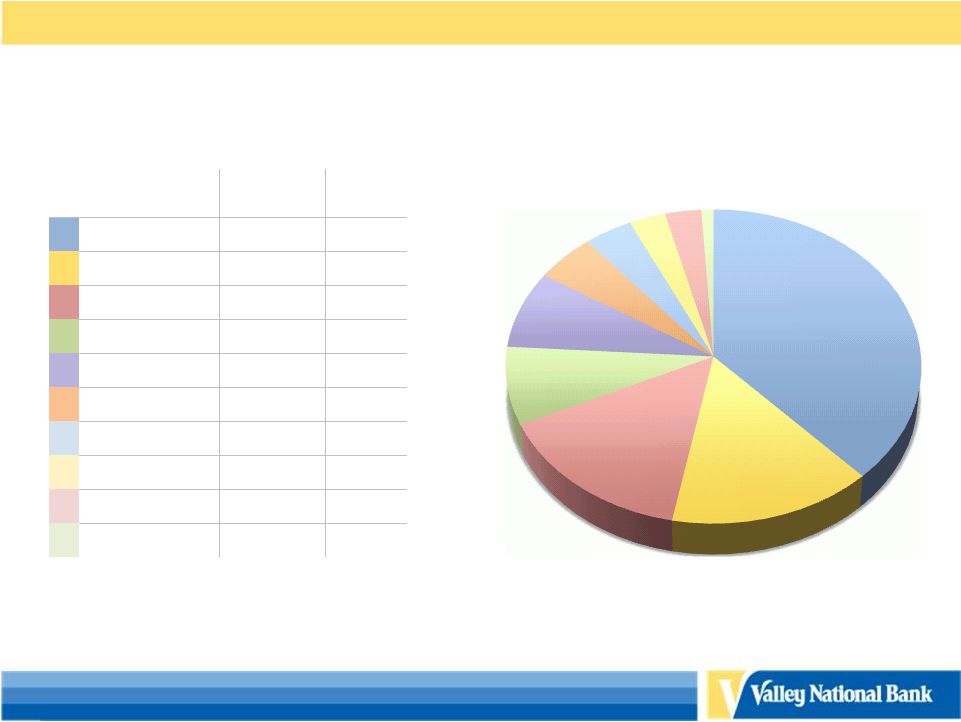
Asset and Loan Composition
Total Assets = $16.0 Billion
As of 3/31/2012
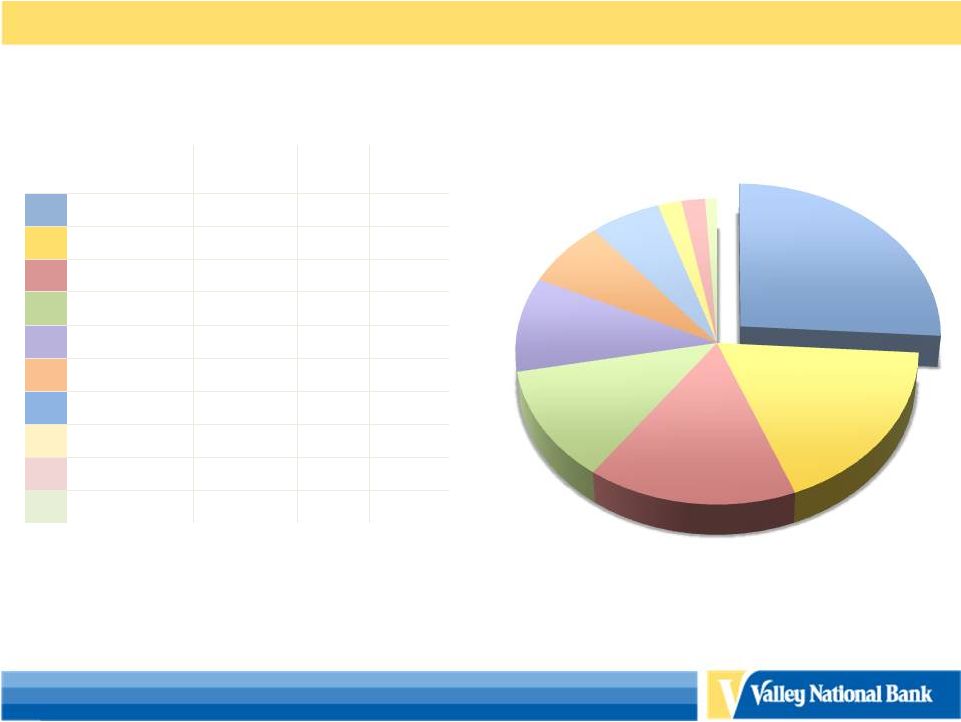
Non-Covered Loans (Gross) = $10.9 Billion
Construction
Loans
4%
Commercial
Real Estate
40%
Residential
Mortgages
23%
Commercial
Loans
20%
Auto Loans
7%
Other
Consumer
6%
10
Total Other
Assets* 8%
Intangible
Assets 3%
Cash 3%
Securities 17%
Non-Covered
Loans 68%
Covered Loans
1% |
 ©
2012 Valley National Bank. Member FDIC. Equal Opportunity Lender.
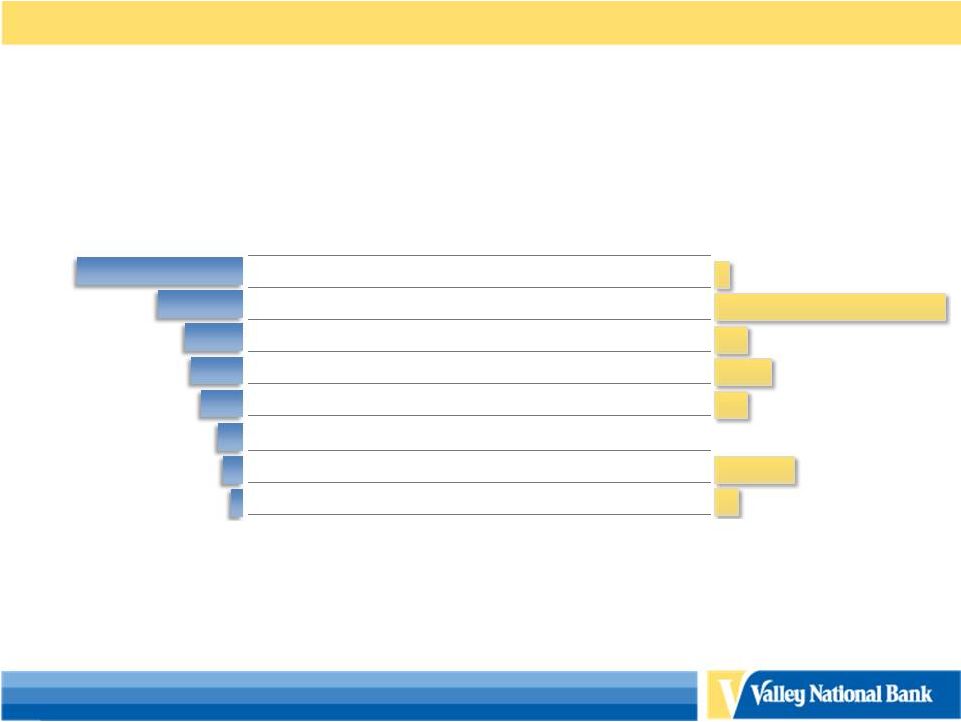
Total Commercial Real Estate -
$3.5 Billion
(Non-Covered Loans)
As of 2/29/2012, excludes loans acquired from State Bancorp, Inc.
Primary Property
Type
$ Amount
(Millions)
% of
Total
Average
LTV
Retail
906
26%
50%
Industrial
626
18%
51%
Apartments
544
16%
37%
Office
426
12%
53%
Mixed Use
364
10%
44%
Healthcare
238
7%
60%
Specialty
208
6%
50%
Residential
81
2%
49%
Land Loans
71
2%
67%
Other
32
1%
38%
Diversified Commercial Real Estate Portfolio
11
-Average LTV based on current balances and most recent appraised value
-The total CRE loan balance is based on Valley’s internal loan hierarchy
structure and does not reflect loan classifications reported in Valley’s SEC
and bank regulatory reports.
-The chart above does not include $353 Million in Construction loans.
26%
18%
16%
12%
10%
7%
6%
2%
2%
1% |
 ©
2012 Valley National Bank. Member FDIC. Equal Opportunity Lender.
Total Retail Property Types -
$906 Million
(Non-Covered Loans)
Retail Property Type
% of
Total
Average
LTV
Multi-Tenanted -
Anchor
25%
51%
Multi-Tenanted -
No Anchor
23%
54%
Single Tenant
20%
50%
Auto Dealership
11%
49%
Private & Public Clubs
7%
35%
Food Establishments
5%
54%
Entertainment Facilities
4%
56%
Private Education Facilities
3%
47%
Auto Servicing
2%
49%
Retail Composition of Commercial Real Estate
-Average LTV based on current balances and most recent appraised value
-The chart above does not include construction loans.
12
As of 2/29/2012, excludes loans acquired from State Bancorp, Inc.
25%
23%
20%
11%
7%
5%
3%
3%
2% |
 ©
2012 Valley National Bank. Member FDIC. Equal Opportunity Lender.
Construction Loan Composition
Total
(Non-Covered)
Construction
Loans
-
$353
Million
Primary Property Type
$ Amount
(Millions)
% of
Total
Residential
134
38%
Retail
54
15%
Land Loans
52
15%
Mixed Use
29
8%
Apartments
28
8%
Other
17
5%
Specialty
14
4%
Industrial
12
3%
Healthcare
9
3%
Office
4
1%
-Construction loan balance is based on Valley’s internal loan hierarchy
structure and does not reflect loan classifications reported in Valley’s SEC
and bank regulatory reports.
13
As of 2/29/2012, excludes loans acquired from State Bancorp, Inc.
4%
3%
3%
1%
5%
8%
8%
15%
15%
38% |
 ©
2012 Valley National Bank. Member FDIC. Equal Opportunity Lender.
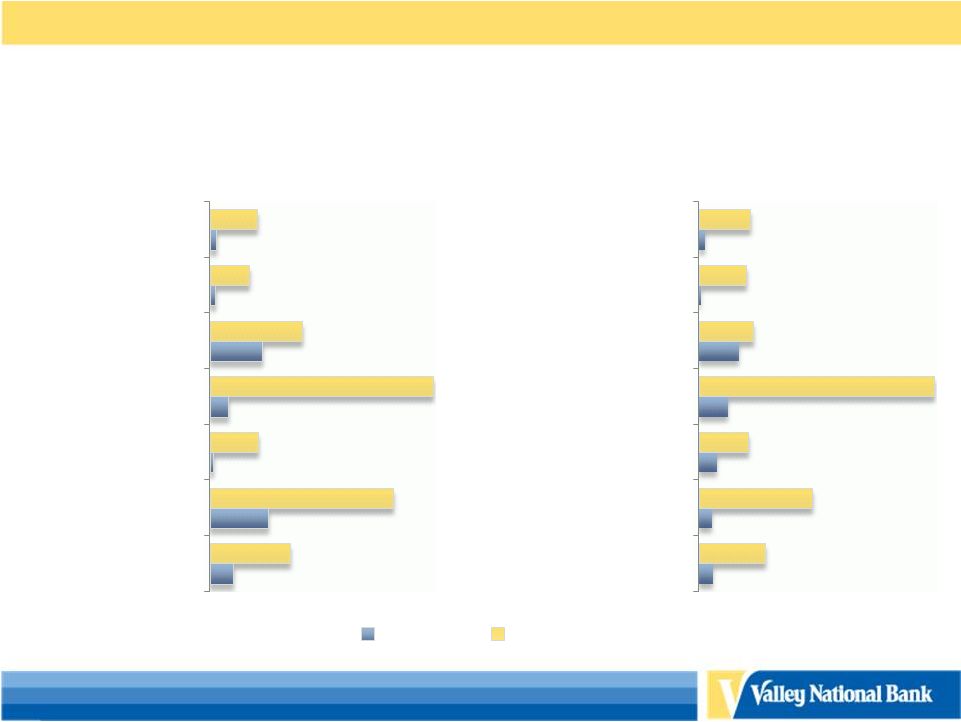
Net Charge-offs to Average Loans
Peer group consists of banks with total assets between $3 billion and $50 billion.
2003 -
2011
2012 YTD*
*Valley 2012 Charge-offs exclude covered loans
14
Source -
SNL Financial As of 4/27/2012
Total Loans
Consumer
Home Equity
Construction & Development
Commercial Loans
Commercial Real Estate
1-4 Family
0.21%
0.52%
0.03%
0.16%
0.47%
0.05%
0.05%
0.72%
0.44%
0.83%
0.35%
0.43%
1.65%
2.00%
0.23%
0.22%
0.30%
0.47%
0.65%
0.04%
0.10%
1.09%
1.85%
0.81%
0.89%
0.78%
0.84%
3.84%
Total Loans
Consumer
Home Equity
Construction & Development
Commercial Loans
Commercial Real Estate
1-4 Family
Valley
Peer Group |
 ©
2012 Valley National Bank. Member FDIC. Equal Opportunity Lender.
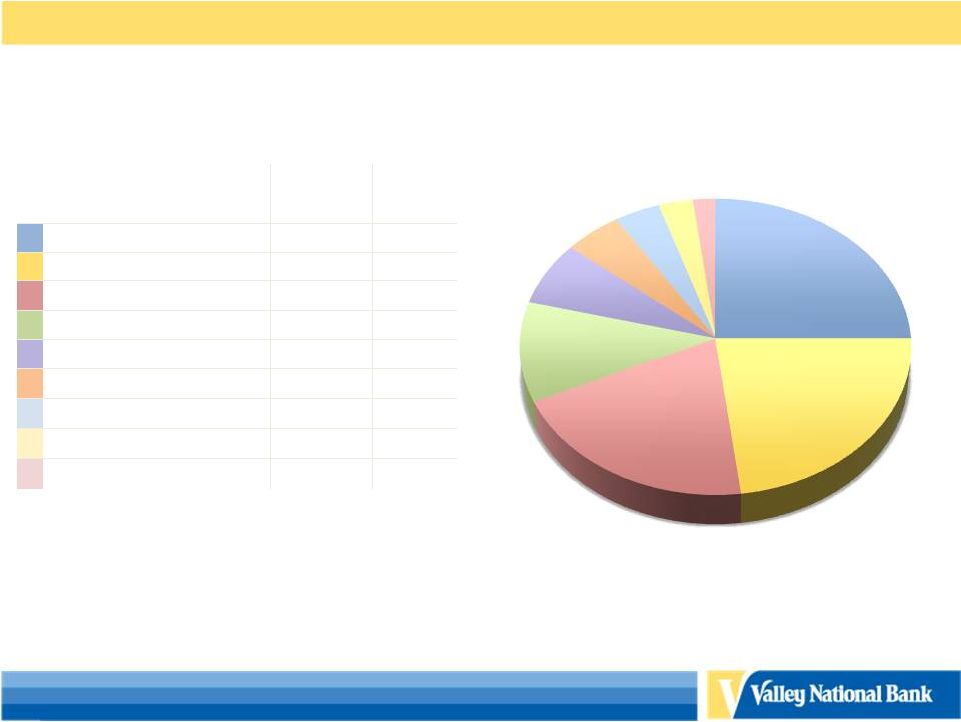
Investment Portfolio
1Q 2012
Investment Types
2007
36%
GSE MBS (GNMA)
3%
19%
GSE MBS (FNMA/FHLMC)
49%
13%
State, County & Municipals
7%
11%
Trust Preferred
12%
9%
Other
7%
5%
US Treasury
0%
4%
Corporate Debt
17%
3%
Private Label MBS
5%
$2.7 Billion
Investment Portfolio
$3.1 Billion
As of 3/31/12 and 12/31/07
Duration of MBS Securities
2.00 Years
2.64 Years
15 |
 ©
2012 Valley National Bank. Member FDIC. Equal Opportunity Lender.
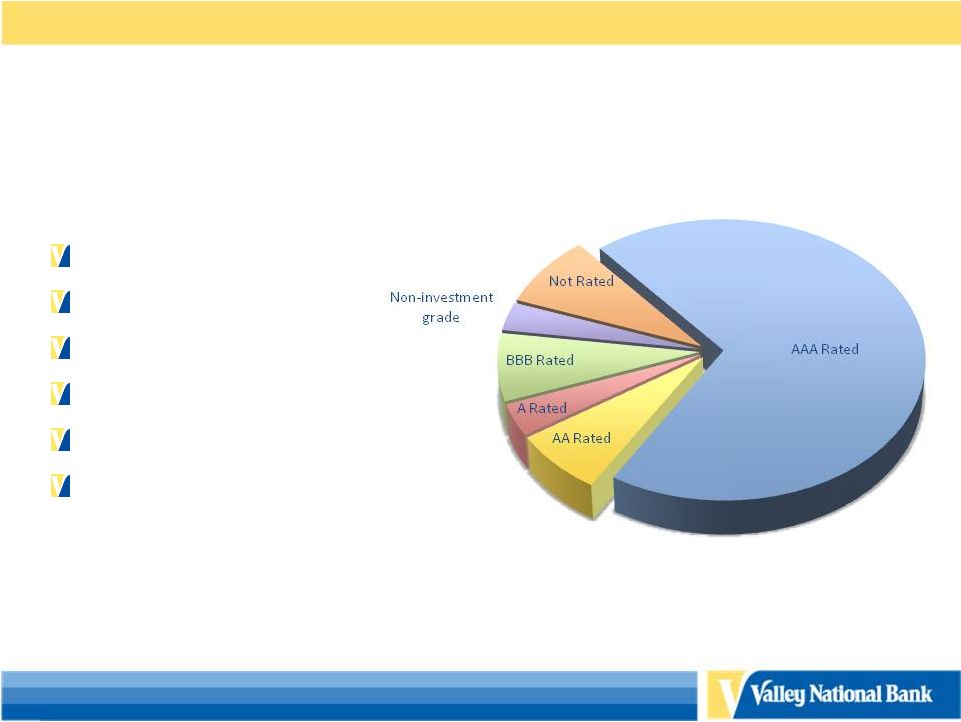
Securities by Investment Grade
AAA Rated 70%
AA Rated 7%
A Rated 4%
BBB Rated 8%
Non Investment Grade 3%
Not Rated 8%
As of 3/31/2012
16 |
 ©
2012 Valley National Bank. Member FDIC. Equal Opportunity Lender.
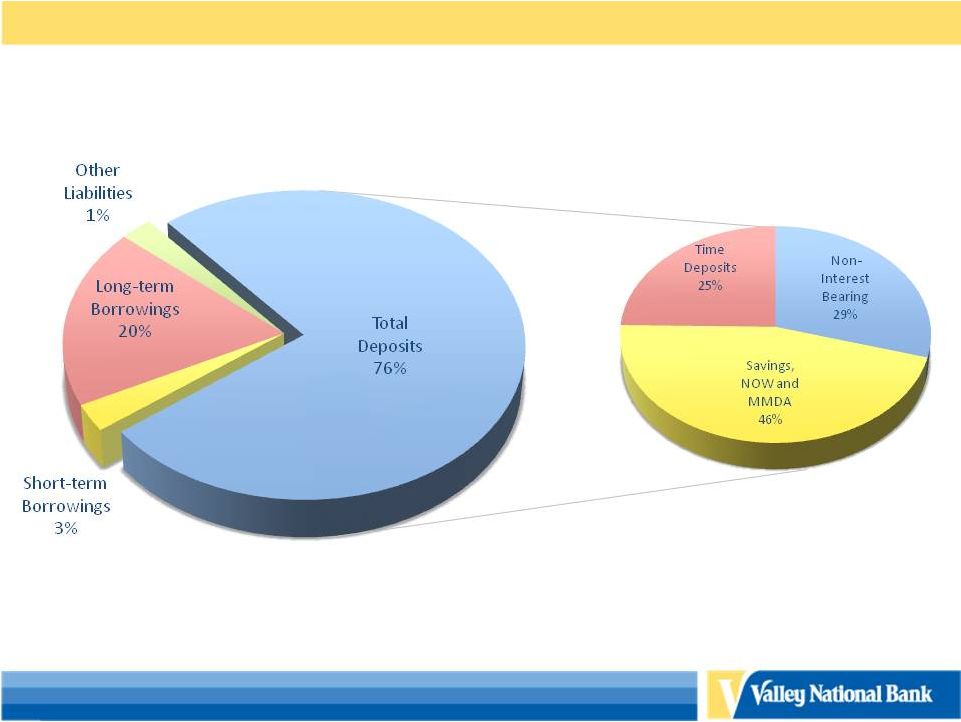
Deposits and Borrowings Composition
Total Liabilities = $14.5 Billion
As of 3/31/2012
Total Deposits = $11.0 Billion
17 |
 ©
2012 Valley National Bank. Member FDIC. Equal Opportunity Lender.
For More Information
Log onto our web site: www.valleynationalbank.com
E-mail requests to: dgrenz@valleynationalbank.com
Call Shareholder Relations at: (973) 305-3380
Write to: Valley National Bank
1455 Valley Road
Wayne, New Jersey 07470
Attn: Dianne M. Grenz, First Senior Vice President
Director of Marketing, Shareholder & Public Relations
Log onto our website above or www.sec.gov to obtain free copies of
documents filed by Valley with the SEC
18 |
 ©
2012 Valley National Bank. Member FDIC. Equal Opportunity Lender.
Total Equity
$1,493,454
Total Assets
$15,950,054
Less: Net unrealized gains on securities
available for sale
7,327
Less: Goodwill & Other Intangible Assets
(448,814)
Plus: Accumulated net gains (losses) on cash
flow hedges, net of tax
11,378
Total Tangible Assets (TA)
$15,501,240
Plus: Pension liability adjustment, net of tax
29,119
Total Equity
$1,493,454
Less: Goodwill, net of tax
(419,592)
Less: Goodwill & Other Intangible Assets
(448,814)
Less: Disallowed other intangible assets
(18,524)
Total Tangible Common Equity (TCE)
$1,044,640
Less: Disallowed deferred tax asset
(59,531)
Tier I Common Capital
$1,043,631
Ratios
Plus: Trust preferred securities
186,313
TCE / TA
6.74%
Total Tier I Capital
$1,229,944
TCE / RWA
9.00%
Plus: Qualifying allowance for credit losses
$135,576
Plus: Qualifying sub debt
60,000
Tier I (Total Tier I / RWA)
10.59%
Total Tier II Capital
$1,425,520
Tier II (Total Tier II / RWA)
12.27%
Risk Weighted Assets (RWA)
$11,613,395
Tier I Common Capital Ratio
(Tier 1 common /RWA)
8.99%
3/31/2012
Non-GAAP Disclosure Reconciliations
($ in Thousands)
19 |
  ©
2012 Valley National Bank. Member FDIC. Equal Opportunity Lender.
3/31/2012
Non-GAAP Disclosure Reconciliations
($ in Thousands)
Common Shares Outstanding*
197,069,110
Shareholders’ Equity
$1,493,454
Less: Goodwill and Other
Intangible Assets
(448,814)
Tangible Shareholders’ Equity
$1,044,640
Tangible Book Value
$5.30
20
*Share data reflects the five percent common stock dividend declared on April 18, 2012, to be
issued May 25, 2012 to shareholders of record May 11, 2012
|