Attached files
| file | filename |
|---|---|
| 8-K - 8-K - TNS INC | a12-10985_18k.htm |
| EX-99.1 - EX-99.1 - TNS INC | a12-10985_1ex99d1.htm |
Exhibit 99.2
|
|
First Quarter 2012 Earnings Supplemental Information TNS, Inc. |
|
|
Forward Looking Statements 2 The statements contained in this presentation that are not historical facts are forward-looking statements within the meaning of The Private Securities Litigation Reform Act of 1995. These forward-looking statements are based on current expectations, forecasts and assumptions that are subject to risks and uncertainties that could cause actual results to differ materially from those set forth in, or implied by, the forward-looking statements. The Company has attempted, whenever possible, to identify these forward-looking statements using words such as “may,” “will,” “should,” “projects,” “estimates,” “expects,” “plans,” “intends,” “anticipates,” “believes,” and variations of these words and similar expressions. Similarly, statements herein that describe the Company’s business strategy, prospects, opportunities, outlook, objectives, plans, intentions or goals are also forward-looking statements. Actual results may differ materially from those indicated by such forward-looking statements as a result of various important factors, including: the Company’s reliance upon a small number of customers for a significant portion of its revenue; competitive factors such as pricing pressures; increases in the prices charged by telecommunication providers for services used by the Company; the Company’s ability to grow its business domestically and internationally by generating greater transaction volumes; longer than expected sales cycles, customer delays in migration, acquiring new customers or developing new service offerings; fluctuations in the Company’s quarterly results because of the seasonal nature of the business and other factors outside of the Company’s control, including fluctuations in foreign exchange rates and the continuing impact of the current economic conditions; the Company’s ability to identify, execute or effectively integrate acquisitions; uncertainties related to the updated international tax planning strategy implemented by the Company; the Company’s ability to adapt to changing technology; the Company’s ability to refinance its senior secured credit facility and its ability to borrow funds in amounts sufficient to enable it to service its debt or meet its working capital and capital expenditure requirements; additional costs related to compliance with any Securities and Exchange Commission (SEC) rule changes or other corporate governance issues; and other risk factors described in the Company’s annual report on Form 10-K dated March 14, 2012 as filed with the SEC. The Company expects that subsequent events or developments will cause its views to change. The Company undertakes no obligation to update any of the forward-looking statements made herein, whether as a result of new information, future events, changes in expectations or otherwise. These forward-looking statements should not be relied upon as representing the Company’s views as of any date subsequent to May 1, 2012. |
|
|
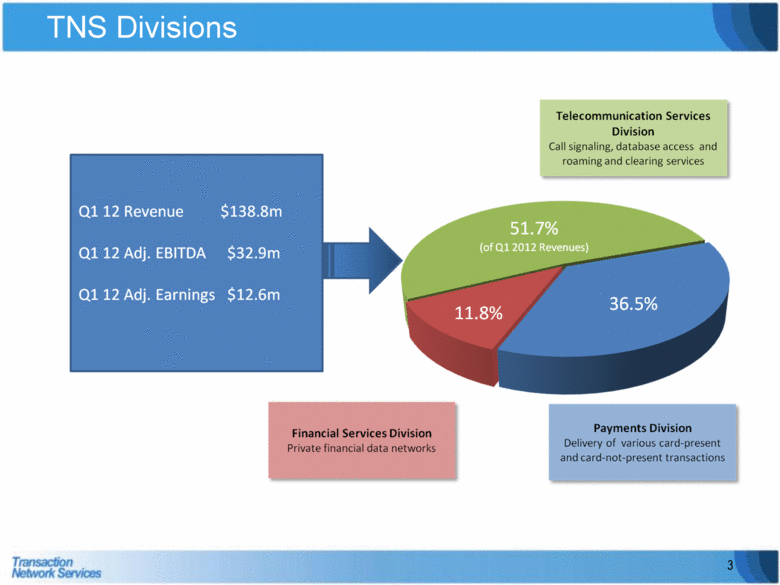
TNS Divisions Q1 12 Revenue $138.8m Q1 12 Adj. EBITDA $32.9m Q1 12 Adj. Earnings $12.6m 51.7% (of Q1 2012 Revenues) 11.8% 36.5% Telecommunication Services Division Call signaling, database access and roaming and clearing services Financial Services Division Private financial data networks Payments Division Delivery of various card-present and card-not-present transactions3 |
|
|
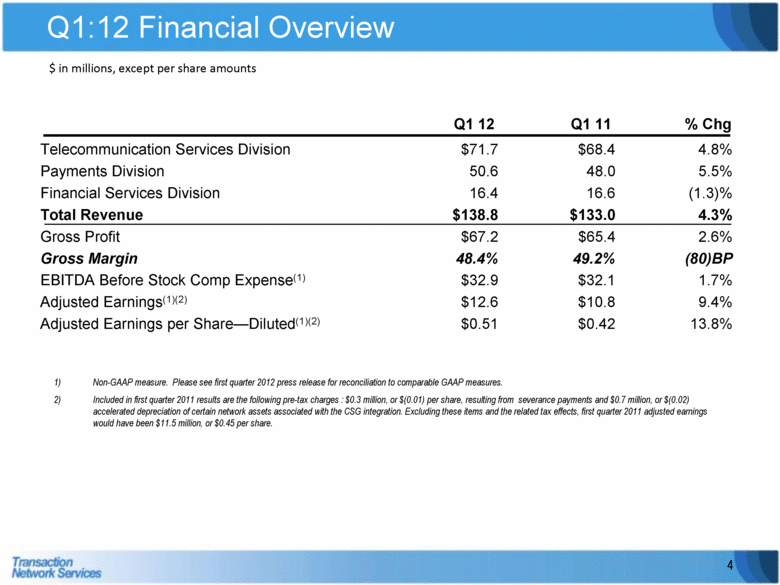
Q1:12 Financial Overview 4 $ in millions, except per share amounts Non-GAAP measure. Please see first quarter 2012 press release for reconciliation to comparable GAAP measures. Included in first quarter 2011 results are the following pre-tax charges : $0.3 million, or $(0.01) per share, resulting from severance payments and $0.7 million, or $(0.02) accelerated depreciation of certain network assets associated with the CSG integration. Excluding these items and the related tax effects, first quarter 2011 adjusted earnings would have been $11.5 million, or $0.45 per share. Q1 12 Q1 11 % Chg Telecommunication Services Division $71.7 $68.4 4.8% Payments Division 50.6 48.0 5.5% Financial Services Division 16.4 16.6 (1.3)% Total Revenue $138.8 $133.0 4.3% Gross Profit $67.2 $65.4 2.6% Gross Margin 48.4% 49.2% (80)BP EBITDA Before Stock Comp Expense(1) $32.9 $32.1 1.7% Adjusted Earnings(1)(2) $12.6 $10.8 9.4% Adjusted Earnings per Share—Diluted(1)(2) $0.51 $0.42 13.8% 1) 2) |
|
|
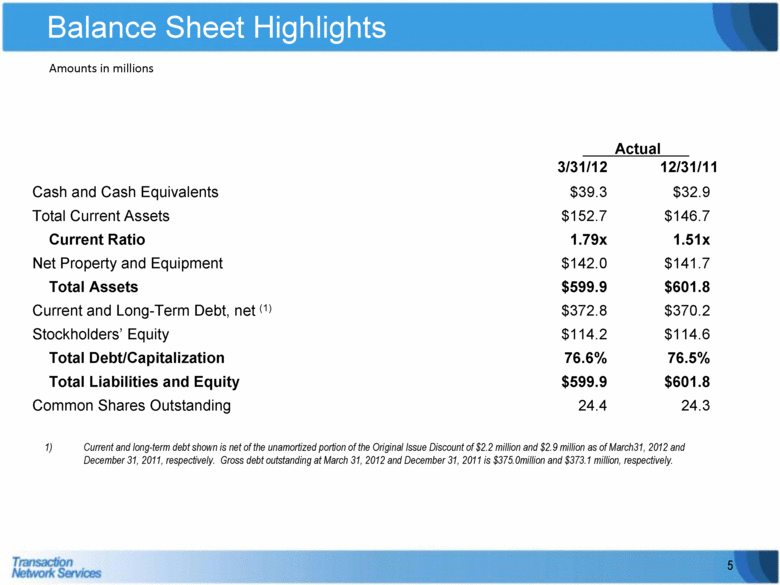
Balance Sheet Highlights 5 Amounts in millions Actual 3/31/12 12/31/11 Cash and Cash Equivalents $39.3 $32.9 Total Current Assets $152.7 $146.7 Current Ratio 1.79x 1.51x Net Property and Equipment $142.0 $141.7 Total Assets $599.9 $601.8 Current and Long-Term Debt, net (1) $372.8 $370.2 Stockholders’ Equity $114.2 $114.6 Total Debt/Capitalization 76.6% 76.5% Total Liabilities and Equity $599.9 $601.8 Common Shares Outstanding 24.4 24.3 Current and long-term debt shown is net of the unamortized portion of the Original Issue Discount of $2.2 million and $2.9 million as of March31, 2012 and December 31, 2011, respectively. Gross debt outstanding at March 31, 2012 and December 31, 2011 is $375.0million and $373.1 million, respectively. 1) |
|
|
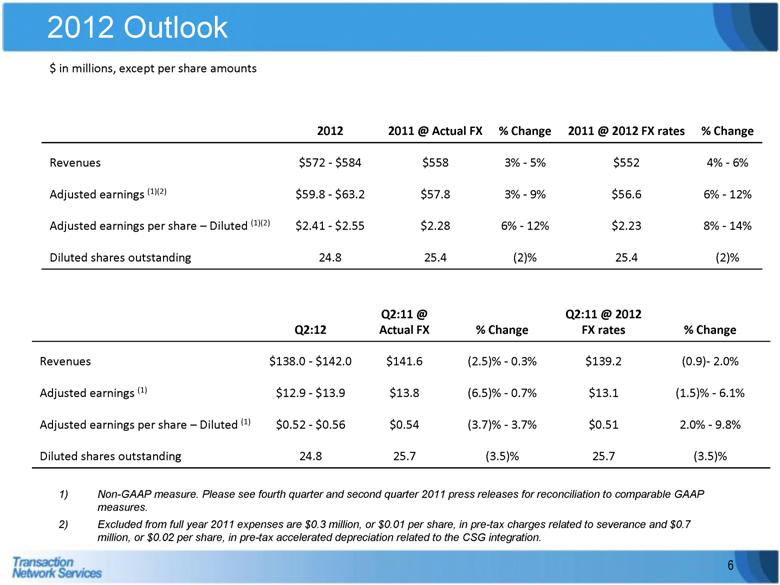
2012 Outlook 6 $ in millions, except per share amounts Non-GAAP measure. Please see fourth quarter and second quarter 2011 press releases for reconciliation to comparable GAAP measures. Excluded from full year 2011 expenses are $0.3 million, or $0.01 per share, in pre-tax charges related to severance and $0.7 million, or $0.02 per share, in pre-tax accelerated depreciation related to the CSG integration. 2012 2011 @ Actual FX % Change 2011 @ 2012 FX rates % Change Revenues $572 - $584 $558 3% - 5% $552 4% - 6% Adjusted earnings (1)(2) $59.8 - $63.2 $57.8 3% - 9% $56.6 6% - 12% Adjusted earnings per share – Diluted (1)(2) $2.41 - $2.55 $2.28 6% - 12% $2.23 8% - 14% Diluted shares outstanding 24.8 25.4 (2)% 25.4 (2)% Q2:12 Q2:11 @ Actual FX % Change Q2:11 @ 2012 FX rates % Change Revenues $138.0 - $142.0 $141.6 (2.5)% - 0.3% $139.2 (0.9)- 2.0% Adjusted earnings (1) $12.9 - $13.9 $13.8 (6.5)% - 0.7% $13.1 (1.5)% - 6.1% Adjusted earnings per share – Diluted (1) $0.52 - $0.56 $0.54 (3.7)% - 3.7% $0.51 2.0% - 9.8% Diluted shares outstanding 24.8 25.7 (3.5)% 25.7 (3.5)% 1) 2) |

