Attached files
| file | filename |
|---|---|
| 8-K - FORM 8-K - Energy Future Holdings Corp /TX/ | d344044d8k.htm |
| EX-99.1 - PRESS RELEASE - Energy Future Holdings Corp /TX/ | d344044dex991.htm |
 EFH
Corp. Q1 2012 Investor Call
May 1, 2012
Exhibit 99.2 |
 1
Safe Harbor Statement
Forward Looking Statements
This presentation contains forward-looking statements, which are subject to
various risks and uncertainties. Discussion of risks and uncertainties
that could cause actual results to differ materially from management's current
projections, forecasts, estimates and expectations is contained in EFH Corp.'s
filings with the Securities and Exchange Commission (SEC). In addition to the
risks and uncertainties set forth in EFH Corp.'s SEC filings, the
forward-looking statements in this presentation regarding the
company’s natural gas hedging program could be affected by, among other
things: any change in the ERCOT electricity market, including a regulatory or
legislative change, that results in wholesale electricity prices not generally
moving with natural gas prices; any decrease in market heat rates as the
program generally does not mitigate exposure to changes in market heat rates;
the unwillingness or failure of any hedge counterparty or the lenders
under
the
commodity
collateral
posting
facility
to
perform
their
respective
obligations;
or
any
other
event
that
results
in
the
inability
to
continue
to
use
a
first
lien on TCEH’s assets to secure a substantial portion of the hedges under
the program.
Regulation G
This presentation includes certain non-GAAP financial measures. A reconciliation
of these measures to the most directly comparable GAAP measures is included in
the appendix to this presentation. |
 2
Today’s Agenda
Q&A
Financial and Operational
Overview
Q1 2012 Review
Paul Keglevic
Executive Vice President & CFO |
 Consolidated: reconciliation of GAAP net loss to adjusted (non-GAAP) operating
results Q1
11
vs.
Q1
12
1
;
$
millions,
after
tax
EFH Corp.
Adjusted (Non-GAAP) Operating Results
1
Three months ended March 31.
Factor
Q1 11
Q1 12
Change
EFH Corp. GAAP net loss
(362)
(304)
58
Items
excluded
from
adjusted
(non-GAAP)
operating
results
(after
tax)
–
noncash:
Unrealized commodity-related mark-to-market net losses
203
98
(105)
Unrealized mark-to-market net gains on interest rate swaps
(92)
(74)
18
Gain related to counterparty bankruptcy settlement
(14)
-
14
EFH Corp. adjusted (non-GAAP) operating loss
(265)
(280)
(15)
3 |
 Consolidated: key drivers of the change in adjusted (non-GAAP) operating
results Q1 11 vs. Q1 12; $ millions, after tax
EFH Corp.
Adjusted (Non-GAAP) Operating Results Key Drivers
4
Description/Drivers
Better (Worse)
Than
Q1 11
Competitive Business:
Higher net margin from asset management and retail activities
17
Lower amortization of intangibles arising from purchase accounting
17
Higher fuel costs for coal and nuclear generation
(6)
All
other
-
net
4
Contribution margin
32
Higher net interest expense driven by higher average rates
(74)
Lower other income (and deductions) reflecting property damage claim settlement and
franchise tax refund in 2011 (10)
Lower depreciation reflecting certain fully depreciated or retired generation
equipment 21
6
Lower retail bad debt expense reflecting improved collections, customer mix and lower
revenues 6
All other -
net
(3)
Total change -
Competitive Business
(22)
Regulated Business:
Higher net revenues reflecting transmission and distribution tariff increases,
automated meter surcharges and growth in points of delivery 35
30
Higher 3rd party transmission fees
(19)
Lower consumption primarily due to milder weather
(15)
Higher depreciation and amortization reflecting infrastructure investment
(8)
Higher operation and maintenance expenses due to regulatory asset amortization and
employee-related and vegetation management costs (6)
Higher property taxes reflecting increased property tax rates
(3)
Higher net interest expense driven by increased borrowings
(2)
(5)
Change in Regulated Business (~80% owned by EFH Corp.)
7
Total change in EFH Corp. adjusted (non-GAAP) operating results
(15)
Lower operating costs reflecting nuclear refueling outage in 2011, partially offset by environmental
expenses and unplanned coal unit outages in 2012 All
other – net, primarily effective tax rate and noncontrolling interests
Higher revenues from transmission cost recovery charges (largely offsets 3rd
party transmission fees on an annual basis) |
 EFH
Corp. Adjusted EBITDA (Non-GAAP) EFH Corp. Adjusted EBITDA
(non-GAAP) 1
Q1
11 vs. Q1 12;
$ millions
Q1 12
Q1 11
1,230
1,166
834
805
386
351
TCEH
Oncor
Q1 12 performance was largely driven by the same key drivers impacting adjusted
(non- GAAP) operating results.
10%
1
See
Appendix
for
Regulation
G
reconciliations
and
definition.
Includes
$10
million
of
Corp.
&
Other
Adjusted
EBITDA
in
each
of
Q1
11
and
Q1
12.
5
4%
5% |
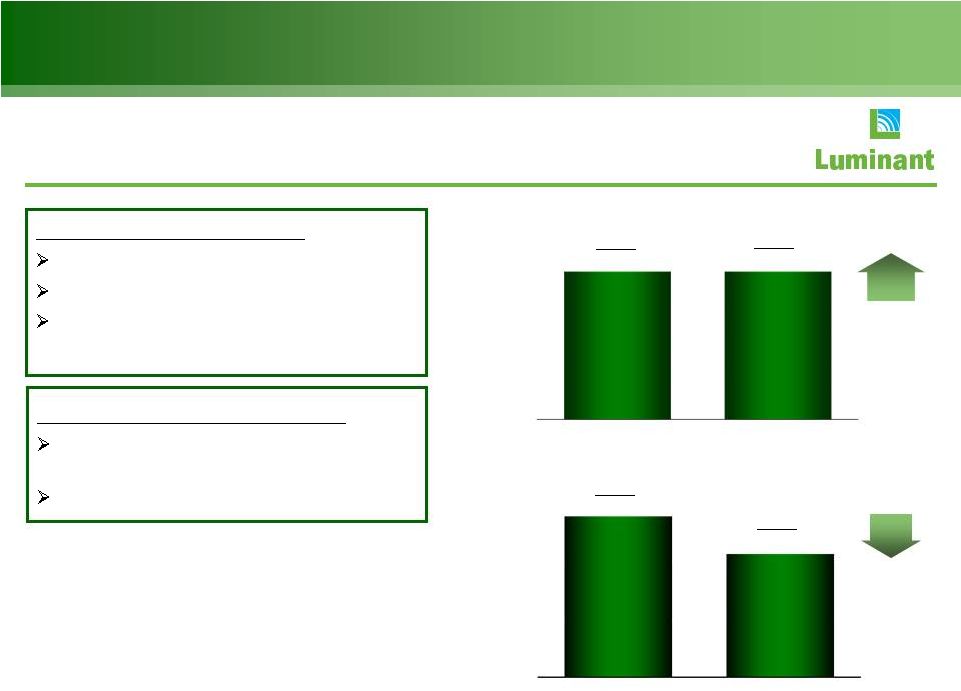 Luminant Operational Results
Coal-fueled generation; GWh
Q1
2012
Nuclear
Plant
Results
Solid safety performance
No unplanned outage days
Top decile industry performance for
reliability and cost
Nuclear-fueled generation; GWh
6
Q1
2012
Coal-Fueled
Plant
Results
Lower generation due to economic
backdown
Higher unplanned outage days
Q1 11
5,206
Q1 12
5,338
Q1 11
13,966
Q1 12
10,693
3%
23% |
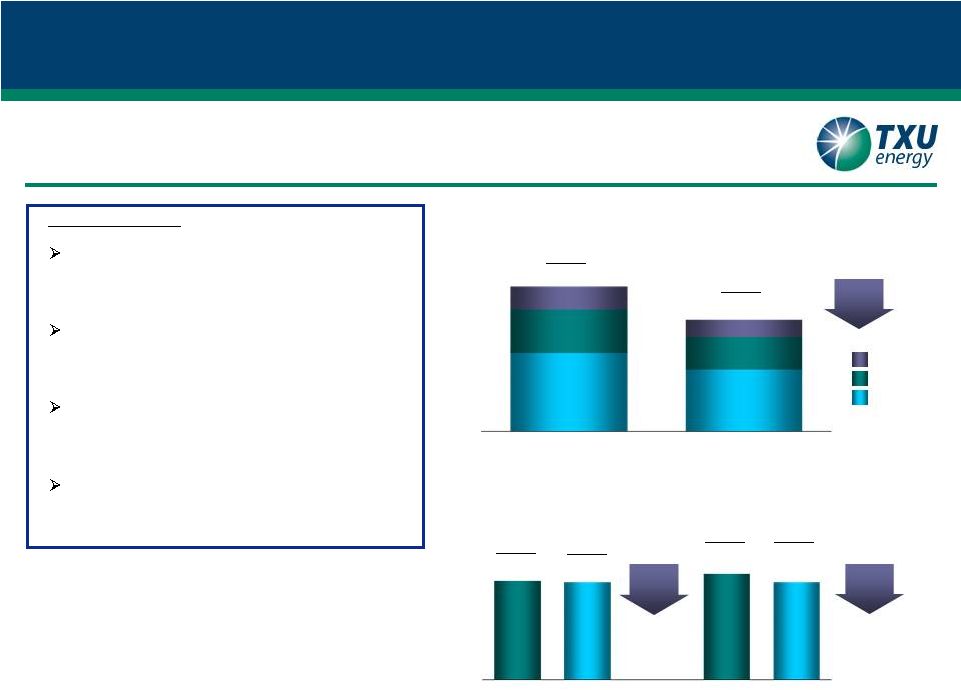  Q1 2012
Results Residential sales volumes declined
22% driven by milder weather and an
8% decrease in customer counts
Texas January and March average
temperatures were in the top 15
warmest for the past 100 years
Lower SMB and LCI
volumes reflect
competitive intensity and focus on
margin discipline
Lower bad debt expense due to
improved collection initiatives,
customer mix and lower revenues
TXU Energy Operational Results
Total residential customers
End of period, thousands
Retail electricity sales volumes by customer class;
GWh
1
SMB –
small
business
2
LCI –
large commercial and industrial
3
Last twelve months
SMB
LCI
Residential
7
Q1 11
Q1 12
10,969
8,448
1,766
3,259
5,944
1,338
2,450
4,660
Q4 11
1,625
1,603
Q1 12
Q1 11
Q1 12
1,739
1,603
1%
8%
LTM
23%
2
2
1
3
1 |
 8
Oncor Operational Results
Q1 11
Q1 12
1
SMB
–
small
business;
LCI
–
large
commercial
and
industrial
2
AMS –
Advanced Metering System
3
CREZ –
Competitive Renewable Energy Zone
4
On average, billed volumes are on an approximate 17-day calendar lag; therefore,
amounts shown reflect partial impacts from prior quarters
5
Last twelve months
Residential
SMB & LCI
3,181
3,214
Electricity distribution points of delivery
End of period, thousands of meters
Q1 12
Q4 11
3,203
3,214
Q1 11
Q1 12
26,717
24,770
13%
16,500
15,897
4%
1%
LTM
5
Q1 2012 Results
Lower volumes principally due to
milder weather partially offset by
premise growth
Lower SMB & LCI
1
energy volumes
due to milder weather partially offset
by economic growth
Execution of AMS
2
plan –
232,000
advanced meters installed in Q1 12;
over 2.5 million installed through
March 31, 2012
$1.1 billion spent on CREZ through
March 31, 2012; $157 million spent
in 2012
3
1 |
 2,054
2,054
1,062
198
749
1,141
Facility Limit
LOCs/Cash Borrowings
Availability
EFH Corp. Liquidity Management
As of March 31, 2012
9
Cash and Equivalents
TCEH Letter of Credit Facility
TCEH Revolving Credit Facility
749
3,116
EFH
Corp.
and
TCEH
continue
to
monitor
capital
market
conditions
for
opportunities to ensure
liquidity needs are met and to improve financial flexibility.
EFH Corp. (excluding Oncor) available liquidity
As of 3/31/12; $ millions
3,393 |
 Commodity Prices
Commodity
Units
Q1 11 Actual
Q1 12 Actual
BOY
12E
1
NYMEX
gas
price
2
$/MMBtu
$4.16
$2.46
$2.50
HSC gas price
$/MMBtu
$4.11
$2.41
$2.44
7x24 market heat rate (HSC)
3, 4
MMBtu/MWh
7.34
10.00
12.00
North Hub 7x24 power price
4
$/MWh
$30.18
$23.46
$28.85
TCEH weighted avg. hedge price
5
$/MMBtu
$7.94
$7.46
$7.32
Gulf Coast ultra-low sulfur diesel
$/gallon
$2.82
$3.17
$3.21
PRB 8400 coal
$/ton
$11.46
$8.28
$7.08
LIBOR interest rate
6
percent
0.46%
0.76%
0.88%
Commodity prices
Q1 12, Q1 11 and BOY 12E; mixed measures
10
1
2012
estimate
based
on
average
of
monthly
commodity
prices
as
of
3/30/12 for
April
2012
through
December
2012.
2
The
actual
prices
are
computed
based
on
settled
Gas
Daily
prices
for
Henry
Hub.
3
Based on ERCOT Nodal market clearing price for North Hub.
4
Heat rate and power prices on February 2-3, 2011 were excluded due to severe
weather events. Including these events, 7x24 market heat rate averaged 9.36 and North Hub 7x24
power prices averaged $39.
5
Weighted
average
prices
in
the
TCEH
natural
gas
hedging
program.
Based
on
NYMEX
Henry
Hub
prices
of
forward
natural
gas
sales
positions
in
the
hedging
program
(excluding
the impact of offsetting purchases for rebalancing and pricing point basis
transactions). 6
The index for the settled value is a 6-month LIBOR rate. The 2012 estimate is
based on 1 year LIBOR. |
 11
Factor
Measure
2012
2013
2014
Total or Avg.
12/31/11
Natural gas hedges
mm MMBtu
~294
~254
~149
~697
Wtd. avg. hedge price
$/MMBtu
~$7.36
~$7.19
~$7.80
Natural gas prices
$/MMBtu
~$3.24
~$3.94
~$4.34
Cum. MtM gain at 12/31/11
$ billions
~$1.7
~$0.9
~$0.5
~$3.1
03/31/12
Natural gas hedges
mm MMBtu
~225
~254
~149
~628
Wtd. avg. hedge price
$/MMBtu
~$7.32
~$7.19
~$7.80
Natural gas prices
$/MMBtu
~$2.50
~$3.47
~$3.96
Cum. MtM gain at 03/31/12
$ billions
~$1.4
~$1.0
~$0.6
~$3.0
Q1 12 MtM (loss) gain
$ billions
~($0.3)
~$0.1
~$0.1
~($0.1)
11
Unrealized Mark-To-Market Impact Of Hedging
Unrealized mark-to-market impact of hedging program
03/31/12 vs. 12/31/11; mixed measures, pre-tax
The
value
of
the
forward
hedge
program
remained
strong
due
to
lower
natural
gas
prices.
1
Weighted
average
prices
are
based
on
NYMEX
Henry
Hub
prices
of
forward
natural
gas
sales
positions
in
the
natural
gas
hedging
program
(excluding
the
impact
of
offsetting
purchases
for rebalancing and pricing point basis transactions). Where collars are
reflected, sales price represents the approximate collar floor price. 12/31/11 prices for 2012 represent January 1,
2012 through December 31, 2012 values and 3/31/12 prices for 2012 represent April
1, 2012 through December 31, 2012 values. 2
MtM values include the effects of all transactions in the natural gas hedging
program including offsetting purchases (for re-balancing) and natural gas basis deals.
3
As of 3/31/12, 2012 represents April 1, 2012 through December 31, 2012 volumes.
Where collars are reflected, the volumes are estimated based on the notional position of the derivatives
to provide protection against downward price movements. The notional volumes
for collars are approximately 150 million MMBtu, which correspond to a delta position of approximately
139 million MMBtu in 2014.
4
2012 represents the average of monthly forward prices for April 1, 2012 though
December 31, 2012. 1
2
1
4
2
3 |
 12
12
TCEH Natural Gas Exposure
TCEH Natural Gas Position
12-14
1
;
million
MMBtu
Hedges Backed by Asset First Lien
Open Position
Factor
Measure
2012
2013
2014
Natural gas hedging program
million MMBtu
~204
~254
~149
TXUE and LUME net positions
million MMBtu
~175
~70
~20
Overall estimated percent of
total NG position hedged
percent
~100%
~61%
~32%
TXUE and Luminant Net Positions
2
Hedges Backed by CCP
1
As of 3/31/12. Balance of 2012 is from May 1, 2012 to December 31,
2012. Assumes conversion of electricity positions based on a ~8.5 heat rate with natural gas generally being on the
margin
~70-90%
of
the
time
(i.e.
when
other
technologies
are
forecast
to
be
on
the
margin,
no
natural
gas
position
is
assumed
to
be
generated).
Estimated
position
reflects
the
impact
of
Clean Air Interstate Rule (CAIR), which currently governs Luminant emissions.
Potential impacts of Cross-State Air Pollution Rule (CSAPR) following the outcome of the pending legal
proceeding are not reflected.
2
Includes estimated retail/wholesale effects. Excludes any transactions associated
with proprietary trading positions. 3
The 2014 position includes notional volume of approximately 150 million MMBtu
costless collar with strikes of ~$7.80/MMBtu and ~$11.75/MMBtu for puts and calls respectively. The delta
equivalent short position is ~139 million MMBtu.
175
70
20
145
254
149
59
204
353
379
528
522
2012
2013
2014
3
TCEH has hedged 100% of its estimated natural gas price exposure for 2012. |
 13
13
13
EFH Corp. Adjusted EBITDA Sensitivities
Commodity
Percent Hedged at
March 31, 2012
Change
BOY 12E Impact
$ millions
7X24 market heat rate (MMBtu/MWh)
~75
0.1 MMBtu/MWh
~5
NYMEX gas price ($/MMBtu)
~100
$1/MMBtu
~0
Diesel ($/gallon)
~100
$1/gallon
~0
Base coal ($/ton)
4
>100
$2/ton
~2
Generation operations
Nuclear-
and coal / lignite-fueled generation (TWh)
N/A
1 TWh
~15
Retail operations
FY 2012
Residential contribution margin ($/MWh)
17 TWh
$1/MWh
~17
Residential consumption
17 TWh
1%
~6
Business markets consumption
13 TWh
1%
~2
Impact
on
EFH
Corp.
Adjusted
EBITDA
1
12E; mixed measures
The majority of 2012 commodity-related risks are significantly mitigated.
1
2012 estimate based on commodity positions as of 3/31/12 and reflecting the impact
of CAIR, net of natural gas hedges and wholesale/retail effects. Potential impacts of CSAPR following
the outcome of the pending legal proceeding are not reflected. Excludes gains and
losses incurred prior to March 31, 2012. 2
Simplified
representation
of
heat
rate
position
in
a
single
TWh
position.
Heat
rate
impacts
are
typically
differentiated
across
plants
and
respective
pricing
periods:
nuclear
and
coal-fueled
plants generation (linked primarily to changes in North Hub 7x24), natural gas
plants (primarily North Hub 5x16) and wind (primarily West Hub7x8). Assumes conversion of electricity
positions based on a ~8.5 market heat rate with natural gas generally being on the
margin ~70-90% of the time (i.e., when coal is forecast to be on the margin, no natural gas position is
assumed to be generated).
3
Includes positions related to fuel surcharge on rail transportation.
4
Excludes fuel surcharge on rail transportation.
2
3 |
 $0.50
$0.75
$1.88
$1.79
$2.63
2nd Lien
1st Lien
Estimate as of March 31, 2012; $ billions
EFH / EFIH
TCEH
1
1st Lien
$0.50
$0.75
2
2nd Lien
$1.29
$1.88
3
Total
$1.79
$2.63
Estimated Secured Debt Capacity at EFH / EFIH and TCEH
1
14
$1.29
The debt capacity numbers presented above are for informational purposes only and should not be relied
upon in connection with any investment decision regarding the securities of EFH Corp. or its
subsidiaries. All of these amounts are estimates based on EFH Corp.'s current interpretation of the covenants set forth in its and its subsidiaries' applicable debt
agreements and do not take into account exceptions in the agreements that may allow for the incurrence
of additional secured debt, including, but not limited to, acquisition debt, coverage ratio
debt, refinancing debt, capital leases and hedging obligations. Moreover, such amounts could change from time to time as a result of, among other things, the
termination of any debt agreement (or specific terms therein) or a change in the debt agreement that
results from negotiations with new or existing lenders. In addition, covenants included
in agreements governing additional, future debt may impose greater or lesser restrictions on the incurrence of secured debt by EFH Corp. and its subsidiaries.
Consequently, the actual amount of senior secured debt that EFH Corp. and its subsidiaries are
permitted to incur under their respective debt agreements could be materially different than
the amounts provided above. EFH Corp. encourages you to review, in consultation with your own advisors, its and its subsidiaries’ various debt agreements, which
are on file with the SEC, in order to assess the ability and capacity of EFH Corp. and its
subsidiaries to incur additional debt (secured and unsecured) in the future. EFH Corp. debt capacity reduced by any debt issued at EFIH and/or TCEH (other than indebtedness
meeting the requirements of the refinancing carve-out). EFIH debt capacity reduced by any debt issued at EFH Corp. and/or TCEH (other than indebtedness
meeting the requirements of the refinancing carve-out). Of this amount, $1.0B is permitted to be issued for cash (entire amount is permitted to be
issued for exchanges). TCEH is permitted to issue an unlimited amount of additional first-priority debt in order to
refinance the first-priority debt outstanding under the TCEH Senior Secured Facilities.
1
2
3
4
5
2,3
4
5 |
 15
Today’s Agenda
Q&A
Financial and Operational
Overview
Q1 2012 Review
John Young
President & CEO |
 HSC
Natural Gas Prices $/MMBtu
ERCOT North Hub ATC (7x24) Heat Rate
MMBtu/MWh
Forward Natural Gas Prices and Heat Rates
Forward gas prices declined due to shale production and mild weather; heat rates have
risen due to an expectation of tightening reserve margins and ERCOT / PUCT
actions for resource adequacy
1
2014 prices became observable year-end 2011.
2
Calendar 2012 represents market price for the balance of the year. For example,
Calendar 2012 for April 2012 represents prices from May through December.
1
16 |
 17
1
ERCOT Capacity, Demand and Reserves (CDR) Summary, Dec 11, as updated by
their Board of Directors Report, January 2012. 2
Historical reserve margins based on projections for each year prior to summer peak
season, based on the formula in effect at the time. Resource Adequacy in
ERCOT ERCOT reserve margin
1
2011A-2016E; percent
3.8
13.9
12.1
7.6
3.6
4.2
'11
'12
'13
'14
'15
'16
Historical
forecasts
2
Operating
reserve
on
Aug.
3,
2011
Dec
2011
forecast
1
17.5
ERCOT’s 13.75% target reserve margin
provides a buffer against de-rates,
forced outages, wind variability,
forecast error, and weather related
spikes
Current
Market
Activities:
Stakeholders are actively working with the
PUCT and ERCOT to develop several
market enhancements
o
Established minimum offer floor pricing
during deployment of certain reliability
related services
Pending PUCT/ERCOT actions and
deliberations:
Eliminate or mitigate the price dampening
impact of various inefficient rules and
protocols
–
Increase the system-wide offer cap for
2012 and beyond
–
Increase the administrative pricing
mechanism for scarcity events by changing
the power balance penalty curve
–
Brattle Group recommendations due in
June for other market enhancements,
including longer-term solutions
Take positive action to signal regulatory
support for prices indicative of scarcity
conditions
–
– |
 18
Today’s Agenda
Q&A
Financial and Operational
Overview
Q1 2012 Review
EFH Corp. Senior Executive Team |
 19
Questions & Answers |
 20
Appendix –
Additional Slides and
Regulation G Reconciliations
Appendix |
 Financial Definitions
Measure
Definition
Adjusted (non-GAAP)
Operating Results
Net income (loss) adjusted for items representing income or losses that are not
reflective of underlying operating results. These items include
unrealized mark-to-market gains and losses, noncash impairment charges and other charges, credits or gains that
are unusual or nonrecurring. EFH Corp. uses adjusted (non-GAAP) operating
results as a measure of performance and believes that analysis of its business
by external users is enhanced by visibility to both net income (loss) prepared in accordance with
GAAP and adjusted (non-GAAP) operating earnings (losses).
Adjusted EBITDA
(non-GAAP)
EBITDA adjusted to exclude interest income, noncash items, unusual items, results of
discontinued operations and other adjustments allowable under the EFH Corp.
senior secured notes indenture. Adjusted EBITDA plays an important role in respect of
certain covenants contained in this indenture. Adjusted EBITDA is not intended
to be an alternative to GAAP results as a measure of operating performance or
an alternative to cash flows from operating activities as a measure of liquidity or an alternative to any
other measure of financial performance presented in accordance with GAAP, nor is it
intended to be used as a measure of free cash flow available for EFH
Corp.’s discretionary use, as the measure excludes certain cash requirements such as interest payments, tax
payments and other debt service requirements. Because not all companies use
identical calculations, Adjusted EBITDA may not be comparable
to
similarly
titled
measures
of
other
companies.
See
EFH
Corp.’s
filings
with
the
SEC
for
a
detailed
reconciliation
of
EFH Corp.’s net income prepared in accordance with GAAP to Adjusted
EBITDA. Competitive Business
Results
Refers to the combined results of the Competitive Electric segment and Corporate
& Other. Contribution Margin (non-
GAAP)
Operating revenues less fuel, purchased power costs, and delivery fees, plus or
minus net gain (loss) from commodity hedging and trading activities, which on
an adjusted (non-GAAP) basis, exclude unrealized gains and losses.
EBITDA
(non-GAAP)
Net income (loss) before interest expense and related charges, income tax expense
(benefit) and depreciation and amortization. GAAP
Generally accepted accounting principles.
Purchase Accounting
The purchase method of accounting for a business combination as prescribed by GAAP,
whereby the purchase price of a business combination
is
allocated
to
identifiable
assets
and
liabilities
(including
intangible
assets)
based
upon
their
fair
values.
The
excess
of the purchase price over the fair values of assets and liabilities is recorded as
goodwill. Depreciation and amortization due to purchase accounting represents
the net increase in such noncash expenses due to recording the fair market values of property,
plant and equipment, debt and other assets and liabilities, including intangible
assets such as emission allowances, customer relationships and sales and
purchase contracts with pricing favorable to market prices at the date of the Merger. Amortization is
reflected in revenues, fuel, purchased power costs and delivery fees, depreciation
and amortization and interest expense in the income statement.
Regulated Business
Refers to the results of the Regulated Delivery segment, which consists largely of
EFH Corp.’s investment in Oncor. 21 |
 Table
1: EFH Corp. Adjusted EBITDA Reconciliation Three Months Ended March 31, 2011
and 2012 $ millions
Factor
Q1 11
Q1 12
Net loss attributable to EFH Corp.
(362)
(304)
Income tax benefit
(215)
(180)
Interest expense and related charges
643
785
Depreciation and amortization
369
337
EBITDA
435
638
Adjustments to EBITDA (pre-tax):
Oncor distributions/dividends
16
36
Interest income
(2)
(2)
Amortization of nuclear fuel
37
42
Purchase
accounting
adjustments
1
50
21
Impairment of assets and inventory write-down
-
1
Equity in earnings of unconsolidated subsidiary
(50)
(57)
Unrealized net loss resulting from hedging and trading transactions
316
152
Noncash
compensation
expense
2
-
4
Severance expense
3
1
Transition
and
business
optimization
costs
3
5
9
Transaction
and
merger
expenses
4
9
10
Restructuring
and
other
5
(25)
(1)
Expenses
incurred
to
upgrade
or
expand
a
generation
station
6
36
26
EFH Corp. Adjusted EBITDA per Incurrence Covenant
830
880
Add back Oncor adjustments
336
350
EFH Corp. Adjusted EBITDA per Restricted Payments Covenant
1,166
1,230
22
1
2
3
4
5
6
Includes amortization of the intangible net asset value of retail and wholesale power sales
agreements, environmental credits, coal purchase contracts, nuclear fuel contracts and power
purchase agreements and the stepped-up value of nuclear fuel. Also includes certain credits
and gains on asset sales not recognized in net income due to purchase accounting. Represents amounts recorded under stock-based compensation accounting standards and excludes
capitalized amounts.
Includes certain incentive compensation expenses as well as professional fees and other costs related
to generation plant reliability and supply chain efficiency initiatives.
Primarily represents Sponsor Group management fees. Includes settlement of amounts due from a hedging/trading counterparty. Reflects noncapital outage costs.
|
 Table
2: TCEH Adjusted EBITDA Reconciliation Three Months Ended March 31, 2011 and
2012 $ millions
Factor
Q1 11
Q1 12
Net loss
(301)
(238)
Income tax benefit
(155)
(115)
Interest expense and related charges
498
622
Depreciation and amortization
362
330
EBITDA
404
599
Adjustments to EBITDA (pre-tax):
Interest income
(27)
(17)
Amortization of nuclear fuel
37
42
Purchase accounting adjustments
38
9
EBITDA amount attributable to consolidated unrestricted subsidiaries
(2)
(2)
Unrealized net loss resulting from hedging and trading transactions
316
152
Corp. depreciation, interest and income tax expense included in SG&A
3
4
Noncash compensation expense
-
3
Severance expense
-
1
Transition and business optimization costs
6
9
Transaction and merger expenses
11
10
Restructuring and other
(17)
(2)
Expenses incurred to upgrade or expand a generation station
36
26
TCEH Adjusted EBITDA per Incurrence Covenant
805
834
Expenses related to unplanned generation station outages
58
26
Other adjustments allowed to determine Adjusted EBITDA per Maintenance Covenant
8
-
TCEH Adjusted EBITDA per Maintenance Covenant
871
860
23
1
2
3
4
5
6
7
1
Includes amortization of the intangible net asset value of retail and wholesale power sales
agreements, environmental credits, coal purchase contracts, nuclear fuel contracts and power
purchase agreements and the stepped up value of nuclear fuel. Also includes certain credits and gains on asset sales not recognized in net income due to purchase
accounting.
2
Includes expenses recorded under stock-based compensation accounting standards and excludes
capitalized amounts. 3
Includes certain incentive compensation expenses as well as professional fees and other costs
related to generation plant reliability and supply chain efficiency initiatives.
4
Primarily represents Sponsor Group management fees.
5
Includes settlement of amounts due from a hedging/trading counterparty.
6
Reflects noncapital outage costs.
7
Primarily pre-operating expenses related to Oak Grove and Sandow 5 generation facilities.
|
 Table
3: Oncor Adjusted EBITDA Reconciliation Three Months Ended March 31, 2011 and
2012 $ millions
Factor
Q1 11
Q1 12
Net income
65
75
Income tax expense
40
49
Interest expense and related charges
90
91
Depreciation and amortization
172
184
EBITDA
367
399
Interest income
(10)
(8)
Purchase accounting adjustments
(8)
(6)
Noncash compensation expense
-
1
Transition and business optimization costs and other
2
-
Oncor Adjusted EBITDA
351
386
1
Purchase accounting adjustments consist of amounts related to the accretion of an
adjustment (discount) to regulatory assets. 2
Includes expenses recorded under stock-based compensation accounting
standards. 24
1
2 |