Attached files
| file | filename |
|---|---|
| 8-K - 8-K - AMAG PHARMACEUTICALS, INC. | a12-10925_18k.htm |
| EX-99.1 - EX-99.1 - AMAG PHARMACEUTICALS, INC. | a12-10925_1ex99d1.htm |
Exhibit 99.2
|
|
1Q 2012 Financial Results May 1, 2012 1 |
|
|
Forward Looking Statements This presentation contains forward-looking statements within the meaning of the Private Securities Litigation Reform Act of 1995 and other federal securities laws. Any statements contained herein which do not describe historical facts, including but not limited to: the potential size of the addressable market for Feraheme and the potential size of the broad IDA market; the potential incremental Feraheme sales potential from geographic and label expansion; our expectations regarding EU Commission approval and subsequent commercial launch of Rienso(R) in the EU, the expected timing thereof, the expected timing of Feraheme's commercial launch in Canada, and the milestone payments we expect to receive from Takeda in connection therewith; the expected timing of our sNDA filing for the broad IDA indication for Feraheme; statements regarding our 2012 financial guidance, including our expected 2012 net Feraheme product revenues, our expected 2012 operating expenses, including expected research and development and selling, general and administrative expenses, our expected cost of goods sold, and our expected 2012 year-end cash and investments balance, and any potential milestone payments we expect to receive; our expectation to operate at cash flow break even in 2012; our expectations regarding the 2012 market growth in the hematology/oncology and hospital segments and our targeted 2012 Feraheme market share in those segments; our expectation regarding the growth of Feraheme provider demand in 2012 as compared to 2011; are forward-looking statements which involve risks and uncertainties that could cause actual results to differ materially from those discussed in such forward-looking statements. Such risks and uncertainties include: (1) uncertainties regarding our and Takeda's ability to successfully compete in the intravenous iron replacement market both in the U.S. and outside the U.S., (2) uncertainties regarding our ability to successfully and timely complete our clinical development programs and obtain regulatory approval for Feraheme in the broader IDA indication and in territories outside of the U.S., including the European Union, (3) the fact that significant safety or drug interaction problems could arise with respect to Feraheme, (4) uncertainties regarding our ability to manufacture Feraheme, (5) uncertainties relating to our patents and proprietary rights, (6) the risk that ferumoxytol/Rienso(R) does not receive final marketing approval in the EU from the EMA, and (7) other risks identified in our Securities and Exchange Commission filings, including our Annual Report on Form 10-K for the year ended December 31, 2011. We caution you not to place undue reliance on any forward-looking statements, which speak only as of the date they are made. We disclaim any obligation to publicly update or revise any such statements to reflect any change in expectations or in events, conditions or circumstances on which any such statements may be based, or that may affect the likelihood that actual results will differ from those set forth in the forward-looking statements. 2 |
|
|
Agenda Topic Speaker Introduction and Overview Frank Thomas, interim CEO Feraheme US CKD Business Broad IDA Opportunity John Tucker, VP of Commercial Operations Financial Highlights and Outlook Scott Holmes, VP of Finance Closing Remarks Frank Thomas, interim CEO |
|
|
FRANK THOMAS, CHIEF OPERATING OFFICER AND INTERIM CEO 4 |
|
|
Leveraging Core Assets to Create Long-term Stockholder Value 5 Working with advisors to evaluate all strategic options to enhance stockholder value and leverage AMAG’s core assets Reigniting top-line growth of Feraheme with realigned expense structure ensures our balance sheet remains strong |
|
|
US CKD business returns to growth Record Feraheme provider demand in 1Q12 40% period-over-period non-dialysis provider demand growth 10% sequential quarter growth Feraheme growth exceeded market growth tenfold International expansion milestones Canadian launch planned by Takeda in 2Q12; triggers $3 million milestone Positive recommendation received from CHMP; European approval and launch expected in 2H12 and triggers $30 million in milestones Label expansion efforts on track IDA phase III program completed enrollment IDA-302 data released; Feraheme achieved primary efficacy endpoints; no new safety signals were observed sNDA filing by end of 2012 Reiterating financial guidance Realizing positive financial impact of 2011 restructuring Operating expenses down 22% compared to 1Q11 6 2012 Year-to-Date Highlights |
|
|
FERAHEME US CKD BUSINESS JOHN TUCKER, VP COMMERCIAL OPERATIONS |
|
|
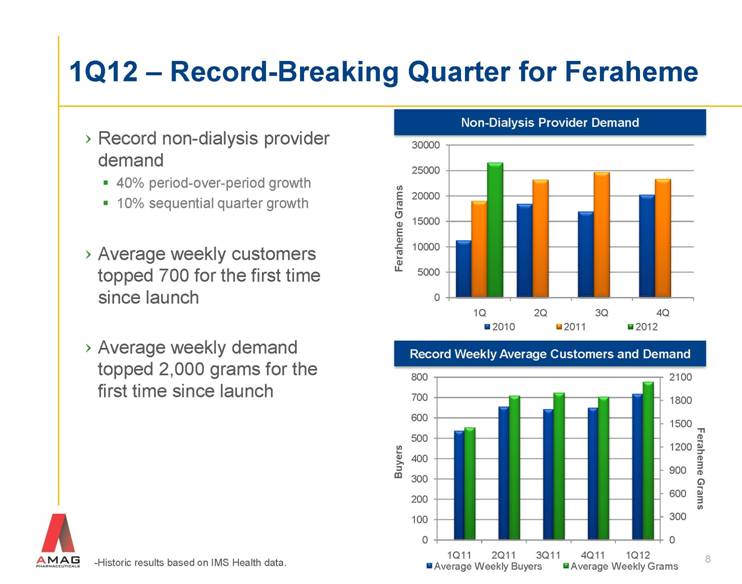
8 1Q12 – Record-Breaking Quarter for Feraheme -Historic results based on IMS Health data. Feraheme Grams Record non-dialysis provider demand 40% period-over-period growth 10% sequential quarter growth Average weekly customers topped 700 for the first time since launch Average weekly demand topped 2,000 grams for the first time since launch Non-Dialysis Provider Demand Record Weekly Average Customers and Demand Buyers Feraheme Grams |
|
|
Increasing Demand and Share in Two Largest Market Segments Source: IMS Monthly Data. 9 Feraheme in Hematology/Oncology Segment Feraheme in Hospital Segment Market Data Hematology/Oncology Segment ~206,000 IV iron grams in 2011 ~26% of total non-dialysis IV iron use Expect market growth of 7% (’12/’11) 2012 Feraheme target share: 26% Hospital Segment ~513,000 IV iron grams in 2011 ~65% of total non-dialysis IV iron use Expect market growth of 6% (’12/’11) 2012 Feraheme target share: 7% Feraheme focused on outpatient business |
|
|
2012 Commercial Priorities Implement targeted account call plan for sales representatives Feraheme segmentation messaging and patient profiling for all target audiences Leverage relationships with hematology/oncology GPOs to drive access in hard to see accounts and build awareness of Feraheme and the prevalence of CKD in IDA patients Pricing strategy to improve net effective price per gram 5% WAC price increase effective May 2012 Increase in net effective price anticipated in 2H12 10 |
|
|
11 Feraheme — On Track to Meet Forecasted Growth -Historic results based on IMS Monthly Data, IMS Weekly Data and Wholesaler Shipment Data. Feraheme Grams ~40% Growth in Feraheme Provider Demand from 2010 - 2011 >15% Growth in Feraheme Provider Demand Estimated from 2011 - 2012 |
|
|
BROAD IDA OPPORTUNITY JOHN TUCKER, VP COMMERCIAL OPERATIONS |
|
|
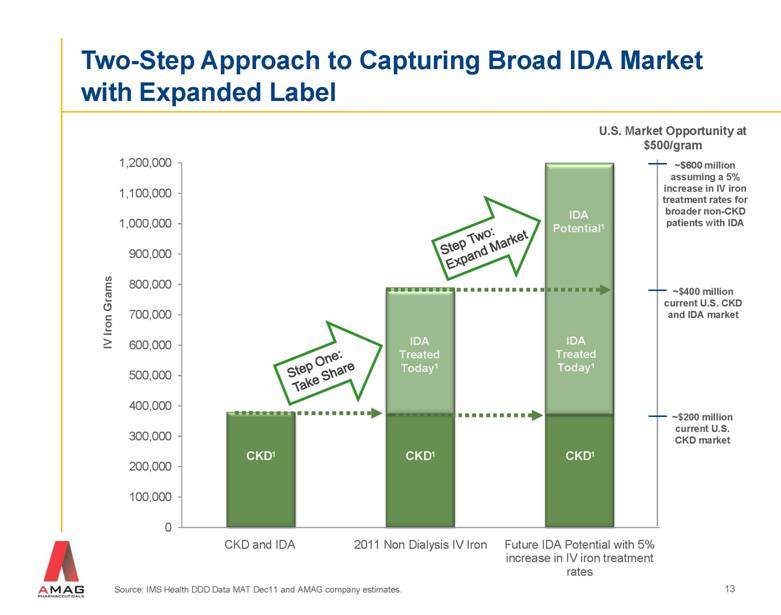
Source: IMS Health DDD Data MAT Dec11 and AMAG company estimates. IV Iron Grams CKD1 CKD1 IDA Treated Today1 CKD1 IDA Potential1 Two-Step Approach to Capturing Broad IDA Market with Expanded Label Step One: Take Share IDA Treated Today1 ~$600 million assuming a 5% increase in IV iron treatment rates for broader non-CKD patients with IDA U.S. Market Opportunity at $500/gram ~$400 million current U.S. CKD and IDA market ~$200 million current U.S. CKD market Step Two: Expand Market 13 |
|
|
FINANCIAL OVERVIEW SCOTT HOLMES, VP OF FINANCE 14 |
|
|
First Quarter Financial Highlights ($ in millions, except per share ) 1Q-2012 1Q-2011 Total Revenues $15.3 $13.4 Net Feraheme Product Revenues 13.6 10.9 Cost of Product Sales 2.6 3.0 R&D Expenses 12.5 13.6 SG&A Expenses 13.2 19.6 Net Loss (12.4) (22.3) Loss Per Share (0.58) (1.05) 15 Balance Sheet $218 million in cash and investments as of March 31, 2012 Results of operations (1Q 2012 vs. 1Q 2011) 40% growth in Feraheme non-dialysis provider demand Inventory down ~750 grams 23% increase in net Feraheme product revenues Operating expenses down 22% Net loss nearly cut in half |
|
|
Strong Financial Profile 16 GAAP Revenue Operating Expenses (excluding COGS) ($ in millions) ($ in millions) $53 – $57 million in Feraheme net product revenue >15% growth in grams $33 million of cash milestones to be received COGS assumed to be 14-18% of net product sales $90 – $95 million in total operating expenses $40 – $45 million in R&D $50 – $55 million in SG&A Committed to managing business to cash flow breakeven End 2012 with $225 – $230 million 2012 Financial Outlook *Represents $3.0 million reversal in Medicaid reserves in the third quarter of 2011. |
|
|
CLOSING REMARKS FRANK THOMAS, CHIEF OPERATING OFFICER AND INTERIM CEO 17 |
|
|
Focus on Performance During Time of Uncertainty 18 |
|
|
AMAG: Well Positioned for Growth in 2012 and Beyond Clinical and regulatory Complete enrollment of broad IDA phase 3 registration program Regulatory decisions in international markets on CKD filings Positive opinion received from EMA Present/publish IDA program data IDA-302 achieved both primary efficacy endpoints Submit sNDA in US for broad IDA indication Commercial and business Complete strategic alternatives process Support international launches of Feraheme in Europe and Canada Deliver on financial guidance for 2012 1Q 2012 meets or exceeds AMAG forecast 19 |
|
|
Q&A 20 INVESTOR RELATIONS CONTACT: 617-498-3303 |