Attached files
| file | filename |
|---|---|
| EX-1.1 - FORM OF UNDERWRITING AGREEMENT - EXTEND HEALTH INC | d211158dex11.htm |
| EX-4.1 - SPECIMEN COMMON STOCK CERTIFICATE OF THE REGISTRANT - EXTEND HEALTH INC | d211158dex41.htm |
| EX-10.2 - 2004 EQUITY INCENTIVE PLAN AND FORM OF STOCK OPTION AGREEMENT - EXTEND HEALTH INC | d211158dex102.htm |
| EX-10.1 - FORM OF INDEMNIFICATION AGREEMENT - EXTEND HEALTH INC | d211158dex101.htm |
| EX-10.3 - 2007 EQUITY INCENTIVE PLAN AND FORM OF STOCK OPTION AGREEMENT - EXTEND HEALTH INC | d211158dex103.htm |
| EX-21.1 - LIST OF SUBSIDIARIES OF THE REGISTRANT - EXTEND HEALTH INC | d211158dex211.htm |
| EX-23.1 - CONSENT OF INDEPENDENT REGISTERED PUBLIC ACCOUNTING FIRM - EXTEND HEALTH INC | d211158dex231.htm |
| EX-10.16 - EXECUTIVE INCENTIVE COMPENSATION PLAN - EXTEND HEALTH INC | d211158dex1016.htm |
| EX-10.4 - 2012 EQUITY INCENTIVE PLAN AND FORM OF AWARD AGREEMENT - EXTEND HEALTH INC | d211158dex104.htm |
Table of Contents
As filed with the Securities and Exchange Commission on April 30, 2012
Registration No. 333-178910
UNITED STATES SECURITIES AND EXCHANGE COMMISSION
Washington, D.C. 20549
AMENDMENT NO. 3
TO
FORM S-1
REGISTRATION STATEMENT
Under
The Securities Act of 1933
EXTEND HEALTH, INC.
(Exact name of registrant as specified in its charter)
| Delaware | 6411 | 26-0775680 | ||
| (State or other jurisdiction of incorporation or organization) |
(Primary Standard Industrial Classification Code Number) |
(I.R.S. Employer Identification Number) |
2929 Campus Drive, Suite 400
San Mateo, California 94403
(650) 288-4800
(Address, including zip code, and telephone number, including area code, of registrant’s principal executive offices)
Bryce A. Williams
President and Chief Executive Officer
2929 Campus Drive, Suite 400
San Mateo, California 94403
(650) 288-4800
(Name, address, including zip code, and telephone number, including area code, of agent for service)
Copies to:
| Steven E. Bochner Jon C. Avina Wilson Sonsini Goodrich & Rosati, P.C. 650 Page Mill Road Palo Alto, California 94304 (650) 493-9300 |
Thomas J. Smith General Counsel 2929 Campus Drive, Suite 400 San Mateo, California 94403 (650) 288-4800 |
Richard A. Kline Anthony J. McCusker Goodwin Procter LLP 135 Commonwealth Drive Menlo Park, California 94025 (650) 752-3100 |
Approximate date of commencement of proposed sale to the public: As soon as practicable after this registration statement becomes effective.
If any of the securities being registered on this Form are to be offered on a delayed or continuous basis pursuant to Rule 415 under the Securities Act of 1933 check the following box: ¨
If this Form is filed to register additional securities for an offering pursuant to Rule 462(b) under the Securities Act, please check the following box and list the Securities Act registration statement number of the earlier effective registration statement for the same offering. ¨
If this Form is a post effective amendment filed pursuant to Rule 462(c) under the Securities Act, check the following box and list the Securities Act registration statement number of the earlier effective registration statement for the same offering. ¨
If this Form is a post effective amendment filed pursuant to Rule 462(d) under the Securities Act, check the following box and list the Securities Act registration statement number of the earlier effective registration statement for the same offering. ¨
Indicate by check mark whether the registrant is a large accelerated filer, an accelerated filer, a non-accelerated filer, or a smaller reporting company. See the definitions of “large accelerated filer,” “accelerated filer” and “smaller reporting company” in Rule 12b-2 of the Exchange Act. (Check one):
| Large accelerated filer ¨ | Accelerated filer ¨ | |||
| Non-accelerated filer x | (do not check if a smaller reporting company) | Smaller reporting company ¨ | ||
The registrant hereby amends this registration statement on such date or dates as may be necessary to delay its effective date until the registrant shall file a further amendment which specifically states that this registration statement shall thereafter become effective in accordance with Section 8(a) of the Securities Act of 1933 or until the registration statement shall become effective on such date as the Securities and Exchange Commission, acting pursuant to said Section 8(a), may determine.
Table of Contents
The information in this prospectus is not complete and may be changed. We may not sell these securities until the registration statement filed with the Securities and Exchange Commission is effective. This prospectus is not an offer to sell these securities and we are not soliciting offers to buy these securities in any jurisdiction where the offer or sale is not permitted.
PROSPECTUS (Subject to Completion)
Issued April 30, 2012
Shares

COMMON STOCK
Extend Health, Inc. is offering shares of its common stock. This is our initial public offering and no public market currently exists for our shares. We anticipate that the initial public offering price of our common stock will be between $ and $ per share.
We have applied to list our common stock on The NASDAQ Global Market under the symbol “XH.”
We are an “emerging growth company” under applicable federal securities laws and will be subject to reduced public company reporting requirements.
Investing in our common stock involves risks. See “Risk Factors” beginning on page 11.
PRICE $ A SHARE
| Price to Public |
Underwriting Discounts and Commissions |
Proceeds to Extend Health | ||||
| Per Share |
$ | $ | $ | |||
| Total |
$ | $ | $ |
We have granted the underwriters the right to purchase up to an additional shares of common stock to cover over-allotments, exercisable at any time until 30 days after the date of this prospectus.
The Securities and Exchange Commission and state securities regulators have not approved or disapproved of these securities or determined if this prospectus is truthful or complete. Any representation to the contrary is a criminal offense.
The underwriters expect to deliver the shares of common stock to purchasers on , 2012.
| MORGAN STANLEY | BARCLAYS |
WELLS FARGO SECURITIES
, 2012
Table of Contents

Table of Contents
You should rely only on the information contained in this prospectus or contained in any free writing prospectus prepared by or on behalf of us. Neither we nor the underwriters have authorized anyone to provide you with information different from, or in addition to, that contained in this prospectus or any related free writing prospectus. This prospectus is an offer to sell only the shares offered hereby but only under circumstances and in jurisdictions where it is lawful to do so. The information contained in this prospectus is current only as of its date, regardless of its delivery. Our business, financial condition, results of operations and prospects may have changed since that date.
Through and including , 2012 (the 25th day after the date of this prospectus), all dealers effecting transactions in these securities, whether or not participating in this offering, may be required to deliver a prospectus. This is in addition to a dealer’s obligation to deliver a prospectus when acting as an underwriter and with respect to an unsold allotment or subscription.
For investors outside the United States: neither we nor any of the underwriters have done anything that would permit this offering or possession or distribution of this prospectus in any jurisdiction where action for that purpose is required, other than the United States. You are required to inform yourselves about and to observe any restrictions relating to this offering and the distribution of this prospectus.
-i-
Table of Contents
This summary highlights selected information appearing elsewhere in this prospectus and is qualified in its entirety by the more detailed information and financial statements included elsewhere in this prospectus. This summary may not contain all the information you should consider before investing in our common stock. You should carefully read this prospectus in its entirety before investing in our common stock, including “Risk Factors” and “Management’s Discussion and Analysis of Financial Condition and Results of Operations” and our consolidated financial statements and related notes included elsewhere in this prospectus.
EXTEND HEALTH, INC.
Overview
Extend Health is a leading provider of health benefit management services and operates the largest private Medicare exchange in the United States. As a technology leader in the health insurance industry, we are redefining the manner in which health benefits are offered and delivered. Our solutions create cost savings for our employer clients and provide our individual customers with improved choice and control over their health benefits. Our core solution, ExtendRetiree, enables our employer clients to transition their retirees to individual, defined contribution health plans that provide individuals with a tax-free allowance or “contribution” to spend on their healthcare at an annual cost that the employer controls versus group-based, defined benefit health plans that provide groups of individuals with defined healthcare benefits such as doctor visits, hospitalization and prescription drugs at an uncertain annual cost. ExtendRetiree allows our clients to provide their post-65 retirees with the same or better healthcare benefits at a lower cost to our clients. To date, we have provided an effective alternative to traditional group Medicare health plans for over 150 private and public sector clients, including over 30 Fortune 500 companies such as Caterpillar, General Motors, Honeywell and Whirlpool, and we have helped hundreds of thousands of retirees and their dependents navigate to, evaluate and choose a health plan using our proprietary exchange platform and decision support tools. In addition, we are developing and expanding our solutions to address the pre-65 retiree, or early retiree, and active employee exchange opportunities for our existing and prospective clients.
We provide our solutions through our proprietary technology platform, which integrates our patented call-routing technology, efficient Medicare quoting and enrollment engine, custom-developed CRM system and comprehensive insurance carrier connectivity. We deliver our solutions by:
| • | analyzing and optimizing employer healthcare benefit subsidies and developing healthcare coverage strategies so that our clients can predict their future healthcare liabilities and realize immediate and significant cost savings by transitioning their retirees to defined contribution plans; |
| • | managing an exchange of over 75 national and regional insurance carriers offering thousands of health plans that compete on price, coverage and quality; |
| • | simplifying the complexities of Medicare by helping individuals navigate through a meaningful choice of health plans using our proprietary software to analyze employer subsidies, health plan details and individuals’ doctor, hospital and prescription drug needs; |
| • | offering retirees and employees unbiased guidance about their expanded healthcare options and our enrollment services that match their individual health status and financial resources to a specific plan; and |
| • | providing lifelong advocacy and support services for each individual as they engage with insurance carriers beginning with their initial enrollment and continuing as their healthcare needs evolve. |
-1-
Table of Contents
While we have provided health benefit management services to hundreds of thousands of retirees and their dependents, our core market opportunity remains largely unaddressed, with an estimated 12 million Medicare-eligible retirees currently receiving some form of employer-sponsored group Medicare coverage. Moreover, we believe that this market will grow significantly as the number of Americans over age 65 continues to grow.
We believe there are significant opportunities to further penetrate our core market and expand into new target markets. For instance, we are broadening our presence among public sector employers, such as through our engagement with the State of Nevada to transition its 10,000 retirees to individual Medicare plans. In addition, we are developing and expanding our solutions to address the early retiree and active employee markets.
We generate most of our revenue from the commissions that we receive from insurance carriers for enrolling individuals into their health plans. These commissions result in increasing recurring revenue as our number of active members grows. The vast majority of our revenue is currently derived from Medicare-related plans, including Medicare supplement, Medicare Advantage and Medicare Part D prescription drug plans. As of March 31, 2012, we had 213,900 active core members enrolled in a Medicare supplement or Medicare Advantage plan. Our revenue has grown from $12.4 million in the fiscal year ended June 30, 2008 to $51.1 million in the fiscal year ended June 30, 2011.
Healthcare Trends Driving Demand for our Health Benefit Management Solutions
We expect that several trends will continue to expand our market opportunities, including:
| • | Increasing healthcare costs. Healthcare-related costs have become one of the largest benefit-related expenses for employers. The Centers for Medicare and Medicaid Services, or CMS, estimates that in 2009 private and public sector employers spent $548 billion on healthcare coverage, nearly doubling over the previous 10 years. According to a 2011 Towers Watson report, the cost of insuring employees is projected to have increased by 38% from 2006 to 2011. |
| • | Increasing individual responsibility for healthcare costs. In response to rising healthcare costs, many group-based health plans have reduced benefits, shifted costs to retirees and employees, or both. CMS estimates that private health insurance expenditures increased by 91% from 1999 to 2009. According to a 2011 Towers Watson report, the average individual’s share of their total healthcare premium was estimated to have reached 24% in 2011. Furthermore, while healthcare costs have become a top household expense, there has not been a corresponding increase in control and choice over individual healthcare options. |
| • | Aging population. According to the U.S. Census, from 2011 through 2030 an estimated 10,000 individuals per day will reach the age of 65 and become eligible for Medicare. The number of individuals who are over the age of 65 is expected to increase from approximately 40.2 million individuals in 2010, or 13% of the U.S. population, to approximately 54.8 million individuals by 2020, or 16% of the U.S. population. Moreover, post-65 individuals are becoming increasingly comfortable using technology to research personal healthcare information. |
| • | Increasing incentives for employers to eliminate group retiree drug benefits. In 2013, employers’ tax deduction for the Retiree Drug Subsidy, or the RDS, will be eliminated, thereby increasing employers’ cost of providing prescription drug coverage to retirees using group-based health plans. In addition, while there has historically been a gap in Medicare’s prescription drug coverage, upcoming changes to Medicare Part D will gradually eliminate this gap by 2020. We believe that the elimination of the tax-deductibility of the RDS together with the closing of the gap in Medicare Part D prescription drug coverage will make individual Medicare plans more attractive to employers and retirees. |
| • | Healthcare reform. Over the past decade, certain Federal legislation in the United States, such as the Medicare Modernization Act and the Medicare Improvement for Patients and Providers Act, has |
-2-
Table of Contents
| strengthened the foundation on which we have built our business model. More recent healthcare reform legislation requires that states establish health insurance exchanges where individuals can select and purchase health plans. In addition, just as private Medicare plans are required to do today, healthcare reform will require insurance carriers to offer standardized plan designs and accept all pre-65 individuals, regardless of their age or health status, which is referred to as “guaranteed issue.” While healthcare reform involves uncertainty and may be modified or repealed, we believe that these healthcare reform measures will accelerate the adoption of exchanges, further enabling the transition of healthcare in the United States from group-based coverage to individual plans. |
Our Solutions
We believe our solutions offer employers and retirees a new experience with managing healthcare benefits. Our proprietary technology platform delivers our integrated solutions to our clients, customers and carrier partners through a multi-step process that starts with an actuarial assessment for a prospective employer client to determine the financial benefits of transitioning their retirees to ExtendRetiree. This analysis determines the optimal subsidy levels needed from the employer to support the transition of its retirees from their existing group-based health plan to individual health plans and enables employers to accurately quantify the expected reduction in their long-term healthcare financial obligations.
Once our employer clients have determined optimal subsidy levels, our proprietary software securely gathers and assimilates personal healthcare data from our clients and their retirees, as well as health plan information from our insurance carrier partners to ensure a smooth enrollment process. Concurrently, we work with our employer clients to design a communication campaign to educate their retirees about the transition from their current group health plan to individual health plans.
With the client and customer data integrated into our system, our patented call-routing technology provides our licensed benefit advisors with immediate access to a retiree’s profile that includes personalized information about the retiree’s healthcare needs and available subsidy. Our proprietary decision support tools then present the benefit advisor with a selection of health plans that has been optimized for the retiree’s unique healthcare needs. The benefit advisor then helps the retiree select and enroll in a plan by guiding the retiree through our streamlined application process.
The retiree’s application is then transmitted through our efficient and secure electronic exchange to the selected insurance carrier, allowing our customers to monitor the status of their application throughout the enrollment process. Our comprehensive platform also provides our clients with regular reports with which they can track their retiree enrollment metrics.
Our solutions enable our employer clients to:
| • | move to a more sustainable economic model by capping and controlling the costs associated with offering healthcare benefits to their retirees while continuing to honor their healthcare commitments; |
| • | eliminate the burden of procuring and administering inefficient group health plans for geographically dispersed retirees; and |
| • | ensure a smooth transition for their retirees from group-based to individual health plans by providing access to a health insurance exchange and a dedicated implementation team that delivers a complete suite of services, communication materials and education. |
Our solutions enable our individual customers to:
| • | compare a broad selection of insurance carriers, health plans and related provider networks unavailable from any single group plan; |
-3-
Table of Contents
| • | optimize their employer subsidy and choose a health plan that best meets their needs, using our plan comparison and selection tools to obtain quotes by plan type; and |
| • | receive ongoing unbiased guidance, enrollment services, advocacy and support from our trained and licensed benefit advisors. |
Our Strengths
We believe that we have the following key competitive strengths:
| • | Proprietary exchange platform. Our proprietary exchange platform integrates our patented call-routing technology, proprietary Medicare quoting and enrollment engine, custom-developed CRM system and comprehensive insurance carrier connectivity. We believe that our technology platform has enabled us to become the largest private Medicare exchange in the United States. |
| • | Attractive, proven business model and trusted brand name. Our high customer retention rate and commission-based revenue model produces a stable and recurring revenue stream. We have extensive experience having transitioned hundreds of thousands of retirees from more than 150 private and public sector employers and unions, including large employers such as General Motors and the State of Nevada. Our historical client retention rate exceeds 95% with our core solution, ExtendRetiree, which is a testament to our trusted brand name and exceptional service and support. |
| • | Strong relationships with a large number of insurance carriers. We offer our customers access to a broad selection of health plans from insurance carriers with which we have developed relationships over the past seven years. Our solutions are integrated with the information systems of our insurance carrier partners, which we believe results in a better customer experience, reduced customer turnover and greater efficiency for the insurance carriers. |
| • | Experienced management team. Our management team has significant experience in the health insurance and healthcare technology industries, and with using new business models to deliver healthcare benefits more efficiently. Our leadership efforts have resulted in a reputation for the development of innovative solutions that meet the future needs of the dynamic, evolving U.S. healthcare system. |
Our Growth Strategies
Our objective is to become the health benefit manager of choice for private and public sector employers, post-65 and early retirees and active employees. Our principal strategies to meet our objective are:
| • | Expand market share within the private sector in our core market. With an estimated 6.2 million retirees who have a health plan sponsored by their private sector employer, we believe there is a large opportunity to expand our market share in the private sector employer market. We intend to aggressively pursue opportunities to help private sector employers transition their retirees to individual health plans using our proprietary exchange platform. |
| • | Increase our presence in the public sector. With an estimated 5.8 million retirees who have a health plan sponsored by their public sector employer, we believe there is a significant opportunity to expand our market share in the public sector employer market. We are leveraging our private sector experience and initial public sector engagements to capture the growing demand by public sector employers for solutions to their state budget shortfalls and growing unfunded retiree liabilities. |
| • | Extend our technology leadership position. Our proprietary technology platform is a key competitive advantage that allows us to address our clients’ and customers’ healthcare benefit needs. We continue to innovate and invest in our software platform, call-routing technology, Medicare quoting and |
-4-
Table of Contents
| enrollment engine, CRM system and insurance carrier connectivity, as we believe these investments will allow us to extend our technology leadership position. |
| • | Maximize our existing channel partner strategy and add new channel partners. We have established partnerships with leading health and welfare benefit consultants and brokers, including Gallagher, Lockton, Mercer, Towers Watson, Wells Fargo Insurance Services and Willis. We intend to leverage our existing channel partners and add additional channel partners to gain deeper and broader access to potential clients in both the private and public sectors. |
| • | Cultivate a retail sales channel. There are approximately 32 million retirees participating in the Medicare program with no employer subsidy. We have begun to adapt our sales and marketing strategy to target these retail customers directly through a variety of consumer-centric media. We believe that this retail sales channel will continue to grow as more Americans turn age 65, affording us direct access to a broader base of potential customers. |
| • | Expand into new markets. We expect the demand for individual, defined contribution plans to grow beyond the Medicare market and are targeting these new opportunities. Initially, we are expanding our solution to help control employers’ early retiree healthcare costs. By building on our solutions for retirees, we also intend to offer solutions for our clients’ active employees. Finally, we are actively pursuing opportunities to work with various states to help them implement the state exchanges mandated by healthcare reform. |
Risks Affecting Us
Our business is subject to numerous risks and uncertainties. Please see “Risk Factors” immediately following this prospectus summary, which describes all of the significant risks of which we are aware. These risks include, but are not limited to, the following:
| • | We have a limited operating history in a new and rapidly evolving industry, which makes it difficult to evaluate our current business and future prospects and may increase the risk of your investment. |
| • | The marketing and sale of Medicare plans are subject to numerous, complex and frequently changing laws and regulations, and the impact of changes in laws related to Medicare or any failure to comply with them could harm our business, results of operations and financial condition. |
| • | If we are unable to retain our members, our business and results of operations would be harmed. |
| • | Our business may be harmed if we lose our relationships with insurance carriers, fail to maintain good relationships with insurance carriers, become dependent upon a limited number of insurance carriers or fail to develop new insurance carrier relationships. |
| • | Insurance carriers could reduce the commissions paid to us or change their plan pricing practices in ways that reduce the commissions paid to us, which could harm our revenue and results of operations. |
| • | Changes and developments in the health insurance system in the United States could harm our business. |
| • | Our results of operations fluctuate depending upon insurance carrier payment and reporting practices and the timing of our receipt of commission payments from insurance carriers. |
| • | Our two largest stockholders, Psilos Group and Revolution Extend Holdings, LLC, collectively will own % of our outstanding capital stock and will continue to have effective control over our management and affairs and other matters requiring stockholder approval after the completion of this offering. |
-5-
Table of Contents
If we are unable to adequately address these and other risks we face, our business, financial condition, results of operations and prospects may be harmed. In addition, there are numerous risks related to an investment in our common stock. You should carefully consider the risks described in “Risk Factors” and elsewhere in this prospectus.
Corporate History and Information
We were incorporated in April 2002 as a Delaware limited liability company. In July 2007, we became Extend Health, Inc., a Delaware corporation. Our principal executive offices are located at 2929 Campus Drive, Suite 400, San Mateo, California 94403, and our telephone number is (650) 288-4800. Our website address is www.extendhealth.com. Information contained on our website is not incorporated by reference into this prospectus, and you should not consider any information contained on, or that can be accessed through, our website as part of this prospectus or in deciding whether to purchase shares of our common stock.
“ExtendRetiree,” “ExtendAccess,” “ExtendExchange” and “Extend University” are registered or common law trademarks or service marks of Extend Health, Inc. This prospectus also contains additional trade names, trademarks, and service marks of ours and of other companies. We do not intend our use or display of other companies’ trade names, trademarks or service marks to imply a relationship with, or endorsement or sponsorship of us by, these other companies. We have omitted the ® and ™ designations, as applicable, for the trademarks we name in this prospectus.
-6-
Table of Contents
| Common stock offered by us |
shares | |
| Common stock to be outstanding after this offering |
shares | |
| Over-allotment option to be offered by us |
shares | |
| Use of proceeds |
We intend to use the net proceeds from this offering for working capital and general corporate purposes, including expansion of our sales and marketing activities and capital expenditures. We also intend to use a portion of the net proceeds to repay some or all of our debt obligations. In addition, we may use a portion of the net proceeds to acquire complementary businesses, products, services or technologies. See “Use of Proceeds.” | |
| Risk factors |
See “Risk Factors” and the other information included in this prospectus for a discussion of factors you should carefully consider before deciding to invest in our common stock. | |
| Proposed NASDAQ symbol |
“XH” | |
The number of shares of our common stock to be outstanding after this offering is based on 16,296,745 shares of our common stock outstanding as of March 31, 2012, and excludes:
| • | 3,050,438 shares of common stock issuable upon the exercise of options outstanding as of March 31, 2012, with a weighted-average exercise price of $1.43 per share; |
| • | 948,011 shares of common stock that may be issuable upon the exercise of an outstanding warrant to purchase common stock, with an exercise price of $10.00 per share; |
| • | 13,750 shares of common stock issuable upon the exercise of options granted subsequent to March 31, 2012, with an exercise price of $9.15 per share; and |
| • | 1,939,059 unallocated shares of common stock reserved for future issuance under our stock-based compensation plans, consisting of (i) 139,059 shares of common stock reserved for future issuance under our 2007 Equity Incentive Plan (not including the options to purchase 13,750 shares of common stock granted subsequent to March 31, 2012) and (ii) 1,800,000 shares of common stock reserved for future issuance under our 2012 Equity Incentive Plan, which will become effective in connection with this offering, and shares that become available under our 2012 Equity Incentive Plan, pursuant to provisions thereof that automatically increase the share reserves under this plan each year, as more fully described in “Executive Compensation—Employee Benefit and Stock Plans.” |
Unless otherwise noted, the information in this prospectus reflects and assumes the following:
| • | the conversion of all outstanding shares of our convertible preferred stock into an aggregate of 14,749,992 shares of common stock immediately prior to the completion of this offering; |
| • | the filing of our amended and restated certificate of incorporation in connection with the completion of this offering; |
| • | the adjustment of outstanding stock options as described in “Management’s Discussion and Analysis of Financial Condition and Results of Operations—Dividend-Related Option Adjustments”; and |
| • | no exercise of the underwriters’ over-allotment option. |
-7-
Table of Contents
SUMMARY CONSOLIDATED FINANCIAL DATA
The following tables summarize our consolidated financial data for the periods presented. We derived the consolidated statements of operations data for the years ended June 30, 2009, 2010 and 2011 from our audited consolidated financial statements included elsewhere in this prospectus. The unaudited consolidated statements of operations data for the nine months ended March 31, 2011 and 2012, and the unaudited consolidated balance sheet data as of March 31, 2012, are derived from our unaudited consolidated financial statements included elsewhere in this prospectus. We have prepared the unaudited financial information on the same basis as the audited consolidated financial statements and have included, in our opinion, all adjustments, consisting only of normal recurring adjustments that we consider necessary for a fair presentation of the financial information set forth in those statements. You should read this summary consolidated financial data in conjunction with “Management’s Discussion and Analysis of Financial Condition and Results of Operations” and our consolidated financial statements and related notes, all included elsewhere in this prospectus. Our historical results are not necessarily indicative of the results that may be expected in the future.
| Year Ended June 30, | Nine Months Ended March 31, |
|||||||||||||||||||
| 2009 | 2010 | 2011 | 2011 | 2012 | ||||||||||||||||
| (in thousands, except share and per share amounts) | ||||||||||||||||||||
| Consolidated Statements of Operations Data: |
||||||||||||||||||||
| Revenue: |
||||||||||||||||||||
| Commissions |
$ | 16,933 | $ | 43,646 | $ | 50,451 | $ | 35,716 | $ | 48,411 | ||||||||||
| Other |
779 | 370 | 676 | 442 | 468 | |||||||||||||||
|
|
|
|
|
|
|
|
|
|
|
|||||||||||
| Total revenue |
17,712 | 44,016 | 51,127 | 36,158 | 48,879 | |||||||||||||||
|
|
|
|
|
|
|
|
|
|
|
|||||||||||
| Operating expenses: |
||||||||||||||||||||
| Service center |
18,117 | 14,994 | 18,551 | 15,050 | 19,955 | |||||||||||||||
| Sales and marketing |
6,768 | 7,290 | 10,134 | 6,346 | 10,856 | |||||||||||||||
| Technology |
2,096 | 3,060 | 3,195 | 2,242 | 3,264 | |||||||||||||||
| General and administrative |
5,072 | 5,464 | 6,728 | 5,043 | 5,974 | |||||||||||||||
| Restructuring expense |
— | 314 | — | — | — | |||||||||||||||
|
|
|
|
|
|
|
|
|
|
|
|||||||||||
| Total operating expenses |
32,053 | 31,122 | 38,608 | 28,681 | 40,049 | |||||||||||||||
|
|
|
|
|
|
|
|
|
|
|
|||||||||||
| Income (loss) from operations |
(14,341 | ) | 12,894 | 12,519 | 7,477 | 8,830 | ||||||||||||||
| Interest income |
58 | 28 | 53 | 35 | 30 | |||||||||||||||
| Interest expense |
(80 | ) | (69 | ) | (110 | ) | (81 | ) | (323 | ) | ||||||||||
|
|
|
|
|
|
|
|
|
|
|
|||||||||||
| Income (loss) before income taxes |
(14,363 | ) | 12,853 | 12,462 | 7,431 | 8,537 | ||||||||||||||
| Provision for income taxes |
2 | 346 | 2,505 | 575 | 3,313 | |||||||||||||||
|
|
|
|
|
|
|
|
|
|
|
|||||||||||
| Net income (loss) |
$ | (14,365 | ) | $ | 12,507 | $ | 9,957 | $ | 6,856 | $ | 5,224 | |||||||||
|
|
|
|
|
|
|
|
|
|
|
|||||||||||
| Net income (loss) attributable to common stockholders(1)(2): |
||||||||||||||||||||
| Basic |
$ | (14,365 | ) | $ | 280 | $ | 676 | $ | 395 | $ | (30,345 | ) | ||||||||
|
|
|
|
|
|
|
|
|
|
|
|||||||||||
| Diluted |
$ | (14,365 | ) | $ | 821 | $ | 1,139 | $ | 635 | $ | (30,345 | ) | ||||||||
|
|
|
|
|
|
|
|
|
|
|
|||||||||||
| Net income (loss) per share attributable to common stockholders(1): |
||||||||||||||||||||
| Basic |
$ | (72.01 | ) | $ | 0.67 | $ | 0.47 | $ | 0.28 | $ | (19.95 | ) | ||||||||
|
|
|
|
|
|
|
|
|
|
|
|||||||||||
| Diluted |
$ | (72.01 | ) | $ | 0.64 | $ | 0.44 | $ | 0.27 | $ | (19.95 | ) | ||||||||
|
|
|
|
|
|
|
|
|
|
|
|||||||||||
-8-
Table of Contents
| Year Ended June 30, | Nine Months Ended March 31, |
|||||||||||||||||||
| 2009 | 2010 | 2011 | 2011 | 2012 | ||||||||||||||||
| (in thousands, except share and per share amounts) | ||||||||||||||||||||
| Weighted-average shares used to compute net income (loss) per share attributable to common stockholders(1): |
||||||||||||||||||||
| Basic |
199,495 | 414,615 | 1,424,511 | 1,394,005 | 1,521,353 | |||||||||||||||
|
|
|
|
|
|
|
|
|
|
|
|||||||||||
| Diluted |
199,495 | 1,288,140 | 2,569,722 | 2,378,444 | 1,521,353 | |||||||||||||||
|
|
|
|
|
|
|
|
|
|
|
|||||||||||
| Cash dividend declared per common share |
$ | — | $ | — | $ | — | $ | — | $ | 2.25 | ||||||||||
|
|
|
|
|
|
|
|
|
|
|
|||||||||||
| Pro forma net income per share attributable to common stockholders (unaudited)(1): |
||||||||||||||||||||
| Basic |
$ | $ | ||||||||||||||||||
|
|
|
|
|
|||||||||||||||||
| Diluted |
$ | $ | ||||||||||||||||||
|
|
|
|
|
|||||||||||||||||
| Pro forma weighted-average shares used to compute pro forma net income per share attributable to common stockholders (unaudited)(1): |
||||||||||||||||||||
| Basic |
||||||||||||||||||||
|
|
|
|
|
|||||||||||||||||
| Diluted |
||||||||||||||||||||
|
|
|
|
|
|||||||||||||||||
| Other Financial and Operational Data: |
||||||||||||||||||||
| Active core members (end of period)(3) |
97,600 | 126,000 | 161,700 | 163,000 | 213,900 | |||||||||||||||
| Pending core members (end of period)(3) |
800 | 2,000 | 10,500 | 1,500 | 7,900 | |||||||||||||||
| Core applications submitted(3) |
73,600 | 50,000 | 60,700 | 49,800 | 61,800 | |||||||||||||||
| Adjusted EBITDA(4) |
$ | (13,259 | ) | $ | 14,819 | $ | 14,913 | $ | 9,270 | $ | 11,206 | |||||||||
| (1) | See Note 13 to our consolidated financial statements for further details on the calculation of basic and diluted net income (loss) per share attributable to common stockholders and for a discussion and reconciliation of pro forma net income per share attributable to common stockholders. |
| (2) | The net income (loss) attributable to common stockholders for the nine months ended March 31, 2012 includes a $35.6 million adjustment for dividends distributed to preferred stockholders during the period. See Note 13 to our consolidated financial statements for further details regarding the adjustments applied in the calculation of basic and diluted net income (loss) per share attributable to common stockholders. |
| (3) | See “Management’s Discussion and Analysis of Financial Condition and Results of Operations—Key Business Metrics” for a discussion of active and pending core members and core applications submitted. |
| (4) | See “Adjusted EBITDA” below for a discussion regarding the use of adjusted EBITDA as a financial measure and for a reconciliation to net income (loss), the most directly comparable GAAP financial measure. |
| As of March 31, 2012 | ||||||||||||
| Actual | Pro Forma(1) | Pro Forma As Adjusted(2)(3) |
||||||||||
| Consolidated Balance Sheet Data: |
||||||||||||
| Cash and cash equivalents and short-term investments |
$ | 13,261 | $ | 13,261 | $ | |||||||
| Working capital (deficit) |
(8,994 | ) | (8,994 | ) | ||||||||
| Total assets |
21,492 | 21,492 | ||||||||||
| Total indebtedness(4) |
10,168 | 10,168 | ||||||||||
| Convertible preferred stock |
22,539 | — | ||||||||||
| Total stockholders’ deficit |
(35,322 | ) | (12,783 | ) | ||||||||
| (1) | The pro forma balance sheet data in the table above reflects the automatic conversion of all outstanding shares of convertible preferred stock into common stock prior to the completion of this offering. |
| (2) | The pro forma as adjusted balance sheet data in the table above reflects (i) the automatic conversion of convertible preferred stock described immediately above plus (ii) the sale of shares of our common stock in this offering at an assumed initial public offering |
-9-
Table of Contents
| price of $ per share, the midpoint of the range set forth on the front cover of this prospectus, after deducting estimated underwriting discounts and commissions and estimated offering expenses payable by us. |
| (3) | A $1.00 increase (decrease) in the assumed initial public offering price of $ per share would increase (decrease) cash and cash equivalents, and working capital, total assets and total stockholders’ equity (deficit) by $ million, assuming that the number of shares offered by us, as set forth on the front cover of this prospectus, remains the same, and after deducting estimated underwriting discounts and commissions payable by us. The pro forma as adjusted information discussed above is only illustrative and will be adjusted based on the actual public offering price and other terms of this offering determined at pricing. |
| (4) | Total indebtedness includes $9.8 million in term loans, $0.3 million in an equipment loan and $47,000 in capital lease obligations. |
Adjusted EBITDA
To provide investors with additional information regarding our financial results, we have disclosed in the table above and within this prospectus adjusted EBITDA, a non-U.S. generally accepted accounting principle, or GAAP, financial measure. We have provided a reconciliation below of adjusted EBITDA to net income (loss), the most directly comparable GAAP financial measure.
We have included adjusted EBITDA in this prospectus because it is a key measure used by our management and board of directors to understand and evaluate our core operating performance and trends, to prepare and approve our annual budget and to develop short- and long-term operational plans. In particular, the exclusion of certain expenses in calculating adjusted EBITDA can provide a useful measure for period-to-period comparisons of our core business. Accordingly, we believe that adjusted EBITDA provides useful information to investors and others in understanding and evaluating our results of operations in the same manner as our management and board of directors.
Our use of adjusted EBITDA has limitations as an analytical tool, and you should not consider it in isolation or as a substitute for analysis of our results as reported under GAAP. Some of these limitations are:
| • | although depreciation and amortization are non-cash charges, the assets being depreciated and amortized may have to be replaced in the future, and adjusted EBITDA does not reflect capital expenditure requirements for such replacements or for new capital expenditures; |
| • | adjusted EBITDA does not reflect changes in, or cash requirements for, our working capital needs; |
| • | adjusted EBITDA does not consider the potentially dilutive impact of equity-based compensation; |
| • | adjusted EBITDA does not reflect tax payments that may represent a reduction in cash available to us; and |
| • | other companies, including companies in our industry, may calculate adjusted EBITDA differently, which reduces its usefulness as a comparative measure. |
Because of these limitations, you should consider adjusted EBITDA alongside other financial performance measures, including various cash flow metrics, net income (loss) and our other GAAP results. The following table presents a reconciliation of adjusted EBITDA to net income (loss) for each of the periods indicated:
| Year Ended June 30, | Nine Months Ended March 31, |
|||||||||||||||||||
| 2009 | 2010 | 2011 | 2011 | 2012 | ||||||||||||||||
| (in thousands) |
||||||||||||||||||||
| Reconciliation of Adjusted EBITDA: |
||||||||||||||||||||
| Net income (loss) |
$ | (14,365 | ) | $ | 12,507 | $ | 9,957 | $ | 6,856 | $ | 5,224 | |||||||||
| Adjustments: |
||||||||||||||||||||
| Depreciation and amortization |
1,013 | 1,831 | 2,144 | 1,636 | 1,384 | |||||||||||||||
| Provision for income taxes |
2 | 346 | 2,505 | 575 | 3,313 | |||||||||||||||
| Stock-based compensation |
69 | 94 | 250 | 157 | 992 | |||||||||||||||
| Interest income |
(58 | ) | (28 | ) | (53 | ) | (35 | ) | (30 | ) | ||||||||||
| Interest expense |
80 | 69 | 110 | 81 | 323 | |||||||||||||||
|
|
|
|
|
|
|
|
|
|
|
|||||||||||
| Adjusted EBITDA |
$ | (13,259 | ) | $ | 14,819 | $ | 14,913 | $ | 9,270 | $ | 11,206 | |||||||||
|
|
|
|
|
|
|
|
|
|
|
|||||||||||
-10-
Table of Contents
Investing in our common stock is highly speculative and involves a significant degree of risk. You should consider carefully all the risks and uncertainties described below, together with all of the other information contained in this prospectus and the other documents attached or summarized herein, including, but not limited to, our consolidated financial statements and related notes, before deciding whether to purchase shares of our common stock. Many of the following risks and uncertainties relate to factors that are not within our control. If any of the following risks is realized, our business, financial condition, results of operations and prospects could be harmed. In that event, the price of our common stock could decline and you could lose part or all of your investment. Actual results could differ materially from those anticipated in the forward-looking statements as a result of any number of factors, including the risks and uncertainties described below and elsewhere in this prospectus. You should consult with your own counsel, financial advisors and accountants for advice concerning the various legal, regulatory, accounting, tax and economic considerations relating to a potential investment in our common stock.
Risks Related to Our Business
We have a limited operating history, which makes it difficult to evaluate our current business and future prospects and may increase the risk of your investment.
We have a limited operating history. Because of our limited operating history and because the health insurance industry is rapidly evolving, we have limited insight into trends that may emerge and affect our business. We may make errors in predicting and reacting to relevant business trends, which could harm our business. In addition, since we have only been offering our products and services since 2004, we have limited historical financial data. As a result of these factors, the revenue and income potential of our business is unproven, and we have only a limited operating history upon which to base an evaluation of our current business and future prospects. You should consider our business and prospects in light of the risks and difficulties we encounter in this rapidly evolving market. These risks and difficulties include our ability to, among other things:
| • | establish new or maintain existing relationships with employer clients, individual customers and insurance carriers; |
| • | increase sales of health insurance plans; |
| • | maintain compliance with applicable laws and regulations; |
| • | successfully compete with other companies that are currently in, or may in the future enter, the Medicare exchange space; |
| • | hire, integrate and retain qualified personnel; and |
| • | successfully expand our business. |
If the market for individual Medicare plans does not develop as we expect, or if we fail to address the needs of this market, our business will be harmed. Any potential opportunities that we may have to expand our business beyond post-65 retirees or into other markets may not develop. If these opportunities do not materialize or if we are not able to capture such opportunities, our business could be harmed. We may not be able to successfully address these risks and difficulties or others, including those described elsewhere in these risk factors. Failure to adequately address these risks and difficulties could materially harm our business and cause our financial condition, results of operations and prospects to suffer.
The market for insurance exchanges in the United States is relatively undeveloped and rapidly evolving, which makes it difficult to forecast adoption rates and demand for our solutions.
The market for insurance exchanges in the United States is relatively undeveloped and rapidly evolving. Accordingly, our future financial performance will depend in part on growth in this market and on our ability to
-11-
Table of Contents
adapt to emerging demands in this market. Demand for our solutions has been driven in large part by employer cost-saving efforts, recent regulatory changes, broader use of the Internet and advances in technology. It is difficult to predict with any precision employer and individual adoption rates or the future growth rate and size of our target market. The rapidly evolving nature of the market in which we operate, as well as other factors that are beyond our control, reduces our ability to accurately evaluate our long-term outlook and forecast annual performance. A reduction in demand for insurance exchanges caused by lack of employer and individual acceptance, technological challenges, competing offerings or otherwise would result in a lower revenue growth rate or decreased revenue, either of which could negatively impact our business and results of operations.
The marketing and sale of Medicare plans are subject to numerous, complex and frequently changing laws and regulations, and the impact of changes in laws related to Medicare or any failure to comply with them could harm our business, results of operations and financial condition.
The marketing and sale of Medicare plans are subject to numerous laws, regulations and guidelines at both the Federal and state level. The marketing and sale of Medicare Advantage and Medicare Part D prescription drug plans are principally regulated by the Centers for Medicare and Medicaid Services, or CMS, which is a division of the U.S. Department of Health and Human Services, and the marketing and sale of Medicare supplement plans is principally regulated on a state-by-state basis by state departments of insurance. The laws and regulations applicable to the marketing and sale of Medicare plans lack clarity, are numerous and complex, were not drafted to contemplate health insurance exchanges, and change frequently, particularly with respect to regulations and guidance issued by CMS for Medicare Advantage and Medicare Part D prescription drug plans and by the various state departments of insurance for Medicare supplement plans.
As a result of these laws, regulations and guidelines, we have altered, and will need to continue to alter, our business operations and procedures, including without limitation, our call center operations, website and sales process to comply with these changing requirements. For instance, many aspects of, and changes to, our website content and marketing materials and processes, including call center scripts, must be approved by CMS and by insurance carriers in light of CMS requirements. Changes to the laws, regulations and guidelines relating to Medicare plans, the scope of their application to our business, their interpretation or the manner in which they are enforced could be incompatible with our business model. Due to changes in CMS guidance or enforcement of existing guidance, or as a result of new regulations and guidelines, CMS, state departments of insurance or insurance carriers may determine not to approve aspects of our website content or marketing materials and processes and may determine that certain existing aspects of our business are not compliant. As a result, our business could be slowed or we could be prevented from operating portions of our business altogether, either of which would materially harm our results of operations and financial condition, particularly if this occurred during the Medicare annual enrollment period, which is when the vast majority of Medicare plans are sold.
In March 2010, the Federal government enacted significant reforms to healthcare legislation through the Patient Protection and Affordable Care Act, or PPACA, and the Healthcare and Education Reconciliation Act of 2010, or HCERA, which we refer to collectively as Healthcare Reform. In addition, one of the elements of the recently passed Budget Control Act of 2011 is the creation of a joint select committee on deficit reduction to develop recommendations, including changes to entitlement programs such as Medicare, to reduce the national debt by at least $1.2 trillion over 10 years. In connection with the U.S. Congress’s failure to agree on a proposal to lower the national deficit, the Budget Control Act mandates automatic cuts to domestic and defense spending, including a significant reduction in Medicare spending. The impact that Healthcare Reform and the Budget Control Act will have on the market for Medicare plans could change the demand for Medicare plans, the way these plans are delivered, or the commissions that insurance carriers pay to us in connection with their sale or otherwise adversely impact us.
In the event that these laws and regulations or changes in these laws and regulations, or other laws and regulations that impact the marketing and sale of Medicare plans, adversely impact our ability to market any type of Medicare plan on our exchange platform or the commissions that we receive for selling these plans, our business, results of operations and financial condition would be harmed.
-12-
Table of Contents
If we are unable to retain our members, our business and results of operations would be harmed.
Our revenue is primarily derived from commissions that insurance carriers pay to us for the health insurance plans that we market. When one of these plans is cancelled, or if we otherwise do not remain the agent of record on the policy, we no longer receive the related commission revenue. Individuals may choose to discontinue their insurance policies for a number of reasons. For example, members may determine that they cannot afford supplemental Medicare coverage or may receive increases in premiums from insurance carriers that force them to cancel their coverage. In addition, our members may choose to purchase new plans using a different agent if, for example, they are not satisfied with our customer service or the health insurance plans that we offer. Insurance carriers may also terminate health insurance plans purchased by our members for a variety of reasons. Our cost in acquiring a new member is substantially greater than the cost involved in maintaining our relationship with an existing member. If we are not able to successfully retain existing members and limit member turnover, our revenue and operating margins could be adversely impacted.
Our business may be harmed if we lose our relationships with insurance carriers, fail to maintain good relationships with insurance carriers, become dependent upon a limited number of insurance carriers or fail to develop new carrier relationships.
We typically enter into contractual agency relationships with insurance carriers that are non-exclusive and terminable on short notice by either party for any reason. In many cases, insurance carriers also have the ability to amend the terms of our agreements unilaterally on short notice. Insurance carriers may be unwilling to allow us to sell their existing or new health insurance plans or may amend our agreements with them, for a variety of reasons, including for competitive or regulatory reasons or because of a reluctance to distribute their products through our exchange platform. Insurance carriers may decide to rely on their own internal distribution channels, including traditional in-house agents, carrier websites or other sales channels, or to market their own plans, and, in turn, could limit or prohibit us from marketing their plans. For example, in August 2011, one of our largest insurance carrier partners discontinued the indirect distribution of Medicare supplement policies through all of their distribution vendors. As a result, our new Medicare supplement enrollments have shifted to other insurance carriers that pay us lower commission rates on average. Insurance carriers may also choose to exclude us from their most profitable or popular plans or may determine not to distribute insurance plans in individual markets in certain geographies or altogether. Additionally, if one of the insurance carriers with which we are associated violates the law or comes under scrutiny by CMS, CMS may impose sanctions on such carriers, resulting in a loss of supply of insurance plans that we are able to sell. The termination or amendment of our relationship with an insurance carrier could reduce the variety of health insurance plans we offer. We also could lose a source of, or be paid reduced commissions for, future sales and could lose renewal commissions for past sales. Our business could also be harmed if we fail to develop new carrier relationships or are unable to offer customers a wide variety of health insurance plans.
The private health insurance industry in the United States has experienced a substantial amount of consolidation over the past several years, resulting in a decrease in the number of insurance carriers. In the future, it may become necessary for us to offer insurance plans from a reduced number of insurance carriers or to derive a greater portion of our revenue from a more concentrated number of carriers as our business and the health insurance industry evolve. For example, in fiscal 2011, our top two carriers, Mutual of Omaha and UnitedHealthcare, accounted for an aggregate of 58% of our commission revenue. Each of these insurance carriers may terminate our agreements with them, and, in some cases, as a result of the termination we may lose our right to receive future commissions for policies we have sold. Should our dependence on a smaller number of insurance carriers increase, whether as a result of the termination of carrier relationships, further insurance carrier consolidation or otherwise, we may become more vulnerable to adverse changes in our relationships with our carriers, particularly in states where we offer health insurance plans from a relatively small number of carriers or where a small number of insurance carriers dominate the market. The termination, amendment or consolidation of our relationship with our insurance carriers could harm our business, results of operations and financial condition.
-13-
Table of Contents
Insurance carriers could reduce the commissions paid to us or change their plan pricing practices in ways that reduce the commissions paid to us, which could harm our revenue and results of operations.
Our commission rates are either set by each carrier or negotiated between us and each carrier. Insurance carriers have altered, and may in the future alter, the contractual relationships we have with them, either by renegotiation or unilateral action. Also, insurance carriers may adjust their commission rates to comply with regulatory guidelines, such as those published by CMS with respect to the marketing of Medicare Advantage and Medicare Part D prescription drug plans. If these contractual changes result in reduced commissions, our revenue may decline.
In addition, insurance carriers periodically adjust the premiums they charge to individuals for their insurance policies. These premium changes may cause members to cancel their existing policies and purchase a replacement policy from a different insurance carrier, either through our exchange or through another agent. In many cases, we receive a reduced commission when a member purchases a replacement policy. Also, because insurance rates may vary between insurance carriers, plans and enrollment dates, changes in enrollment mix may impact our commission revenue. Future changes in carrier pricing practices could harm our business, results of operations and financial condition.
Changes and developments in the health insurance system in the United States could harm our business.
Our business depends upon the private sector of the United States insurance system, its role in financing health care delivery, and insurance carriers’ use of, and payment of commissions to, agents, brokers and other organizations to market and sell individual and family health insurance plans. Healthcare Reform contains provisions that have changed and will continue to change the industry in which we operate in substantial ways.
Many aspects of Healthcare Reform do not go into effect until 2014, although certain provisions currently are effective, such as medical loss ratio requirements for individual, family and small business health insurance and a prohibition against using pre-existing health conditions as a reason to deny health coverage for children. In addition, state governments have adopted, and will continue to adopt, changes to their existing laws and regulations in light of Healthcare Reform and related regulations. Future changes may not be beneficial to us.
Legal challenges to the constitutionality of Healthcare Reform have been initiated. Notably, litigation regarding the constitutionality of Healthcare Reform is pending before the United States Supreme Court. Many of the challenges center upon the constitutionality of the mandate requiring individuals to maintain health coverage. Decisions on the issue have been inconsistent. These decisions will be appealed and it is impossible to predict their outcome. More challenges could also be initiated under various other legal theories. If the final outcome of one or more of these legal challenges is adverse to our business interests, our results of operations and financial condition could be harmed.
Certain key members of Congress have also expressed a desire to withhold the funding necessary to implement Healthcare Reform as well as the desire to replace or amend all or a portion of Healthcare Reform. Any partial or complete repeal or amendment or implementation difficulties, or uncertainty regarding such events, could increase our costs of compliance, prevent or delay future adoption of our exchange platform, and adversely impact our results of operations and financial condition. The implementation of Healthcare Reform could have negative effects on us, including:
| • | increase our competition; |
| • | reduce or eliminate the need for health insurance agents and brokers or demand for the health insurance that we sell; |
| • | decrease the number of types of health insurance plans that we sell, as well as the number of insurance carriers offering such plans; |
-14-
Table of Contents
| • | cause insurance carriers to change the benefits and/or premiums for the plans they sell; or |
| • | cause insurance carriers to reduce the amount they pay for our services or change our relationship with them in other ways. |
Any of these effects could materially harm our business, results of operations and financial condition. For example, the manner in which the Federal government and the states implement health insurance exchanges and the process for receiving subsidies and cost-sharing credits could substantially increase our competition and member turnover and substantially reduce the number of individuals who purchase insurance through us. Various aspects of Healthcare Reform could cause insurance carriers to limit the type of health insurance plans we are able to sell and the geographies in which we are able to sell them. In addition, the U.S. Congress has been charged with finding spending cuts, and such cuts are expected to include Medicare. If cuts are made to Medicare, there may be substantial changes in the types of health insurance plans we are able to sell. Changes in the law could also cause insurance carriers to exit the business of selling insurance plans in a particular jurisdiction, to eliminate certain categories of products or to attempt to move members into new plans for which we receive lower commissions. If insurance carriers decide to limit our ability to sell their plans or determine not to sell individual health insurance plans altogether, our business, results of operations and financial condition would be materially harmed.
Our results of operations fluctuate depending upon the timing of our receipt of commission payments from insurance carriers.
The timing of our revenue recognition is dependent upon the receipt of commission payments from insurance carriers. There have been instances where commission payments from insurance carriers have been delayed. Any delay could impact our financial results for a given quarter as we would not be able to recognize the related commission revenue in that quarter if payments are pushed beyond the quarter. In addition, receipt of past due payments at a later date could result in a large amount of commission revenue from a carrier being recorded in a given quarter that is not indicative of the amount of revenue we may receive from that carrier in subsequent quarters, causing fluctuations in our quarterly or annual results of operations. We could report revenue below the expectations in any particular period if a large payment from an insurance carrier is delayed or not received within the time frame required for revenue recognition.
We rely on insurance carriers to provide membership and commission reporting to us, and if these reports are inaccurate or not delivered to us in a timely manner, they could impact our ability to report our operating metrics accurately or on a timely basis.
We are dependent on insurance carriers for providing data to us related to membership and commission payments. For example, some insurance carriers do not directly report member cancellations to us or report cancellations in a delayed manner, resulting in the need for us to determine cancellations using the commission payment data. We infer cancellations from this payment data by analyzing whether payments from members have ceased for a period of time, and we may not learn of a cancellation for several months, given that some of our members pay on a schedule less frequently than monthly. After we have estimated membership for a period, we may receive information from insurance carriers that would have impacted the estimate if we had received the information prior to the date of estimation, which would cause our member data to be inaccurate. Our estimate regarding the average amount of time our members maintain their health insurance plans also could be inaccurate as it is dependent upon the accuracy of our membership estimates.
Our revenue growth rate may decline, and, as our costs increase, we may not be able to generate sufficient revenue to sustain our profitability.
Our revenue has grown from $12.4 million in fiscal year 2008 to $51.1 million in fiscal year 2011. We expect that, in the future, as our revenue increases to higher levels our revenue growth rate will decline over time.
-15-
Table of Contents
Our future revenue growth will depend in large part upon our ability to continue to attract new individuals to purchase health insurance through our exchange platform. To the extent that the rate of growth of our new customers slows or our customer retention rates decrease, our revenue growth will also slow, and we may not be able to generate sufficient revenue to sustain our profitability. We also expect our costs to increase in future periods, which could negatively affect our future results of operations. We expect to continue to expend substantial financial and other resources on:
| • | sales and marketing, including a significant expansion of our direct and partner channel sales organizations; |
| • | technology development, including investments in the scalability of our exchange platform and the development of new features; and |
| • | general administration, including legal and accounting expenses related to being a public company. |
These investments may not result in increased revenue or growth in our business. If we fail to continue to grow our revenue and increase our profitability, our results of operations would be harmed and our stock price would decline.
If we do not continue to attract new employer clients or individual customers, we may not achieve our revenue projections, and our results of operations would be harmed.
In order to grow our business, we must continually attract new employer clients and individual customers. Our ability to do so depends in large part on the success of our sales and marketing efforts. Potential employer clients may not see the value in our solution and potential individual customers may seek out other options for purchasing Medicare insurance. Therefore, we must demonstrate that our Medicare exchange provides a viable solution for our employer clients to reduce healthcare costs and for individual customers to obtain high quality coverage at an attractive price. If we fail to provide high quality solutions and convince employer clients and individual customers of our value proposition, we may not be able to retain existing customers or attract new individual customers. Moreover, employer clients may decide not to transition their retirees and employees to our platform or these retirees and employees may choose not to enroll with us after we have already incurred operating overhead. Additionally, there is no guarantee that the market for our services will grow as we expect. If the market for our services declines or develops more slowly than we expect, or the number of potential employer clients or individual customers that use our solutions declines or fails to increase as we expect, our revenue, results of operations, financial condition, business and prospects could be harmed.
We expect our results of operations to fluctuate on a quarterly and annual basis.
Our revenue and results of operations could vary significantly from quarter to quarter and year to year and may fail to match our past performance due to a variety of factors, some of which are outside of our control. Any of these events could cause the market price of our common stock to fluctuate. Factors that may contribute to the variability of our results of operations include:
| • | seasonality of our business related to the timing of enrollment in employer-sponsored health plans; |
| • | the extent to which we retain existing members; |
| • | the size of new employer clients that we engage in any particular period; |
| • | the timing of commission payments from insurance carriers; |
| • | changes in the commission rates we receive from insurance carriers; |
| • | the utilization and mix of channel partners; |
| • | the timing of retail marketing campaigns; |
| • | our ability to increase the number of health insurance plans we are able to sell; |
-16-
Table of Contents
| • | the entrance of new competitors to our market; |
| • | our ability to establish and maintain relationships with insurance carriers; and |
| • | general industry and macroeconomic conditions. |
Given these factors, our short operating history, and the current changes and developments in the health insurance industry, our historical results of operations may not be useful to you in predicting our future results of operations. If we fail to meet or exceed expectations for our business for these or any other reasons, the market price of our shares could fall substantially, and we could face costly lawsuits, including securities class action suits. Furthermore, fluctuations in our results of operations related to these factors and industry developments could adversely impact our ability to meet our earnings forecasts or the expectations of market analysts, which could cause declines in our stock price.
Seasonality has caused and will continue to cause fluctuations in our financial results and operational challenges.
Our business of marketing Medicare plans is subject to seasonal fluctuations. The benefits enrollment period for a majority of private employers occurs during October through December of each year for a January 1 effective date, and this period also coincides with the timing of the annual enrollment period when Medicare-eligible individuals can make changes to their Medicare Advantage or Medicare Part D prescription drug coverage for the following year. As a result, the majority of our Medicare enrollments have historically occurred in the fourth calendar quarter during the Medicare annual enrollment period. During this period, we need to hire, train and certify a substantial number of seasonal personnel to supplement our employee base. If we are unable to hire, train and certify this seasonal workforce, we could not accommodate the heightened enrollment demand. Failure to meet this demand could negatively impact our business. Additionally, due to the heavy influx of healthcare benefit enrollments we experience at the end of each calendar year, we incur a significant portion of our marketing and enrollment expenses during the fourth calendar quarter, but we typically do not begin to recognize the associated commission revenue until the first calendar quarter of the following year. As our business matures, other seasonality trends may develop and the existing seasonality and consumer behavior that we experience may change. In particular, public sector employers are generally more inclined to opt for transition periods outside of the annual enrollment period, as their benefits effective date typically coincides with the beginning of their fiscal year, which is often not January 1. Any seasonality that we experience may cause fluctuations in our financial results, which could lead to declines in our stock price, and operational challenges such as demand for an increased or decreased short-term workforce.
Our estimates of Projected Annual Recurring Revenue, or PARR, may prove inaccurate.
As an indication of our estimated future recurring revenue, we report Projected Annual Recurring Revenue, or PARR, which reflects our expected total commission revenue for the subsequent 12 months from all members that are active or pending as of the reporting date. We report PARR as a range as it represents an estimate of our future recurring revenue based on certain member retention assumptions. The PARR metric includes expected commission revenue on all Medicare-related and ancillary policies and is based upon actual contractual commission rates in effect during the forecasted period as well as assumptions regarding future member retention. Our estimates for future member retention are based on our historical experience regarding the extent and timing of policy attrition, along with any known future trends that may be expected to occur during the forecasted period.
PARR is a forward-looking metric that is based on our management’s beliefs and assumptions and on information available to our management as of the reporting date. As a result, our ability to recognize the forecasted revenue indicated by the PARR metric over the subsequent 12 months is subject to a number of risks, uncertainties and assumptions, including:
| • | higher cancellation rates of Medicare-related and ancillary policies by our members than expected; |
-17-
Table of Contents
| • | the inability of our carriers to fulfill their obligations under our members’ Medicare-related and ancillary policies, which could cause a decrease in future member retention rates; and |
| • | delayed payment, non-payment and/or inaccurate payment of commissions by our carriers. |
We cannot guarantee that we will be able to recognize the revenue associated with the PARR metric due to these risks and uncertainties or if our assumptions turn out to be incorrect. These risks and assumptions are inherently subject to significant business and economic uncertainties and contingencies, many of which are beyond our control. As a result, the PARR that we disclose at any particular time may prove to be an inaccurate indicator of the revenue we actually derive over the subsequent 12 months from active and pending members.
If we fail to effectively manage our growth, our business and results of operations could be harmed.
We have expanded our operations significantly since 2008 and are in the process of providing the use of our technology and services to governmental entities, all of which results in our continuing to experience rapid growth in our headcount and operations and additional complexities related to providing services to employees of governmental entities. This has increased the significant demands on our management, our operational and financial systems and infrastructure, and other resources. If we do not effectively manage our growth, the quality of our services could suffer. In order to successfully expand our business, we must effectively integrate, develop and motivate a large number of new employees, and we must maintain the beneficial aspects of our corporate culture. We may not be able to hire new employees quickly enough to meet our needs. If we fail to effectively manage our hiring needs and successfully integrate our new hires, our efficiency and ability to meet our forecasts and our employee morale, productivity and retention could suffer, and our business and results of operations could be harmed. We also need to continue to improve our existing systems for operational and financial management, including our reporting systems, procedures and controls. These improvements could require significant capital expenditures and place increasing demands on our management. We may not be successful in managing or expanding our operations or in maintaining adequate financial and operating systems and controls. If we do not successfully manage these processes, our business and results of operations will be harmed.
If we are unable to maintain high levels of service our business and prospects may be harmed.
One of the key attributes of our business is providing high quality service to our clients and members. We may be unable to sustain these levels of service, which would harm our reputation and our business. Alternatively, we may only be able to sustain high levels of service by significantly increasing our operating costs, which would materially adversely affect our results of operations. The level of service we are able to provide depends on our personnel to a significant extent. Our personnel must be well-trained in our processes and be able to handle customer calls effectively and efficiently. Any inability of our personnel to meet our demand, whether due to absenteeism, training, turnover, disruptions at our facilities, bad weather, power outages or other reasons, could adversely impact our business. For example, we have had disruptions in services at our call center in Utah due to severe snowstorms. If we are unable to maintain high levels of service performance, our brand and reputation could suffer and our results of operations and prospects would be harmed.
Our growth relies in part on the success of our strategic relationships with third parties.
We anticipate that we will continue to rely on certain relationships with various third parties, including insurance carriers, employers, benefits consultants and brokers, to grow our business. Identifying, negotiating and documenting relationships with third parties requires significant time and resources. Our agreements with third parties are typically non-exclusive and do not prohibit them from working with our competitors or from offering competing services. In addition, these third parties may not perform as expected under our agreements with them, and we may have disagreements or disputes with these parties, which could negatively affect our brand and reputation. It is possible that these third parties may not be able to, or may be unwilling to, devote the resources we expect to the relationship. For example, we have strategic alliances with two vendors that
-18-
Table of Contents
administer our customers’ health reimbursement accounts. One of these vendors, AON Hewitt, is our primary competitor. If we are unsuccessful in establishing or maintaining our relationships with these third parties, our ability to compete in the marketplace or to grow our business could be impaired, and our results of operations would suffer. Even if we are successful, these relationships may not improve our results of operations.
We may be unsuccessful in competing effectively against current and future competitors, which would impact our prospects and results of operations.
The market for selling Medicare health insurance plans is highly competitive. We compete with entities and individuals that offer and sell Medicare health insurance plans utilizing traditional distribution channels, including insurance agents and brokers across the United States who sell Medicare health insurance plans in their communities and the original Medicare program. Some local agents use “lead aggregator” services that use the internet to find consumers interested in purchasing health insurance and are compensated for referring those consumers to a traditional insurance agent. In addition to health insurance brokers and agents, many insurance carriers directly market and sell their plans to consumers through call centers and their own websites. Although we offer health insurance plans for many of these insurance carriers, they also compete with us by offering their plans directly to consumers.
In addition, CMS offers plan information, comparison tools, an enrollment services center and online enrollment for Medicare Advantage and Medicare Part D prescription drug plans, all of which compete with our programs and plans. We also expect that in licensing our technology to government entities for health insurance exchanges and other purposes, we will continue to compete with these government entities as well as system integrators, software companies, employee benefit service providers, technology consulting companies and others that have more experience providing technology and services to the Federal or state governments.
We may not be able to compete successfully against our current or future competitors. Some of our current and potential competitors, including AON Hewitt, have longer operating histories in the health care benefit consulting industry, access to larger customer bases, greater brand recognition and significantly greater financial, technical, marketing and other resources than we do. As compared to us, our current and future competitors may be able to:
| • | undertake more extensive marketing campaigns for their brands and services; |
| • | devote more resources to website and systems development; |
| • | negotiate more favorable commission rates; |
| • | negotiate more favorable contracts with government entities; and |
| • | make more attractive offers to potential employees, marketing partners and third-party service providers. |
Competitive pressures may result in our experiencing increased marketing costs and loss of market share, or may otherwise harm our business, results of operations and financial condition.
We are subject to privacy and data protection laws governing the transmission, security and privacy of health information, which may impose restrictions on the manner in which we access personal data and subject us to penalties if we are unable to fully comply with such laws.
Numerous Federal, state and international laws and regulations govern the collection, use, disclosure, storage and transmission of individually-identifiable health information. These laws and regulations, including their interpretation by governmental agencies, are subject to frequent change. These regulations could have a negative impact on our business, for example:
| • | The Health Insurance Portability and Accountability Act, or HIPAA, and its implementing regulations were enacted to ensure that employees can retain and at times transfer their health insurance when they change jobs and to simplify health care administrative processes. The enactment of HIPAA also |
-19-
Table of Contents
| expanded protection of the privacy and security of personal health information and required the adoption of standards for the exchange of electronic health information. Among the standards that the Department of Health and Human Services has adopted pursuant to HIPAA are standards for electronic transactions and code sets, unique identifiers for providers, employers, health plans and individuals, security, electronic signatures, privacy, and enforcement. Failure to comply with HIPAA could result in fines and penalties that could have a material adverse effect on us. |
| • | The Federal Health Information Technology for Economic and Clinical Health Act, or the HITECH Act, enacted as part of the American Recovery and Reinvestment Act of 2009, also known as the “Stimulus Bill,” effective February 22, 2010, sets forth health information security breach notification requirements and increased penalties for violation of HIPAA. The HITECH Act requires individual notification for all breaches, media notification of breaches of over 500 individuals, and at least annual reporting of all breaches to the Department of Health and Human Services. The HITECH Act also replaced the prior penalty system of one tier of penalties of $100 per violation and an annual maximum of $25,000 with a 4-tier system of sanctions for breaches. Penalties now range from the original $100 per violation and an annual maximum of $25,000 for the first tier to a fourth-tier minimum of $50,000 per violation and an annual maximum of $1.5 million. Failure to comply with the HITECH Act could result in fines and penalties that could have a material adverse effect on us. |
| • | Other Federal and state laws restricting the use and protecting the privacy and security of individually-identifiable information may apply, many of which are not preempted by HIPAA. |
| • | Federal and state consumer protection laws are being applied increasingly by the United States Federal Trade Commission, or FTC, and states’ attorneys general to regulate the collection, use, storage and disclosure of personal or individually-identifiable information, through websites or otherwise, and to regulate the presentation of website content. |
We are required to comply with Federal and state laws governing the transmission, security and privacy of individually-identifiable health information that we may obtain or have access to in connection with the provision of our services. Despite the security measures that we have in place to ensure compliance with privacy and data protection laws, our facilities and systems, and those of our third-party vendors and subcontractors, are vulnerable to security breaches, acts of vandalism or theft, computer viruses, misplaced or lost data, programming and human errors or other similar events. For example, on occasion we have experienced minor security incidents involving the social security numbers and protected health information, or PHI, of our members which resulted in us notifying the affected individuals of the security incidents and offering to cover the costs of credit monitoring services for these individuals. Because of the nature of these incidents, we were not required to report them to a governmental authority, and we have not been penalized as a result of these incidents. Due to the recent enactment of the HITECH Act, we are not able to predict the extent of the impact such incidents may have on our business. Our failure to comply may result in criminal and civil liability because the potential for enforcement action against business associates is now greater. Enforcement actions against us could be costly and interrupt regular operations which may adversely affect our business.
Under the HITECH Act, as a business associate we may also be liable for privacy and security breaches and failures of our subcontractors. Even though we provide for appropriate protections through our agreements with our subcontractors, we still have limited control over their actions and practices. A breach of privacy or security of individually-identifiable health information by a subcontractor may result in an enforcement action, including criminal and civil liability, against us.
In addition, numerous other Federal and state laws protect the confidentiality of individually-identifiable information as well as employee personal information, including state medical privacy laws, state social security number protection laws, and Federal and state consumer protection laws. These various laws in many cases are not preempted by HIPAA and may be subject to varying interpretations by the courts and government agencies, creating complex compliance issues for us and our customers and potentially exposing us to additional expense, adverse publicity and liability, any of which could adversely affect our business.
-20-
Table of Contents
Any legal liability, regulatory penalties or negative publicity arising from the information that we distribute or that we provide on our website may harm our business and results of operations.
We provide information on our website, through licensed benefit advisors and in other ways regarding Medicare insurance in general and the Medicare insurance plans we market and sell, including information relating to insurance premiums, coverage, benefits, exclusion, limitations, availability, plan comparison and insurance company ratings. A significant amount of both automated and manual effort is required to maintain the considerable amount of insurance policy information on our website and in our databases. If the information we provide on our website or provided by our licensed benefit advisors is not accurate or is construed as misleading, or if we do not properly assist individuals in purchasing Medicare insurance, consumers, insurance carriers and others could attempt to hold us liable for damages, and regulators could attempt to subject us to penalties, revoke our license to transact health insurance business in a particular jurisdiction, and compromise the status of our licenses to transact health insurance businesses in other jurisdictions. In the ordinary course of operating our business, we have received complaints from some customers that third-party information we provided regarding insurance plan or prescription drug pricing was not accurate or was misleading. Although in the past we have resolved these complaints without significant financial cost, typically by offering the customer a reimbursement or enrolling the customer in a new plan, we cannot guarantee that we will be able to do so in the future. In addition, these types of claims could be time-consuming and expensive to defend, could divert our management’s attention and other resources, and could cause a loss of confidence in our services.
In the ordinary course of our business, we have received and may continue to receive inquiries from state regulators relating to compliance with insurance regulations and labor matters. We may become involved in litigation in the ordinary course of business. If any such litigation is resolved in a manner adverse to our business interests, our results of operations and financial condition could be harmed. If we are found to have violated laws or regulations, we could be subject to various fines and penalties, including revocation of our licenses to sell insurance, and our business, results of operations and financial condition would be harmed.
Our business is subject to online security risks, and if we are unable to safeguard the security and privacy of confidential data, our reputation and business will be harmed.
Our services involve the collection and storage of confidential information of consumers and the transmission of this information to their chosen Medicare insurance carriers. For example, we collect names, addresses, social security and credit card numbers, and information regarding the medical history of consumers in connection with their applications for Medicare insurance. We may be required to expend significant capital and other resources to protect against security breaches or to alleviate problems caused by security breaches. Despite our implementation of security measures, techniques used to obtain unauthorized access or to sabotage systems change frequently. As a result, we may be unable to anticipate these techniques or to implement adequate preventative measures. Any compromise or perceived compromise of our security could damage our reputation and our relationship with our members, marketing partners and Medicare insurance carriers, could reduce demand for our services and could subject us to significant liability as well as regulatory action. In addition, in the event that new data security laws are implemented, or our Medicare insurance carrier or other partners determine to impose new requirements on us relating to data security, we may not be able to timely comply with such requirements, or such requirements may not be compatible with our current processes. Changing our processes could be time consuming and expensive, and failure to timely implement required changes could result in our inability to sell health insurance plans in a particular jurisdiction or for a particular insurance carrier or subject us to liability for non-compliance.
If we fail to maintain proper and effective internal controls, our ability to produce accurate financial statements could be impaired, which could harm our reputation and cause us to restate our financial statements.
As a publicly-traded company, we will be required, pursuant to Section 404 of the Sarbanes-Oxley Act, to furnish annual management assessments of the effectiveness of our internal controls over financial reporting.
–21–
Table of Contents
These assessments will need to include disclosures of any material weaknesses identified by management in our internal controls over financial reporting, and our auditors will also have to issue an opinion on the effectiveness of our internal control over financial reporting.
We are in the very early stages of the costly and challenging process of compiling the system and process documentation necessary to perform the evaluation needed to comply with Section 404. We may not be able to complete our evaluation, testing and any required remediation in a timely fashion. During the evaluation and testing process, if we identify one or more material weaknesses in our internal control over financial reporting, we will be unable to assert that our internal controls are effective. If we are unable to conclude that our internal control over financial reporting is effective, or if our independent registered public accounting firm is unable to express an opinion on the effectiveness of our internal control over financial reporting, our investors could lose confidence in the accuracy and completeness of our financial reports, which could cause the price of our common stock to decline.
Our internal resources and personnel may be insufficient in the future to avoid accounting errors, and there can be no assurance that we will not have material weaknesses or significant deficiencies in the future. Any failure to maintain adequate controls or to adequately implement new or improved controls could harm our results of operations or cause us to fail to meet our reporting obligations.
Though we will be required to disclose changes made in our internal control and procedures on a quarterly basis, our independent registered public accounting firm will not be required to formally attest to the effectiveness of our internal control over financial reporting pursuant to Section 404 until the later of the year following our first annual report required to be filed with the SEC or the date we are no longer an “emerging growth company” as defined in the Jumpstart Our Business Startups Act of 2012, or the JOBS Act. We will remain an “emerging growth company” for up to five years, although if the market value of our common stock that is held by non-affiliates exceeds $700 million as of December 31 of any year prior to that time, we would cease to be an “emerging growth company” as of the following June 30. To comply with the requirements of being a public company, we may need to undertake various actions, such as implementing new internal controls and procedures and hiring accounting or internal audit staff.
When our independent registered public accounting firm is required to formally attest to the effectiveness of our internal control over financial reporting pursuant to Section 404, it may issue a report that is adverse in the event it is not satisfied with the level at which our internal controls are documented, designed or operating. Our remediation efforts may not enable us to avoid a material weakness in the future.
We are an “emerging growth company” and we cannot be certain if the reduced disclosure requirements applicable to emerging growth companies will make our common stock less attractive to investors.
We are an “emerging growth company,” as defined in the JOBS Act, and we intend to take advantage of certain exemptions from various reporting requirements that are applicable to public companies that are not “emerging growth companies,” including not being required to comply with the auditor attestation requirements of section 404 of the Sarbanes-Oxley Act, reduced disclosure obligations regarding executive compensation in our periodic reports and proxy statements, and exemptions from the requirements of holding a nonbinding advisory vote on executive compensation and stockholder approval of any golden parachute payments not previously approved. We cannot predict if investors will find our common stock less attractive because we will rely on these exemptions. If some investors find our common stock less attractive as a result, there may be a less active trading market for our common stock and our stock price may be more volatile.
In addition, Section 107 of the JOBS Act provides that an emerging growth company, as defined in the JOBS Act, can take advantage of the extended transition period provided in Section 7(a)(2)(B) of the Securities Act when complying with new or revised accounting standards. In other words, an emerging growth company can
–22–
Table of Contents
delay the adoption of certain accounting standards until those standards would otherwise apply to private companies. However, we are choosing to “opt out” of such extended transition period, and as a result, we will comply with new or revised accounting standards on the relevant dates on which adoption of such standards is required for non-emerging growth companies. Section 107 of the JOBS Act provides that our decision to opt out of the extended transition period for complying with new or revised accounting standards is irrevocable.
Economic conditions and other factors beyond our control may negatively impact our business, results of operations and financial condition.
Our revenue depends upon demand for Medicare insurance plans, which can be influenced by a variety of factors beyond our control. We have no control over the economic and other factors that influence such demand. We believe that demand for Medicare insurance and the services we offer has been adversely impacted by recent macroeconomic conditions. We cannot be certain of the future impact that the recent recession will have on our business. A further softening of demand for Medicare insurance and the services offered by us, whether caused by changes in consumer preferences or the regulated environment in which we operate, or by a weak economy, including as a result of recent disruptions in the global financial markets or a decrease in general consumer confidence, will result in decreased revenue and growth. Employers may attempt to reduce expenses by reducing or eliminating the subsidies that they provide to their retirees for the purchase of Medicare plans. In addition, consumers may attempt to reduce expenses by cancelling existing Medicare plans purchased through us, determine not to purchase new Medicare plans through us, or purchase Medicare plans with lower premiums for which we receive lower commissions. A continuing negative economic environment could also adversely impact the Medicare insurance carriers whose plans are offered on our exchange, and they may, among other things, determine to reduce their commission rates, increase premiums or reduce benefits, any of which could negatively impact our business, results of operations and financial condition.
To the extent the economy or other factors adversely impact our customer retention, the number or type of Medicare insurance applications submitted through us and that are approved by insurance carriers, or the commissions that we receive from Medicare insurance carriers, our rate of growth will decline and our business and results of operations will be harmed.
We may not be able to adequately protect our intellectual property, which could harm our business and results of operations.
We rely on a combination of patent, copyright, trademark and trade secret laws as well as confidentiality procedures and contractual provisions to establish and protect our intellectual property rights in the United States. We have not filed for protection of our intellectual property in any foreign jurisdiction. Any United States or other patents issued to us may not be sufficiently broad to protect our proprietary technologies, and given the costs of patent protection and for various other reasons, we may choose not to seek patent protection for certain of our proprietary technologies. These intellectual property rights will not prevent competitors from creating a competitive exchange platform and competing with us. We may not be effective in policing unauthorized use of our intellectual property, trade secrets and other confidential information, and even if we do detect violations, litigation may be necessary to enforce our intellectual property rights. Any enforcement efforts we undertake, including litigation, could be time-consuming and expensive, could divert our management’s attention and may result in a court determining that our intellectual property or other rights are unenforceable. If we are not successful in cost-effectively protecting our intellectual property rights, trade secrets and confidential information, our business, results of operations and financial condition could be harmed. Furthermore, if we cannot license or develop technology for key aspects of our business, we would be forced to limit our services and may be unable to compete effectively, which would harm our business, results of operations and financial condition.
If we are not able to maintain and enhance our brand, our business and results of operations will be harmed.
We believe that maintaining and enhancing our brand identity is critical to our relationships with existing members, marketing partners and insurance carriers and to our ability to attract new employer clients, members,
–23–
Table of Contents
marketing partners and insurance carriers. The promotion of our brand may require us to make substantial investments and we anticipate that, as our market becomes increasingly competitive, these branding initiatives may become increasingly difficult and expensive. The successful promotion of our brand will depend largely upon our marketing and public relations efforts and our ability to continue to offer high-quality products and services in an understandable and objective manner. Our brand promotion activities may not be successful or yield increased revenue, and to the extent that these activities yield increased revenue, the increased revenue may not offset the expenses we incur. In addition, we may take actions that have the unintended consequence of harming our brand. If we do not successfully maintain and enhance our brand, our business may not grow and we could lose marketing partners and members, which could, in turn, cause insurance carriers to terminate their relationships with us, all of which would harm our business, results of operations and financial condition.
System failures or capacity constraints could harm our business and results of operations.
The performance, reliability and availability of our website, call centers and underlying network infrastructures are critical to our financial results, our brand and our relationship with consumers, marketing partners and Medicare insurance carriers. Although we regularly attempt to enhance and maintain our website, call centers and system infrastructure, system failures and interruptions may occur if we are unsuccessful in these efforts or experience difficulties with transitioning existing systems to upgraded systems, if we are unable to accurately project the rate or timing of increases in our website traffic or call center call volume or for other reasons, some of which are completely outside our control. Significant failures and interruptions, particularly during peak enrollment periods, could harm our business, results of operations and financial condition.
We rely in part upon third-party vendors, including data center and bandwidth providers, to operate and maintain our website. We cannot predict whether additional network capacity will be available from these vendors as we need it, and our network or our suppliers’ networks might be unable to achieve or maintain a sufficiently high capacity of data transmission to allow us to process health insurance applications in a timely manner or effectively download data, especially if our website traffic increases. Any system failure that causes an interruption in, or decreases the responsiveness of, our services could impair our revenue-generating capabilities, harm our brand image and subject us to potential liability. Our database and systems are vulnerable to damage or interruption from human error, earthquakes, fire, floods, power loss, telecommunications failures, physical or electronic break-ins, computer viruses, acts of terrorism, other attempts to harm our systems and similar events.
Consumers may call our licensed benefit advisors for assistance in connection with submitting Medicare insurance applications after using our platform. We depend upon third parties, including telephone service providers and third-party software providers, to operate our call centers. Any failure of the systems upon which we rely in the operation of our call centers could negatively impact sales as well as our relationship with members, which could harm our business, results of operations and financial condition.
If we are unable to attract and retain qualified personnel, our business could be harmed.
Our success is dependent upon the performance of our senior management and key personnel. Our future success will depend upon our continued ability to identify, hire, develop, motivate and retain world class talent. Our ability to execute efficiently is dependent upon contributions from all of our employees, in particular our senior management team, including Bryce A. Williams, our Chief Executive Officer, Joseph J. Murad, our Chief Operating Officer, and Cameron C. Liljenquist, our Chief Technology Officer. We do not maintain key person insurance for our senior management team members or key personnel. Key institutional knowledge remains with a small group of long-term employees and directors whom we may not be able to retain. Our management and employees can terminate their employment at any time, and the loss of the services of any of our executive officers or key employees could harm our business. In addition, from time to time, there may be changes in our senior management team that may be disruptive to our business. If our senior management team, including any new hires that we may make, fails to work together effectively and to execute our plans and strategies on a timely basis, our business could be harmed.
–24–
Table of Contents
We appoint a single writing agent with each insurance carrier. If we lose the service of our appointed writing agent, the duties of writing agent will need to be transitioned to other qualified company personnel. Due to our national reach and the large number of carrier partners whose plans are purchased by our members, this transition may be difficult and requires a significant period of time to complete. If the transition is not successful or takes too long to complete, our agency relationship with particular insurance carriers may be terminated, our commission payments could be discontinued or delayed, our insurance agency licenses could be revoked and, as a result, our business, results of operations and financial condition would be harmed.
Our success is also dependent upon our ability to attract additional personnel for all areas of our organization. We may not be successful in attracting and retaining personnel on a timely basis, on competitive terms or at all. If we are unable to attract and retain the necessary personnel, our business and prospects would be harmed.
The terms of our loan and security agreement with Silicon Valley Bank may restrict our ability to engage in certain transactions.
The terms of our loan and security agreement with Silicon Valley Bank restrict our ability to engage in certain transactions, including disposing of certain assets, incurring additional indebtedness, declaring dividends, acquiring or merging with another entity or leasing additional real property unless conditions set forth in our agreement with Silicon Valley Bank are met or unless we receive prior approval from Silicon Valley Bank. Our obligations under the loan and security agreement are secured by substantially all of our assets. The loan and security agreement further limits our ability to make material changes to our management team or enter into transactions with affiliates. If Silicon Valley Bank does not consent to any of these actions, we could be prohibited from engaging in transactions that could be beneficial to our business and our stockholders.
Acquisitions could disrupt our business and harm our financial condition and results of operations.
We may decide to acquire complimentary businesses, products and technologies. Our ability as an organization to successfully make and integrate acquisitions is unproven. Acquisitions could require significant capital infusions and could involve many risks, including but not limited to, potential negative impact on our results of operations due to debt or liabilities incurred in connection with an acquisition, difficulties assimilating and integrating the acquired business, disruption of our ongoing business by diverting resources and distracting management, not realizing the expected benefits of the acquisition, and potential dilution of stockholders’ ownership in the event we issue equity securities to complete an acquisition. We cannot assure you that we will be able to identify or consummate any future acquisition on favorable terms, or at all. If we do pursue an acquisition, it is possible that we not realize the anticipated benefits from the acquisition or that the financial markets or investors will negatively view the acquisition. Even if we successfully complete an acquisition, it could harm our business, results of operations and financial condition.
We may not be able to secure additional financing in a timely manner, or at all, to meet our future capital needs, which could impair our ability to execute on our business plan.
We believe that our existing cash, cash equivalents and short-term investments, expected cash flow from operations and net proceeds of this offering, will be sufficient to meet our operating and capital requirements for at least the next 12 months. However, we may require additional capital to respond to business opportunities, challenges, acquisitions or unforeseen circumstances and may determine to engage in equity or debt financings for other reasons. Any debt financing secured by us in the future could involve restrictive covenants relating to our capital raising activities and other financial and operational matters, which may make it more difficult for us to obtain additional capital and to pursue business opportunities, including potential acquisitions. We may not be able to secure additional debt or equity financing in a timely manner, or at all.
–25–
Table of Contents
Risks Related to Regulation
The medical loss ratio requirements that are a part of Healthcare Reform could harm our business.
Healthcare Reform contains provisions requiring insurance carriers to maintain specified minimum medical loss ratios. Medical loss ratio refers to the percentage of premium revenue that an insurance company spends on providing health care and improving the quality of care. The medical loss ratio requirements for individual health insurance are effective for calendar year 2011 and later years and, among other things, require health insurance companies to spend 80% of their premium revenue on reimbursement for clinical services and activities that improve health care quality. The medical loss ratio requirement for Medicare Advantage plans is 85% and goes into effect in 2014. In response to the individual medical loss ratio requirements, many insurance carriers have significantly reduced commissions in connection with the sale of these plans. If insurance carriers reduce or further reduce our commissions, including base commission rates or override commissions, in response to medical loss ratio requirements, or as a result of any other aspect of Healthcare Reform, our business, results of operations and financial condition would be harmed. In addition, the medical loss ratio requirements may cause certain insurance carriers to limit the geographies in which they sell health insurance or exit certain markets altogether, to place less reliance on agents and brokers to distribute their plans or to limit their health insurance offerings in any number of other ways, each of which would harm our business, results of operations and financial condition.
If we fail to comply with the numerous laws and regulations that are applicable to our business, our results of operations would be harmed.
The health insurance industry is heavily regulated by each state in the United States. For instance, state insurance laws require us to maintain a valid license in each state in which we transact health insurance business and further require that we adhere to marketing and sales, documentation and administration practices specific to that state. In addition, each employee who transacts health insurance business on our behalf must maintain a valid agent license in one or more states. Because we do business in all 50 states and the District of Columbia, compliance with health insurance-related laws, rules and regulations is difficult and imposes significant costs on our business. Each jurisdiction’s insurance department typically has the power, among other things, to:
| • | grant, suspend, revoke and not renew licenses to transact insurance business; |
| • | conduct inquiries into and examine the insurance-related activities and conduct of agents and agencies; |
| • | require and regulate disclosure in connection with the sale and solicitation of health insurance; |
| • | authorize how, by which personnel and under what circumstances insurance premiums can be quoted and published and an insurance policy sold; |
| • | determine which entities can be paid commissions from insurance carriers and the circumstances under which they may be paid; |
| • | regulate the content of insurance-related advertisements, including websites, and other marketing practices; |
| • | approve policy forms, require specific benefits and benefit levels and regulate premium rates; |
| • | impose fines and other penalties for violations of laws or regulations; and |
| • | impose continuing education requirements on agents and brokers. |
Due to the complexity, periodic modification and differing interpretations of insurance laws and regulations, we may discover that we are not always in compliance with them. Failure to comply with insurance laws, regulations and guidelines or other laws and regulations applicable to our business could result in significant liability, additional department of insurance licensing requirements, the revocation of licenses in a particular jurisdiction and/or our inability to sell health insurance plans, which could significantly increase our operating expenses and otherwise harm our business, results of operations and financial condition.
–26–
Table of Contents
We are also subject to additional insurance regulatory risks because we use the internet as a distribution platform. In many cases, it is not clear how existing insurance laws and regulations apply to internet-related health insurance advertisements and transactions. To the extent that new laws or regulations are adopted that conflict with the way we conduct our business, or to the extent that existing laws and regulations are interpreted in a way that is adverse to us, our business, results of operations and financial condition would be harmed.
Additionally, we have received, and may in the future receive, inquiries from regulators regarding our marketing and business practices to ensure that they comply with Healthcare Reform, CMS’ Medicare Marketing Guidelines and related laws and regulations. We typically respond by explaining how we believe we are in compliance with relevant regulations or may modify our practices in connection with the inquiry. Any modification of our marketing or business practices in response to future regulatory inquiries could harm our business, results of operations or financial condition. Generally, an adverse regulatory action in one jurisdiction could result in penalties and adversely affect our license status or reputation in other jurisdictions due to a requirement that adverse regulatory actions in one jurisdiction be reported to other jurisdictions in which we transact business. Even if the allegations in any regulatory or other action against us are proven false, any surrounding negative publicity could harm consumer, customer, marketing partner or insurance carrier confidence in us, which could significantly damage our brand and harm our business, results of operations and financial condition.
The laws and regulations governing the advertising, offer, sale and purchase of health insurance are subject to change, and future changes may be adverse to our business. For example, a long-standing provision in each state’s law that we believe is advantageous to our business is that once health insurance premiums are set by the carrier and approved by state regulators, they are fixed and not generally subject to negotiation or discounting by insurance companies or agents. Additionally, state laws generally prohibit insurance carriers, agents and brokers from providing financial incentives, such as rebates, to their members in connection with the sale of health insurance. As a result, we do not currently compete with insurance carriers or other agents and brokers on the price of the health insurance plans offered on our website. If these regulations change, we could be forced to reduce prices or provide rebates or other incentives for the health insurance plans sold through our exchange platform. States have adopted, and will continue to adopt, new laws and regulations in response to Healthcare Reform. It is too early to predict how these new laws and regulations will impact our business, but in some cases such laws and regulations could harm our business.
We are subject to communications and telemarketing laws governing telephonic communications, which subject us to penalties if we are unable to fully comply with such laws.
We market insurance products through various distribution media, including direct mail, online marketing, telemarketing and other methods. Telemarketing of products and services is subject to Federal and state telemarketing regulations, including the Federal Trade Commission’s, or the FTC’s, Telemarketing Sales Rule, or TSR, the Federal Communication Commission’s, or the FCC’s Telephone Consumer Protection Act of 1991, or the TCPA, and the FCC’s implementing regulations, as well as various state telemarketing laws and regulations. The TCPA broadly regulates outbound calls, including live operator calls. Among other things, this limits the hours during which telemarketers may call consumers and restricts the use of automated telephone dialing equipment to call certain telephone numbers unless prior express consent has been obtained. The Federal Telemarketing and Consumer Fraud and Abuse Prevention Act of 1994 and FTC regulations thereunder prohibit deceptive, unfair or abusive practices in telemarketing sales. Both the FTC and state attorneys general have authority to seek injunctive relief and consumer redress for telemarketing activities deemed to be “unfair or deceptive acts or practices.” The FTC’s TSR applies to both inbound and outbound calls and the FTC’s 2003 Amendment to the TSR created a national “Do-Not-Call” Registry, which became effective in October 2003. Certain states have enacted separate “Do-Not-Call” Registries.
Online marketing and, in particular, sending commercial electronic mail is regulated under the Controlling the Assault of Non-Solicited Pornography and Marketing Act of 2003, or CAN-SPAM Act, which requires senders of commercial electronic mail to, among other things, include various disclosures in their commercial
–27–
Table of Contents
emails. Both the FTC and state attorneys general have authority to seek injunctive relief and statutory damages under the CAN-SPAM Act. The CAN-SPAM Act also permits actions by providers of Internet access service for injunctive relief and damages against violators of the act. Compliance with these Federal and state regulations, where applicable, is generally our responsibility, and we could be subject to a variety of enforcement and private actions for failure to comply with such regulations.
We may not be successful in performing services pursuant to Federal or state government contracts, which may limit our ability to execute on our growth strategy.
An important element of our strategy is to provide services to government entities in connection with Healthcare Reform and its requirement that states establish health insurance exchanges. While we are involved in a small number of government contracts as a contractor, we have limited experience with government contracting. Generally, government contracts are offered through a competitive bidding process. A number of entities may compete for the award of any particular government contract or related subcontract, and we may not be able to outbid our competitors. Even if we are awarded a contract, unsuccessful bidders may protest or challenge the contract award, which could result in our losing the contract or having the scope of the contract scaled back. Complicated rules apply to doing business with the Federal and state governments, including the Federal Acquisition Regulation, or FAR, special FAR agency supplements and state procurement laws and regulations, compliance with which may be costly and time consuming. Pursuing government contracts is complicated further by the existence of Federal and state conflicts of interest laws that may prohibit utilizing government health benefit consultants as brokers or finders in securing such contracts. In addition, various restrictions under and relating to these government contracts may require us to restructure aspects of our operations to perform under a contract, which may be difficult or impossible. As a government contractor, we are subject to audits, cost reviews and investigations by oversight agencies.
We may not be successful in our effort to enter into government contracts, and even if we are, we may face difficulty and unanticipated expense in complying with applicable laws, regulations and contractual requirements, which may change over time. Further, to the extent our channel partners provide consulting services to government entities, we may be required to comply with applicable Federal and state conflicts of interest laws in connection with government contracts entered into upon referrals from such channel partners. If we are not successful in our government contracting efforts, our business, results of operations and financial condition could be harmed. In addition, if we fail to comply with the terms of one or more of our government contracts or applicable laws and regulations, we could be suspended or barred from future government projects for a significant period of time, as well as face civil or criminal fines and penalties.
The government contracts we have entered into for the use of our services have short terms. Governmental entities may choose not to renew our contracts with them for any reason, including as a result of performance of the contract, competing solutions or a change in the governmental entity’s preferences. Furthermore, the contracts may be terminated as a result of our performance or as a result of the performance or actions of third parties involved in the contracts, such as subcontractors. Any government contract that violates Federal or state conflicts of interest laws may be voidable or otherwise unenforceable. The termination or nonrenewal of any of our government contracts could harm our business, results of operations and financial condition and make it more difficult for us to successfully bid on future government contracting opportunities.
Risks Relating to this Offering, the Securities Markets and Ownership of Our Common Stock
We cannot assure you that an active, liquid market will develop for our common stock or what the market price of our common stock will be.
Before this offering, there was no public trading market for our common stock, and we cannot assure you that one will develop or be sustained after this offering. If a market does not develop or is not sustained, it may be difficult for you to sell your shares of common stock at an attractive price or at all. We cannot predict the prices at which our common stock will trade. The initial public offering price of our common stock will be determined by negotiations with the underwriters and may not bear any relationship to the market price at which
–28–
Table of Contents
our common stock will trade after this offering or to any other established criteria of the value of our business.
The price of our common stock may be volatile and the value of your investment could decline.
The trading price of our common stock following this offering may fluctuate substantially. The price of our common stock that will prevail in the market after this offering may be higher or lower than the price you pay, depending on many factors, some of which are beyond our control and may not be related to our operating performance. These fluctuations could cause you to lose all or part of your investment in our common stock. Factors that could cause fluctuations in the trading price of our common stock include the following:
| • | price and volume fluctuations in the overall stock market from time to time; |
| • | significant volatility in the market price and trading volume of companies in our industry; |
| • | actual or anticipated changes in our results of operations or fluctuations in our results of operations; |
| • | whether our results of operations meet the expectations of securities analysts or investors; |
| • | actual or anticipated changes in the expectations of investors or securities analysts; |
| • | publication of research reports about us, our competitors or our industry, or positive or negative recommendations or withdrawal of research coverage by securities analysts; |
| • | actual or anticipated developments in our competitors’ businesses or the competitive landscape generally; |
| • | threatened or actual litigation involving us, our industry or both; |
| • | regulatory developments in the United States that may affect or may be perceived to affect our business; |
| • | general economic conditions and trends; |
| • | major catastrophic events; |
| • | sales of large blocks of our stock; or |
| • | departures of key personnel. |
In addition, if the market for health care stocks or the stock market in general experiences loss of investor confidence, the trading price of our common stock could decline for reasons unrelated to our business, results of operations or financial condition. The trading price of our common stock might also decline in reaction to events that affect other companies in our industry even if these events do not directly affect us. In the past, following periods of volatility in the market price of a company’s securities, securities class action litigation has often been brought against that company. If our stock price is volatile, we may become the target of securities litigation. Securities litigation could result in substantial costs and divert our management’s attention and resources from our business. This could have a material adverse effect on our business, results of operations and financial condition.
Sales of outstanding shares of our common stock into the market in the future could cause the market price of our common stock to drop significantly, even if our business is doing well.
If our existing stockholders sell, or indicate an intent to sell, substantial amounts of our common stock in the public market after the contractual lock-up and other legal restrictions on resale lapse, the trading price of our common stock could decline. After this offering, approximately shares of common stock will be outstanding. Of these shares, the shares of our common stock to be sold in this offering will be freely tradable, unless such shares are held by “affiliates,” as that term is defined in Rule 144 of the Securities Act.
Our directors, officers, employees and current stockholders are subject to a 180-day contractual lock-up that prevents them from selling their shares prior to the expiration of this lock-up period. The lock-up is subject to extension under certain circumstances. Morgan Stanley & Co. LLC and Barclays Capital Inc. may, in their sole discretion, permit shares subject to this lock-up to be sold prior to its expiration. For additional information, see “Shares Eligible for Future Sale—Lock-Up Agreements.”
–29–
Table of Contents
At various times after the lock-up agreements pertaining to this offering expire, up to an additional shares will be eligible for sale in the public market, of which are, based on the number of shares outstanding as of March 31, 2012, held by directors, executive officers and other affiliates and will be subject to volume limitations under Rule 144 under the Securities Act of 1933, as amended, and various vesting agreements.
The 3,050,438 shares underlying stock options that were outstanding as of March 31, 2012 will also become eligible for sale in the public market to the extent permitted by the provisions of various option agreements, the lock-up agreements and Rules 144 and 701 under the Securities Act. In addition, as of March 31, 2012, 152,809 shares of common stock were reserved for future issuance under our stock plans, and upon the consummation of this offering, options to purchase approximately 1,800,000 shares of our common stock will be reserved for future issuance under our 2012 Equity Incentive Plan. If these additional shares are sold, or if it is perceived that they will be sold, in the public market, the trading price of our common stock could decline. For additional information, see “Shares Eligible for Future Sale.”
If you purchase shares of our common stock in this offering, you will experience substantial and immediate dilution.
If you purchase shares of our common stock in this offering, you will experience substantial and immediate dilution of $ per share based on an assumed initial public offering price of $ per share, which is the midpoint of the range as reflected on the cover page of this prospectus, because the price that you pay will be substantially greater than the net tangible book value per share of the common stock that you acquire. This dilution is due in large part to the fact that our earlier investors paid substantially less than the initial public offering price when they purchased their shares of our capital stock. In addition, investors who purchase shares in this offering will contribute approximately % of the total amount of equity capital raised by us through the date of this offering but will only own approximately % of our outstanding shares. In addition, we have issued options to acquire common stock at prices significantly below the assumed initial public offering price. To the extent outstanding options are ultimately exercised, there will be further dilution to investors in this offering.
If securities analysts do not publish research or reports about our business, or if they downgrade our stock, the price of our stock could decline.
The trading market for our common stock could be influenced by any research and reports that securities or industry analysts publish about us or our business. We do not currently have and may never obtain research coverage by securities and industry analysts. If no securities or industry analysts commence coverage of our company, the trading price for our stock would be negatively impacted. In the event securities or industry analysts cover our company and one or more of these analysts downgrade our stock or publish inaccurate or unfavorable research about our business, our stock price would likely decline. If one or more of these analysts cease coverage of our company or fail to publish reports on us regularly, demand for our stock could decrease, which could cause our stock price and trading volume to decline.
Insiders will continue to have substantial control over us after this offering, which could limit your ability to influence the outcome of key transactions, including a change of control.
Our directors, executive officers and each of our stockholders who own greater than 5% of our outstanding common stock and their affiliates, in the aggregate, will own approximately % of the outstanding shares of our common stock after this offering, based on the number of shares outstanding as of March 31, 2012. As a result, these stockholders, if acting together, will be able to influence or control matters requiring approval by our stockholders, including the election of directors and the approval of mergers, acquisitions or other strategic transactions. They may also have interests that differ from yours and may vote in a way with which you disagree and which may be adverse to your interests. This concentration of ownership may have the effect of delaying, preventing or deterring a change of control of our company, could deprive our stockholders of an opportunity to
–30–
Table of Contents
receive a premium for their common stock as part of a sale of our company and might ultimately affect the market price of our common stock.
We have broad discretion in the use of the net proceeds that we receive in this offering.
The principal purposes of this offering are to raise additional capital, to create a public market for our common stock and to facilitate our future access to the public equity markets. Other than the repayment of any outstanding amounts under our term loan with Silicon Valley Bank, we have not determined the specific allocation of the net proceeds that we receive in this offering. We intend to use the balance of the net proceeds that we receive in this offering for general corporate purposes, including working capital. Accordingly, our management will have broad discretion over the specific use of the net proceeds that we receive in this offering and might not be able to obtain a significant return, if any, on investment of these net proceeds. Investors in this offering will need to rely upon the judgment of our management with respect to the use of proceeds. If we do not use the net proceeds that we receive in this offering effectively, our business, results of operations and financial condition could be harmed.
We do not intend to pay dividends for the foreseeable future.
While we have declared and paid dividends on shares of our preferred and common stock in the past, we intend to retain any earnings to finance the future operation and expansion of our business, and we do not anticipate paying any cash dividends in the foreseeable future. In addition, our loan and security agreement with Silicon Valley Bank restricts our ability to pay dividends without their prior consent. As a result, you may only receive a return on your investment in our common stock if the market price of our common stock increases and you sell your shares.
The requirements of being a public company may strain our resources, divert management’s attention and affect our ability to attract and retain qualified board members.
As a public company, we will be subject to the reporting requirements of the Securities Exchange Act of 1934, as amended, or the Exchange Act, the Sarbanes-Oxley Act, the Dodd-Frank Act, the listing requirements of the New York Stock Exchange and other applicable securities rules and regulations. Compliance with these rules and regulations will increase our legal and financial compliance costs, make some activities more difficult, time-consuming or costly, and increase demand on our systems and resources, particularly after we are no longer an “emerging growth company” as defined in the JOBS Act. The Exchange Act requires, among other things, that we file annual, quarterly and current reports with respect to our business and results of operations. The Sarbanes-Oxley Act requires, among other things, that we maintain effective disclosure controls and procedures and internal control over financial reporting. In order to maintain and, if required, improve our disclosure controls and procedures and internal control over financial reporting to meet this standard, significant resources and management oversight may be required. As a result, management’s attention may be diverted from other business concerns, which could harm our business and results of operations.
In addition, changing laws, regulations and standards relating to corporate governance and public disclosure are creating uncertainty for public companies, increasing legal and financial compliance costs and making some activities more time consuming. These laws, regulations and standards are subject to varying interpretations, in many cases due to their lack of specificity, and, as a result, their application in practice may evolve over time as new guidance is provided by regulatory and governing bodies. This could result in continuing uncertainty regarding compliance matters and higher costs necessitated by ongoing revisions to disclosure and governance practices. We intend to invest resources to comply with evolving laws, regulations and standards, and this investment may result in increased general and administrative expenses and a diversion of management’s time and attention from revenue-generating activities to compliance activities. If our efforts to comply with new laws, regulations and standards differ from the activities intended by regulatory or governing bodies due to ambiguities related to practice, regulatory authorities may initiate legal proceedings against us, and our business may be harmed.
–31–
Table of Contents
However, for as long as we remain an “emerging growth company” as defined in the JOBS Act, we intend to take advantage of certain exemptions from various reporting requirements that are applicable to public companies that are not “emerging growth companies,” including not being required to comply with the independent auditor attestation requirements of Section 404 of the Sarbanes-Oxley Act, reduced disclosure obligations regarding executive compensation in our periodic reports and proxy statements, and exemptions from the requirements of holding a nonbinding advisory vote on executive compensation and stockholder approval of any golden parachute payments not previously approved. We intend to take advantage of these reporting exemptions until we are no longer an “emerging growth company.”
We will remain an “emerging growth company” for up to five years, although if the market value of our common stock that is held by non-affiliates exceeds $700 million as of December 31 of any year prior to that time, we would cease to be an “emerging growth company” as of the following June 30.
We also expect that being a public company and these new rules and regulations will make it more expensive for us to maintain director and officer liability insurance. While we currently maintain director and officer liability insurance, we intend to increase policy limits and expand coverage upon the completion of this offering and we may be required to incur substantially higher costs to increase such coverage. These factors could also make it more difficult for us to attract and retain qualified members of our board of directors, particularly to serve on our audit committee and compensation committee, and qualified executive officers.
As a result of the disclosure of information in this prospectus and in filings required of a public company, our business and financial condition will become more visible, which we believe may result in threatened or actual litigation, including by competitors and other third parties. If such claims are successful, our business and results of operations could be harmed, and even if the claims do not result in litigation or are resolved in our favor, these claims, and the time and resources necessary to resolve them, could divert the resources of our management and harm our business and results of operations.
Provisions in our certificate of incorporation and bylaws and under Delaware law might discourage, delay or prevent a change of control of our company or changes in our management and, therefore, depress the trading price of our common stock.
Our certificate of incorporation and bylaws contain provisions that could depress the trading price of our common stock by acting to discourage, delay or prevent a change of control of our company or changes in our management that the stockholders of our company may deem advantageous. These provisions:
| • | establish a classified board of directors so that not all members of our board of directors are elected at one time; |
| • | authorize the issuance of “blank check” preferred stock that our board of directors could issue to increase the number of outstanding shares to discourage a takeover attempt; |
| • | prohibit stockholder action by written consent, which requires all stockholder actions to be taken at a meeting of our stockholders; |
| • | prohibit stockholders from calling a special meeting of our stockholders; |
| • | provide that our board of directors is expressly authorized to make, alter or repeal our bylaws; and |
| • | establish advance notice requirements for nominations for elections to our board of directors or for proposing matters that can be acted upon by stockholders at stockholder meetings. |
Additionally, we are subject to Section 203 of the Delaware General Corporation Law, which generally prohibits a Delaware corporation from engaging in any of a broad range of business combinations with any “interested” stockholder for a period of three years following the date on which the stockholder became an “interested” stockholder and which may discourage, delay or prevent a change of control of our company.
-32-
Table of Contents
Any provision of our certificate of incorporation or bylaws or Delaware law that has the effect of delaying or deterring a change in control could limit the opportunity for our stockholders to receive a premium for their shares of our common stock, and could also affect the price that some investors are willing to pay for our common stock.
–33–
Table of Contents
SPECIAL NOTE REGARDING FORWARD-LOOKING STATEMENTS AND INDUSTRY DATA
This prospectus contains forward-looking statements that are based on our management’s beliefs and assumptions and on information currently available to our management. The forward-looking statements are contained principally in “Prospectus Summary,” “Risk Factors,” “Use of Proceeds,” “Management’s Discussion and Analysis of Financial Condition and Results of Operations,” “Business” and “Compensation Discussion and Analysis.” Forward-looking statements include all statements that are not historical facts and can be identified by terms such as “anticipates,” “believes,” “could,” “seeks,” “estimates,” “expects,” “intends,” “may,” “plans,” “potential,” “predicts, “projects,” “should,” “will,” “would” or similar expressions and the negatives of those terms. These forward-looking statements include, but are not limited to, statements concerning the following:
| • | our expectations regarding our financial performance, including our revenue, expenses, and operations; |
| • | anticipated trends and impact of regulatory reform on our business and the industry in which we operate; |
| • | the effects of increased competition in our market; |
| • | our ability to anticipate market needs or develop new and enhanced services to meet those needs; |
| • | our ability to effectively manage growth and expand our operations and infrastructure; |
| • | the attraction and retention of qualified employees and key personnel; |
| • | the ability of our channel partner strategy to accelerate or increase future member enrollment growth; |
| • | our ability to capture market opportunities outside of the Medicare exchange market; |
| • | our ability to protect our users’ information and adequately address privacy concerns; and |
| • | our anticipated cash needs and our estimates regarding our capital requirements and need for additional liquidity. |
These forward-looking statements are subject to a number of risks, uncertainties and assumptions, including those described in “Risk Factors.” Moreover, we operate in a very competitive and rapidly changing environment. New risks emerge from time to time. It is not possible for our management to predict all risks, nor can we assess the impact of all factors on our business or the extent to which any factor, or combination of factors, may cause actual results to differ materially from those contained in any forward-looking statements we may make. In light of these risks, uncertainties and assumptions, the forward-looking events and circumstances discussed in this prospectus may not occur and actual results could differ materially and adversely from those anticipated or implied in the forward-looking statements.
You should not rely upon forward-looking statements as predictions of future events. Although we believe that the expectations reflected in the forward-looking statements are reasonable, we cannot guarantee that the future results, levels of activity, performance or events and circumstances reflected in the forward-looking statements will be achieved or occur. Moreover, except as required by law, we assume no obligation to update these forward-looking statements publicly, or to update the reasons actual results could differ materially from those anticipated in these forward-looking statements, even if new information becomes available in the future. You should read this prospectus and the documents that we have filed as exhibits to the registration statement, of which this prospectus is a part, completely and with the understanding that our actual future results may be materially different from what we expect.
This prospectus also contains estimates and other information concerning our industry, including market size and growth rates, which are based on industry publications, surveys and forecasts from various third-party sources. This information involves a number of assumptions and limitations, and you are cautioned not to give undue weight to these estimates. Although we believe the data from these third-party sources is reliable, information about market-position, market-opportunity and market-size and projections, assumptions and
-34-
Table of Contents
estimates of our future performance and the future performance of the industry in which we operate are necessarily subject to a high degree of uncertainty and risk due to a variety of factors, including those described in “Risk Factors” and elsewhere in this prospectus. These and other factors could cause results to differ materially from those expressed in the estimates made by the third-parties and by us.
-35-
Table of Contents
We estimate that the net proceeds from our sale of shares of common stock in this offering at an assumed initial public offering price of $ per share, the midpoint of the price range set forth on the front cover of this prospectus, after deducting estimated underwriting discounts and commissions and estimated offering expenses, will be approximately $ million, or $ million if the underwriters’ over-allotment option is exercised in full. A $1.00 increase (decrease) in the assumed initial public offering price would increase (decrease) the net proceeds to us from this offering by $ million, assuming the number of shares offered by us, as set forth on the front cover of this prospectus, remains the same and after deducting the estimated underwriting discounts and commissions.
The principal purposes of this offering are to increase our financial flexibility, increase our visibility in the marketplace and, with respect to this offering, create a public market for our common stock. As of the date of this prospectus, we cannot specify with certainty all of the particular uses for these proceeds or the amounts that we plan to use for any particular purpose. However, we currently intend to use these proceeds primarily for general corporate purposes, which may include working capital, sales and marketing activities, general and administrative matters and capital expenditures. We may use a portion of the net proceeds to repay some or all of the amounts outstanding under our debt facility with Silicon Valley Bank. In addition, we may use a portion of the net proceeds for the acquisition of, or investment in, technologies, solutions or businesses that complement our business, although we have no present commitments or agreements to enter into any acquisitions or investments. We will have broad discretion over the uses of the net proceeds in this offering. Pending these uses, we intend to invest the net proceeds from this offering in short-term, investment-grade interest-bearing securities such as money market accounts, certificates of deposit, commercial paper and guaranteed obligations of the U.S. government.
While we have declared and paid cash dividends on our preferred and common stock in the past, following this offering we currently intend to retain all available funds and any future earnings for use in the operation of our business and do not anticipate paying any dividends on our common stock in the foreseeable future. In addition, the terms of our loan and security agreement with Silicon Valley Bank currently prohibit us from paying cash dividends without prior consent. Any future determination to declare dividends will be made at the discretion of our board of directors, subject to applicable laws and compliance with covenants under our loan and security agreement that restrict or limit our ability to pay dividends without Silicon Valley Bank’s prior written consent, and will depend on our financial condition, results of operations, capital requirements, general business conditions and other factors that our board of directors may deem relevant.
-36-
Table of Contents
The following table sets forth our consolidated cash and cash equivalents and short-term investments and capitalization as of March 31, 2012:
| • | on an actual basis; |
| • | on a pro forma basis to give effect to the automatic conversion of all outstanding shares of our convertible preferred stock into 14,749,992 shares of common stock upon the completion of this offering; and |
| • | on a pro forma as adjusted basis to give effect to the pro forma matters described above and to reflect our receipt of the net proceeds from our sale of shares of common stock in this offering at an assumed initial public offering price of $ per share, the midpoint of the price range set forth on the front cover of this prospectus, after deducting estimated underwriting discounts and commissions and estimated offering expenses. |
The information below is illustrative only and our capitalization following the completion of this offering will be adjusted based on the actual initial public offering price and other terms of this offering determined at pricing. You should read this table together with “Management’s Discussion and Analysis of Financial Condition and Results of Operations” and our consolidated financial statements and the related notes appearing elsewhere in this prospectus.
| As of March 31, 2012 | ||||||||||
| Actual | Pro Forma | Pro Forma
As Adjusted(1) | ||||||||
| Cash and cash equivalents and short-term investments |
$ | 13,261 | $ | 13,261 | ||||||
|
|
|
|
|
| ||||||
| Debt and capital lease obligations |
10,168 | 10,168 | ||||||||
| Convertible preferred stock, $0.001 par value: 14,750,000 shares authorized, 14,749,992 shares issued and outstanding, actual; no shares authorized, issued or outstanding, pro forma and pro forma as adjusted |
22,539 | — | ||||||||
| Stockholders’ deficit: |
||||||||||
| Common stock, $0.001 par value; 20,475,000 shares authorized, 1,546,753 shares issued and outstanding, actual; shares authorized, 16,296,745 shares issued and outstanding, pro forma; and shares authorized, shares issued and outstanding, pro forma as adjusted |
1 | 16 | ||||||||
| Additional paid-in capital |
2,110 | 24,634 | ||||||||
| Accumulated deficit |
(37,433 | ) | (37,433 | ) | ||||||
|
|
|
|
|
| ||||||
| Total stockholders’ deficit |
(35,322 | ) | (12,783 | ) | ||||||
|
|
|
|
|
| ||||||
| Total capitalization |
$ | (2,615 | ) | $ | (2,615 | ) | ||||
|
|
|
|
|
| ||||||
| (1) | A $1.00 increase (decrease) in the assumed initial public offering price of $ per share, the midpoint of the range set forth on the front cover of this prospectus, would increase (decrease) each of cash and cash equivalents, additional paid-in capital, total stockholders’ equity (deficit) and total capitalization by $ million, assuming that the number of shares offered by us, as set forth on the front cover of this prospectus, remains the same, and after deducting estimated underwriting discounts and commissions payable by us. |
-37-
Table of Contents
The number of shares of our common stock set forth in the table above excludes:
| • | 3,050,438 shares of common stock issuable upon the exercise of options outstanding as of March 31, 2012, with a weighted-average exercise price of $1.43 per share; |
| • | 948,011 shares of common stock that may be issuable upon the exercise of an outstanding warrant to purchase common stock, with an exercise price of $10.00 per share; |
| • | 13,750 shares of common stock issuable upon the exercise of options granted subsequent to March 31, 2012, with an exercise price of $9.15 per share; and |
| • | 1,939,059 unallocated shares of common stock reserved for future issuance under our stock-based compensation plans, consisting of (i) 139,059 shares of common stock reserved for future issuance under our 2007 Equity Incentive Plan (not including the options to purchase 13,750 shares of common stock granted subsequent to March 31, 2012), and (ii) 1,800,000 shares of common stock reserved for future issuance under our 2012 Equity Incentive Plan, which will become effective in connection with this offering, and shares that become available under our 2012 Equity Incentive Plan, pursuant to provisions thereof that automatically increase the share reserves under this plan each year, as more fully described in “Executive Compensation—Employee Benefit and Stock Plans.” |
-38-
Table of Contents
If you invest in our common stock, your interest will be diluted to the extent of the difference between the amount per share paid by purchasers of shares of common stock in this initial public offering and the pro forma as adjusted net tangible book value per share of common stock immediately after this offering.
As of March 31, 2012, our net tangible book value was approximately $ million, or $ per share of common stock. Net tangible book value per share represents the amount of our total tangible assets less our total liabilities, divided by the shares of common stock outstanding at March 31, 2012, assuming the conversion of all outstanding shares of our convertible preferred stock into common stock. The net tangible book value excludes deferred offering costs of $ .
After giving effect to our sale of shares of common stock in this offering at an assumed initial public offering price of $ per share, the midpoint of the price range set forth on the front cover of this prospectus, and after deducting estimated underwriting discounts and commissions and estimated offering expenses, our pro forma as adjusted net tangible book value at March 31, 2012 would have been $ , or $ per share of common stock. This represents an immediate increase in pro forma as adjusted net tangible book value of $ per share to existing stockholders and an immediate dilution of $ per share to new investors purchasing shares in this offering.
The following table illustrates this dilution:
| Assumed initial public offering price per share |
$ | |||||||
| Net tangible book value per share as of March 31, 2012 |
$ | |||||||
| Increase per share attributable to this offering |
||||||||
| Pro forma as adjusted net tangible book value per share after this offering |
||||||||
|
|
|
|||||||
| Net tangible book value dilution per share to new investors in this offering |
$ | |||||||
|
|
|
A $1.00 increase (decrease) in the assumed initial public offering price of $ per share, the midpoint of the price range set forth on the front cover of this prospectus, would increase (decrease) our pro forma net tangible book value, as adjusted to give effect to this offering, by $ per share and the dilution in pro forma as adjusted net tangible book value per share to new investors in this offering by $ per share, assuming the number of shares offered by us, as set forth on the front cover of this prospectus, remains the same and after deducting estimated underwriting discounts and commissions and estimated offering expenses.
If the underwriters exercise their over-allotment option in full, the pro forma net tangible book value per share of our common stock after giving effect to this offering would be $ per share, and the dilution in net tangible book value per share to investors in this offering would be $ per share.
The following table summarizes, on a pro forma as adjusted basis as of March 31, 2012, assuming the conversion of all outstanding shares of our convertible preferred stock into common stock, the total number of shares of common stock purchased from us, the total consideration paid to us, and the average price per share paid to us by existing stockholders and by new investors purchasing shares in this offering at the initial public offering price of $ per share, the midpoint of the price range set forth on the front cover of this prospectus, before deducting estimated underwriting discounts and commissions and estimated offering expenses:
| Shares Purchased | Total Consideration | Average Price Per Share |
||||||||||||||||
| Number | Percent | Amount | Percent | |||||||||||||||
| Existing stockholders |
% | $ | % | $ | ||||||||||||||
| New investors |
||||||||||||||||||
|
|
|
|
|
|
|
|
|
|
||||||||||
| Total |
% | $ | % | $ | ||||||||||||||
|
|
|
|
|
|
|
|
|
|
||||||||||
To the extent that any outstanding options are exercised, new investors will experience further dilution.
-39-
Table of Contents
SELECTED CONSOLIDATED FINANCIAL DATA
You should read the following selected historical consolidated financial data below in conjunction with “Management’s Discussion and Analysis of Financial Condition and Results of Operations” and the consolidated financial statements, related notes and other financial information included in this prospectus. The selected consolidated financial data in this section are not intended to replace the consolidated financial statements and are qualified in their entirety by the consolidated financial statements and related notes included in this prospectus.
The consolidated statements of operations data for the years ended June 30, 2009, 2010 and 2011 and the consolidated balance sheet data as of June 30, 2010 and 2011 are derived from our audited consolidated financial statements included in this prospectus. The consolidated statements of operations data for the years ended June 30, 2007 and 2008 and the consolidated balance sheet data as of June 30, 2007, 2008 and 2009 are derived from our audited consolidated financial statements not included in this prospectus. The consolidated statements of operations data for the nine months ended March 31, 2011 and 2012, and the consolidated balance sheet data as of March 31, 2012, are derived from our unaudited consolidated financial statements included elsewhere in this prospectus. We have prepared the unaudited financial information on the same basis as the audited consolidated financial statements and have included, in our opinion, all adjustments, consisting only of normal recurring adjustments that we consider necessary for a fair presentation of the financial information set forth in those statements. Our historical results are not necessarily indicative of the results to be expected in the future.
-40-
Table of Contents
| Year Ended June 30, | Nine Months Ended March 31, |
|||||||||||||||||||||||||||
| 2007 | 2008 | 2009 | 2010 | 2011 | 2011 | 2012 | ||||||||||||||||||||||
| (in thousands, except share and per share amounts) |
||||||||||||||||||||||||||||
| Consolidated Statements of Operations Data: |
||||||||||||||||||||||||||||
| Revenue: |
||||||||||||||||||||||||||||
| Commissions |
$ | 1,879 | $ | 11,789 | $ | 16,933 | $ | 43,646 | $ | 50,451 | $ | 35,716 | $ | 48,411 | ||||||||||||||
| Other |
358 | 631 | 779 | 370 | 676 | 442 | 468 | |||||||||||||||||||||
|
|
|
|
|
|
|
|
|
|
|
|
|
|
|
|||||||||||||||
| Total revenue |
2,237 | 12,420 | 17,712 | 44,016 | 51,127 | 36,158 | 48,879 | |||||||||||||||||||||
|
|
|
|
|
|
|
|
|
|
|
|
|
|
|
|||||||||||||||
| Operating expenses: |
||||||||||||||||||||||||||||
| Service center |
3,073 | 5,584 | 18,117 | 14,994 | 18,551 | 15,050 | 19,955 | |||||||||||||||||||||
| Sales and marketing |
2,870 | 4,757 | 6,768 | 7,290 | 10,134 | 6,346 | 10,856 | |||||||||||||||||||||
| Technology |
817 | 1,549 | 2,096 | 3,060 | 3,195 | 2,242 | 3,264 | |||||||||||||||||||||
| General and administrative |
1,072 | 1,705 | 5,072 | 5,464 | 6,728 | 5,043 | 5,974 | |||||||||||||||||||||
| Restructuring expense |
— | — | — | 314 | — | — | — | |||||||||||||||||||||
|
|
|
|
|
|
|
|
|
|
|
|
|
|
|
|||||||||||||||
| Total operating expenses |
7,832 | 13,595 | 32,053 | 31,122 | 38,608 | 28,681 | 40,049 | |||||||||||||||||||||
|
|
|
|
|
|
|
|
|
|
|
|
|
|
|
|||||||||||||||
| Income (loss) from operations |
(5,595 | ) | (1,175 | ) | (14,341 | ) | 12,894 | 12,519 | 7,477 | 8,830 | ||||||||||||||||||
| Interest income |
18 | 256 | 58 | 28 | 53 | 35 | 30 | |||||||||||||||||||||
| Interest expense |
(56 | ) | (38 | ) | (80 | ) | (69 | ) | (110 | ) | (81 | ) | (323 | ) | ||||||||||||||
|
|
|
|
|
|
|
|
|
|
|
|
|
|
|
|||||||||||||||
| Income (loss) before income taxes |
(5,633 | ) | (957 | ) | (14,363 | ) | 12,853 | 12,462 | 7,431 | 8,537 | ||||||||||||||||||
| Provision for income taxes |
8 | 9 | 2 | 346 | 2,505 | 575 | 3,313 | |||||||||||||||||||||
|
|
|
|
|
|
|
|
|
|
|
|
|
|
|
|||||||||||||||
| Net income (loss) |
$ | (5,641 | ) | $ | (966 | ) | $ | (14,365 | ) | $ | 12,507 | $ | 9,957 | $ | 6,856 | $ | 5,224 | |||||||||||
|
|
|
|
|
|
|
|
|
|
|
|
|
|
|
|||||||||||||||
| Net income (loss) attributable to common stockholders(1)(2): |
||||||||||||||||||||||||||||
| Basic |
$ | (5,641 | ) | $ | (966 | ) | $ | (14,365 | ) | $ | 280 | $ | 676 | $ | 395 | $ | (30,345 | ) | ||||||||||
|
|
|
|
|
|
|
|
|
|
|
|
|
|
|
|||||||||||||||
| Diluted |
$ | (5,641 | ) | $ | (966 | ) | $ | (14,365 | ) | $ | 821 | $ | 1,139 | $ | 635 | $ | (30,345 | ) | ||||||||||
|
|
|
|
|
|
|
|
|
|
|
|
|
|
|
|||||||||||||||
| Net income (loss) per share attributable to common stockholders(1): |
||||||||||||||||||||||||||||
| Basic |
$ | (125.40 | ) | $ | (13.15 | ) | $ | (72.01 | ) | $ | 0.67 | $ | 0.47 | $ | 0.28 | $ | (19.95 | ) | ||||||||||
|
|
|
|
|
|
|
|
|
|
|
|
|
|
|
|||||||||||||||
| Diluted |
$ | (125.40 | ) | $ | (13.15 | ) | $ | (72.01 | ) | $ | 0.64 | $ | 0.44 | $ | 0.27 | $ | (19.95 | ) | ||||||||||
|
|
|
|
|
|
|
|
|
|
|
|
|
|
|
|||||||||||||||
| Weighted-average shares used to compute net income (loss) per share attributable to common stockholders(1): |
||||||||||||||||||||||||||||
| Basic |
44,983 | 73,432 | 199,495 | 414,615 | 1,424,511 | 1,394,005 | 1,521,353 | |||||||||||||||||||||
|
|
|
|
|
|
|
|
|
|
|
|
|
|
|
|||||||||||||||
| Diluted |
44,983 | 73,432 | 199,495 | 1,288,140 | 2,569,722 | 2,378,444 | 1,521,353 | |||||||||||||||||||||
|
|
|
|
|
|
|
|
|
|
|
|
|
|
|
|||||||||||||||
| Cash dividend declared per common share |
$ | — | $ | — | $ | — | $ | — | $ | — | $ | — | $ | 2.25 | ||||||||||||||
|
|
|
|
|
|
|
|
|
|
|
|
|
|
|
|||||||||||||||
| Pro forma net income per share attributable to common stockholders (unaudited)(1): |
||||||||||||||||||||||||||||
| Basic |
$ | $ | ||||||||||||||||||||||||||
|
|
|
|
|
|||||||||||||||||||||||||
| Diluted |
$ | $ | ||||||||||||||||||||||||||
|
|
|
|
|
|||||||||||||||||||||||||
| Pro forma weighted-average shares used to compute pro forma net income per share attributable to common stockholders (unaudited)(1): |
||||||||||||||||||||||||||||
| Basic |
||||||||||||||||||||||||||||
|
|
|
|
|
|||||||||||||||||||||||||
| Diluted |
||||||||||||||||||||||||||||
|
|
|
|
|
|||||||||||||||||||||||||
| Other Financial and Operational Data: |
||||||||||||||||||||||||||||
| Active core members (end of period)(3) |
1,800 | 32,300 | 97,600 | 126,000 | 161,700 | 163,000 | 213,900 | |||||||||||||||||||||
| Adjusted EBITDA(4) |
$ | (5,295 | ) | $ | (666 | ) | $ | (13,259 | ) | $ | 14,819 | $ | 14,913 | $ | 9,270 | $ | 11,206 | |||||||||||
| (1) | See Note 13 to our consolidated financial statements for further details on the calculation of basic and diluted net income (loss) per share attributable to common stockholders and for a discussion and reconciliation of pro forma net income per share attributable to common stockholders. |
| (2) | The net income (loss) attributable to common stockholders for the nine months ended March 31, 2012 includes a $35.6 million adjustment for dividends distributed to preferred stockholders during the period. See Note 13 to our consolidated financial statements for further details regarding the adjustments applied in the calculation of basic and diluted net income (loss) per share attributable to common stockholders. |
| (3) | See “Management’s Discussion and Analysis of Financial Condition and Results of Operations—Key Business Metrics” for a discussion of active core members. |
| (4) | See “Adjusted EBITDA” below for a discussion regarding the use of adjusted EBITDA as a financial measure and for a reconciliation to net income (loss), the most directly comparable GAAP financial measure. |
-41-
Table of Contents
Stock-based compensation included in the statements of operations data above was as follows:
| Year Ended June 30, | Nine Months Ended March 31, |
|||||||||||||||||||||||||||
| 2007 | 2008 | 2009 | 2010 | 2011 | 2011 | 2012 | ||||||||||||||||||||||
| (in thousands) |
||||||||||||||||||||||||||||
| Service center |
$ | 2 | $ | 3 | $ | 3 | $ | 5 | $ | 26 | $ | 19 | $ | 172 | ||||||||||||||
| Sales and marketing |
3 | 17 | 19 | 29 | 52 | 34 | 364 | |||||||||||||||||||||
| Technology |
2 | 5 | 6 | 8 | 30 | 23 | 165 | |||||||||||||||||||||
| General and administrative |
2 | 28 | 41 | 52 | 142 | 81 | 291 | |||||||||||||||||||||
|
|
|
|
|
|
|
|
|
|
|
|
|
|
|
|||||||||||||||
| Total stock-based compensation |
$ | 9 | $ | 53 | $ | 69 | $ | 94 | $ | 250 | $ | 157 | $ | 992 | ||||||||||||||
|
|
|
|
|
|
|
|
|
|
|
|
|
|
|
|||||||||||||||
| As of June 30, | As of March 31, 2012 |
|||||||||||||||||||||||
| 2007 | 2008 | 2009 | 2010 | 2011 | ||||||||||||||||||||
| (in thousands) | ||||||||||||||||||||||||
| Consolidated Balance Sheet Data: |
||||||||||||||||||||||||
| Cash and cash equivalents and short-term investments |
$ | 58 | $ | 11,766 | $ | 9,833 | $ | 20,612 | $ | 38,770 | $ | 13,261 | ||||||||||||
| Working capital (deficit) |
(2,658 | ) | 9,553 | (6,181 | ) | 6,531 | 17,528 | (8,994 | ) | |||||||||||||||
| Total assets |
934 | 13,942 | 14,082 | 25,527 | 44,496 | 21,492 | ||||||||||||||||||
| Total indebtedness |
2,000 | 1,034 | 1,376 | 1,189 | 507 | 10,168 | ||||||||||||||||||
| Convertible preferred stock |
— | 22,539 | 22,539 | 22,539 | 22,539 | 22,539 | ||||||||||||||||||
| Total stockholders’ deficit |
(2,016 | ) | (11,682 | ) | (25,925 | ) | (12,869 | ) | (2,538 | ) | (35,322 | ) | ||||||||||||
Adjusted EBITDA
To provide investors with additional information regarding our financial results, we have disclosed in the table above and within this prospectus adjusted EBITDA, a non-GAAP financial measure. We have provided a reconciliation below of adjusted EBITDA to net income (loss), the most directly comparable GAAP financial measure.
We have included adjusted EBITDA in this prospectus because it is a key measure used by our management and board of directors to understand and evaluate our core operating performance and trends, to prepare and approve our annual budget and to develop short- and long-term operational plans. In particular, the exclusion of certain expenses in calculating adjusted EBITDA can provide a useful measure for period-to-period comparisons of our core business. Accordingly, we believe that adjusted EBITDA provides useful information to investors and others in understanding and evaluating our results of operations in the same manner as our management and board of directors.
Our use of adjusted EBITDA has limitations as an analytical tool, and you should not consider it in isolation or as a substitute for analysis of our results as reported under GAAP. Some of these limitations are:
| • | although depreciation and amortization are non-cash charges, the assets being depreciated and amortized may have to be replaced in the future, and adjusted EBITDA does not reflect capital expenditure requirements for such replacements or for new capital expenditures; |
| • | adjusted EBITDA does not reflect changes in, or cash requirements for, our working capital needs; |
| • | adjusted EBITDA does not consider the potentially dilutive impact of equity-based compensation; |
| • | adjusted EBITDA does not reflect tax payments that may represent a reduction in cash available to us; and |
| • | other companies, including companies in our industry, may calculate adjusted EBITDA differently, which reduces its usefulness as a comparative measure. |
-42-
Table of Contents
Because of these limitations, you should consider adjusted EBITDA alongside other financial performance measures, including various cash flow metrics, net income (loss) and our other GAAP results. The following table presents a reconciliation of adjusted EBITDA to net income (loss) for each of the periods indicated:
| Year Ended June 30, | Nine Months Ended March 31, |
|||||||||||||||||||||||||||
| 2007 | 2008 | 2009 | 2010 | 2011 | 2011 | 2012 | ||||||||||||||||||||||
| (in thousands) |
||||||||||||||||||||||||||||
| Reconciliation of Adjusted EBITDA: |
||||||||||||||||||||||||||||
| Net income (loss) |
$ | (5,641 | ) | $ | (966 | ) | $ | (14,365 | ) | $ | 12,507 | $ | 9,957 | $ | 6,856 | $ | 5,224 | |||||||||||
| Adjustments: |
||||||||||||||||||||||||||||
| Depreciation and amortization |
291 | 456 | 1,013 | 1,831 | 2,144 | 1,636 | 1,384 | |||||||||||||||||||||
| Provision for income taxes |
8 | 9 | 2 | 346 | 2,505 | 575 | 3,313 | |||||||||||||||||||||
| Stock-based compensation |
9 | 53 | 69 | 94 | 250 | 157 | 992 | |||||||||||||||||||||
| Interest income |
(18 | ) | (256 | ) | (58 | ) | (28 | ) | (53 | ) | (35 | ) | (30 | ) | ||||||||||||||
| Interest expense |
56 | 38 | 80 | 69 | 110 | 81 | 323 | |||||||||||||||||||||
|
|
|
|
|
|
|
|
|
|
|
|
|
|
|
|||||||||||||||
| Adjusted EBITDA |
$ | (5,295 | ) | $ | (666 | ) | $ | (13,259 | ) | $ | 14,819 | $ | 14,913 | $ | 9,270 | $ | 11,206 | |||||||||||
|
|
|
|
|
|
|
|
|
|
|
|
|
|
|
|||||||||||||||
-43-
Table of Contents
MANAGEMENT’S DISCUSSION AND ANALYSIS OF
FINANCIAL CONDITION AND RESULTS OF OPERATIONS
The following discussion and analysis of our financial condition and results of operations should be read in conjunction with our consolidated financial statements and related notes included elsewhere in this prospectus. This discussion contains forward-looking statements that involve risks and uncertainties. Our actual results could differ materially from those discussed below. Factors that could cause or contribute to such differences include, but are not limited to, those identified below and those discussed in “Risk Factors” included elsewhere in this prospectus. Our fiscal year end is June 30 and our fiscal quarters end on September 30, December 31, March 31 and June 30. Our fiscal years ended June 30, 2009, 2010 and 2011 are referred to as fiscal 2009, fiscal 2010 and fiscal 2011, respectively.
Overview
Extend Health is a leading provider of health benefit management services and operates the largest private Medicare exchange in the United States. As a technology leader in the health insurance industry, we are redefining the manner in which health benefits are offered and delivered. Our solutions create cost savings for our employer clients and provide our individual customers with improved choice and control over their health benefits. Our core solution, ExtendRetiree, enables our employer clients to transition their retirees to individual, defined contribution health plans that provide individuals with a tax-free allowance or “contribution” to spend on their healthcare at an annual cost that the employer controls versus group-based, defined benefit health plans that provide groups of individuals with defined healthcare benefits such as doctor visits, hospitalization and prescription drugs at an uncertain annual cost. ExtendRetiree allows our clients to provide their post-65 retirees with the same or better healthcare benefits at a lower cost to our clients. To date, we have provided an effective alternative to traditional group Medicare health plans for over 150 private and public sector clients, including over 30 Fortune 500 companies such as Caterpillar, General Motors, Honeywell and Whirlpool, and we have helped hundreds of thousands of retirees and their dependents navigate to, evaluate and choose a health plan using our proprietary exchange platform and decision support tools. In addition, we are developing and expanding our solutions to address the pre-65 retiree, or early retiree, and active employee exchange opportunities for our existing and prospective clients.
Substantially all of our revenue is generated from commissions paid to us by insurance carriers for health insurance policies issued through our enrollment services. We refer to an application that has been received from a customer and transmitted to an insurance carrier as an enrollment, or a submitted application. Under our contracts with insurance carriers, once an application has been accepted by an insurance carrier and a policy issued, we are generally entitled to receive commissions for five or more years from the policy effective date, provided that the policy is not cancelled during that time period. As a result, the majority of our revenue is recurring in nature and grows in direct proportion to the number of new policies that we add each year. The majority of our revenue is derived from Medicare-related policies, or core policies, including Medicare supplement and Medicare Advantage policies, and we refer to a customer who is enrolled in a core policy as a core member. We also receive commissions for Medicare Part D prescription drug policies, which typically accompany Medicare supplement policies, as well as for enrollments in ancillary health insurance products such as dental and vision plans.
We have experienced significant revenue growth over the past three years, recognizing revenue of $17.7 million, $44.0 million and $51.1 million in fiscal 2009, 2010 and 2011, respectively. Our substantial revenue growth from fiscal 2009 to fiscal 2010 was driven by the successful transition of a group of General Motors’ retirees in fiscal 2009, resulting in a 202% year-over-year increase in active core members.
To date, we have primarily utilized our direct sales channel to acquire new customers through contractual relationships we establish with employers that provide us with access to large pools of retirees. Starting in fiscal 2011, we formally launched an additional sales channel focused on partnerships with national and regional benefits consultants and brokers. These partners co-market and, in certain circumstances, jointly promote our services to potential employer clients, for which we pay a fee. We anticipate that this channel will accelerate our enrollment growth and contribute a significantly larger proportion of our total enrollments in future years.
-44-
Table of Contents
Our business of marketing Medicare plans is subject to seasonal fluctuations. The benefits enrollment period for a majority of private employers occurs during October through December of each year for a January 1 effective date, and this period also coincides with the timing of the annual enrollment period, or AEP, when Medicare-eligible individuals can make changes to their Medicare Advantage or Medicare Part D prescription drug coverage for the following year. As a result, the majority of our new enrollment activity has historically occurred during the three months ended December 31, with 87% and 75% of our new enrollments in fiscal 2010 and 2011 occurring during these periods, respectively.
To accommodate the higher enrollment volumes during the AEP, we hire additional seasonal benefit advisors to supplement our full-time benefit advisor workforce. The compensation costs associated with our benefit advisors are expensed as incurred, which results in the majority of the AEP-related enrollment costs being recognized during our second fiscal quarter ended December 31. However, we do not begin recognizing the associated commission revenue until our third fiscal quarter ended March 31 when the underlying policies become effective. As our business matures, other seasonality trends may develop and the existing seasonality and consumer behavior that we experience may change. In particular, public sector employers are generally more inclined to opt for transition periods outside of the AEP, or an off-cycle period, as their benefits effective date typically coincides with the beginning of their fiscal year, which is often not January 1. As we continue to expand our penetration into the public sector, we expect to see more of our enrollment volumes distributed throughout the year, which will lessen the impact of seasonality on our results of operations.
We have achieved significant growth over the past three years by serving the needs of our core market, which we define as post-65 retirees who are currently covered by employer-sponsored insurance. We believe that there is significant room for growth in our core market as we estimate that there are 12 million Medicare-eligible retirees with employer-sponsored health insurance in the public and private sectors. While our core market has historically consisted of private sector employers, we see significant opportunity in the public sector as states, municipalities and other government sector employers face severe economic pressures and are therefore seeking alternative cost-saving measures. We believe we are well positioned to capture additional market share in this segment with our experience managing the insurance transition process and our thought leadership in this innovative area of health benefits management.
We were incorporated in April 2002 as a Delaware limited liability company, and in July 2007, we became Extend Health, Inc., a Delaware corporation. Since the fourth quarter of fiscal 2009, we have funded our operations primarily with cash flows from operations and, to a lesser extent, working capital and financing arrangements.
Opportunities, Challenges and Risks
We believe that the growth of our business and our future success are dependent upon many factors. While each of these factors presents significant opportunities for us, they also pose important challenges and risks that we must successfully address in order to sustain the growth of our business and improve our results of operations.
Increase enrollments through investments in sales and marketing. In order to acquire new employer clients and capitalize on the growth of the retail Medicare market, we will need to grow our sales and marketing teams, rely more heavily on partners to source new business, and significantly increase our investment in direct consumer marketing campaigns. We believe there is substantial opportunity to increase our market share through these channels. However, the majority of the investments that we make in our sales and marketing efforts will occur well in advance of the realization of financial benefits from such investments, such that it may be difficult for us to determine if we are efficiently allocating our resources in this area. Therefore, the investments that we intend to make to strengthen our sales and marketing efforts may not result in an increase in revenue, which would negatively impact our results of operations.
-45-
Table of Contents
Maintain and expand our strong insurance carrier partner relationships. Our growth is dependent, in part, on our ability to offer a large selection of health plans in order to attract and retain new members. We have partnered with over 75 insurance carriers to provide a robust and competitive plan offering. While we have relationships with a large number of insurance carriers, the majority of our revenue is derived from the commissions we receive from a small number of carriers as a result of continuing consolidation in the healthcare industry and the presence of dominant national carriers. For example, in fiscal 2011, our top two insurance carriers, Mutual of Omaha and UnitedHealthcare, accounted for an aggregate of 58% of our commission revenue.
The commissions we receive from insurance carriers can vary widely, and therefore, the relative concentration of enrollments across our carriers can have a significant impact on our commission revenue in any given period. For example, in August 2011, one of our largest carrier partners discontinued the distribution of Medicare supplement policies through all of their indirect distribution vendors. As a result, since August 2011, new Medicare supplement enrollments have shifted to other insurance carriers that pay us lower commission rates on average. Compared to historical weighted-average commission rates, we estimate that future weighted-average commission rates for new Medicare supplement enrollments will decline by 20% to 25% as a result of this change in carrier mix. While this change in carrier mix will likely result in lower commissions on new enrollments in Medicare supplement policies on a prospective basis, our future commission revenue will also be impacted by a number of other factors, including ongoing shifts in carrier and product mix, geographic distribution of our customers and premiums that these insurance carriers charge customers for their policies.
Compete effectively. We operate in an intensely competitive market. We have a number of competitors, some of which have numerous advantages, including greater financial resources, broader offerings, stronger relationships with employers and greater name recognition within the health insurance industry, which may put us at a competitive disadvantage. Despite these advantages, we believe that we have historically competed favorably against our larger competitors due to our extensive experience transitioning retirees of large employers from group to individual health plans and the competitive advantage that our proprietary technology provides.
Develop innovative solutions in response to healthcare reform. The health insurance industry is evolving rapidly in response to regulatory reform. We believe there will be substantial opportunities to capitalize on these changes by continuing our thought leadership in this arena and developing next-generation solutions for healthcare management. In March 2010, the Federal government enacted significant reforms to healthcare legislation through the Patient Protection and Affordable Care Act and the Healthcare and Education Reconciliation Act of 2010, which we refer to collectively as Healthcare Reform. While we believe we are well-positioned to take advantage of these evolving industry dynamics, if we cannot expand our solutions in response to Healthcare Reform, we may not be able to take advantage of the significant market opportunity that we believe Healthcare Reform presents.
-46-
Table of Contents
Key Business Metrics
In addition to traditional financial metrics, we rely upon the following key business metrics to evaluate our business performance, develop financial forecasts and facilitate long-term strategic planning:
| As of June 30, | As of March 31, | |||||||||||||||||||
| 2009 | 2010 | 2011 | 2011 | 2012 | ||||||||||||||||
| Active core members |
97,600 | 126,000 | 161,700 | 163,000 | 213,900 | |||||||||||||||
| Pending core members |
800 | 2,000 | 10,500 | 1,500 | 7,900 | |||||||||||||||
| Year Ended June 30, | Nine Months Ended March 31, |
|||||||||||||||||||
| 2009 | 2010 | 2011 | 2011 | 2012 | ||||||||||||||||
| Core applications submitted |
73,600 | 50,000 | 60,700 | 49,800 | 61,800 | |||||||||||||||
| Sales channel mix |
||||||||||||||||||||
| Direct |
100 | % | 98 | % | 70 | % | 81 | % | 47 | % | ||||||||||
| Partner |
— | 2 | % | 28 | % | 17 | % | 51 | % | |||||||||||
| Retail |
— | — | 2 | % | 2 | % | 2 | % | ||||||||||||
| Adjusted EBITDA(1) (in thousands) |
$ | (13,259 | ) | $ | 14,819 | $ | 14,913 | $ | 9,270 | $ | 11,206 | |||||||||
| (1) | See “Selected Consolidated Financial Data—Adjusted EBITDA” above for a discussion regarding the use of adjusted EBITDA as a financial measure and for a reconciliation to net income (loss), the most directly comparable GAAP financial measure. |
Core Members. We define a core member as a customer who is enrolled in a Medicare Advantage or Medicare supplement policy. A core member is considered to be active when their policy has been confirmed by an insurance carrier and has reached its policy effective date, at which point we are entitled to receive commissions. A member is considered to be pending when their policy has not yet been confirmed by an insurance carrier or has not yet reached its policy effective date. Not all pending members will become active, as the individual enrollee may subsequently elect to enroll in an alternative plan or the carrier may decline the pending member’s application. However, based on our historical experience over the past three fiscal years, we expect more than 95% of pending members to convert to active members. The number of core members grows each period by the number of new core policies that we add each year, net of policy cancellations, and is an important indicator of our expected revenue, as we generally receive a recurring commission for five or more years from the policy effective date, provided that the policy is not cancelled.
Core Applications Submitted. A core application submitted refers to a completed enrollment for a new Medicare Advantage or Medicare supplement policy that has been transmitted to an insurance carrier. Typically, an application is processed in the quarter preceding the quarter in which the policy becomes effective. For example, applications processed during the annual enrollment period for policies with a January 1 effective date will be reported as core applications submitted during the quarter ended December 31 and as pending core members as of December 31, but will be reflected in the number of active core members as of January 1, when the policy becomes effective.
The number of core applications submitted correlates closely with our enrollment-related costs, as we adjust our staffing levels to meet demand and pay sales incentives and other expenses related to the enrollment activity. Measuring our core applications submitted enables us to estimate our core member growth, evaluate the effectiveness of our enrollment operations and more accurately forecast our expenses.
Sales Channel Mix. Sales channel mix represents the percentage of core applications submitted that were sourced through our direct, partner or retail channels. To date, the vast majority of our enrollments have been for individuals sourced through employer clients that we acquired directly through the efforts of our internal field sales organization. In 2011, we began utilizing our network of partners to identify, engage and acquire new employer clients, and we expect this partner channel to grow significantly in the future as a percentage of core applications submitted. Our retail strategy is focused on acquiring customers through investment in direct marketing, paid search, other consumer-targeted marketing programs and our channel partners.
-47-
Table of Contents
Sales channel mix will be an important metric as the cost to acquire new customers varies significantly by channel. For enrollments sourced through the partner channel, we pay a fee that can be as much as 25% of the commission revenue we receive for those enrollments. Additionally, consumer marketing campaigns related to our retail channel require a larger upfront investment than our employer-focused sales efforts. As we source more of our enrollments through the partner and retail channels, our cost to acquire customers will increase, which will result in lower operating margins.
Adjusted EBITDA. We define this metric as net income (loss) less interest income, plus depreciation and amortization, interest expense, provision for income taxes and stock-based compensation expense. We have included adjusted EBITDA in this prospectus because it is a key measure used by our management and board of directors to understand and evaluate our core operating performance and trends, to prepare and approve our annual budget and to develop short- and long-term operational plans. In particular, the exclusion of certain expenses in calculating adjusted EBITDA can provide a useful measure for period-to-period comparisons of our core business.
Key Components of Our Results of Operations
Revenue
We generate most of our revenue from commissions paid to us by insurance carriers for health insurance policies issued as a direct result of our enrollment services. Commission revenue from Medicare-related policies, including Medicare supplement, Medicare Advantage, and Medicare Part D prescription drug policies represented substantially all of our revenue for the periods presented.
Commission rates and the length of the commission period typically vary by policy type. Commissions on Medicare supplement policies may be based upon a percentage of premium or a fixed rate and are paid either monthly as the underlying premium is received by the insurance carrier or in advance for the first year and monthly thereafter for renewal payments, with the commission rates generally more uniform throughout the commissionable period. The majority of our Medicare supplement compensation arrangements provide for commissions over a six to ten year period provided the policy remains active during that time period. We estimate the life of a Medicare supplement policy typically ranges from six to eight years. As of March 31, 2012, 70% of our active core members were enrolled in a Medicare supplement policy.
Compensation structures for Medicare Advantage and Medicare Part D prescription drug policies are subject to Federal regulations that stipulate a six year commission cycle, with the first year payment generally higher than the following five annual renewal payments. Commissions on these products are calculated on a fixed rate basis and are often paid in advance for the first year, and then monthly thereafter for the renewal payments, as long as the policy remains active. We estimate the life of a Medicare Advantage policy typically ranges from three to five years, based on recent historical trends. As of March 31, 2012, 30% of our active core members were enrolled in a Medicare Advantage policy.
Commission revenue is impacted by the rates we are paid by insurance carriers, which vary by carrier, policy type, state, policy effective date, policy age and the weighting of enrollment activity across insurance carriers and policy types. Commissions on some of our products are subject to regulatory oversight and may be periodically adjusted in response to changes in regulatory guidelines. Under our carrier compensation arrangements, the commission rate schedule that is in effect on the policy effective date will typically govern the commissions over the life of the policy. As a result, subsequent changes in carrier contract terms generally do not impact commission rates for previously enrolled policies as we will continue to be paid commissions at the rates in effect on the policy effective date. Therefore, the effects of any changes in carrier commission rates are phased in over future periods as new policies are subject to the revised commission terms.
Because we typically receive commissions over the life of a policy that generally range from three to eight years, the majority of our revenue is recurring in nature and increases in direct proportion to the growth we experience in the number of active core members. As a result, at the beginning of a financial reporting period, we
-48-
Table of Contents
have strong visibility into a substantial majority of our revenue for that period, as a significant portion is attributable to members who were enrolled prior to that period. For instance, in fiscal 2011, revenue attributable to policies that were active as of July 1, 2010, the beginning of the fiscal year, represented 78% of our total commission revenue during that fiscal year.
As an indication of our estimated future recurring revenue, we report Projected Annual Recurring Revenue, or PARR, which reflects the expected total commission revenue for the subsequent 12 months from all members that are active or pending as of the reporting date. We report PARR as a range as it represents an estimate of our future recurring revenue based on certain member retention assumptions. We believe that PARR is a useful measure of our revenue baseline and a reflection of our revenue visibility at a particular point in time, as it represents the amounts that are expected to be recognized in the ensuing 12 month period assuming no new enrollment activity. The PARR metric includes expected commission revenue on all Medicare-related and ancillary policies and is based upon actual contractual commission rates in effect during the forecasted period as well as assumptions regarding future member retention. Our estimates for future member retention are based on our historical experience regarding the extent and timing of policy attrition along with any known future trends that may be expected to occur during the forecasted period.
We also generate revenue from third-party administrator services, or TPA services, provided to clients for the processing of employee health reimbursement claims. We receive a monthly processing fee for the TPA services, which is recognized in the month the services are rendered. For a majority of the TPA services provided, we utilize outside service providers to process the health reimbursement claims, for which we pay a fee. Through December 31, 2011 the TPA services revenue has been presented in the other revenue line of our consolidated statements of operations, net of costs incurred for the outside service providers. Starting with January 1, 2012 client transitions, we are increasingly offering discounts on the fees that we charge for our TPA services. In the substantial majority of cases, we receive fees from new clients that are equal to or less than the fees we pay to the outside service providers we utilize to provide these TPA services, and in many cases the fees are waived entirely, resulting in a net expense. As these fee discounts represent a selling cost to acquire new clients, the net expense for the TPA services incurred for new client contracts after December 31, 2011 are presented in operating expenses within the sales and marketing line item on our consolidated statements of operations. The TPA net revenue related to existing client contracts that were negotiated prior to this change in sales strategy will continue to be included in other revenue and is therefore expected to diminish over time as these existing contracts begin to expire.
Operating Expenses
Operating expenses consist of service center, sales and marketing, technology and general and administrative expenses. Personnel costs, which consist of salaries, bonuses, commissions, payroll taxes, benefits and stock-based compensation, are the most significant component of each of these expense categories. We expect our operating expenses to continue to grow in the near term as we increase our enrollments, as much of our service center and, to a lesser extent, sales and marketing costs vary in direct proportion to our enrollment activity.
Service Center
Service center expenses consist primarily of compensation and related expenses for personnel associated with our enrollment and customer service operations and include the commissions paid to our benefit advisors. During our peak demand season in our second fiscal quarter, we hire additional seasonal personnel to service the increased enrollment volumes. As a result, our enrollment operations staffing levels vary widely throughout the year and, over the course of fiscal 2011, ranged from 65 to 500 employees. Significant numbers of these seasonal personnel return year after year resulting in efficiency and productivity gains and higher customer satisfaction. We expect service center expenses to increase in future periods as a result of additional personnel and expenditures necessary to meet the increased enrollment activity.
Sales and Marketing
Our sales and marketing expenses primarily consist of personnel costs, sales commissions, fees paid to partners, marketing campaign expenditures, net expense for TPA services for client contracts effective on or after January 2012, and travel costs associated with acquiring new employer clients.
-49-
Table of Contents
We pay fees to a number of our partners in order to facilitate the identification and introduction of potential new employer clients. Under these arrangements, the partner receives a payment for each customer enrollment that is generated from a referred account, either via a flat fee per enrollment or as a percentage of the commission revenue we earn on the active policy. The fees that are paid on a flat fee basis are expensed in the same quarter in which the application is submitted while the fees that are based on a percentage of revenue are expensed as the underlying commission revenue is recognized. As a result, partner fees in a quarter may include expenses associated with members that were enrolled in a prior period. While, historically, the majority of our partner fees have been based on a flat fee arrangement and have been fully expensed in the same quarter that the application was submitted, in the past year, we have shifted toward revenue-share based arrangements for our significant partners. Therefore, we expect partner fees to increase over time as more active policies are subject to ongoing revenue-share based arrangements. Additionally, we expect partner fees to fluctuate on a quarterly basis depending upon the mix of partner arrangements in any given quarter.
We also incur costs to generate individual customer leads through our retail sales channel. We plan to continue investing in sales and marketing to expand and grow our business and expect partner fees and costs related to direct marketing, paid search and other consumer-targeted marketing programs, in particular, to increase as we source more of our employer clients through the partner channel and expand our marketing activities to reach the individual retail market. As described in the discussion of TPA services in “Revenue” above, the expected net TPA expense will also contribute to an increase in sales and marketing expenses in future periods.
Technology
Technology expenses consist primarily of compensation and related expenses for personnel associated with developing and maintaining our exchange platform and tools and management of our information systems. Some qualifying compensation costs associated with the direct development of software used to provide our services are capitalized as an internal-use software cost. We expect technology expenses to increase in future periods as we employ more resources to support and maintain our exchange platform and infrastructure. This increase may be partially offset to the extent that we capitalize internally developed software costs as we continue to develop additional functionality related to the delivery of our services.
General and Administrative
Our general and administrative expenses primarily consist of personnel costs, recruiting and hiring costs, and expenses for outside professional services, including legal, audit and tax services. Following the completion of this offering, we expect general and administrative expenses to increase due to the anticipated growth of our business and infrastructure and the costs associated with becoming a public company, such as costs associated with SEC reporting and compliance, developing and maintaining internal controls over financial reporting, insurance, investor relations and other related costs.
Interest Income
Interest income consists of interest income earned on our cash and cash equivalents and short-term investments. We expect interest income will vary between each reporting period depending on our average cash, cash equivalents and short-term investment balances during the period and market interest rates.
Interest Expense
Interest expense consists of interest accrued or paid on our outstanding equipment loan, term loan, line of credit and capital lease obligations. We expect interest expense to increase in fiscal 2012 as a result of the $10.0 million in term loans advanced during the nine months ended March 31, 2012.
Provision for Income Taxes
Provision for income taxes consists of Federal and state income tax expenses. In fiscal 2011, we determined that it was more likely than not that we would be able to utilize our remaining net deferred tax assets
-50-
Table of Contents
and released the valuation allowance that had been recorded against them. Because we utilized all remaining net operating loss carryforwards during fiscal 2011, we expect our fiscal 2012 and future tax rates to more closely reflect the Federal and state statutory rates.
Results of Operations
The following table is a summary of our consolidated statements of operations as a percentage of our total revenue.
| Percentage of Total Revenue | ||||||||||||||||||||
| Year Ended June 30, | Nine Months Ended March 31, |
|||||||||||||||||||
| 2009 | 2010 | 2011 | 2011 | 2012 | ||||||||||||||||
| Revenue: |
||||||||||||||||||||
| Commissions |
96 | % | 99 | % | 99 | % | 99 | % | 99 | % | ||||||||||
| Other |
4 | 1 | 1 | 1 | 1 | |||||||||||||||
|
|
|
|
|
|
|
|
|
|
|
|||||||||||
| Total revenue |
100 | 100 | 100 | 100 | 100 | |||||||||||||||
|
|
|
|
|
|
|
|
|
|
|
|||||||||||
| Operating expenses: |
||||||||||||||||||||
| Service center |
102 | 34 | 37 | 41 | 41 | |||||||||||||||
| Sales and marketing |
38 | 17 | 20 | 18 | 22 | |||||||||||||||
| Technology |
12 | 7 | 6 | 6 | 7 | |||||||||||||||
| General and administrative |
29 | 12 | 13 | 14 | 12 | |||||||||||||||
| Restructuring expense |
— | 1 | — | — | — | |||||||||||||||
|
|
|
|
|
|
|
|
|
|
|
|||||||||||
| Total operating expenses |
181 | 71 | 76 | 79 | 82 | |||||||||||||||
|
|
|
|
|
|
|
|
|
|
|
|||||||||||
| Income (loss) from operations |
(81 | ) | 29 | 24 | 21 | 18 | ||||||||||||||
| Interest income |
— | — | — | — | — | |||||||||||||||
| Interest expense |
— | — | — | — | (1 | ) | ||||||||||||||
|
|
|
|
|
|
|
|
|
|
|
|||||||||||
| Income (loss) before income taxes |
(81 | ) | 29 | 24 | 21 | 17 | ||||||||||||||
| Provision for income taxes |
— | 1 | 5 | 2 | 7 | |||||||||||||||
|
|
|
|
|
|
|
|
|
|
|
|||||||||||
| Net income (loss) |
(81 | )% | 28 | % | 19 | % | 19 | % | 11 | % | ||||||||||
|
|
|
|
|
|
|
|
|
|
|
|||||||||||
Comparison of Nine Months Ended March 31, 2011 and 2012
The following table presents our historical results of operations and the changes in these results in dollars and as a percentage for the periods presented:
| Nine Months Ended March 31, |
Change ($) | Change (%) | ||||||||||||||
| 2011 | 2012 | |||||||||||||||
| (in thousands, except percentages) |
||||||||||||||||
| Revenue: |
||||||||||||||||
| Commissions |
$ | 35,716 | $ | 48,411 | $ | 12,695 | 36 | % | ||||||||
| Other |
442 | 468 | 26 | 6 | ||||||||||||
|
|
|
|
|
|
|
|
|
|||||||||
| Total revenue |
36,158 | 48,879 | 12,721 | 35 | ||||||||||||
| Operating expenses: |
||||||||||||||||
| Service center |
15,050 | 19,955 | 4,905 | 33 | ||||||||||||
| Sales and marketing |
6,346 | 10,856 | 4,510 | 71 | ||||||||||||
| Technology |
2,242 | 3,264 | 1,022 | 46 | ||||||||||||
| General and administrative |
5,043 | 5,974 | 931 | 18 | ||||||||||||
|
|
|
|
|
|
|
|
|
|||||||||
| Total operating expenses |
28,681 | 40,049 | 11,368 | 40 | ||||||||||||
|
|
|
|
|
|
|
|
|
|||||||||
| Income from operations |
7,477 | 8,830 | 1,353 | 18 | ||||||||||||
| Interest income |
35 | 30 | (5 | ) | (14 | ) | ||||||||||
| Interest expense |
(81 | ) | (323 | ) | (242 | ) | 299 | |||||||||
|
|
|
|
|
|
|
|
|
|||||||||
| Income before income taxes |
7,431 | 8,537 | 1,106 | 15 | ||||||||||||
| Provision for income taxes |
575 | 3,313 | 2,738 | 476 | ||||||||||||
|
|
|
|
|
|
|
|
|
|||||||||
| Net income |
$ | 6,856 | $ | 5,224 | $ | (1,632 | ) | (24 | )% | |||||||
|
|
|
|
|
|
|
|
|
|||||||||
-51-
Table of Contents
Commission Revenue
Commission revenue for the nine months ended March 31, 2012 was $48.4 million, an increase of $12.7 million, or 36%, compared to the nine months ended March 31, 2011. This revenue growth was primarily due to a 31% increase in the number of active core members from 163,000 active core members at March 31, 2011 to 213,900 active core members at March 31, 2012. Our projected annual recurring revenue, or PARR, at March 31, 2012 was $61.4 million to $64.0 million compared to $50.8 million to $53.0 million at March 31, 2011. Based on the midpoint of the two ranges, our PARR at March 31, 2012 increased by $10.8 million, or 21%, over the prior year period.
Service Center
Service center expenses for the nine months ended March 31, 2012 were $20.0 million, an increase of $4.9 million, or 33%, compared to the nine months ended March 31, 2011. During the nine months ended March 31, 2012, average headcount increased 25% from the prior year period as we accelerated our hiring of seasonal personnel for the Medicare annual enrollment period in response to regulatory changes in the timing of the AEP and increased client services resources to support new clients. Additionally, during the nine months ended March 31, 2012, we expanded our enrollment operations with the opening of a second service center located in Texas, resulting in $0.7 million in additional expense related to facilities costs and the management and overhead needed to operate a second service center.
Sales and Marketing
Sales and marketing expenses for the nine months ended March 31, 2012 were $10.9 million, an increase of $4.5 million, or 71%, compared to the nine months ended March 31, 2011. This increase was due, in part, to a $2.6 million increase in compensation and employee-related expenses, as we expanded our direct salesforce and added marketing personnel, resulting in a 83% increase in average headcount year over year. Additionally, marketing expenses increased $1.9 million as a result of increased referral fees, advertising and lead generation activities.
Technology
Technology expenses for the nine months ended March 31, 2012 were $3.3 million, an increase of $1.0 million, or 46%, compared to the nine months ended March 31, 2011. This increase was primarily due to a $0.9 million increase in compensation expenses as average headcount grew by 37% to support the continued development of our exchange platform and tools.
General and Administrative
General and administrative expenses for the nine months ended March 31, 2012 were $6.0 million, an increase of $0.9 million, or 18%, compared to the nine months ended March 31, 2011. This increase was primarily driven by an increase in legal and accounting expenses associated with a dividend distribution and related option adjustments, the expansion and renewal of our debt facility, and increased tax reporting and analysis requirements. See “Dividend-Related Option Adjustments” later in this section for further discussion regarding the dividend distribution.
Provision for Income Taxes
Provision for income taxes was $3.3 million for the nine months ended March 31, 2012, an increase of $2.7 million as compared to income taxes of $0.6 million for the nine months ended March 31, 2011. During the nine months ended March 31, 2011, we determined that it was more likely than not that we would be able to utilize our remaining net deferred tax assets and released the valuation allowance that had been recorded against them, resulting in a net tax expense of $0.6 million. Because we released the valuation allowance and utilized all remaining net operating loss carryforwards during fiscal 2011, we expect our fiscal 2012 tax rate to more closely reflect the Federal and state statutory rates.
-52-
Table of Contents
Comparison of Fiscal 2010 and 2011
The following table presents our historical results of operations and the changes in these results in dollars and as a percentage for the periods presented:
| Year Ended June 30, | Change ($) | Change (%) | ||||||||||||||
| 2010 | 2011 | |||||||||||||||
| (in thousands, except percentages) | ||||||||||||||||
| Revenue: |
||||||||||||||||
| Commissions |
$ | 43,646 | $ | 50,451 | $ | 6,805 | 16 | % | ||||||||
| Other |
370 | 676 | 306 | 83 | ||||||||||||
|
|
|
|
|
|
|
|
|
|||||||||
| Total revenue |
44,016 | 51,127 | 7,111 | 16 | ||||||||||||
|
|
|
|
|
|
|
|
|
|||||||||
| Operating expenses: |
||||||||||||||||
| Service center |
14,994 | 18,551 | 3,557 | 24 | ||||||||||||
| Sales and marketing |
7,290 | 10,134 | 2,844 | 39 | ||||||||||||
| Technology |
3,060 | 3,195 | 135 | 4 | ||||||||||||
| General and administrative |
5,464 | 6,728 | 1,264 | 23 | ||||||||||||
| Restructuring expense |
314 | — | (314 | ) | * | |||||||||||
|
|
|
|
|
|
|
|
|
|||||||||
| Total operating expenses |
31,122 | 38,608 | 7,486 | 24 | ||||||||||||
|
|
|
|
|
|
|
|
|
|||||||||
| Income from operations |
12,894 | 12,519 | (375 | ) | (3 | ) | ||||||||||
| Interest income |
28 | 53 | 25 | 89 | ||||||||||||
| Interest expense |
(69 | ) | (110 | ) | (41 | ) | (59 | ) | ||||||||
|
|
|
|
|
|
|
|
|
|||||||||
| Income before income taxes |
12,853 | 12,462 | (391 | ) | (3 | ) | ||||||||||
| Provision for income taxes |
346 | 2,505 | 2,159 | 624 | ||||||||||||
|
|
|
|
|
|
|
|
|
|||||||||
| Net income |
$ | 12,507 | $ | 9,957 | $ | (2,550 | ) | (20 | )% | |||||||
|
|
|
|
|
|
|
|
|
|||||||||
| * | Not meaningful |
Commission Revenue
Commission revenue for fiscal 2011 was $50.5 million, an increase of $6.8 million, or 16%, compared to fiscal 2010. This revenue growth was due in part to a 28% increase in the number of active core members from 126,000 active core members at the end of fiscal 2010 to 161,700 active core members at the end of fiscal 2011. The commission revenue growth rate was lower than the membership growth rate primarily due to the fact that fiscal 2010 revenue included a full year of revenue attributable to the members that were added in fiscal 2009 in connection with the General Motors transition, which contributed to a 202% increase in active core members in fiscal 2009. In fiscal 2010, active core members grew by 29% resulting in a lower full year contribution to fiscal 2011 revenue relative to the significant membership increase in fiscal 2009. Our PARR at June 30, 2011 was $52.3 million to $54.5 million compared to $37.8 million to $39.3 million at June 30, 2010. Based on the midpoint of the two ranges, our PARR at June 30, 2011 increased by $14.8 million, or 38%, over the prior year period.
Other Revenue
Other revenue for fiscal 2011 was $0.7 million, an increase of $0.3 million, or 83%, as compared to fiscal 2010. This increase was primarily driven by a 106% increase in the number of customers utilizing our TPA services during fiscal 2011.
Service Center
Service center expenses for fiscal 2011 were $18.6 million, an increase of $3.6 million, or 24%, compared to fiscal 2010. This increase was primarily driven by a $3.2 million, or 30%, increase in compensation and commission expenses during fiscal 2011, as we increased the number of seasonal personnel to accommodate a 21% increase in the number of new core applications submitted during fiscal 2011.
-53-
Table of Contents
Sales and Marketing
Sales and marketing expenses for fiscal 2011 were $10.1 million, an increase of $2.8 million, or 39%, compared to fiscal 2010. This increase was primarily due to a $1.6 million increase in partner fees, as we expanded the number of client accounts acquired through our partner channel. Additionally, our marketing expenses increased by $0.9 million in fiscal 2011 compared to fiscal 2010 as we invested in corporate awareness, lead generation and strategy development projects intended to enhance our brand and product offering and expand our sales opportunities. Commission expenses for our field sales executives increased $0.4 million, due to a 21% increase in the number of new core applications submitted from fiscal 2010 to fiscal 2011.
General and Administrative
General and administrative expenses for fiscal 2011 were $6.7 million, an increase of $1.3 million, or 23%, compared to fiscal 2010. This increase was primarily due to increases of $0.3 million in office and equipment expenses and $0.3 million in compensation related expenses, as a result of an increase in headcount. In addition, during fiscal 2011, employee recruiting costs increased by $0.3 million, as we hired additional benefit advisors to accommodate increased enrollment volumes.
Restructuring Expense
In February 2010, we undertook a strategic initiative to reorganize the business in order to improve our operational and financial efficiencies. In connection with this initiative, we recorded a restructuring charge of $0.3 million in fiscal 2010, which was comprised of severance charges associated with a reduction in the workforce of 26 employees.
Provision for Income Taxes
Provision for income taxes was $2.5 million for fiscal 2011, an increase of $2.2 million compared to fiscal 2010. Our effective tax rate was 20.1% in fiscal 2011 compared to 2.7% in 2010. In fiscal 2010, the majority of our cash income taxes were offset by net operating loss carryforwards and we maintained a full valuation allowance against our deferred tax assets. In fiscal 2011, we reversed our remaining valuation allowance and incurred tax expense for income in excess of the valuation allowance release. Our effective tax rate increased in fiscal 2011 as our tax expense in fiscal 2010 was limited to cash taxes after net operating loss utilization. We expect our tax rate to increase in fiscal 2012 to more closely reflect the Federal and state statutory rates.
-54-
Table of Contents
Comparison of Fiscal 2009 and 2010
The following table presents our historical results of operations and the changes in these results in dollars and as a percentage for the periods presented:
| Year Ended June 30, | Change ($) | Change (%) | ||||||||||||||
| 2009 | 2010 | |||||||||||||||
| (in thousands, except percentages) | ||||||||||||||||
| Revenue: |
||||||||||||||||
| Commissions |
$ | 16,933 | $ | 43,646 | $ | 26,713 | 158 | % | ||||||||
| Other |
779 | 370 | (409 | ) | (53 | ) | ||||||||||
|
|
|
|
|
|
|
|
|
|||||||||
| Total revenue |
17,712 | 44,016 | 26,304 | 149 | ||||||||||||
|
|
|
|
|
|
|
|
|
|||||||||
| Operating expenses: |
||||||||||||||||
| Service center |
18,117 | 14,994 | (3,123 | ) | (17 | ) | ||||||||||
| Sales and marketing |
6,768 | 7,290 | 522 | 8 | ||||||||||||
| Technology |
2,096 | 3,060 | 964 | 46 | ||||||||||||
| General and administrative |
5,072 | 5,464 | 392 | 8 | ||||||||||||
| Restructuring expense |
— | 314 | 314 | * | ||||||||||||
|
|
|
|
|
|
|
|
|
|||||||||
| Total operating expenses |
32,053 | 31,122 | (931 | ) | (3 | ) | ||||||||||
|
|
|
|
|
|
|
|
|
|||||||||
| Income (loss) from operations |
(14,341 | ) | 12,894 | 27,235 | * | |||||||||||
| Interest income |
58 | 28 | (30 | ) | (52 | ) | ||||||||||
| Interest expense |
(80 | ) | (69 | ) | 11 | 14 | ||||||||||
|
|
|
|
|
|
|
|
|
|||||||||
| Income (loss) before provision for income taxes |
(14,363 | ) | 12,853 | 27,216 | * | |||||||||||
| Provision for income taxes |
2 | 346 | 344 | * | ||||||||||||
|
|
|
|
|
|
|
|
|
|||||||||
| Net income (loss) |
$ | (14,365 | ) | $ | 12,507 | $ | 26,872 | * | ||||||||
|
|
|
|
|
|
|
|
|
|||||||||
| * | Not meaningful |
Commission Revenue
Commission revenue for fiscal 2010 was $43.6 million, an increase of $26.7 million, or 158%, compared to fiscal 2009. In fiscal 2009, we transitioned a group of General Motors’ retirees, which contributed to a 202% increase in active core members year over year. We began recognizing the commission revenue associated with these new active core members beginning in January 2009, resulting in six months of revenue from this transition in fiscal 2009 and a full year of revenue in fiscal 2010. Our PARR at June 30, 2010 was $37.8 million to $39.3 million compared to $27.5 million to $28.7 million at June 30, 2009. Based on the midpoint of the two ranges, our PARR at June 30, 2010 increased by $10.5 million, or 37%, over the prior year period.
Additionally, during 2009, the regulatory body that governs compensation for Medicare Advantage and Medicare Part D prescription drug policies changed the commission refund guidelines to require that a carrier recover some or all of the commissions paid if a policy is cancelled during the first year, resulting in pro-rata recognition of the commission over a 12 month period. The prior guidelines stipulated a three month refund period. Under the prior refund guidelines, the entire first year commission for the Medicare Advantage and prescription drug policies enrolled during the 2008 AEP for a January 1, 2008 policy effective date was fully recognized during fiscal 2008, and no amount of the first year commission was deferred into fiscal 2009. In fiscal 2009, $8.0 million in commissions associated with the 2009 AEP enrollments was deferred and recognized in fiscal 2010 in accordance with the revised refund guidelines.
Other Revenue
Other revenue for fiscal 2010 was $0.4 million, a decrease of $0.4 million, or 53%, as compared to fiscal 2009. This decrease was partially due to the completion of an agreement with a strategic partner in December 2008 under which we recognized $0.2 million during fiscal 2009.
-55-
Table of Contents
Service Center
Service center expenses for fiscal 2010 were $15.0 million, a decrease of $3.1 million, or 17%, compared to fiscal 2009. This decrease was primarily driven by a 32% decline in the number of new core applications submitted in fiscal 2010 compared to fiscal 2009. Additionally, during fiscal 2009, to meet the demand generated by the General Motors transition, we utilized outsourced agents at a much higher cost than our internal resources. In fiscal 2010, we leveraged our internal benefit advisors to service the lower enrollment demand, resulting in a net decrease of $3.1 million in compensation and other associated overhead expenses.
Sales and Marketing
Sales and marketing expenses for fiscal 2010 were $7.3 million, an increase of $0.5 million, or 8%, compared to fiscal 2009. This increase was primarily due to a $0.3 million increase in compensation expense as we hired several key senior executives during this time period.
Technology
Technology expenses for fiscal 2010 were $3.1 million, an increase of $1.0 million, or 46%, over fiscal 2009. This increase was primarily due to a $0.8 million increase in compensation related expenses as a result of a 30% increase in headcount during fiscal 2010 as compared to fiscal 2009. Additionally, we capitalized $0.3 million less in compensation costs associated with internal-use software development during fiscal 2010 as compared to fiscal 2009.
General and Administrative
General and administrative expenses for fiscal 2010 were $5.5 million, an increase of $0.4 million, or 8%, compared to fiscal 2009. This increase was primarily due to a $1.3 million increase in compensation expense due to a 95% increase in average headcount during fiscal 2010 compared to fiscal 2009. This increase was partially offset by a $0.8 million decrease in outside services, which consisted of a $0.5 million decrease in consulting expenses related to certain training programs implemented in 2009, and a $0.2 million decrease in accounting fees due to increased expenditures in fiscal 2009 associated with initial financial statement audit activities.
Provision for Income Taxes
Provision for income taxes in fiscal 2010 was $0.3 million compared to $2,000 in fiscal 2009. This change was primarily due to us generating net income during fiscal 2010 compared to a net loss in fiscal 2009. We had sufficient net operating losses during fiscal 2010 to offset our tax obligations and the net operating losses were offset by a valuation allowance. The tax provision recognized during that period reflects certain state level taxation where the net operating losses could not be utilized.
-56-
Table of Contents
Quarterly Results of Operations
The following table sets forth our unaudited quarterly statements of operations data for each of the eight quarters presented below (certain items may not foot due to rounding). We have prepared the unaudited quarterly data on a consistent basis with the audited consolidated financial statements included in this prospectus. In the opinion of management, the financial information reflects all necessary adjustments, consisting only of normal recurring adjustments, necessary for a fair presentation of this data. This information should be read in conjunction with our audited consolidated financial statements and the related notes included elsewhere in this prospectus. The results of historical periods are not necessarily indicative of the results of operations for a full year or any future period.
| Three Months Ended | ||||||||||||||||||||||||||||||||
| Jun 30, 2010 |
Sep 30, 2010 |
Dec 31, 2010 |
Mar 31, 2011 |
Jun 30, 2011 |
Sep 30, 2011 |
Dec 31, 2011 |
Mar 31, 2012 |
|||||||||||||||||||||||||
| (in thousands, except share and per share amounts) | ||||||||||||||||||||||||||||||||
| Consolidated Statements of Operations Data: |
||||||||||||||||||||||||||||||||
| Revenue: |
||||||||||||||||||||||||||||||||
| Commissions |
$ | 12,143 | $ | 11,178 | $ | 11,536 | $ | 13,002 | $ | 14,735 | $ | 15,648 | $ | 15,142 | $ | 17,621 | ||||||||||||||||
| Other |
55 | 92 | 152 | 198 | 234 | 132 | 161 | 175 | ||||||||||||||||||||||||
|
|
|
|
|
|
|
|
|
|
|
|
|
|
|
|
|
|||||||||||||||||
| Total revenue |
12,198 | 11,270 | 11,688 | 13,200 | 14,969 | 15,780 | 15,303 | 17,796 | ||||||||||||||||||||||||
| Operating expenses: |
||||||||||||||||||||||||||||||||
| Service center(1) |
2,173 | 3,968 | 7,262 | 3,820 | 3,501 | 6,350 | |
8,737 |
|
4,868 | ||||||||||||||||||||||
| Sales and marketing(1) |
1,364 | 1,554 | 2,937 | 1,854 | 3,789 | 2,715 | |
4,384 |
|
3,757 | ||||||||||||||||||||||
| Technology(1) |
799 | 705 | 601 | 936 | 953 | 1,244 | |
1,064 |
|
956 | ||||||||||||||||||||||
| General and administrative(1) |
1,319 | 1,913 | 1,605 | 1,526 | 1,684 | 2,168 | 1,729 | 2,077 | ||||||||||||||||||||||||
| Restructuring expense |
(80 | ) | — | — | — | — | — | |
— |
|
— | |||||||||||||||||||||
|
|
|
|
|
|
|
|
|
|
|
|
|
|
|
|
|
|||||||||||||||||
| Total operating expenses |
5,575 | 8,140 | 12,405 | 8,136 | 9,927 | 12,477 | 15,914 | 11,658 | ||||||||||||||||||||||||
|
|
|
|
|
|
|
|
|
|
|
|
|
|
|
|
|
|||||||||||||||||
| Income (loss) from operations |
6,623 | 3,130 | (717 | ) | 5,064 | 5,042 | 3,303 | |
(611 |
) |
6,138 | |||||||||||||||||||||
| Interest income |
24 | 14 | 9 | 12 | 18 | 23 | 3 | 4 | ||||||||||||||||||||||||
| Interest expense |
(11 | ) | (24 | ) | (30 | ) | (27 | ) | (29 | ) | (42 | ) | (97 | ) | (184 | ) | ||||||||||||||||
|
|
|
|
|
|
|
|
|
|
|
|
|
|
|
|
|
|||||||||||||||||
| Income (loss) before income taxes |
6,636 | 3,120 | (738 | ) | 5,049 | 5,031 | 3,284 | |
(705 |
) |
5,958 | |||||||||||||||||||||
| Provision (benefit) for income taxes |
180 | (982 | ) | (327 | ) | 1,884 | 1,930 | 1,230 | (281 | ) | 2,364 | |||||||||||||||||||||
|
|
|
|
|
|
|
|
|
|
|
|
|
|
|
|
|
|||||||||||||||||
| Net income (loss) |
$ | 6,456 | $ | 4,102 | $ | (411 | ) | $ | 3,165 | $ | 3,101 | $ | 2,054 | $ | (424 | ) | $ | 3,594 | ||||||||||||||
|
|
|
|
|
|
|
|
|
|
|
|
|
|
|
|
|
|||||||||||||||||
| Net income (loss) attributable to common stockholders(2): |
||||||||||||||||||||||||||||||||
| Basic |
$ | 291 | $ | 349 | $ | (410 | ) | $ | 78 | $ | 289 | $ | (22,638 | ) | $ | (11,302 | ) | $ | 123 | |||||||||||||
|
|
|
|
|
|
|
|
|
|
|
|
|
|
|
|
|
|||||||||||||||||
| Diluted |
$ | 694 | $ | 569 | $ | (410 | ) | $ | 124 | $ | 545 | $ | (22,638 | ) | $ | (11,302 | ) | $ | 268 | |||||||||||||
|
|
|
|
|
|
|
|
|
|
|
|
|
|
|
|
|
|||||||||||||||||
| Net income (loss) per share attributable to common stockholders: |
||||||||||||||||||||||||||||||||
| Basic |
$ | 0.42 | $ | 0.25 | $ | (0.30 | ) | $ | 0.05 | $ | 0.19 | $ | (14.91 | ) | $ | (7.44 | ) | $ | 0.08 | |||||||||||||
|
|
|
|
|
|
|
|
|
|
|
|
|
|
|
|
|
|||||||||||||||||
| Diluted |
$ | 0.39 | $ | 0.24 | $ | (0.30 | ) | $ | 0.05 | $ | 0.17 | $ | (14.91 | ) | $ | (7.44 | ) | $ | 0.07 | |||||||||||||
|
|
|
|
|
|
|
|
|
|
|
|
|
|
|
|
|
|||||||||||||||||
| Weighted-average shares used to compute net income (loss) per share attributable to common stockholders: |
||||||||||||||||||||||||||||||||
| Basic |
696,969 | 1,371,882 | 1,389,005 | 1,421,729 | 1,516,367 | 1,518,092 | 1,519,920 | 1,526,098 | ||||||||||||||||||||||||
|
|
|
|
|
|
|
|
|
|
|
|
|
|
|
|
|
|||||||||||||||||
| Diluted |
1,777,077 | 2,373,844 | 1,389,005 | 2,418,961 | 3,143,335 | 1,518,092 | 1,519,920 | 3,772,509 | ||||||||||||||||||||||||
|
|
|
|
|
|
|
|
|
|
|
|
|
|
|
|
|
|||||||||||||||||
| Other Financial and Operational Data: |
||||||||||||||||||||||||||||||||
| Active core members (end of period) |
126,000 | 126,600 | 127,800 | 163,000 | 161,700 | 171,000 | 169,500 | 213,900 | ||||||||||||||||||||||||
| Pending core members (end of period) |
2,000 | 1,300 | 44,100 | 1,500 | 10,500 | 2,500 | 52,300 | 7,900 | ||||||||||||||||||||||||
| Core applications submitted |
2,900 | 2,000 | 45,600 | 2,200 | 10,900 | 3,700 | 53,100 | 5,000 | ||||||||||||||||||||||||
| Adjusted EBITDA(3) |
$ | 7,190 | $ | 3,734 | $ | (124 | ) | $ | 5,661 | $ | 5,644 | $ | 4,280 | $ | 222 | $ | 6,704 | |||||||||||||||
-57-
Table of Contents
| (1) | Stock-based compensation included in the consolidated statements of operations data above was as follows: |
| Three Months Ended | ||||||||||||||||||||||||||||||||
| Jun 30, 2010 |
Sep 30, 2010 |
Dec 31, 2010 |
Mar 31, 2011 |
Jun 30, 2011 |
Sep 30, 2011 |
Dec 31, 2011 |
Mar 31, 2012 |
|||||||||||||||||||||||||
| (in thousands) | ||||||||||||||||||||||||||||||||
| Service center |
$ | 2 | $ | 5 | $ | 7 | $ | 7 | $ | 7 | $ | 83 | $ | 73 | $ | 16 | ||||||||||||||||
| Sales and marketing |
8 | 12 | 12 | 11 | 17 | 190 | |
138 |
|
36 | ||||||||||||||||||||||
| Technology |
2 | 7 | 7 | 8 | 8 | 82 | |
66 |
|
17 | ||||||||||||||||||||||
| General and administrative |
14 | 23 | 25 | 33 | 61 | 110 | 94 | 87 | ||||||||||||||||||||||||
|
|
|
|
|
|
|
|
|
|
|
|
|
|
|
|
|
|||||||||||||||||
| Total stock-based compensation |
$ | 26 | $ | 47 | $ | 51 | $ | 59 | $ | 93 | $ | 465 | $ | 371 | $ | 156 | ||||||||||||||||
|
|
|
|
|
|
|
|
|
|
|
|
|
|
|
|
|
|||||||||||||||||
| (2) | The net loss attributable to common stockholders for the three months ended September 30, 2011 and December 31, 2011 include adjustments of $24.7 million and $10.9 million, respectively, for dividends distributed to preferred stockholders during each period. See Note 13 to our consolidated financial statements for further details regarding the adjustments applied in the calculation of basic and diluted net income (loss) per share attributable to common stockholders. |
| (3) | See “Selected Consolidated Financial Data—Adjusted EBITDA” above for a discussion regarding the use of adjusted EBITDA as a financial measure. The following table presents a reconciliation of adjusted EBITDA to net income (loss), the most directly comparable GAAP financial measure, for each of the periods indicated. |
| Three Months Ended | ||||||||||||||||||||||||||||||||
| Jun 30, 2010 |
Sep 30, 2010 |
Dec 31, 2010 |
Mar 31, 2011 |
Jun 30, 2011 |
Sep 30, 2011 |
Dec 31, 2011 |
Mar 31, 2012 |
|||||||||||||||||||||||||
| (in thousands) | ||||||||||||||||||||||||||||||||
| Reconciliation of Adjusted EBITDA: |
||||||||||||||||||||||||||||||||
| Net income (loss) |
$ | 6,456 | $ | 4,102 | $ | (411 | ) | $ | 3,165 | $ | 3,101 | $ | 2,054 | $ | (424 | ) | $ | 3,594 | ||||||||||||||
| Adjustments: |
||||||||||||||||||||||||||||||||
| Depreciation and amortization |
541 | 557 | 542 | 537 | 509 | 51 | 462 | 410 | ||||||||||||||||||||||||
| Provision (benefit) for income taxes |
180 | (982 | ) | (327 | ) | 1,884 | 1,930 | 1,230 | (281 | ) | 2,364 | |||||||||||||||||||||
| Stock-based compensation |
26 | 47 | 51 | 59 | 93 | 465 | |
371 |
|
156 | ||||||||||||||||||||||
| Interest income |
(24 | ) | (14 | ) | (9 | ) | (12 | ) | (18 | ) | (23 | ) | (3 | ) | (4 | ) | ||||||||||||||||
| Interest expense |
11 | 24 | 30 | 27 | 29 | 42 | 97 | 184 | ||||||||||||||||||||||||
|
|
|
|
|
|
|
|
|
|
|
|
|
|
|
|
|
|||||||||||||||||
| Adjusted EBITDA |
$ | 7,190 | $ | 3,734 | $ | (124 | ) | $ | 5,660 | $ | 5,644 | $ | 4,280 | $ | 222 | $ | 6,704 | |||||||||||||||
|
|
|
|
|
|
|
|
|
|
|
|
|
|
|
|
|
|||||||||||||||||
There are seasonal factors that affect our commission revenue in that the majority of our enrollment activity historically has occurred for policies with an effective date of January 1 of each year. As a result, we typically see an increase in our commission revenue during the third and fourth fiscal quarters of each year, as we begin recognizing the revenue associated with these new policies. In the future, we expect to complete more enrollments for transition effective dates other than January 1, which will mitigate some of this seasonality effect. In particular, public sector employers are generally more inclined to opt for an off-cycle transition period, as their benefits effective date typically coincides with the beginning of their fiscal year, which is often not January 1. For example, during the three months ended June 30, 2011, we transitioned a group of State of Nevada retirees into policies with an effective date of July 1, 2011 resulting in an increase in commission revenue during the three months ended September 30, 2011, as we began recognizing the revenue associated with these new core members.
The timing of policy cancellations is also subject to seasonal factors. While the cancellation timing for members enrolled in a Medicare supplement policy is generally uniform throughout the year, a significant percentage of the cancellations for Medicare Advantage policies typically occur during the AEP, when Medicare-eligible individuals can make changes to their coverage for the following year. In many cases, we are able to retain these members by facilitating their enrollment into a new plan. However, to the extent they do not re-enroll with us, their policy is cancelled effective January 1 of the following year. As a result, the number of active core members as of March 31 will reflect the impact of these policy cancellations.
Because our commission revenue recognition is dependent upon cash receipt, the timing of commission payments can impact our quarterly commission revenue. To the extent a commission payment relating to a prior
-58-
Table of Contents
quarter is received in a subsequent quarter, the full amount will be recognized in the subsequent quarter as a catch-up adjustment. For example, the upfront first-year commissions for Medicare Advantage and Medicare Part D prescription drug policies are often paid in two installments — the first installment on or before the policy effective date and the second installment three to four months after the policy effective date. Upon receipt of the second installment, we recognize a catch-up adjustment in the current period for the amount of the commission payment, if any, that was related to a prior period. Because the majority of our enrollment activity has historically occurred for policies with an effective date of January 1 of each year, we typically see an increase in our commission revenue in the fourth fiscal quarter of each year, relative to the third fiscal quarter, reflecting the receipt of the second installment payments on our Medicare Advantage and Medicare Part D prescription drug policies, as was the case in both the quarters ended June 30, 2010 and 2011.
The seasonality discussed above also impacts our service center expenses and, to a lesser extent, our sales and marketing expenses. We typically incur the majority of our enrollment-related costs during the quarter preceding the transition effective date, as we staff our service center with benefit advisors, customer service representatives and other support personnel to handle the application processing. Additionally, our benefit advisors and field sales personnel, as well as some of our partners, receive enrollment incentives that are tied to the number of applications submitted during the quarter. Because the majority of our enrollment activity historically has been for employer transitions with a January 1 effective date, we generally see a significant increase in our service center expenses during the three months ended December 31.
During the three months ended June 30, 2011, we transitioned a group of State of Nevada retirees of a large public sector employer that was referred to us through our partner channel. The partner fees associated with this referral were recognized during the three months ended June 30, 2011, and contributed to the year over year increase in sales and marketing expenses. Additionally, in 2011, the timing of the annual enrollment period for Medicare was shifted to an earlier date. To prepare for this revised timeline, we began hiring seasonal personnel for the AEP earlier during the three months ended September 30, 2011, as compared to the prior year, which resulted in increased service center expenses during that period.
During the three months ended September 30, 2010, we determined that it was more likely than not that we would be able to utilize our remaining net deferred tax assets, and released the valuation allowance that had been recorded against them, resulting in a net tax benefit of $1.0 million. All remaining net operating loss carryforwards were utilized during the three months ended March 31, 2011, and, as such, subsequent quarters reflect a provision for income taxes based on statutory rates.
Liquidity and Capital Resources
Liquidity
As of March 31, 2012, we had $13.3 million of cash and cash equivalents. Since our inception, we have received gross aggregate proceeds from preferred stock issuances of $23.9 million. Since the fourth quarter of fiscal 2009, we have funded our operations primarily with cash flows from operations and, to a lesser extent, working capital and financing arrangements.
In August 2011 and December 2011, we declared cash dividends in an aggregate amount of $39.0 million, which were paid to stockholders of record in September 2011 and December 2011. The September dividend payments per share to holders of Series A and B convertible preferred stock and common stock were $1.64, $1.73 and $1.52, respectively, representing aggregate payments of $14.8 million, $9.9 million and $2.3 million, respectively, and the December dividend payments per share to holders of Series A and B convertible preferred stock and common stock were each $0.74, representing aggregate payments of $6.6 million, $4.3 million and $1.1 million, respectively. In connection with these cash dividends, we expanded our credit facility with Silicon Valley Bank to $18.0 million, comprised of a $8.0 million revolving line of credit and $10.0 million in term loans. The loans and security agreement includes financial covenants that require that (i) our revenue
-59-
Table of Contents
achievement against plan, calculated on a trailing 90-day basis, is not less than 75% of our projected revenue for the applicable period, (ii) we achieve a minimum amount of adjusted EBITDA, and (iii) our fixed charge coverage ratio, measured as of the last day of each fiscal quarter on a trailing 12-month basis, is at least 2.0 to 1.0, all of which must be met in order to maintain indebtedness under the loan agreement. As of March 31, 2012, we were in compliance with these financial covenants. In both August 2011 and December 2011 we drew $5.0 million under the term loans, which will be repaid monthly through August 2014 and December 2014, respectively. In December 2011, we drew $5.0 million under the line of credit, which was repaid during January 2012.
In establishing the dividend amounts to be paid to stockholders during fiscal 2012, we considered our current liquidity position, our expectations for future cash flows, our access to capital and alternative uses for our cash. Based on this analysis, we determined that we had sufficient liquidity to fund a cash dividend and that this represented an optimal use of our cash given the other alternatives that existed at the time.
We experienced positive cash flows from operations during fiscal 2009, 2010 and 2011. We expect that we will continue to generate positive cash flows from operations on an annual basis, although this may fluctuate significantly on a quarterly basis. We believe that our existing sources of liquidity will be sufficient to fund our operations for at least the next 12 months. Our future capital requirements will depend on many factors, including our rate of revenue growth, the expansion of our sales and marketing activities, our expansion into other markets and our results of operations. To the extent that existing cash, cash equivalents, short-term investments, cash from operations and credit facilities are insufficient to fund our future activities, we may need to raise additional funds through public or private equity or debt financing. The sale of additional equity could result in additional dilution to our stockholders. If we raise additional funds by obtaining loans from third parties, the terms of those financing arrangements may include additional covenants or other loan restrictions on our business that could impair our operating flexibility, and would also require us to incur interest expense. We can provide no assurance that additional financing will be available at all or, if available, that we would be able to obtain financing on terms acceptable to us.
Cash Flows
The following summary of cash flows for the periods indicated has been derived from our consolidated financial statements included elsewhere in this prospectus:
| Year Ended June 30, | Nine Months Ended March 31, |
|||||||||||||||||||
| 2009 | 2010 | 2011 | 2011 | 2012 | ||||||||||||||||
| (in thousands) | ||||||||||||||||||||
| Consolidated Statements of Cash Flows Data: |
||||||||||||||||||||
| Net cash from (used in) operating activities |
$ | 405 | $ | 12,482 | $ | 20,335 | $ | 17,372 | $ | 5,257 | ||||||||||
| Net cash from (used in) investing activities |
(1,805 | ) | (1,336 | ) | (17,778 | ) | (10,653 | ) | 14,257 | |||||||||||
| Net cash from (used in) financing activities |
(533 | ) | (367 | ) | (88 | ) | (34 | ) | (29,334 | ) | ||||||||||
Cash Flows from Operating Activities
We experienced positive cash flows from operations during fiscal 2009, 2010 and 2011 primarily as a result of our increased revenues and the resulting reduction of our net loss or increase in net income during these periods. Our primary source of cash from operating activities is collections of commission payments from insurance carriers. Our primary uses of cash for operating activities are for compensation-related expenditures and settlement of accounts payable to vendors.
Net cash from operating activities during the nine months ended March 31, 2012 of $5.3 million was primarily due to net income of $5.2 million. Net income was partially offset by a $2.3 million net increase in our operating assets and liabilities, primarily a result of a $2.3 million increase in prepaid expenses including prepaid legal and accounting fees associated with this offering and prepaid income taxes, and a $0.9 million decrease in
-60-
Table of Contents
deferred revenue during the period as we recognized revenue related to advanced commissions received in fiscal 2011. These changes were partially offset by non-cash charges of $1.4 million for depreciation and amortization and $1.0 million for stock-based compensation.
Net cash from operating activities during fiscal 2011 of $20.3 million was primarily attributable to our net income of $10.0 million, net change in operating assets and liabilities of $9.0 million, non-cash charges for depreciation and amortization of $2.1 million and stock-based compensation of $0.3 million. These were partially offset by the non-cash change in deferred income taxes of $1.1 million. The net change in our operating assets and liabilities of $9.0 million was primarily the result of a $2.9 million increase in deferred revenue related to advanced commission payments as the number of new core applications submitted during fiscal 2011 increased by 21% compared to fiscal 2010. In addition, accrued expenses increased by $5.6 million, largely driven by a $2.3 million increase in income tax payable due to the decrease in the amount of Federal and state net operating loss carryforwards available to reduce the current tax expenses in fiscal 2011. Accrued liabilities also increased as a result of a $1.4 million increase in accrued bonuses due to an increase in bonus accruals in fiscal 2011 and a $0.6 million increase in accrued partner fees due to the growth in the number of clients acquired through the partner channel.
Net cash from operating activities during fiscal 2010 of $12.5 million was primarily due to net income of $12.5 million and non-cash charges of $1.8 million for depreciation and amortization partially offset by the net decrease in our operating assets and liabilities of $2.0 million. This net decrease in our operating assets and liabilities was largely a result of a $0.9 million decrease in deferred revenue due to a 32% decrease in new core applications submitted during fiscal 2010. In addition, accounts payable decreased by $0.5 million primarily due the to timing of vendor payments associated with capital expenditures.
Net cash from operating activities during fiscal 2009 of $0.4 million was primarily due to the net change in our operating assets and liabilities of $13.7 million and non-cash charges of $1.0 million for depreciation and amortization, offset by the net loss of $14.4 million. The net change in our operating assets and liabilities of $13.7 million was primarily the result of a $12.3 million increase in deferred revenue due to the significant increase in the number of new enrollments during fiscal 2009, for which we received commissions in advance.
Cash Flows from Investing Activities
Our primary investing activities have consisted of purchases and sales of short-term investments, purchases of property and equipment and changes in restricted cash. Our capital expenditures primarily consist of purchases of computer equipment, furniture and fixtures, and computer software, including capitalized costs for internal-use software. In the future, we expect that we will continue to make significant capital expenditures to support our expanding operations. The changes in restricted cash were due to the changes in amounts our financial institutions required as collateral for company credit cards and funds held in trust for employers related to our TPA services.
During the nine months ended March 31, 2012, net cash from investing activities of $14.3 million was primarily due to the net sales and maturities of short-term investments to fund the dividend distributions paid in September 2011 and December 2011. During fiscal 2011, cash used in investing activities of $17.8 million was primarily attributable to $15.7 million of net purchases of short-term investments as we invested funds that were not immediately required for operating needs, and $2.1 million in capital expenditures. During fiscal 2009 and 2010, cash used in investing activities was primarily attributable to capital expenditures.
Cash Flows from Financing Activities
Our financing activities have consisted primarily of advances and repayments under our credit facility, repayments of capital lease obligations, proceeds from stock option exercises and payments of cash dividends.
-61-
Table of Contents
During the nine months ended March 31, 2012, net cash used in financing activities of $29.3 million was primarily due to the $39.0 million in dividend distributions, partially offset by $9.7 million in advances, net of repayments, under the credit facility. During fiscal 2011, cash used in financing activities of $0.1 million was primarily attributable to $0.7 million of principal payments on our debt and capital lease obligations, partially offset by $0.5 million of proceeds from advances under the credit facility we entered into during fiscal 2011. During fiscal 2010, cash used in financing activities of $0.4 million was primarily attributable to $0.8 million of principal payments on capital lease obligations, partially offset by $0.5 million in proceeds from exercises of stock options during the year. During fiscal 2009, cash used in financing activities of $0.5 million was primarily attributable to $0.6 million of principal payments on capital lease obligations.
Contractual Obligations
We lease our executive office facilities in San Mateo, California under an operating lease that expires in November 2015. We also lease space for our service centers located in South Jordan, Utah under a lease that expires December 2012, and Richardson, Texas under a lease that expires April 2016 and for our technology development center in Sugarhouse, Utah under a lease that expires February 2013. We have established a credit facility with Silicon Valley Bank comprised of a $5.0 million revolving line of credit and a $1.0 million equipment loan. We advanced $0.5 million under the equipment loan in July 2010, which will be repaid through January 2014. There were no amounts advanced under the line of credit as of June 30, 2011. We have also entered into several capital leases to finance certain purchases of property and equipment with terms expiring through September 2012. Our future minimum payments under non-cancelable operating leases, debt obligations and capital lease obligations were as follows as of June 30, 2011:
| Payments Due by Period | ||||||||||||||||||||
| Total | Less Than 1 Year |
1 to 3 Years |
3 to 5 Years |
More Than 5 Years |
||||||||||||||||
| (in thousands) | ||||||||||||||||||||
| Contractual Obligations: |
||||||||||||||||||||
| Operating leases |
$ | 2,958 | $ | 1,185 | $ | 1,600 | $ | 173 | $ | — | ||||||||||
| Principal on debt obligations(1) |
380 | 139 | 241 | — | — | |||||||||||||||
| Interest on debt obligations(1) |
38 | 23 | 15 | — | — | |||||||||||||||
| Principal on capital lease obligations |
127 | 108 | 19 | — | — | |||||||||||||||
| Interest on capital lease obligations |
5 | 5 | — | — | — | |||||||||||||||
|
|
|
|
|
|
|
|
|
|
|
|||||||||||
| Total contractual obligations |
$ | 3,508 | $ | 1,460 | $ | 1,875 | $ | 173 | $ | — | ||||||||||
|
|
|
|
|
|
|
|
|
|
|
|||||||||||
| (1) | Future debt obligations increased during the nine months ended March 31, 2012 due to the expansion of our credit facility with Silicon Valley Bank in August and December 2011. The $18.0 million facility is comprised of a $8.0 million revolving line of credit and $10.0 million in term loans. Borrowings under the revolving line of credit mature 12 months from the effective date of the loan agreement and borrowings under the term loans are payable in 36 monthly installments, with the first six months on an interest-only basis. In both August 2011 and December 2011, we drew $5.0 million in term loans, which will be repaid monthly through August 2014 and December 2014, respectively. In December 2011, we drew $5.0 million under the line of credit, which was repaid during January 2012. |
Off-Balance Sheet Arrangements
Through March 31, 2012, we had not entered into any off-balance sheet arrangements, other than the operating leases noted above, and do not have any holdings in variable interest entities.
Quantitative and Qualitative Disclosures about Market Risk
We are exposed to market risks in the ordinary course of our business. Market risk represents the risk of loss that may impact our financial position due to adverse changes in financial market prices and rates. Our market risk exposure is primarily a result of fluctuations in interest rates.
-62-
Table of Contents
Interest Rate Risk
We had cash and cash equivalents of $13.3 million as of March 31, 2012, which consist of bank deposits and money market funds. We hold our cash and cash equivalents and short-term investments for working capital purposes. Due to the short-term nature of these instruments, we believe that we do not have any material exposure to changes in the fair value of our investment portfolio as a result of changes in interest rates. Declines in interest rates, however, will reduce future interest income. During fiscal 2011, a 10% increase or decrease in overall interest rates would not have had a material impact on our interest income.
We had outstanding indebtedness of $10.2 million as of March 31, 2012. Our outstanding indebtedness consists of $9.8 million in term loans, an equipment loan of $0.3 million and capital lease obligations of $47,000. Our obligations under the term loans, equipment loan and capital lease obligations carry interest rates that are fixed and are not subject to fluctuation. The interest rate on the revolving line of credit, however, would be subject to fluctuations in interest rates on each advance date, which could have a material impact on our future financial condition and results of operation. During fiscal 2011, a 10% increase or decrease in overall interest rates would not have had a material impact on our interest expense.
We do not enter into investments for trading or speculative purposes and have not used any derivative financial instruments to manage our interest rate risk exposure.
Dividend-Related Option Adjustments
On August 29, 2011 and December 28, 2011, we declared cash dividends of $27.0 million and $12.0 million, respectively. Under our 2007 Equity Incentive Plan, option holders are entitled to option adjustments for any distributions to stockholders in which they do not participate to mitigate the dilutive effect of such distribution on the outstanding stock options. In accordance with this provision, the number of shares underlying each stock option outstanding on each of the dividend record dates was increased by multiplying the number of outstanding options by an adjustment ratio, and the exercise prices of each option was decreased by dividing the exercise price by the same adjustment ratio. The adjustment ratio was calculated based on the determination by our board of directors of the fair market value of a share of our common stock immediately before and after the payment of the dividend, resulting in an adjustment ratio of 1.16129 to 1 for the August 2011 dividend and 1.11111 to 1 for the December 2011 dividend. As a result of applying these adjustment ratios on the August 2011 and December 2011 record dates, we increased our outstanding options by 383,777 and 306,041 shares, respectively, and reduced the associated option exercise prices for all options outstanding under our 2004 and 2007 Equity Incentive Plans as of these dates.
We did not recognize any stock-based compensation expense associated with the modifications of the outstanding options under the 2007 Equity Incentive Plan because these option adjustments were contractually required under the plan provisions. The 2004 Equity Incentive Plan does not have a provision that requires option adjustments in the event of a cash dividend. Due to the fact that the option adjustments under the 2004 Equity Incentive Plan were not contractually required, we recorded stock-based compensation charges of $0.3 million related to the August 2011 option modifications and $0.2 million related to the December 2011 option modifications, all of which were recognized during the quarters ended September 30, 2011 and December 31, 2011, respectively, as the options were fully vested as of each of the modification dates.
Critical Accounting Policies
Our consolidated financial statements are prepared in accordance with generally accepted accounting principles in the United States, and include our accounts and the accounts of our wholly owned subsidiaries. The preparation of these consolidated financial statements requires our management to make estimates, assumptions and judgments that affect the reported amounts of assets and liabilities and disclosure of contingent assets and liabilities
-63-
Table of Contents
at the date of the financial statements, and the reported amounts of revenue and expenses during the applicable periods. We base our estimates, assumptions and judgments on historical experience and on various other factors that we believe to be reasonable under the circumstances. Different assumptions and judgments could change the estimates used in the preparation of our consolidated financial statements, which, in turn, could change the results from those reported. We evaluate our estimates, assumptions and judgments on an ongoing basis. The critical accounting estimates, assumptions and judgments that we believe have the most significant impact on our consolidated financial statements are described below.
Revenue Recognition
Our revenue is primarily derived from commissions paid to us by insurance carriers for health insurance policies issued as a direct result of our enrollment services. Once the insurance carrier has confirmed that a policy has been issued, we have no further obligation to service the enrollment. Under our carrier compensation contracts, we are generally entitled to receive commissions for five or more years from the policy effective date, provided that the policy is not cancelled during that time period. These commissions may be paid in advance or monthly as the underlying premium is paid to the carrier. Commissions that are paid in advance are typically subject to refund provisions that enable the carrier to recover some or all of the commissions paid to us if the policy is cancelled prior to the end of the advance period.
We recognize commission revenue when all of the four following criteria are met: (1) persuasive evidence of an arrangement exists; (2) delivery has occurred; (3) the commission amount is fixed or determinable; and (4) collectability is reasonably assured. We consider the evidence of arrangement criteria to be satisfied when we have a compensation contract with the carrier and upon the earlier of (a) confirmation of policy issuance from the carrier or (b) receipt of payment from the carrier. Because we have no obligation to provide services once a policy has been issued, services are considered to have been rendered upon the earlier of confirmation of the policy issuance from the carrier or receipt of payment from the carrier. Due to the complexity and uncertainty around the amount and timing of carrier commissions, the commission amount is considered fixed and collectable upon receipt of payment from the carrier, provided the commission is not subject to refund. In instances where a refund provision exists, revenue that is subject to refund is deferred until the refund provision has lapsed.
Deferred revenue consists primarily of commission payments received from insurance carriers for which the associated refund provisions have not yet lapsed.
Stock-Based Compensation
We recognize compensation costs related to stock options granted to employees based on the estimated fair value of the awards on the date of grant, net of estimated forfeitures. The grant date fair value of the stock option awards is generally recognized on a straight-line basis over the service period, which is generally the vesting period of the respective awards. The fair value of option awards is estimated at the date of grant using the Black-Scholes-Merton option-pricing model, which requires the use of highly subjective and complex assumptions, including the following:
| • | Expected volatility. Because we have no trading history, the expected volatility is derived from historical volatilities of several unrelated public companies with characteristics deemed to be comparable to our business. When making the selections of our peer companies, we considered the size and operational and economic similarities to our business operations. |
| • | Expected term. The expected term represents the period that our stock-based awards are expected to be outstanding, and was primarily determined using the simplified method in accordance with guidance provided by the Securities and Exchange Commission. The simplified method calculates the expected term as the average of the time-to-vesting and the contractual life of the options. |
-64-
Table of Contents
| • | Risk-free interest rate. The risk-free interest rate is based on the U.S. Treasury yield in effect at the time of grant for zero coupon U.S. Treasury notes with maturities approximately equal to each award’s expected term. |
| • | Expected dividend rate. The expected dividend rate was assumed to be zero on all grant dates as we had no plans to pay regular dividends during these periods. |
| • | Fair value of common stock. Because our stock is not publicly traded, we must estimate the fair value of common stock, as discussed in “Common Stock Valuations” below. |
In addition to assumptions used in the Black-Scholes-Merton option-pricing model, we must also estimate a forfeiture rate to calculate the stock-based compensation for our option awards. Our forfeiture rate is based on an analysis of our actual forfeitures. We will continue to evaluate the appropriateness of the forfeiture rate based on actual forfeiture experience, analysis of employee turnover and other factors. Changes in the estimated forfeiture rate can have a significant impact on our stock-based compensation expense as the cumulative effect of adjusting the rate is recognized in the period in which the forfeiture estimate is changed.
The fair value of options granted to employees and directors was estimated using the following weighted-average assumptions:
| Year Ended June 30, | Nine Months Ended March 31, |
|||||||||||||||||||
| 2009 | 2010 | 2011 | 2011 | 2012 | ||||||||||||||||
| Expected volatility |
33.0 | % | 36.0 | % | 36.5 | % | 36.0 | % | 38.7 | % | ||||||||||
| Expected term (in years) |
6.08 | 6.08 | 6.08 | 6.08 | 6.08 | |||||||||||||||
| Risk-free interest rate |
2.3 | % | 2.3 | % | 2.2 | % | 2.6 | % | 1.3 | % | ||||||||||
| Expected dividend rate |
0.0 | % | 0.0 | % | 0.0 | % | 0.0 | % | 0.0 | % | ||||||||||
| Fair value of common stock |
$ | 0.31 | $ | 1.14 | $ | 1.70 | $ | 1.70 | $ | 8.86 | ||||||||||
As of March 31, 2012, we had $1.2 million of unrecognized stock-based compensation expense, net of estimated forfeitures, that is expected to be recognized over a weighted-average period of 2.8 years. In future periods, our stock-based compensation expense is expected to increase as we recognize compensation expense associated with the vesting of these awards and as we issue additional stock-based awards to attract and retain employees.
We account for stock options issued to non-employees based on the fair value of the awards also determined using the Black-Scholes-Merton option-pricing model. The fair value of stock options granted to consultants is re-measured as the stock options vest, and the resulting change in value, if any, is recognized in our consolidated statement of operations during the period the related services are rendered.
We will continue to use judgment in evaluating the expected volatility, expected term and forfeiture rates related to our stock-based compensation on a prospective basis. As we continue to accumulate additional data related to our common stock, we may have refinements to the estimates of our expected volatility, expected terms and forfeiture rates, which could materially impact our future stock-based compensation expense.
-65-
Table of Contents
Common Stock Valuations
The following table summarizes all stock option grants since the beginning of fiscal 2011 through the date of this prospectus:
| Grant Date |
Number of Stock Options Granted(1) |
Exercise Price Per Share(1) |
Common Stock Fair Value Per Share at Grant Date |
|||||||||
| August 17, 2010 |
50,000 | $ | 1.54 | $ | 1.54 | |||||||
| November 16, 2010 |
17,500 | 1.54 | 1.54 | |||||||||
| December 15, 2010 |
15,000 | 1.54 | 1.54 | |||||||||
| February 17, 2011 |
91,500 | 1.84 | 1.84 | |||||||||
| August 15, 2011 |
70,000 | 9.00 | 9.00 | |||||||||
| August 29, 2011 |
199,511 | 9.00 | 9.00 | |||||||||
| January 24, 2012 |
22,250 | 7.20 | 7.20 | |||||||||
| April 10, 2012 |
13,750 | 9.15 | 9.15 | |||||||||
| (1) | On August 29, 2011 and December 28, 2011, we implemented option adjustments to the number of shares subject to outstanding options and the applicable exercise prices to mitigate the dilutive effect of certain dividends as described above in “Dividend-Related Option Adjustments.” The values in the table above reflect the number of stock options, exercise price per share and common stock fair value per share at grant date and do not reflect any subsequent adjustment to the options that were granted prior to these dividends. |
Based upon an assumed initial public offering price of $ per share, the midpoint of the range set forth on the front cover of this prospectus, the aggregate intrinsic value of options outstanding as of March 31, 2012 was $ million, of which $ million related to vested options and $ million related to unvested options.
Since 2007, we have obtained valuation analyses prepared by a third-party valuation firm to assist us in determining the fair value of our common stock. The valuations used methodologies, approaches and assumptions consistent with the American Institute of Certified Public Accountants Practice Guide, Valuation of Privately-Held-Company Equity Securities Issued as Compensation. In obtaining third-party valuations of our common stock, our management provided the third-party valuation firm with financial projections and information about our prospects, our performance and economic and financial market conditions, which the valuation firm used, along with other information, to perform its valuation analysis. These valuations were reviewed by our management and either the board of directors or the compensation committee of the board of directors in conjunction with stock option grants. In determining the fair value of our common stock, the board of directors considered these valuation reports and numerous objective and subjective factors to determine the best estimate of the fair value of our common stock including the following:
| • | the prices, rights, preferences and privileges of our convertible preferred stock relative to the common stock; |
| • | our operating and financial performance; |
| • | current business conditions and projections; |
| • | the likelihood of achieving various liquidity scenarios, such as an initial public offering or a sale of our company; |
| • | the illiquidity of stock-based awards involving securities in a private company; |
| • | the market performance of comparable companies in the health insurance industry; |
| • | our stage of development; |
| • | industry information such as market size and growth; and |
| • | macroeconomic conditions. |
-66-
Table of Contents
In order to determine the fair value of our common stock underlying option grants, we first estimated our business equity value, using a combination of two generally accepted approaches: the income approach using the discounted cash flow method and the market-based approach using the comparable company method. The income approach estimates the equity value of our company based on the present value of future estimated cash flows over a forecasted period and an estimate of the present value of cash flows beyond that period, which is referred to as a terminal value. These future cash flows are discounted to their present values using a discount rate which accounts for the time value of money and the appropriate degree of risks inherent in the business. The market-based approach considers multiples of financial metrics based on both acquisitions and trading multiples of a selected peer group of companies. These multiples are then applied to our financial metrics to derive a range of equity values. Once calculated, the discounted cash flow and comparable company methods were weighted to produce a combined equity value.
The aggregate equity value is then allocated to each of our classes of stock using either the option pricing method, or the OPM, or the probability weighted expected return method, or the PWERM. The OPM models the fair value of a company’s capital structure as a series of call options on the proceeds expected from a liquidity event, such as a sale or initial public offering, at some future date. The model estimates the fair value of each class of securities as a function of the current estimated fair value of the company and assumptions based on the rights and preferences of the respective class. Under the OPM, the equity value is allocated to the convertible preferred stock, common stock and stock options using the Black-Scholes-Merton option valuation methodology. To determine the assumptions to be used in the Black-Scholes-Merton valuation, the time to liquidity is estimated, the risk-free rate is based on the rate available on a government security whose term matches the assumed time to liquidity, and the volatility assumption is based on the historical stock performance for comparable public companies, with consideration for the relative lifecycle stage of the company. Using the PWERM, the value of the common stock is estimated based on the likelihood of future business outcomes including initial public offering, sale or merger, continuing as a private company, or bankruptcy/liquidation. For each equity value scenario, the appropriate aggregate equity value is allocated to the common stock based on the rights and preferences of each class of stock at that time. A probability estimate is applied to each of these scenarios in order to derive a weighted common stock value.
Significant factors considered by our board of directors in determining the fair value of our common stock on the stock option grant dates included the following:
August 2010, November 2010 and December 2010
The stock options granted in these periods had an exercise price of $1.54 per share, which has subsequently been adjusted to an exercise price of $1.20 per share in connection with the dividend-related option adjustments. Our board of directors determined the $1.54 per share price taking into account the third-party valuation of our common stock performed as of May 31, 2010, which estimated that the fair value of our common stock at that time was $1.54 per share. This equity value was determined using the market and income approaches, adjusted for cash on hand and debt with a relative weighting of 60% assigned to the market approach and 40% to the income approach. While the range of values derived from the market and income approaches were closely aligned, we weighted the market approach higher because we found numerous, consistent data points from comparable public companies and transactions that were similar in nature to our actual historical performance and short-term future expectations. A discount rate of 35% was applied to the values derived from the income approach. The equity value was allocated to the common stock utilizing the OPM based on the following inputs: a risk free rate of 0.8%; volatility of 56.1%; a time to liquidity of two years; weighting of a sale scenario of 95%; and weighting of an IPO scenario of 5%. Finally, the valuation applied a marketability discount of 30%, to account for the lack of liquidity relative to a public market.
For purposes of the stock option grants in August through December 2010, our board of directors determined that there had been no significant change in our business or prospects that would warrant a different valuation than the fair value of our common stock determined in May 2010. Our outlook regarding revenue and
-67-
Table of Contents
earnings forecasts remained consistent throughout this period, and there were no material changes in our expectations regarding enrollment targets and achievement or any indication of a change in liquidity event timing. As such, our board of directors continued to grant stock options with an exercise price equal to the fair value reflected in the May 31, 2010 valuation.
February 2011
The stock options granted in this period had an exercise price of $1.84 per share, which has subsequently been adjusted to an exercise price of $1.44 per share in connection with the dividend-related option adjustments. Our board of directors determined the $1.84 per share price taking into account the third-party valuation of our common stock performed as of December 31, 2010, which estimated that the fair value of our common stock at that time was $1.84 per share. This equity value was determined using the market and income approaches, adjusted for cash on hand and debt with a relative weighting of 60% assigned to the market approach and 40% to the income approach. While the range of values derived from the market and income approaches were closely aligned, we weighted the market approach higher because we found numerous, consistent data points from comparable public companies and transactions that were similar in nature to our actual historical performance and short-term future expectations. A discount rate of 35% was applied to the values derived from the income approach. The equity value was allocated to the common stock utilizing the OPM based on the following inputs: a risk free rate of 0.6%; volatility of 55.0%; a time to liquidity of two years; weighting of a sale scenario of 95%; and weighting of an IPO scenario of 5%. Finally, the valuation applied a marketability discount of 29%, to account for the lack of liquidity relative to a public market.
In January and February 2011, the U.S. economy and the financial and stock markets continued to recover and perform favorably. Additionally, in late December 2010, we successfully closed a large public sector employer account for an off-cycle transition in mid-2011, which provided greater certainty around our enrollment target achievement for fiscal 2011 and represented an important milestone in our public sector sales strategy. However, as a result of lower enrollment results than planned for AEP 2011, we reduced our fiscal 2011 and 2012 enrollments targets, which had a negative impact on our revenue and earnings forecasts for these periods. Based on the third-party valuation and the factors described above, our board of directors determined that the fair value reflected in the December 31, 2010 valuation analysis was appropriate and granted stock options with an exercise price at that level.
August 2011
The stock options granted in this period had an exercise price of $9.00 per share, which has subsequently been adjusted to an exercise price of $6.98 per share in connection with the dividend-related option adjustments. Our board of directors determined the $9.00 per share price taking into account the third-party valuation of our common stock performed as of June 30, 2011, which estimated that the fair value of our common stock at that time was $9.00 per share. This increase in equity value reflected the introduction of a PWERM to estimate the fair value of our common stock, in addition to the OPM. While the OPM is generally utilized when future outcomes are difficult to predict, the PWERM is more appropriate to use as certainty develops regarding possible discrete events. Given the improvement in the public markets subsequent to February 2011, the Company began to strongly consider pursuing an initial public offering. Accordingly, during June 2011, we met with investment bankers and began to prepare for an IPO, which helped to solidify the range of discrete liquidity events. As such, we began utilizing the PWERM in our determination of the fair value of our common stock beginning in June 2011. The valuation analysis considered three discrete potential scenarios as follows: IPO; company sale; and continuation as a private company (status quo). The valuation analysis further refined the company sale scenario to include (a) dissolution by a financial investor; (b) a sale to a financial buyer; and (c) a sale to a strategic buyer. The IPO and traditional sale scenarios relied on market approaches to estimate equity value, while the status quo scenario relied on an income approach, applying a 20% discount rate to forecasted cash flows. Both scenarios assumed a volatility rate of 40%. The dissolution scenario relied on an asset approach to value net assets, with consideration for certain intangible assets. The resulting equity value was allocated to common stock by utilizing a PWERM for the IPO and sale scenarios and
-68-
Table of Contents
an OPM for the status quo scenario. For the purpose of allocating equity value, we assumed a 70% probability of IPO or sale, a 25% probability of continuing as a private company and a 5% probability of dissolution.
From January 2011 through July 2011, the U.S. economy, as well as the global economy, improved and the corporate valuations for both IPOs and acquisitions increased. Given the improved market outlook, we began preparing for an IPO and met with investment bankers in June 2011 to further discuss this strategy. Our fiscal 2011 actual financial results were materially better than previous estimates, and we implemented enhancements in our key revenue reporting systems and processes which provided improved visibility into our commission rates, number of active members and member retention assumptions. As a result, in connection with our annual budget cycle, we adjusted our forecast assumptions, which significantly increased our revenue and adjusted EBITDA forecasts for fiscal 2012 and resulted in an appreciable increase in our equity values under both the market and income approaches. Our liquidity position had also increased significantly as we ended fiscal 2011 with a balance of $38.8 million in cash, cash equivalents and short-term investments. Based on the third-party valuation and the factors described above, our board of directors determined that the fair value reflected in the June 30, 2011 valuation analysis was appropriate and granted stock options with an exercise price at that level.
January 2012
The stock options granted in this period had an exercise price of $7.20 per share. Our board of directors determined the $7.20 per share price taking into account the third-party valuation of our common stock performed as of December 29, 2011, which estimated that the fair value of our common stock at that time was $7.20 per share. This equity value was determined using both the PWERM and the OPM. The valuation analysis considered three discrete potential scenarios as follows: orderly liquidation or dissolution; liquidity event for existing stockholders (dual track exit); and continuation as a private company (status quo). The valuation analysis further refined the dual track exit scenario to include (a) initial public offering; (b) sale to a financial buyer; and (c) sale to a strategic buyer. The dual track exit scenario relied on market approaches to estimate equity value, while the status quo scenario relied on an income approach, applying a 19% discount rate to forecasted cash flows. Both scenarios assumed a volatility rate of 40%. The dissolution scenario relied on an asset approach to value net assets, with consideration for certain intangible assets. The resulting equity value was allocated to common stock by utilizing a PWERM for the IPO and sale scenarios and an OPM for the status quo scenario. For the purpose of allocating equity value, we assumed a 70% probability of IPO or sale, a 25% probability of continuing as a private company and a 5% probability of dissolution.
Beginning in November 2011, the financial and stock markets began to show some signs of recovery, after several months of uncertainty stemming from the European debt crisis and U.S. credit rating downgrade. With this improvement in the external markets, we renewed our focus on the initial public offering and continued our readiness efforts to achieve this initiative. During our fiscal second quarter, we successfully completed our 2012 annual enrollment season, achieving our internal performance targets while meeting our service objectives. While the business outlook continued to be positive, we did not make any material changes to our enrollment assumptions or financial forecasts during this period. In August 2011 and December 2011, we distributed an aggregate of $39 million in cash dividends to our existing investors, an average of $2.40 per share of common and preferred stock outstanding. The fair value of the common stock decreased in direct correlation with the dividend amounts, reflecting the reduction in our assets as a result of the distribution to stockholders. Based on the third-party valuation and the factors described above, our board of directors determined that the fair value reflected in the December 29, 2011 valuation analysis was appropriate and granted stock options with an exercise price at that level.
April 2012
The stock options granted in this period had an exercise price of $9.15 per share. Our board of directors determined the $9.15 per share price taking into account the third-party valuation of our common stock performed as of March 28, 2012, which estimated that the fair value of our common stock at that time was $9.15
-69-
Table of Contents
per share. This equity value was determined using both the PWERM and the OPM. The valuation analysis considered two discrete potential scenarios as follows: liquidity event for existing stockholders (dual track exit) and continuation as a private company (status quo). The valuation analysis further refined the dual track exit scenario to include (a) initial public offering; (b) sale to a financial buyer; and (c) sale to a strategic buyer. The dual track exit scenario relied on market approaches to estimate equity value, while the status quo scenario relied on an income approach, applying a 19% discount rate to forecasted cash flows. Both scenarios assumed a volatility rate of 45%. The resulting equity value was allocated to common stock by utilizing a PWERM for the IPO and sale scenarios and an OPM for the status quo scenario. For the purpose of allocating equity value, we assumed an 80% probability of IPO or sale and a 20% probability of continuing as a private company.
During the first calendar quarter of 2012, the U.S. equity markets continued to perform well, with the S&P 500 generating the highest first quarter return since 1998. Volatility, as measured by the VIX index, subsided to levels generally thought to support a healthy market for IPOs and, as a result, we elected to move forward with the IPO initiative, filing our initial Form S-1 and two amendments during this time period. The outlook regarding our enrollment target achievement remained positive as we won several new client accounts and continued to build a robust pipeline. Based on the third-party valuation and the factors described above, our board of directors determined that the fair value reflected in the March 28, 2012 valuation analysis was appropriate and granted stock options with an exercise price at that level.
Performance-Based Warrant
In August 2011, we issued a performance-based warrant to one of our channel partners to purchase up to 948,011 shares of our common stock at an exercise price of $10.00 per share. Under the terms of this agreement, the warrant vests and becomes exercisable based on achievement of specified enrollment targets and expires on the earliest of (i) July 15, 2012, (ii) the effective date of our acquisition by another entity or a sale, lease or other disposition of all or substantially all of our assets, or (iii) two days before the commencement of a road show in connection with an initial public offering of our common stock. The fair value of the warrant was determined using the Black-Scholes-Merton option pricing model. We will revalue this warrant each period as enrollment levels are achieved and expense the portion of the warrant that vests each period. During the nine months ended March 31, 2012, we recognized zero expense related to this warrant. We expect the expense related to this stock warrant to increase in future periods as the specified enrollment levels are achieved, triggering the vesting of the underlying shares.
Internal-Use Software Costs
We make assumptions and estimates in determining whether internal-use software will result in additional functionality and the related useful life of the capitalized costs. We capitalize qualifying internal-use software costs incurred during the application development stage, including consulting costs and compensation expenses related to employees who devote time to the development projects. Costs related to preliminary project activities and post implementation activities are expensed as incurred. Amortization is calculated using the straight-line method over the estimated useful life, typically three years, and is recorded as depreciation and amortization expense within service center operating expenses in the consolidated statements of operations. Management evaluates the useful lives of these assets on an annual basis and tests for impairment whenever events or changes in circumstances occur that could impact the recoverability of these assets.
Income Taxes
We account for income taxes under an asset and liability approach for deferred income taxes, which requires recognition of deferred income tax assets and liabilities for the expected future tax consequences of events that have been recognized in our consolidated financial statements, but have not reflected in our taxable income. Estimates and judgments occur in the calculation of certain tax liabilities and in the determination of the recoverability of certain deferred income tax assets, which arise from temporary differences and carry-forwards.
-70-
Table of Contents
Deferred income tax assets and liabilities are measured using the currently enacted tax rates that apply to taxable income in effect for the years in which those tax assets are expected to be realized or settled. We regularly assess the likelihood that our deferred income tax assets will be realized from recoverable income taxes or recovered from future taxable income based on the realization guidance. To the extent that we believe any amounts are more likely than not to be unrealized, we record a valuation allowance to reduce the deferred income tax assets. In the event we determine that all or part of the net deferred tax assets are not realizable in the future, an adjustment to the valuation allowance would be charged to earnings in the period such determination is made. Similarly, if we subsequently determine that deferred income tax assets that were previously thought to be unrealizable become more likely than not of being realized, the respective valuation allowance would be reversed, resulting in a favorable adjustment to earnings in the period that determination is made.
We regularly review our tax positions and benefits to be realized. We recognize tax liabilities based upon our estimate of whether, and the extent to which, additional taxes will be due when such estimates are more-likely-than-not to be sustained. An uncertain income tax position will not be recognized if it has less than a 50% likelihood of being sustained. We recognize interest and penalties related to income tax matters as income tax expense. As of March 31, 2012, we did not have any interest or penalties associated with unrecognized tax benefits.
-71-
Table of Contents
Overview
Extend Health is a leading provider of health benefit management services and operates the largest private Medicare exchange in the United States. As a technology leader in the health insurance industry, we are redefining the manner in which health benefits are offered and delivered. Our solutions create cost savings for our employer clients and provide our individual customers with improved choice and control over their health benefits. Our core solution, ExtendRetiree, enables our employer clients to transition their retirees to individual, defined contribution health plans that provide individuals with a tax-free allowance or “contribution” to spend on their healthcare at an annual cost that the employer controls versus group-based, defined benefit health plans that provide groups of individuals with defined healthcare benefits such as doctor visits, hospitalization and prescription drugs at an uncertain annual cost. ExtendRetiree allows our clients to provide their post-65 retirees with the same or better healthcare benefits at a lower cost to our clients. To date, we have provided an effective alternative to traditional group Medicare health plans for over 150 private and public sector clients, including over 30 Fortune 500 companies such as Caterpillar, General Motors, Honeywell and Whirlpool, and we have helped hundreds of thousands of retirees and their dependents navigate to, evaluate and choose a health plan using our proprietary exchange platform and decision support tools. In addition, we are developing and expanding our solutions to address the pre-65 retiree, or early retiree, and active employee exchange opportunities for our existing and prospective clients.
We provide our solutions through our proprietary technology platform, which integrates our patented call-routing technology, efficient Medicare quoting and enrollment engine, custom-developed CRM system and comprehensive insurance carrier connectivity. We deliver our solution by:
| • | analyzing and optimizing employer healthcare benefit subsidies and developing healthcare coverage strategies so that our clients can predict their future healthcare liabilities and realize immediate and significant cost savings by transitioning their retirees to defined contribution plans; |
| • | managing an exchange of over 75 national and regional insurance carriers offering thousands of health plans that compete on price, coverage and quality; |
| • | simplifying the complexities of Medicare by helping individuals navigate through a meaningful choice of health plans using our proprietary software to analyze employer subsidies, health plan details and individuals’ doctor, hospital and prescription drug needs; |
| • | offering retirees and employees unbiased guidance about their expanded healthcare options and our enrollment services that match their individual health status and financial resources to a specific plan; and |
| • | providing lifelong advocacy and support services for each individual as they engage with insurance carriers beginning with their initial enrollment and continuing as their healthcare needs evolve. |
Today, our core market remains largely unaddressed with an estimated 12 million Medicare-eligible retirees for whom private and public sector employers currently provide some form of group Medicare supplement, Medicare Advantage or Medicare Part D prescription drug coverage. Moreover, we believe that this market will grow significantly as the number of Americans over age 65 continues to grow. We also believe there are significant opportunities to further penetrate our core market and expand into new target markets. For instance, we are leveraging the experience we have gained from our private sector clients to broaden our market presence in the public sector as well as to develop solutions for the early retiree and active employee markets.
Our business continues to benefit from several healthcare industry trends and regulatory changes including increasing healthcare costs, increasing individual responsibility for healthcare costs, an aging population, increasing incentives for employers to eliminate group retiree drug benefits, and recent healthcare reform
-72-
Table of Contents
initiatives. “Guaranteed issue,” the requirement that by 2014 all health plans be offered to all individuals regardless of health status, along with the Federal mandate that states establish health insurance exchanges, will further support the transition from group healthcare coverage to individual health plans.
We generate most of our revenue from the commissions that we receive from insurance carriers for enrolling individuals into their health plans. These commissions result in increasing recurring revenue as our number of active members grows. The vast majority of our revenue is currently derived from Medicare-related plans, including Medicare supplement, Medicare Advantage and Medicare Part D prescription drug plans. As of March 31, 2012, we had 213,900 active core members enrolled in a Medicare supplement or Medicare Advantage plan. Our revenue has grown from $12.4 million in the fiscal year ended June 30, 2008 to $51.1 million in the fiscal year ended June 30, 2011.
Industry Overview
While there were 40.2 million individuals, or 13% of the United States population, over the age of 65 in 2010, this number is expected to increase to approximately 54.8 million individuals, or 16.1% of the United States population, by 2020. Of these individuals, there are currently an estimated 12 million Medicare-eligible retirees with employer-sponsored healthcare coverage provided by private and public sector employers.
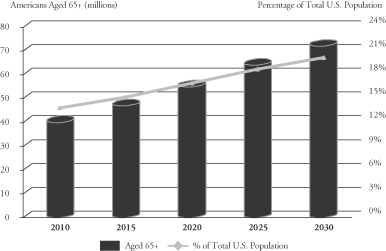
The aging United States population has contributed to a rise in healthcare costs as the “Baby Boomer” generation began turning age 65 in 2011. While post-65 individuals represented only 13% of the U.S. population in 2010, their healthcare costs historically accounted for 36% of total U.S. personal healthcare expenditures according to U.S. Department of Health & Human Services.
-73-
Table of Contents
Partially driven by shifting demographics, healthcare spending in the United States has grown significantly over the past several years and this trend is expected to continue. The Centers for Medicare and Medicaid Services, or CMS, reported that United States healthcare spending reached $2.6 trillion in 2010 representing 17.6% of the nation’s gross domestic product. According to CMS, United States healthcare spending is expected to continue increasing at an average annual rate of 6.2% to approximately $4.6 trillion by 2020.
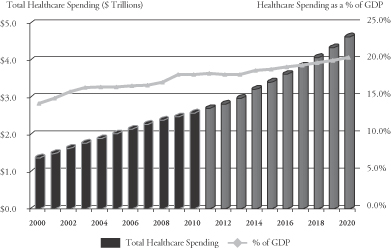
The market for providing health plans and services to employers, employees and retirees in the United States is large and growing with overall increases in healthcare expenditures. In 2010, the United States Census indicated that 256.2 million Americans had health insurance, of which approximately 55.3% received employer-sponsored health insurance and 31% received government-provided health insurance. Cost pressures from the provision of healthcare benefits are leading employers to transition responsibility for those benefits from the employer to the employee, similar to the transition from providing defined-benefit pension plans to providing defined contribution 401(k) plans.
We expect that several trends will continue to expand our market opportunities, including:
| • | Increasing healthcare costs. Healthcare-related costs have become one of the largest benefit-related expenses for employers. CMS estimates that in 2009 private and public sector employers spent $548 billion on healthcare coverage, nearly doubling over the previous 10 years. According to a 2011 Towers Watson report, the cost of insuring employees is projected to have increased by 38% from 2006 to 2011, and employers expect to spend on average more than $8,500 in 2011 on healthcare coverage for each employee. |
| • | Increasing individual responsibility for healthcare costs. In response to rising healthcare costs, many group-based health plans have reduced benefits, shifted costs to retirees and employees, or both. CMS estimates that private health insurance expenditures increased by 91% from 1999 to 2009. According to a 2011 Towers Watson report, the average individual’s share of their total healthcare premium was estimated to have reached 24% in 2011. Furthermore, while healthcare costs have become a top household expense, there has not been a corresponding increase in control and choice over individual healthcare options. |
| • | Aging population. According to the U.S. Census, from 2011 through 2030 an estimated 10,000 individuals per day will reach the age of 65 and become eligible for Medicare. The number of individuals who are over the age of 65 is expected to increase from approximately 40.2 million individuals in 2010, or 13% of the U.S. population, to approximately 54.8 million individuals by 2020, or 16% of the U.S. population. Moreover, post-65 individuals are becoming increasingly comfortable using technology to research personal healthcare information. |
-74-
Table of Contents
| • | Increasing incentives for employers to eliminate group retiree drug benefits. In 2013, employers’ tax deduction for the Retiree Drug Subsidy, or the RDS, will be eliminated, thereby increasing employers’ cost of providing prescription drug coverage to retirees using group-based health plans. In addition, while there has historically been a gap in Medicare’s prescription drug coverage, upcoming changes to Medicare Part D will gradually eliminate this gap by 2020. We believe that the elimination of the tax-deductibility of the RDS together with the closing of the gap in Medicare Part D prescription drug coverage will make individual Medicare plans more attractive to employers and retirees. |
| • | Healthcare reform. Over the past decade, certain Federal legislation in the United States, such as the Medicare Modernization Act and the Medicare Improvement for Patients and Providers Act, has strengthened the foundation on which we have built our business model. More recent healthcare reform legislation requires that states establish health insurance exchanges where individuals can select and purchase health plans. In addition, just as private Medicare plans are required to do today, healthcare reform will require insurance carriers to offer standardized plan designs and accept all pre-65 individuals, regardless of their age or health status, which is referred to as “guaranteed issue.” While healthcare reform involves uncertainty and may be modified or repealed, we believe that these healthcare reform measures will accelerate the adoption of exchanges, further enabling the transition of healthcare in the United States from group-based coverage to individual plans. For more information about the potential impacts of healthcare reform on our business, see “Risk Factors—Changes and developments in the health insurance system in the United States could harm our business.” According to a 2011 McKinsey survey, 45% to 50% of employers indicated that they will “definitely” or “probably” pursue alternatives to employer-sponsored insurance after 2014 as a result of this recent healthcare reform. |
Summary of Key Industry Segments
Retirees with Employer-Sponsored Healthcare Coverage
There are an estimated 12 million Medicare-eligible retirees receiving employer-sponsored health insurance in the United States. According to a 2011 Kaiser Family Foundation survey, 60% of all public and private employers offer health benefits—approximately 99% of employers with 200 or more employees and 59% of employers with less than 200 employees. Of those firms that offer health benefits, 26% of employers with 200 or more employees and 6% of employers with less than 200 employees offer retiree health benefits. Additionally, public sector employers with more than 200 employees are more likely than private employers to offer retiree health benefits with 83% of such state and local entities offering some form of employer-sponsored health benefit to their retirees. Employers that sponsor retiree health benefits generally transition their post-65 retirees from the active employee group health plan to group Medicare Advantage or to Medicare Supplement plans. Employers sponsor their retirees’ health insurance either by contributing to premiums for group health plans or by providing a fixed subsidy to the retiree for the purchase of individual health plans.
Retirees without Employer-Sponsored Healthcare Coverage
CMS estimates that the total population of Medicare-eligible individuals will increase from 48 million individuals in 2010 to 64 million individuals in 2020. We estimate that approximately 32 million Medicare enrollees do not receive any form of supplemental healthcare benefits from their employers. Post-65 retirees without employer-sponsored healthcare coverage have to obtain Medicare supplemental insurance on their own. Individuals seeking coverage not sponsored by employers can utilize independent brokers or basic government tools to find and purchase coverage.
Employees with Employer-Sponsored Healthcare Coverage
The market for private health insurance in the United States that is sponsored or subsidized by employers can be segmented by sector—private employers and public employers. While large private employers with 200 or more employees are typically sophisticated buyers of health insurance, with many offering several differing levels of benefits, most private employers are small employers with fewer than 200 employees. There are
-75-
Table of Contents
approximately six million small private employers in the United States, with the majority having fewer than 10 employees. The majority of these small private employers offer some form of health benefits to their employees; however, less than one third of companies with 10 employees or fewer offer health benefits. With respect to public employers, the United States Census estimates that there were approximately 17.5 million full-time employees in state and local governments, public school systems, and other government institutions in 2009. Public employers have historically provided their employees with generous healthcare coverage. However, rising healthcare costs, tighter budgets, and new financial reporting disclosures are forcing many of these employers to explore options to reduce their health insurance costs.
Employees without Employer-Sponsored Healthcare Coverage
In the United States, employers are not required to provide healthcare coverage to employees. In 2009, approximately 27 million individuals, or 8.9% of the United States population purchased private insurance that was not sponsored by their employer. Historically, a limited number of healthcare options and services have been available to these employees due to the complexity and administrative costs associated with the typical health insurance application process. In addition, in most states, insurance carriers are permitted to screen non-Medicare eligible individuals for pre-existing conditions and determine rate and packages based on their health risks. However, we believe that the enactment of the Patient Protection and Affordable Care Act, or PPACA, which implements guaranteed issue, should drive significant changes in the market for private healthcare coverage for employees whose healthcare coverage is not sponsored by their employer.
Market Opportunity
Core Market Opportunity
Today, our core market is the estimated 12 million Medicare-eligible retirees currently receiving some form of employer-sponsored group healthcare coverage. While we have provided health benefit management services to hundreds of thousands of retirees and their dependents, we see opportunities to further penetrate this market. For example, we are broadening our presence among public sector employers, such as through our engagement with the State of Nevada to transition their retirees to individual Medicare plans.
Additional Market Opportunities
We are also developing solutions to address the needs of new target markets, including:
| • | Approximately 6 million early retirees with employer-sponsored healthcare coverage who are not Medicare-eligible. Typically, early retirees remain with their former employer’s group health plan, even if it is not the plan that best fits their needs. However, because PPACA provides for guaranteed issue plans by 2014, we believe an increasing number of healthcare coverage alternatives will become available to this segment. |
| • | Approximately 150 million active employees with group coverage. Increasing healthcare costs are expected to drive employers to consider alternatives to traditional employer-sponsored group health plans. We expect that the availability of guaranteed issue plans beginning in 2014 will reduce the advantages of traditional group health plans. |
| • | Approximately 32 million Medicare enrollees who do not have employer-sponsored healthcare coverage. We expect this market opportunity to grow over the near-term as the total size of the Medicare-eligible market increases to 64 million Americans by 2020, driven primarily by the increase in the number of post-65 individuals. |
| • | Approximately 24 million individuals purchasing through exchanges. PPACA mandates that individuals and small employers will be able to shop for insurance from a range of health plans through public exchanges by 2014. The Congressional Budget Office estimates that nine million individuals will use the public exchanges in 2014 and that this number could increase to approximately 24 million individuals by 2021. |
-76-
Table of Contents
Our Solutions
Our innovative solutions enable our clients to reduce and cap the costs of providing healthcare benefits while empowering individuals to better manage their healthcare expenses and play a more active role in selecting the health plans that best meet their needs. ExtendRetiree, our core solution today, enables our clients to transition their Medicare-eligible retirees from group-based defined benefit health plans to individual, defined contribution health plans. We provide our clients’ retirees with access to more than 75 insurance carriers offering thousands of unique health plans, and our proprietary software platform presents these retirees with the available plans that best meet their individual needs.
Our proprietary technology platform delivers our integrated solutions to our clients, customers and carrier partners through a multi-step process that starts with an actuarial assessment for a prospective employer client to determine the financial benefits of transitioning their retirees to ExtendRetiree. This analysis determines the optimal subsidy levels needed from the employer to support the transition of its retirees from their existing group-based health plan to individual health plans and enables employers to accurately quantify the expected reduction in their long-term healthcare financial obligations.
Once our employer clients have determined optimal subsidy levels, our proprietary software securely gathers and assimilates personal healthcare data from our clients and their retirees, as well as health plan information from our insurance carrier partners to ensure a smooth enrollment process. Concurrently, we work with our employer clients to design a communication campaign to educate their retirees with respect to the transition from their current group health plan to an individual health plan.
With the client and customer data integrated into our system, our patented call-routing technology provides our licensed benefit advisors with immediate access to a retiree’s profile that includes personalized information about the retiree’s healthcare needs and available subsidy. Our proprietary decision support tools then present the benefit advisor with a selection of health plans that has been optimized for the retiree’s unique healthcare needs. The benefit advisor then helps the retiree select and enroll in a plan by guiding the retiree through our streamlined application process.
The retiree’s application is then transmitted through our efficient and secure electronic exchange to the selected insurance carrier, allowing our customers to monitor the status of their application throughout the enrollment process. Our comprehensive platform also provides our clients with regular reports with which they can track their retiree enrollment metrics.
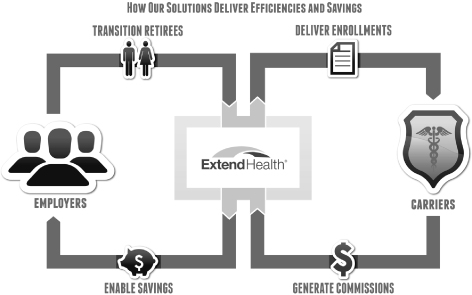
-77-
Table of Contents
We believe that our exchange platform and services differentiate us from our competition and enable us to act as a long-term partner for our clients and customers.
Benefits to Employer Clients
| • | Control the costs associated with offering healthcare benefits. Our solutions enable our clients to continue to offer healthcare benefits to their retirees and employees while capping and controlling the costs associated with honoring these healthcare commitments by transitioning from defined benefit to defined contribution health plans that have a fixed cost that the employers control. This transition from defined benefit to defined contribution health plans also results in reductions to our clients’ long-term healthcare liabilities, which are no longer required to accrue on our clients’ balance sheets. |
| • | Eliminate the burden of administering health plans. We help clients eliminate the burden of procuring and administrating inefficient group health plans for geographically dispersed retirees. We also reduce the costs and complexities associated with providing healthcare coverage to geographically dispersed retirees and employees. We establish Health Reimbursement Arrangement, or HRA, funding accounts for our clients, which allow our clients to set aside funds to reimburse medical expenses paid by their retirees on a tax-advantaged basis, and we provide advice regarding decision points such as HRA eligibility, funding amounts and allocations, and whether HRA funds should rollover from year to year. We, or one of our third-party administrator partners, provide ongoing HRA administration services for our clients, ensuring continued administrative efficiencies. |
| • | Ensure a smooth transition from group to individual health plans. We provide access to a proprietary health insurance exchange platform and a dedicated implementation team that delivers a complete suite of services, communication materials and education to help ensure a successful transition to individual health plans. Our experienced account managers, client services implementation specialists, benefit advisors and customer service representatives work closely with each client to ensure that customers are fully informed throughout the transition. |
Benefits to Individual Customers
| • | Compare a broad selection of specific plans, insurance carriers and provider networks. Our exchange platform provides our customers with access to a broad choice of individual health plans, insurance carriers and provider networks. This breadth of choice available on our exchange platform is not available from any single group health plan or from any individual insurance broker. |
| • | Choose a health plan that best meets their needs. Our exchange platform incorporates advanced decision support tools that help our customers optimize their employer subsidy and understand and evaluate the health plans available to them. Through these tools, individuals receive side-by-side plan comparisons, online quotes by plan type, estimates of out-of-pocket expenses, and plan recommendations based on their healthcare needs and preferences. |
| • | Receive ongoing guidance, enrollment, advocacy and support. Our licensed benefit advisors provide our customers with ongoing unbiased guidance, enrollment services, advocacy and support. Before and after enrollment, we advocate on behalf of customers with insurance carriers to resolve disputes and handle matters relating to their health plans. Our benefit advisors are highly knowledgeable and equipped with detailed customer data that enable them to understand the specific needs of each eligible individual. We hire and train all of our own benefit advisors, who typically hold multiple state insurance licenses, carrier appointments and certifications and receive annual training at Extend University, a six-week in-house training and continuing education course. |
Our Strengths
We believe that we have the following key competitive strengths:
| • | Proprietary exchange platform. Our proprietary exchange platform integrates our patented call-routing technology, proprietary Medicare quoting and enrollment engine, custom-developed CRM system and |
-78-
Table of Contents
| comprehensive insurance carrier connectivity. We believe that our technology platform has enabled us to become the largest private Medicare exchange platform in the United States. Our proprietary software employs complex algorithms to deliver personalized health plan options from a broad range of insurance carriers by analyzing our customers’ doctor, hospital and prescription drug needs. Complemax, our patented call distribution system, analyzes and distributes inbound customer calls to the best-matched benefit advisor. Our flexible technology architecture scales to support large and small clients with varied needs. Additionally, our experience with insurance exchange platforms allows us to focus on developing innovative solutions and services for the early retiree and active employee markets. |
| • | Attractive, proven business model. Our high customer retention rate and commission-based revenue model produces a stable and recurring revenue stream. The scalability of our operations, data centers and technology platform provides operating leverage and opportunities for margin growth as we add customers to our exchange platform. Additionally, we leverage channel partners, including four leading benefit consultants in the United States, to simultaneously lower acquisition costs and increase revenue potential. |
| • | Trusted brand name and exceptional service and support. We have built a trusted and recognized brand with employers and individuals and within the health insurance industry. Our unbiased customer service and support teams are not incentivized to recommend any particular insurance carrier, which helps ensure that customers are presented with the health plans that best suit their specific needs. We have extensive experience having transitioned large private and public employers such as Honeywell and the State of Nevada, and our historical client retention rate exceeds 95% with our core products, which is a testament to our trusted brand name and exceptional service and support. |
| • | Strong relationships with a large number of insurance carriers. We offer our customers access to a broad selection of health plans from insurance carriers with which we have developed relationships over the past seven years. Our solutions are integrated with the information systems of our insurance carrier partners, which we believe results in a better customer experience, reduced customer turnover and greater efficiency for the insurance carriers. We continue to develop new relationships with insurance carriers and various types of health plans on an ongoing basis. |
| • | Experienced management team. Our management team has significant experience in the health insurance and healthcare technology industries, and with using new business models to more efficiently deliver healthcare benefits. Furthermore, the members of our management team have been and remain deeply involved in industry organizations and are recognized as thought leaders in the fields of healthcare exchanges and health benefit management. Early in our company’s history we identified a future trend whereby employers would move from providing defined benefit group health plans to providing account-based individual health plans, and we positioned ourselves to capitalize on this new market reality. Our leadership efforts have resulted in a reputation for the development of innovative solutions that meet the future needs of the dynamic, evolving U.S. healthcare system. |
Our Growth Strategies
Our objective is to become the health benefit manager of choice for private and public sector employers, post-65 and early retirees and active employees. We intend to accomplish this by offering a comprehensive suite of insurance plan selections, pricing and coverage tools, and electronic comparison and enrollment capabilities to enable individuals to select health plans that best meet their individual needs while maximizing the cost effectiveness of their employers’ contributions to their healthcare coverage. As we grow, we intend to increase our plan offerings to serve a broader market that includes early retirees, active employees and individuals who currently do not receive employer-sponsored health insurance. Our principal strategies to meet our objectives are:
| • | Expand market share within the private sector in our core market. To date, our growth has been driven primarily by serving the needs of our core market, which we define as post-65 retirees who are covered by an employer-sponsored health plan. With an estimated 6.2 million retirees that have a |
-79-
Table of Contents
| health insurance plan sponsored by their private sector employer, we believe there is a large opportunity to expand our market share in the private sector employer market. We intend to aggressively pursue opportunities to help private sector employers transition their retirees to individual health plans using our proprietary exchange platform. |
| • | Increase our presence in the public sector. With an estimated 5.8 million retirees who have a health plan sponsored by their public sector employer, we believe there is a significant opportunity to expand our market share in the public sector employer market. We are leveraging our private sector experience and initial public sector engagements to capture the growing demand by public sector employers for a private exchange platform resulting from state budget shortfalls and growing unfunded retiree liabilities. According to the Pew Center on the States, the gap between promises made for state employees’ retirement benefits and the money set aside by the states to fulfill those promises grew 26% to $1.26 trillion in 2009, with healthcare and other non-pension benefits making up $607 billion of the shortfall. New accounting rules for public sector entities are highlighting these issues by requiring public sector employers to measure and report their liabilities for promised post-employment benefits. We expect this to drive increased demand from public sector employers for lower-cost healthcare benefits that meet their retirees’ needs. |
| • | Extend Our Technology Leadership Position. Our proprietary technology platform is a key competitive advantage that enhances our ability to provide our clients and customers with integrated solutions that address their respective healthcare benefit needs. We will continue to innovate and invest in our software platform, call-routing technology, Medicare quoting and enrollment engine, CRM system and insurance carrier connectivity as we believe these investments will allow us to extend our technology leadership position. |
| • | Maximize our existing channel partner strategy and add new channel partners. We have established partnerships with leading benefit consultants and brokers, including Towers Watson, Mercer, Gallagher, Lockton, Wells Fargo Insurance Services and Willis. We intend to roll out additional solutions that will allow our channel partners to deliver more value to their clients and prospects. Also, we intend to leverage our existing channel partners and add additional channel partners to gain deeper and broader access to potential clients in both the private and public sectors. |
| • | Cultivate a retail sales channel. There are approximately 32 million retirees participating in the Medicare program with no employer subsidy. We have begun to adapt our sales and marketing strategy to target these retail customers directly through a variety of consumer-centric media. We believe that this retail sales channel will continue to grow as more Americans turn age 65, affording us direct access to a broader base of potential customers. |
| • | Expand into new markets. We expect the demand for fixed-cost, defined contribution individual plans to grow beyond the Medicare market and are targeting these new opportunities. Initially, we are expanding our solution to help control employers’ early retiree healthcare costs. Due to continued annual healthcare cost inflation and potential excise tax liability under PPACA, our current clients can cut costs by utilizing our platform tailored specifically for early retirees. By building on our solutions for retirees, we also intend to offer solutions for our clients’ active employees. Finally, we are actively pursuing opportunities to work with various states to help them implement the state exchanges mandated by healthcare reform. |
Our Exchange Platform and Services
Within our exchange platform and services, we offer two solutions, ExtendRetiree and ExtendAccess, and are developing a third solution, ExtendExchange. These solution suites provide health plan options to retirees and employees, as well as services to state exchanges.
| • | ExtendRetiree. ExtendRetiree enables clients to transition their retirees from group health plans to individual Medicare supplement, Medicare Advantage and Medicare Part D prescription drug plans. |
-80-
Table of Contents
| Clients can use HRAs to make contributions to each employee’s ongoing qualified medical expenses. ExtendRetiree focuses on providing access to individual Medicare plans for post-65 individuals and other Medicare-eligible individuals. Through the ExtendRetiree platform, we provide information, analyses and quotes to empower individuals to choose from among a broad spectrum of available plans, and we provide continued advocacy and support after enrollment. ExtendRetiree has been selected by more than 150 private and public sector employers, including over 30 companies in the Fortune 500, such as Caterpillar, General Motors, Honeywell and Whirlpool, as the solution to transition their retirees from group health plans to individual health plans. |
| • | ExtendAccess. ExtendAccess enables clients to offer pre-65 individuals access to thousands of health plans offered by leading national insurance carriers, including individual major medical, short-term major medical and limited benefit plans. |
| • | ExtendExchange. ExtendExchange is being developed using our existing exchange platform and will allow states to offer exchange-based plans in accordance with PPACA without having to commence a high cost and high risk technology development exercise. The ExtendExchange platform will also allow states to focus on deploying Federal funds provided under PPACA to revamp antiquated Medicaid and related systems, encouraging a more efficient use of Federal funds. |
Our solutions are enhanced by an integrated set of decision support tools, including:
| • | Online Quotes. A convenient tool that provides online quotes to employees for all Medicare plan types, including Medicare Advantage, Medicare Part D prescription drug and Medicare supplement plans. Online quotes for ancillary plans, such as dental and vision plans, are also available. |
| • | Side-by-Side Plan Comparisons. A tool that empowers individuals to compare thousands of plans from more than 75 insurance carriers in a user-friendly format. |
| • | Plans Like Mine. A comparative tool that matches individuals with health insurance plans that most resemble their original group plans, helping to narrow plan options based on prior coverage attributes. |
| • | Help Me Choose. A plan selection tool that evaluates individual healthcare consumption preferences, eligibility and needs to narrow plan options. The criteria analyzed include preferred providers, travel requirements and payment preferences, such as deductibles and monthly premium alternatives. |
| • | Prescription Profiler. A web-based tool that allows individuals to estimate their out-of-pocket prescription drug expenses. Individuals can use this tool to search Medicare plans using their own list of prescriptions to find the lowest-cost coverage options. This tool leverages local pharmacy pricing information to provide expense estimates and matches an individual’s prescription drug usage with plan formularies to optimize coverage and minimize out-of-pocket costs. |
Using these tools, we are able to offer robust and personalized search capabilities, as well as electronic enrollment and direct communication with insurance carriers. We augment these tools with online and telephone support for our individual customers and employer clients.
Sales and Marketing
We use direct sales to acquire new employer clients that then provide us with access to large pools of prospective individual customers. Contracts with our employer clients generally allow us to act as the exclusive advisor to the individual customers during the transition from their existing group health plan to an individual health plan purchased on our exchange platform. We then educate these prospective customers about their health insurance plan options, and our trained and licensed benefit advisors help these individuals enroll in a plan that best fits their needs.
Starting in 2011, we expanded our sales and marketing efforts to include benefit consultants and brokers as an additional sales channel. Our channel partners currently include Gallagher, Lockton, Mercer, Towers Watson,
-81-
Table of Contents
Wells Fargo Insurance Services and Willis. We have entered into written contracts with these consultants and brokers pursuant to which they co-market and, in certain circumstances, jointly promote our services to potential clients for a flat fee or a fee that can be as much as 25% of the commission revenue we receive for related enrollments. These contracts typically have an initial term of three years and can be terminated by either party at the end of the initial term or upon written notice if the other party has materially breached its obligations under the contract. We anticipate that this additional channel will accelerate our enrollment growth going forward.
Carrier Relationships
One of our core strengths is our deep integration with some of the leading insurance carriers in the United States which enables us to offer thousands of health insurance plans on our exchange platform. We currently have relationships with over 75 insurance carriers including UnitedHealthcare, Humana and Aetna, various BlueCross and BlueShield carriers, and regional carriers such as Harvard Pilgrim and Geisinger Health Plan. We have entered into written contracts with each of these carriers pursuant to which our licensed agents are authorized to sell the carriers’ health plans in exchange for the payment of commissions which vary by carrier and by plan. These contracts are typically non-exclusive and terminable on short notice by either party for any reason.
We have developed an efficient agent-carrier contracting, appointment and certification process, with comprehensive enrollment, application delivery and application tracking capabilities. We have also integrated our data systems with those of our carrier partners to enable us to pass electronic enrollment information directly to the enrollment systems of the insurance carriers. This improves enrollment accuracy and reduces our enrollment processing time from a week or more with paper applications to 24 hours or less. In addition, we are also able to receive automated post-enrollment status updates from insurance carriers, which provide our employer clients with increased visibility into the transition, allow for timely and accurate servicing of customer inquiries and help to alleviate customer anxiety around the Medicare enrollment process. We have received numerous awards from our carrier partners that have recognized our high quality of service and efficiency, including, over the past three years, Operational Excellence Certificates from UnitedHealthcare, and 1st place awards for Application Issued Rate, Lowest Complaint Rate, New PDP Production and Lowest Rapid Disenrollment Rate from Coventry Health Care.
To create an improved enrollment experience for our customers, we regularly evaluate insurance carriers by comparing their market presence and brand, cost competitiveness, breadth of plans, emphasis on improving the customer experience, and ability to integrate with our data systems. We plan to continue to expand and adjust the number of insurance carriers with which we partner.
Clients and Customers
Our clients consist of public and private sector employers and unions that choose us to transition their retirees and members from group health plans to individual Medicare Supplement, Medicare Advantage and Medicare Part D prescription drug plans. We currently have more than 150 clients who have contracted to use our services.
Our customers consist of our clients’ retirees and union members whom we assist in transitioning from group health plans to individual plans. As of March 31, 2012, we had 213,900 active members. Alongside their Medicare Advantage, Medicare supplement or Medicare Part D prescription drug plans, we generate additional revenue through the enrollment of our customers in ancillary plans, including vision and dental plans.
Technology
Our custom-developed software and technology, such as our patented call distribution system, proprietary Medicare quoting and enrollment engine, custom-developed customer relationship management, or CRM, software, and comprehensive insurance carrier connectivity facilitate interactions with our employer clients, individual customers and carrier partners.
-82-
Table of Contents
Prior to engaging with a customer over the phone, our software and database systems equip our benefit advisors with the caller’s healthcare and other personal information which allows the benefit advisor to more efficiently answer the caller’s questions and enroll the caller in a health plan. Complemax, our patented call distribution system, is unique in its ability to route customers to the benefit advisor best suited to satisfy the customer’s individual needs based on more than 40 customer-specific variables. Our CRM software leverages our one-of-a-kind enterprise telephony systems, consisting of Complemax, an integrated voice response, or IVR, and call recording systems that have been developed to satisfy the unique requirements of our enrollment and service center so as to optimize the customer experience. Our proprietary Medicare quoting and enrollment engine powers both our online and telephonic customer interactions and enables us to educate the customer about their health plan options and enroll the customer in the Medicare plan that best meets their individual healthcare needs and financial circumstances. Finally, we believe our ongoing commitment to, and investments in, carrier integration and connectivity ensures a scalable and reliable end-to-end enrollment experience for our customers and enables us to provide our customers with superior post-enrollment advocacy and support.
Our approach to software development is focused on building robust and scalable applications to support our growth and changing business requirements. Our proprietary technologies efficiently address key aspects of the health insurance product sales lifecycle—from plan rate and benefit ingestion, presentation and enrollment, and compliance and maintenance to the accounting for, and reconciliation of, commission payments. Our software and systems have been developed to address the needs of employers, individual customers, insurance carriers, benefit advisors and customer service representatives, channel partners and third party administrators.
Our proprietary technology enables us to:
| • | provide a best-in-class experience that helps individuals navigate their health plan options and choose the plan that best meets their individual needs; |
| • | offer benefit advisor support via our scalable industry-leading telephonic, web and integrated CRM support platform; |
| • | extensively integrate with our carrier partners’ plan rating and enrollment systems; and |
| • | promote efficient and accurate enrollments and customer advocacy and support through real-time web service and batch data feeds transmitted between insurance carriers, clients and other partners and our back office systems. |
We develop our web and windows-based software using Microsoft’s best practice guidelines for .NET 4.0 Framework development while leveraging and contributing to the growing .NET open-source software community. Our core data systems utilize Microsoft’s SQL Server 2008 R2 database running AES-192 Transparent Data Encryption. Our databases employ a highly normalized, flexible structure, which self-manages data integrity. Proprietary information is encrypted to promote data security, compliance with the Health Insurance Portability and Accountability Act of 1996, or HIPAA, and identity protection.
Competition
We believe the principal factors on which we compete include the following:
| • | number of available Medicare insurance plans; |
| • | ability to deliver a solution that is fully-integrated throughout the pre-enrollment, enrollment and post-enrollment processes; |
| • | experience transitioning groups of all sizes to individual plans; |
| • | scalable and flexible exchange platform; |
| • | channel partnerships across various market segments; and |
| • | quality and experience of benefit advisors. |
-83-
Table of Contents
We believe that we compete favorably with our competitors that offer insurance exchange platforms on the basis of these factors.
We believe we are uniquely positioned as the largest Medicare exchange platform with the most experience transitioning members of employer group plans to the individual Medicare market. However, there are other companies and government-run health insurance exchanges that compete with portions of our solution. Some of these entities utilize online technology to accept applications and enroll individuals. For example, CMS offers plan information, comparison tools, an enrollment services center and online enrollment for Medicare Advantage and Medicare Part D prescription drug plans, all of which compete with our solutions.
We also generally compete with entities and individuals that offer and sell health insurance plans utilizing traditional distribution channels. These competitors include traditional local insurance agents, large benefit consulting organizations and insurance carriers. Some traditional insurance agents utilize online quoting services and other tools to obtain quotes from multiple insurance carriers and prepare electronic benefit proposals to share with their potential customers.
Many insurance carriers directly market and sell their plans to consumers through call centers and their own websites. We offer health insurance plans for many of these insurance carriers and, as a result, we compete with these carriers directly. Most of these insurance carriers have superior brand recognition, extensive marketing budgets and significant financial resources to influence consumer preferences for searching and buying Medicare health insurance online.
Healthcare Laws and Regulations
Our business is subject to extensive, complex and rapidly changing Federal and state laws and regulations. Various Federal and state agencies have discretion to issue regulations and interpret and enforce healthcare laws. While we believe we comply in all material respects with applicable healthcare laws and regulations, these regulations can vary significantly from jurisdiction to jurisdiction, and interpretation of existing laws and regulations may change periodically. Federal and state legislatures also may enact various legislative proposals that could materially impact certain aspects of our business. The following are summaries of key Federal and state laws and regulations that impact our operations:
Healthcare Reform
In March 2010, the Federal government enacted significant reforms to healthcare legislation through PPACA and the Healthcare and Education Reconciliation Act of 2010, or the HCERA, which we refer to collectively as Healthcare Reform. These laws amended various provisions in many Federal laws, including the Internal Revenue Code, or the Code, the Employee Retirement Income Security Act of 1974, or ERISA, and the Public Health Services Act. In general, Healthcare Reform expands access to coverage and modifies the individual and group insurance market, as well as group health plans (including self-insured plans), employer-sponsored health plans and governmental plans (including Medicare).
Some provisions of Healthcare Reform have already taken effect, while other provisions become effective at various dates in the future. Healthcare Reform is being implemented by the Department of Health and Human Services, or HHS, the Department of Labor and the Department of Treasury. These agencies have already issued a number of proposed, interim final and final regulations, as well as general guidance, on key aspects of Healthcare Reform. However, additional guidance is still to be issued, especially for Healthcare Reform provisions that are effective in 2014. Healthcare Reform is also being challenged in court, where various plaintiffs are seeking to limit the scope of Healthcare Reform or otherwise have Healthcare Reform declared unconstitutional under various legal theories.
-84-
Table of Contents
Medicare Marketing Guidelines
CMS, which is a division of HHS, has established Medicare Marketing Guidelines and various other rules and regulations that apply to the sale of Medicare Advantage, Medicare Advantage prescription drug and Medicare Part D prescription drug plans. The guidelines include various restrictions and controls on how we market Medicare-related products, how we compensate our employees, and how we are compensated by insurance carriers for selling their products. In some cases it is necessary to modify our operations and procedures to comply with these guidelines, and these guidelines are subject to change in the future by CMS.
Fraud and Abuse Laws
Because of the significant Federal funding involved in Medicare, Congress and the states have enacted, and actively enforce, a number of laws whose purpose is to prevent and eliminate fraud and abuse in Federal healthcare programs. Our business is subject to compliance with many of these laws.
Anti-Kickback Laws
In the United States, there are Federal and state anti-kickback laws that generally prohibit the payment or receipt of kickbacks, bribes or other remuneration in exchange for the referral of patients or other health-related business. The United States Federal healthcare programs’ Anti-Kickback Statute makes it unlawful for individuals or entities knowingly and willfully to solicit, offer, receive or pay any kickback, bribe or other remuneration, directly or indirectly, in exchange for or to induce the referral of an individual to a person for the furnishing or arranging for the furnishing of any item or service for which payment may be made in whole or in part under a Federal healthcare program or the purchase, lease or order, or arranging for or recommending purchasing, leasing, or ordering, any good, facility, service, or item for which payment may be made in whole or in part under a Federal healthcare program such as Medicare. Penalties for violations include criminal penalties and civil sanctions such as fines, imprisonment, and possible exclusion from Medicare and other Federal healthcare programs.
Federal Civil False Claims Act and State False Claims Laws
The Federal civil False Claims Act imposes liability on any person or entity who, among other things, knowingly presents, or causes to be presented, a false or fraudulent claim for payment by a Federal healthcare program, including Medicare. The “qui tam” or “whistleblower” provisions of the False Claims Act allow a private individual to bring actions on behalf of the Federal government alleging that the defendant has submitted a false claim to the Federal government, and to share in any monetary recovery. The False Claims Act also has been used to assert liability on the basis of misrepresentations with respect to the services rendered in connection with Medicare. Our future activities relating to the manner in which we sell and market our services may be subject to scrutiny under these laws.
HIPAA, Privacy and Data Security Regulations
By processing data on behalf of our clients and customers, we are subject to specific compliance obligations under privacy and data security-related laws, including HIPAA, the Health Information Technology for Economic and Clinical Health Act, or the HITECH Act, and related state laws. We are also subject to Federal and state security breach notification laws, as well as state laws regulating the processing of protected personal information, including laws governing the collection, use and disclosure of social security numbers and related identifiers.
The regulations that implement HIPAA and the HITECH Act establish uniform standards governing the conduct of certain electronic healthcare transactions and protecting the security and privacy of individually identifiable health information maintained or transmitted by healthcare providers, health plans, and healthcare clearinghouses, all of which are referred to as “covered entities,” and their “business associates” (which is
-85-
Table of Contents
anyone who performs a service on behalf of a covered entity involving the use or disclosure of protected health information and is not a member of the covered entity’s workforce). Our carrier partners’ and our clients’ health plans generally will be covered entities, and as their business associate they may ask us to contractually comply with certain aspects of these standards by entering into requisite business associate agreements.
As part of the payment-related aspects of our business, we may also undertake security-related obligations arising out of the Gramm-Leach-Bliley Act and the Payment Card Industry guidelines applicable to card systems. These requirements generally require safeguards for the protection of personal and other payment related information.
HIPAA Healthcare Fraud Standards
The HIPAA healthcare fraud statute created a class of Federal crimes known as the “federal healthcare offenses,” including healthcare fraud and false statements relating to healthcare matters. The HIPAA healthcare fraud statute prohibits, among other things, executing a scheme to defraud any healthcare benefit program while the HIPAA false statements statute prohibits, among other things, concealing a material fact or making a materially false statement in connection with the payment for healthcare benefits, items or services. Entities that are found to have aided or abetted in a violation of the HIPAA Federal healthcare offenses are deemed by statute to have committed the offense and are punishable as a principal.
State Privacy Laws
In addition to Federal regulations issued under HIPAA, some states have enacted privacy and security statutes or regulations, or State Privacy Laws, that govern the use and disclosure of a person’s medical information or records and, in some cases, are more stringent than those issued under HIPAA. These State Privacy Laws include regulation of health insurance providers and agents, regulation of organizations that perform certain administrative functions such as utilization review or third-party administration, issuance of notices of privacy practices, and reporting and providing access to law enforcement authorities. In those cases, it may be necessary to modify our operations and procedures to comply with these more stringent State Privacy Laws. If we fail to comply with applicable State Privacy Laws, we could be subject to additional sanctions.
Consumer Protection Laws
Federal and state consumer protection laws are being applied increasingly by the United States Federal Trade Commission, or FTC, and states’ attorneys general to regulate the collection, use, storage and disclosure of personal or patient information, through websites or otherwise, and to regulate the presentation of web site content. Courts may also adopt the standards for fair information practices promulgated by the FTC, which concern consumer notice, choice, security, and access.
State Insurance Laws
Some of the states in which we operate have laws prohibiting unlicensed persons or business entities, including corporations, from making certain direct and indirect payments or fee-splitting arrangements with licensed insurance agents and brokers. Possible sanctions for violation of these restrictions include loss of license and civil penalties. These statutes vary from state to state, are often vague and have seldom been interpreted by the courts or regulatory agencies.
State insurance laws also require us to maintain an insurance agency or broker license in each state in which we transact health insurance business and adhere to sales, documentation and administration practices specific to that state. In addition, each of our employees who solicits, negotiates, sells or transacts health insurance business for us must maintain an individual insurance agent or broker license in one or more states. Because we transact business in all 50 states and the District of Columbia, compliance with health insurance-related laws, rules and regulations is difficult and imposes significant costs on our business.
-86-
Table of Contents
Telemarketing
We are also subject to laws and regulations on direct marketing, such as the Telemarketing Consumer Fraud and Abuse Prevention Act and the Telemarketing Sales Rule, the Telephone Consumer Protection Act, or the TCPA, the Do-Not-Call Implementation Act and rules promulgated by the Federal Communications Commission and the Federal Trade Commission and the CAN-SPAM Act. Failure to comply with the provisions of such acts and rules could result in our being enjoined from further telemarketing activities and substantial civil penalties.
Intellectual Property
We rely on a combination of patent, copyright, trademark, service mark, and trade secret laws, as well as confidentiality procedures and contractual provisions to protect our proprietary technology and our brand. We have an issued patent relating to certain of our technology and business processes that expires in 2031. We own a number of domain names, have registered several trademarks and have filed applications for the registration of a number of our other trademarks and service marks in the United States. These intellectual property rights will not prevent competitors from creating a competitive exchange platform and competing with us.
Seasonality
Our business of marketing Medicare plans is subject to seasonal fluctuations. The benefits enrollment period for a majority of private employers occurs during the fourth calendar quarter of each year for a January 1 effective date, and this period also coincides with the timing of the annual enrollment period when Medicare-eligible individuals can make changes to their Medicare Advantage or Medicare Part D prescription drug coverage for the following year. As a result, the majority of our Medicare enrollments have historically occurred in the fourth calendar quarter of each year during the Medicare annual enrollment period. As our business matures, other seasonality trends may develop and the existing seasonality and consumer behavior that we experience may change. In particular, public sector employers are generally more inclined to opt for transition periods outside of the annual enrollment period, as their benefits effective date typically coincides with the beginning of their fiscal year, which is often not January 1.
Employees
As of March 31, 2012, we had 319 full-time employees in the United States, of which 221 were in our service center, 32 were in sales and marketing, 39 were in technology and 27 were in general and administrative. We have not experienced any work stoppages and consider our employee relations to be good. None of our employees is represented by a labor union. To meet peak demand during the Medicare annual enrollment period in our second fiscal quarter, we supplement our workforce by hiring seasonal benefit advisors. As a result, our enrollment operations and customer service staffing levels vary widely throughout the year and, over the course of fiscal 2011, ranged from 65 to 500 employees. Significant numbers of these seasonal benefit advisors return year after year resulting in efficiency and productivity gains and higher customer satisfaction.
Facilities
We lease 12,670 square feet of space for our headquarters in San Mateo, California under a lease that expires in November 2015. We also lease 44,150 square feet of space for our service center located in South Jordan, Utah under a lease that expires in December 2012, 25,600 square feet of space for our service center located in Richardson, Texas under a lease that expires in April 2016 and approximately 7,550 square feet of space for our technology development center in Sugarhouse, Utah under a lease that expires in February 2013. We currently intend to add new service centers or expand our service centers to meet customer demand. We believe that suitable additional or alternative space will be available in the future on commercially reasonable terms to accommodate our foreseeable future expansion.
-87-
Table of Contents
Legal Proceedings
We are not currently a party to any material litigation proceedings. From time to time, however, we are a party to litigation and subject to claims incident to the ordinary course of business. Regardless of the outcome, litigation can have an adverse impact on us because of defense and settlement costs, diversion of management resources and other factors.
-88-
Table of Contents
Executive Officers and Directors
The following table sets forth the names, ages and positions of our executive officers and directors as of April 30, 2012:
| Name |
Age | Position | ||||
| Bryce A. Williams |
48 | President, Chief Executive Officer, Director and Co-Founder | ||||
| Terri L. Brncic |
41 | Vice President and Chief Financial Officer | ||||
| Joseph J. Murad |
44 | Senior Vice President, Chief Operating Officer and Secretary | ||||
| Cameron C. Liljenquist |
34 | Senior Vice President and Chief Technology Officer | ||||
| Brian R. Bohlig |
43 | Vice President and Chief Marketing Officer | ||||
| Richard A. Gephardt(3) |
71 | Director | ||||
| David G. Golden(1)(2)(3) |
53 | Chairman of the Board | ||||
| Stephen M. Krupa(1) |
47 | Director | ||||
| Anthony E. Meyer(1)(2)(3) |
50 | Director and Co-Founder | ||||
| Albert S. Waxman(2) |
71 | Director | ||||
(1) Member of the Audit Committee
(2) Member of the Compensation Committee
(3) Member of the Nominating and Corporate Governance Committee
Executive Officers
Bryce A. Williams has served as our President and Chief Executive Officer and as a member of our board of directors since March 2004. Prior to Extend Health, Mr. Williams was the Senior Vice President of Marketing and Business Development at eHealth, Inc., a subsidiary of eHealth Insurance Services, Inc. and an online provider of health insurance, from April 1999 to March 2004. Prior to eHealth, Mr. Williams served as Director, Development for OnCare, Inc., an oncology physician practice management company, from November 1994 to April 1999, served as Vice President and General Counsel of Advance Paradigm, Inc., a pharmacy benefit management company, and was a corporate transactions attorney at Jones Day. Mr. Williams holds a B.A. in Business from Baylor University and a J.D. from George Washington University. Mr. Williams was selected to serve on our board of directors due to the perspective and experience he brings as our Chief Executive Officer and his extensive background in the healthcare and insurance industries.
Terri L. Brncic has served as our Vice President and Chief Financial Officer since August 2011 and had previously served as our Vice President, Finance from April 2010 to August 2011 and as Corporate Controller from November 2008 to March 2010. Prior to Extend Health, Ms. Brncic served as the Corporate Controller for NovaBay Pharmaceuticals, Inc., a clinical-stage biotechnology company, from October 2006 through March 2008. Prior to NovaBay, Ms. Brncic served as a program lead for Cisco Systems, Inc., a networking equipment company, in their SOX Compliance division from 2004 to 2006. Ms. Brncic has also served as Corporate Controller for several public and private companies focused in the internet and technology sectors. Ms. Brncic holds a B.S. in Business Administration from the University of California, Berkeley and is a Certified Public Accountant in the State of California.
Joseph J. Murad has served as our Senior Vice President and Chief Operating Officer since September 2010 and our Secretary since July 2007. Mr. Murad previously held the role of Senior Vice President of Operations and Corporate Development from July 2005 to September 2010 and Vice President of Business Development from 2004 to 2005. Prior to Extend Health, Mr. Murad served as the Director of Business Development at
-89-
Table of Contents
eHealth from 1999 to 2004. Prior to eHealth, Mr. Murad held a variety of senior sales and management roles with Informix Software and other leading database and application software companies. Mr. Murad holds a B.A. in Communications from the University of Southern California.
Cameron C. Liljenquist has served as our Senior Vice President and Chief Technology Officer since January 2012 and as Chief Technology Officer from March 2004 to January 2012. Prior to Extend Health, Mr. Liljenquist served as a Technical Analyst at Meyer and Co. LLC, a venture capital and private equity firm, from September 2001 to March 2004. Prior to Meyer and Co., Mr. Liljenquist served as a Technology Project Manager and Business Development Manager at Fall River Corp., an internet technology and development company, from June 1999 to August 2001. Mr. Liljenquist holds a B.S. in Exercise Physiology from Brigham Young University.
Brian R. Bohlig has served as our Vice President and Chief Marketing Officer since August 2009. Prior to Extend Health, Mr. Bohlig served as the Vice President of Marketing for Arch Rock Corporation, a developer of wireless sensor technology, from May 2006 to January 2009. Prior to Arch Rock, Mr. Bohlig served as Director of Corporate Marketing and Workstation Project Management at VMware, Inc., a virtualization and cloud solution provider, from 2002 to 2006, and as Director of Corporate Marketing from 2001 to 2002. Prior to VMware, Mr. Bohlig held various product and leadership positions at Corio, Inc. and held various product positions at Sun Microsystems, Inc. Mr. Bohlig holds a B.A. in English from Dartmouth College and an M.B.A. from the Kellogg Graduate School of Management at Northwestern University.
Board of Directors
Richard A. Gephardt has served on our board of directors since February 2009. Mr. Gephardt currently serves as President and Chief Executive Officer of the Gephardt Group, LLC, a multi-disciplined consulting firm, and as a consultant for The Goldman Sachs Group, Inc. since January 2005. Mr. Gephardt served as Strategic Advisor from June 2005 until April 2010 at the law firm of DLA Piper in the firm’s Government Affairs practice group. Mr. Gephardt serves as a director on the board of the Ford Motor Company, an auto manufacturer, Centene Corporation, a health care provider, CenturyLink, Inc., a communication services company, Spirit Aerosystems Holding Incorporated, a supplier of commercial airplane assemblies and components, and United States Steel Corporation. Mr. Gephardt previously served on the board of Dana Holding Corporation, an auto parts manufacturer and supplier, from January 2008 to March 2009. Mr. Gephardt is an Advisory Board member to the International Conservation Caucus Foundation, and also serves as Advisory Board chairman at the Richard A. Gephardt Institute for Public Service at Washington University in St. Louis. Previously, Mr. Gephardt served as a U.S. Congressman from Missouri from 1977 to January 2005. During his tenure as a U.S. Congressman, Mr. Gephardt served as Majority Leader of the United States House of Representatives from 1989 to 1995 and as Minority Leader from 1995 to 2003. Mr. Gephardt holds a B.S. in Speech from Northwestern University and a J.D. from the University of Michigan. Mr. Gephardt was selected to serve on our board of directors due to the perspective and experience he brings as a former legislator and policy-maker, including his familiarity with healthcare and insurance issues, as well as his extensive experience as a public company director.
David G. Golden has served on our board of directors since September 2008 and our Chairman since December 2011. Mr. Golden currently serves as Executive Chairman of Code Advisors, a private merchant bank focused on the technology and digital media sectors, since its founding in 2010. Mr. Golden was a Partner, Executive Vice President and Strategic Advisor for Revolution LLC, an investment firm, from March 2006 through December 2011. From February 1988 to April 1990 and from April 1992 to February 2006, Mr. Golden held various positions with JPMorgan Chase and a predecessor firm, Hambrecht & Quist Incorporated, including serving as Vice Chairman and Director of Global Technology, Media and Telecommunications Investment Banking from March 2001 to January 2005 and Chairman of the Western Region from March 2001 to February 2006. At Hambrecht & Quist, he was Co-Director of Investment Banking from April 1998 to December 2000 and Co-Director of Mergers and Acquisitions from April 1993 to March 1998. Mr. Golden is a member of the board of Blackbaud, Inc. and Barnes & Noble. Mr. Golden also is a member of the Advisory Boards of Granite Ventures LLC, a technology venture capital firm, and Partners for Growth LLC, a venture lending firm, and he
-90-
Table of Contents
serves as a director on the boards of Everyday Health, Inc. and Vinfolio, Inc. Mr. Golden holds an A.B. in Government from Harvard University and a J.D. from Harvard Law School. Mr. Golden was selected to serve on our board of directors due to his extensive background in corporate finance and investment banking.
Stephen M. Krupa has served on our board of directors since July 2007. In 1998, Mr. Krupa co-founded Psilos Group Managers, LLC, a healthcare industry-focused investment firm, and currently serves as a Managing Member of Psilos. Prior to Psilos, Mr. Krupa served as a Vice President of Wasserstein Perella & Co., an international investment bank. Prior to Wasserstein Perella & Co., Mr. Krupa was an associate in the investment banking department of Kidder Peabody & Co. Prior to Kidder Peabody, Mr. Krupa worked as a mechanical engineer and software developer then as a manager of new business development for Johnson Controls, Inc., a manufacturer of process controls systems. Mr. Krupa holds a B.S. in Mechanical Engineering from the University of South Florida and an M.B.A. from the Wharton School of the University of Pennsylvania. Mr. Krupa was selected to serve on our board of directors due to his extensive background in and knowledge of the healthcare industry.
Anthony E. Meyer has served on our board of directors since November 2006 and was the co-founder of our predecessor company in 2002. In 2005, Mr. Meyer co-founded Ocean Road Advisors, Inc. a “family office” investment management company, and currently serves as its President. From 1994 to 2001, Mr. Meyer was affiliated with Lazard Frères & Co. LLC, a global, private investment bank, where he co-founded Lazard Frères Real Estate Investors, its real estate investment management affiliate. Prior to joining Lazard, from 1984 to 1993, Mr. Meyer was affiliated with Trammell Crow Company, a diversified real estate company, where he co-founded Trammell Crow Ventures, its finance and investment affiliate. Mr. Meyer has been involved with a number of entrepreneurial companies and has made numerous angel and early-stage venture capital investments, most recently as co-founder in 2007 of The American Academy, a leading online education services company. He has also served as a director on the boards of a number of public and private companies. Mr. Meyer holds an A.B. in Economics from Harvard College and an M.B.A. from Harvard Business School. Mr. Meyer was selected to serve on our board of directors due to the perspective and experience he brings as one of our founders and early investors and his investment management and corporate governance experience.
Albert S. Waxman, Ph.D. has served on our board of directors since July 2007. In 1998, Dr. Waxman co-founded Psilos Group Managers, LLC, and currently serves as Psilos’ Senior Managing Member and Chief Executive Officer. Prior to founding Psilos, Dr. Waxman served as Chairman and Chief Executive Officer of Merit Behavioral Care Corporation, a behavioral care provider, and its predecessor companies, American Biodyne and Medco Behavioral Care. Prior to American Behavioral Care, Dr. Waxman founded and served as President, Chairman and CEO of Diasonics, Inc., a provider of ultrasound and magnetic resonance imaging. Dr. Waxman currently serves on the boards of Click4Care, Inc., SeeChange Health, HealthEdge, Inc., Mauna Kea Technologies, Care Management Technology and Verium. Dr. Waxman holds a B.S. in Electrical Engineering from the City College of New York and a Masters in Electrical Engineering and a Ph.D. in Physics from Princeton University. Dr. Waxman was selected to serve on our board of directors due to his extensive background in and knowledge of the healthcare industry.
Classified Board
Upon completion of this offering, our board of directors will consist of six members. In accordance with our amended and restated certificate of incorporation to be filed in connection with this offering, upon completion of this offering, our board of directors will be divided into three classes with staggered three-year terms. At each annual meeting of stockholders, a class of directors will be elected for a three-year term to succeed the same class whose term is then expiring. The terms of the directors will expire upon the election and qualification of successor directors at the annual meeting of stockholders to be held during 2012 for the Class I directors, 2013 for the Class II directors and 2014 for the Class III directors.
| • | Our Class I directors will be Richard A. Gephardt and Bryce A. Williams. |
| • | Our Class II directors will be Anthony E. Meyer and Albert S. Waxman. |
| • | Our Class III directors will be David G. Golden and Stephen M. Krupa. |
-91-
Table of Contents
The division of our board of directors into three classes with staggered three-year terms may delay or prevent a change of our management or a change of control. See “Description of Capital Stock—Anti-Takeover Effects of Delaware Law and Our Certificate of Incorporation and Bylaws” for a discussion of other anti-takeover provisions found in our certificate of incorporation.
Director Independence
In connection with this offering, we have applied to list our common stock on The NASDAQ Global Market. Under the rules of The NASDAQ Stock Market, independent directors must comprise a majority of a listed company’s board of directors within a specified period of the completion of this offering. In addition, the rules of The NASDAQ Stock Market require that, subject to specified exceptions, each member of a listed company’s audit, compensation and nominating and corporate governance committees be independent. Audit committee members must also satisfy the independence criteria set forth in Rule 10A-3 under the Securities Exchange Act of 1934, as amended.
In August, 2011, our board of directors undertook a review of its composition, the composition of its committees and the independence of each director. Based upon information requested from and provided by each director concerning his background, employment and affiliations, including family relationships, our board of directors has determined that Messrs. Gephardt, Golden, Krupa, Meyer and Waxman, representing five of our six directors, are “independent” for purposes of serving on our board of directors as that term is defined under the rules of The NASDAQ Stock Market. In making this determination, our board of directors considered the relationships that each non-employee director has with our company and all other facts and circumstances our board of directors deemed relevant, including the beneficial ownership of our capital stock by each non-employee director.
Board Committees
Our board of directors has the authority to appoint committees to perform certain management and administrative functions. Our board of directors has an audit committee, a compensation committee and a nominating and corporate governance committee, each of which has the composition and the responsibilities described below.
Audit Committee
Our audit committee oversees our corporate accounting and financial reporting process and assists our board of directors in monitoring our financial systems and our legal and regulatory compliance. Our audit committee is responsible for, among other things:
| • | appointing, compensating and overseeing the work of our independent auditors; |
| • | reviewing the design, implementation and maintenance of our internal controls and procedures for financial reporting; |
| • | reviewingand providing oversight of the external audit, including reviewing the proposed audit scope and approach, audit findings and critical accounting policies and practices; |
| • | providing oversight of our risk management policies; |
| • | approving engagements of the independent auditors to render any audit or permissible non-audit services; |
| • | reviewing the independence of the independent auditors; and |
| • | reviewing and discussing with management and the independent auditors the results of our annual audit, our quarterly financial statements and our publicly filed reports. |
-92-
Table of Contents
The members of our audit committee are Messrs. Golden, Meyer and Krupa. Mr. Krupa is our audit committee chairman. Each member of our audit committee meets the requirements for financial literacy under the applicable rules and regulations of The NASDAQ Stock Market and SEC. Our board of directors has determined that Mr. Krupa is an audit committee financial expert under the applicable rules of the SEC and has the requisite financial sophistication as defined under the rules and regulations of The NASDAQ Stock Market. Our board of directors has concluded that the composition of our audit committee meets the requirements for independence under the applicable rules and regulations of The NASDAQ Stock Market and SEC. Our board of directors determined that Mr. Krupa was not independent for purposes of serving on our audit committee as Mr. Krupa may be deemed an “affiliate” as defined in Rule 10A-3 promulgated under the Securities Exchange Act of 1934, as amended. While our board of directors determined that Mr. Krupa was not independent for purposes of serving on the audit committee, we intend to rely on the NASDAQ Stock Market’s transition rules applicable to companies completing an initial public offering. We believe that the functioning of our audit committee complies with the applicable requirements of The NASDAQ Stock Market and SEC rules and regulations.
Compensation Committee
Our compensation committee oversees our corporate compensation policies, plans and programs. The compensation committee is responsible for, among other things:
| • | reviewing and approving compensation for our executive officers; |
| • | reviewing and approving corporate goals and objectives relevant to the compensation of our executive officers; |
| • | evaluating, on a periodic basis, the competitiveness of the compensation of our executive officers and our overall compensation plans; |
| • | reviewing and discussing with management the risks arising from the Company’s compensation policies and practices; and |
| • | administering our equity compensations plans for our employees and directors. |
The members of our compensation committee are Messrs. Waxman, Golden and Meyer. Mr. Waxman is the chairman of our compensation committee. Our board of directors has determined that each member of our compensation committee is independent as defined under the applicable rules and regulations of The NASDAQ Stock Market and SEC. We believe that the composition of our compensation committee meets the requirements for independence under, and the functioning of our compensation committee complies with, any applicable requirements of The NASDAQ Stock Market and SEC rules and regulations.
Nominating and Corporate Governance Committee
Our nominating and corporate governance committee oversees and assists our board of directors in reviewing and recommending corporate governance policies and nominees for election to our board of directors. The nominating and corporate governance committee is responsible for, among other things:
| • | reviewing any corporate governance guidelines approved by our board of directors and recommending changes as necessary; |
| • | overseeing compliance by our board of directors with applicable laws and regulations; |
| • | conducting periodic evaluations of the performance of our board of directors; and |
| • | reviewingand making recommendations to the Board regarding the composition and size of our board of directors and determining the relevant criteria. |
-93-
Table of Contents
The members of our nominating and corporate governance committee are Messrs. Gephardt, Meyer and Golden. Mr. Gephardt is the chairman of our nominating and corporate governance committee. Our board of directors has determined that each member of our nominating and corporate governance committee is independent as defined under the applicable rules and regulations of The NASDAQ Stock Market.
Our board of directors may from time to time establish other committees.
Compensation Committee Interlocks and Insider Participation
None of the members of our compensation committee is an officer or employee of our company. None of our executive officers currently serves, or in the past year has served, as a member of our board of directors or compensation committee of any entity that has one or more executive officers serving on our board of directors or compensation committee.
Code of Business Conduct and Ethics
We have adopted a code of business conduct and ethics that is applicable to all of our employees, officers and directors, including our chief executive and senior financial officers. The code of business conduct and ethics will be available on our website. We expect that, to the extent required by law, any amendments to the code or any waivers of its requirements, will be disclosed on our website.
Non-Employee Director Compensation
In fiscal 2011, none of our non-employee directors received any cash, equity or other compensation for their services as directors or board committee members.
In August 2011, Mr. Golden was granted an option to purchase 10,000 shares of common stock at an exercise price per share of $9.00 in connection with his appointment as Chairman of the Board. On August 15, 2011, 1/3rd of the total number of shares subject to the option vested. Thereafter, 1/36th of the total number of shares subject to the option will vest monthly beginning September 15, 2012, provided Mr. Golden continues to provide services to us through such dates.
-94-
Table of Contents
2011 Summary Compensation Table
The following table provides information regarding the compensation of our named executive officers during fiscal 2011.
| Name and Principal Position |
Fiscal Year |
Salary ($) | Non-Equity Incentive Plan Compensation ($)(1) |
All
Other Compensation ($)(2) |
Total ($) | |||||||||||||||
| Bryce A. Williams |
2011 | $ | 303,850 | $ | 107,700 | $ | 6,084 | $ | 417,634 | |||||||||||
| President and Chief Executive Officer |
||||||||||||||||||||
| Joseph J. Murad |
2011 | 231,750 | 107,700 | 4,650 | 344,100 | |||||||||||||||
| Senior Vice President and Chief Operating Officer |
||||||||||||||||||||
| Brian R. Bohlig |
2011 | 203,000 | 107,700 | 4,133 | 314,833 | |||||||||||||||
| Vice President and Chief Marketing Officer |
||||||||||||||||||||
| (1) | The amounts reported represent the amounts earned and payable under our 2011 Corporate Incentive Compensation Plan, which were paid in July 2011. |
| (2) | The amounts reported represent matching contributions made to the individual accounts of our named executive officers under the 401(k) plan. |
Non-Equity Incentive Compensation
We provide our named executive officers an opportunity to receive a year-end, formula-based incentive payment. The payment is based on a target incentive amount for each named executive officer.
Fiscal 2011 Non-Equity Incentive Payments
For fiscal 2011, the target incentive amount and year-end payments for our named executive officers under our 2011 Corporate Incentive Compensation Plan were the following:
| Named Executive Officer |
Target
Award Opportunity ($) |
Actual
Award Amount ($) |
||||||
| Bryce A. Williams |
$ | 100,000 | 107,700 | |||||
| Joseph J. Murad |
$ | 100,000 | 107,700 | |||||
| Brian R. Bohlig |
$ | 100,000 | 107,700 | |||||
The amount of the incentive payment was determined based on achievement of corporate and functional goals. The relative weighting between corporate and function was 70%/30%. Corporate goals were further broken down into four equally-weighted corporate objectives: (1) financial measures, (2) internal business drivers, (3) customer focus and (4) innovation. The compensation committee did not establish specific functional goals for Mr. Williams but instead evaluated his overall performance with respect to leadership and execution. Mr. Murad’s functional goals related to increasing operational efficiencies, while Mr. Bohlig’s functional goals related to strategic marketing goals and strategy implementation. If actual performance exceeded the target, the achievement percentage could have exceeded 100%. Based on actual achievement of the performance goals for fiscal 2011, each of our named executive officers earned 107.7% of the target incentive amount for fiscal 2011 under our 2011 Corporate Incentive Compensation Plan.
-95-
Table of Contents
Retirement and Other Benefits
Our named executive officers receive health and welfare benefits under the same programs and subject to the same terms and conditions as our other salaried employees. These benefits include medical, dental, and vision benefits, health savings accounts, short-term and long-term disability insurance, accidental death and dismemberment insurance and basic life insurance.
Our named executive officers are eligible to participate in our 401(k) retirement savings plan on the same basis as our other employees who satisfy the plan’s eligibility requirements. We may make discretionary contributions to the plan in any year, subject to certain limits. In fiscal 2011, we made matching contributions under our Section 401(k) retirement savings plan to all eligible participants.
Executive Employment Agreements
Bryce A. Williams
We entered into an executive employment agreement with Bryce A. Williams, our President and Chief Executive Officer, dated July 27, 2007. The executive employment agreement has no specific term and constitutes at-will employment. Mr. Williams’ current annual base salary is $326,639, and he is eligible to earn an annual incentive award under our executive bonus plan. Mr. Williams’ employment agreement provides that, in the event his employment is either terminated by us without “cause” (as defined below) or he resigns for “good reason” (as defined below), subject to the execution of a release of claims, he will receive continued payments of his then-current base salary for a period of six months from the date of termination. Additionally, if Mr. Williams’ qualified termination of employment described in the previous sentence occurs within 12 months following a “change of control” (as defined below), then the vesting of Mr. Williams’ then-outstanding stock options is fully accelerated. Severance payments to Mr. Williams will cease if he directly or indirectly engages in, or has an ownership interest or participates in the financing, operation, management or control of, any person, firm, corporation or business that directly competes with us or is our customer, in each case, during the period he is entitled to severance payments.
Terri L. Brncic
We entered into an executive employment agreement with Terri L. Brncic, our Vice President and Chief Financial Officer, dated September 29, 2011. The executive employment agreement has no specific term and constitutes at-will employment. Ms. Brncic’s current annual base salary is $199,400, and she is eligible to earn an annual incentive award under our executive bonus plan. Ms. Brncic’s employment agreement provides that, in the event her employment is either terminated by us without “cause” (as defined below) or she resigns for “good reason” (as defined below), subject to the execution of a release of claims, she will receive continued payments of her then-current base salary for a period of six months from the date of termination. Additionally, if Ms. Brncic’s qualified termination of employment described in the previous sentence occurs within 12 months following a “change of control” (as defined below), then the vesting of Ms. Brncic’s then-outstanding stock options is fully accelerated. Severance payments to Ms. Brncic will cease if she directly or indirectly engages in, or has an ownership interest or participates in the financing, operation, management or control of, any person, firm, corporation or business that directly competes with us or is our customer, in each case, during the period she is entitled to severance payments.
Joseph J. Murad
We entered into an executive employment agreement with Joseph J. Murad, our Senior Vice President and Chief Operating Officer, dated July 27, 2007. The executive employment agreement has no specific term and constitutes at-will employment. Mr. Murad’s current annual base salary is $249,131, and he is eligible to earn an annual incentive award under our executive bonus plan. Mr. Murad’s employment agreement provides that, in the event his employment is either terminated by us without “cause” (as defined below) or he resigns for “good reason” (as defined below), subject to the execution of a release of claims, he will receive continued payments of
-96-
Table of Contents
his then-current base salary for a period of six months from the date of termination. Additionally, if Mr. Murad’s qualified termination of employment described in the previous sentence occurs within 12 months following a “change of control” (as defined below), then the vesting of his then-outstanding stock options is fully accelerated. Severance payments to Mr. Murad will cease if he directly or indirectly engages in, or has an ownership interest or participates in the financing, operation, management or control of, any person, firm, corporation or business that directly competes with us or is our customer, in each case, during the period he is to entitled severance payments.
Cameron C. Liljenquist
We entered into an executive employment agreement with Cameron C. Liljenquist, our Senior Vice President and Chief Technology Officer, dated July 27, 2007. The executive employment agreement has no specific term and constitutes at-will employment. Mr. Liljenquist’s current annual base salary is $209,625, and he is eligible to earn an annual incentive award under our executive bonus plan.
Mr. Liljenquist’s employment agreement provides that, in the event his employment is either terminated by us without “cause” (as defined below) or he resigns for “good reason” (as defined below), subject to the execution of a release of claims, he will receive continued payments of his then-current base salary for a period of three months from the date of termination. Additionally, if Mr. Liljenquist’s qualified termination of employment described in the previous sentence occurs within 12 months following a “change in control” (as defined below), then the vesting of his then-outstanding stock options is fully accelerated. As part of his employment agreement, Mr. Liljenquist agreed that for a period of three months immediately following his termination of employment, he will not engage in a competitive business activity in any state where we have engaged in business. Additionally, Mr. Liljenquist agreed that, during his employment and for a period of three months following his termination of employment, he will not interfere with existing customer relationships, will not solicit any business of the company that was either under way or about to begin following his termination, will not interfere or compete with any proposal efforts in progress (that is, a proposal sent or being developed for one or more specific customers or contemplated to be submitted to one or more specific customers within two years) following his termination, and he will not make use of any of his personal or business relationships or contacts developed during the course of his employment with the company for business purposes within the two years prior to his termination, in a competitive manner with respect to our business. In addition, Mr. Liljenquist agreed that for a period of three months following his termination of employment, he will not solicit any franchisee, joint venture, vendor, contractor or supplier who conducted business with us at any time during the two-year period preceding his termination of employment or induce such parties to terminate or adversely modify any business relationship with us, or interfere with such party’s business relationship with us.
Brian R. Bohlig
We entered into an executive employment agreement with Brian R. Bohlig, our Vice President and Chief Marketing Officer, dated August 24, 2009. The executive employment agreement has no specific term and constitutes at-will employment. Mr. Bohlig’s current annual base salary is $221,450, and he is eligible to earn an annual incentive award under our executive bonus plan.
Mr. Bohlig’s employment agreement provides that, in the event his employment is either terminated by us without “cause” (as defined below) or he resigns for “good reason” (as defined below), subject to the execution of a release of claims, he will receive continued payments of his then-current base salary for a period of six months from the date of termination. Additionally, if Mr. Bohlig’s qualified termination of employment described in the previous sentence occurs within 12 months following a “change of control” (as defined below), then the vesting of his then-outstanding stock options is fully accelerated.
-97-
Table of Contents
Definitions of Terms
For purposes of the executive employment agreements, “cause” means generally:
| • | an act of dishonesty made by an executive in connection with the executive’s responsibilities as an employee; |
| • | executive’s conviction of, or plea of nolo contendere to, a felony; |
| • | executive’s gross misconduct; |
| • | executive’s continued substantial violations of his employment duties; |
| • | the determination by the board in exercise of its reasonable judgment that the executive has, with full knowledge of the relevant circumstances, committed an act that (x) negatively and materially affects our business or reputation (including our relationships with our customers, suppliers or employees) and (y) (A) was taken without proper authorization or (B) was taken with proper authorization, but outside the scope of the executive’s reasonable business judgment; or |
| • | a material breach by the executive of any of the terms and conditions of his or her employment agreement; provided however, that, other than with respect to Mr. Williams and Mr. Bohlig, the conduct contemplated in this bullet point and the fourth bullet point shall constitute “cause” only if executive fails to cure such conduct within 30 days after receipt from our board of written notice of the conduct that constitutes cause. |
Termination by reason of the executive’s death or disability shall be deemed a termination with cause for purposes of the employment agreements.
The “cause” definitions for the agreements of Mr. Williams and Mr. Bohlig do not include the final two bullet points and a determination of “substantial violations of employment duties” requires a written demand for performance from us setting forth the factual basis for our belief that executive has not substantially performed his duties.
For purposes of the executive employment agreements, “change of control” has the following general meaning:
| • | any “person” (as such term is used in Sections 13(d) and 14(d) of the Securities Exchange Act of 1934, as amended), other than us, our subsidiary or our employee benefit plan, including any trustee of such plan acting as trustee, is or becomes the “beneficial owner” (as defined in Rule 13d-3 under said act), directly or indirectly, of our securities representing 50% or more of the total voting power represented by our then outstanding voting securities; |
| • | a change in the composition of the board occurring within a two-year period, as a result of which fewer than a majority of the directors are incumbent directors; |
| • | the date of the consummation of a merger or consolidation of the company or our subsidiary with any other corporation that has been approved by our stockholders, other than a merger or consolidation which would result in the voting securities of the company outstanding immediately before such transaction continuing to represent at least fifty percent (50%) of the total voting power represented by the voting securities of the company or the surviving entity outstanding immediately after the transaction; |
| • | our stockholders approving a plan of complete liquidation; or |
| • | the date of the consummation of the sale or disposition by the Company of all or substantially all of our assets. |
However, a transaction will not constitute a change of control if: (i) its sole purpose is to change the state of our incorporation, or (ii) its sole purpose is to create a holding company owned in substantially the same proportions by holders of our securities immediately before the transaction.
-98-
Table of Contents
For purposes of the executive employment agreements, “good reason” has the following general meaning:
| • | a material diminution of executive’s then current base salary; |
| • | a material change in the geographic location at which the executive must perform his services; provided that in no instance will the relocation of the executive to a facility or a location of 50 miles or less from the executive’s then current office location be deemed material; or |
| • | there is a material reduction in executive’s overall title, responsibilities or authority, or scope of duties. |
However, before the executive may resign for good reason, he or she must provide us with written notice within 45 days of the event that the executive believes constitutes “good reason,” specifically identifying the acts or omissions constituting the grounds for good reason, and we must have an opportunity within 30 days following delivery of such notice to cure the good reason condition.
The “good reason” definition for Mr. Liljenquist’s agreement does not include the final bullet point relating to title, responsibilities or authority, or scope of duties.
Outstanding Equity Awards at Fiscal Year-End
The following table presents certain information concerning equity awards held by our named executive officers at the end of fiscal 2011.
| Option Awards(1) | ||||||||||||||||||||
| Name |
Vesting Commencement Date |
Number of Securities Underlying Unexercised Options (#) Exercisable(2) |
Number of Securities Underlying Unexercised Options (#) Unexercisable |
Option Exercise Price ($) |
Option Expiration Date |
|||||||||||||||
| Bryce A. Williams(3) |
7/27/2007 | 272,657 | 19,475 | $ | 0.21 | 8/17/2017 | ||||||||||||||
| 6/25/2010 | 32,257 | 96,773 | $ | 1.33 | 6/25/2015 | |||||||||||||||
| Joseph J. Murad |
1/5/2007 | 51,612 | — | $ | 0.59 | 1/6/2015 | ||||||||||||||
| 7/27/2007 | 173,137 | 4,370 | $ | 0.21 | 8/17/2017 | |||||||||||||||
| 12/5/2008 | 20,161 | 12,096 | $ | 0.27 | 12/16/2018 | |||||||||||||||
| 6/25/2010 | 32,257 | 96,773 | $ | 1.20 | 6/25/2020 | |||||||||||||||
| Brian R. Bohlig |
8/25/2009 | 10,483 | 90,861 | $ | 0.51 | 11/24/2019 | ||||||||||||||
| 6/25/2010 | 6,451 | 19,354 | $ | 1.20 | 6/25/2020 | |||||||||||||||
| (1) | The numbers of shares subject to outstanding stock options and the option exercise prices reflect the option adjustments as described in “Management’s Discussion and Analysis of Financial Condition and Results of Operations—Dividend-Related Option Adjustments.” |
| (2) | Each stock option award vests at the rate of 25% of the total number of shares subject to the option on the one year anniversary of the vesting commencement date and 1/48th per month thereafter for the next three years beginning the month following the one year anniversary of the vesting commencement date. |
| (3) | Mr. Williams’ stock option that commenced vesting on June 25, 2010 had an exercise price equal to 110% of the per share fair market value of our common stock on the grant date and a term of five years in accordance with rules relating to grants of incentive stock options to holders of more than 10% of our capital stock. |
Employee Benefit and Stock Plans
2012 Equity Incentive Plan
Our board adopted a 2012 Equity Incentive Plan, or the 2012 Plan, in April 2012, and we expect our stockholders will approve it prior to the completion of this offering. Subject to stockholder approval, the 2012 Plan is effective upon the later to occur of its adoption by our board or the business day immediately prior to the effective date for this offering, but is not expected to be used until after the completion of this offering. The 2012 Plan provides for the grant of incentive stock options, within the meaning of Section 422 of the Internal Revenue Code, to our employees and any parent and subsidiary corporations’ employees, and for the grant of nonstatutory
-99-
Table of Contents
stock options, restricted stock, restricted stock units, stock appreciation rights, performance units and performance shares to our employees, directors and consultants and our parent and subsidiary corporations’ employees and consultants.
Authorized Shares. A total of 1,800,000 shares, subject to adjustment as provided in the 2012 Plan, of our common stock are reserved for issuance pursuant to the 2012 Plan, of which no awards are issued and outstanding. The number of shares available for issuance under the 2012 Plan will also include an annual increase on the first day of each fiscal year beginning in fiscal 2014, equal to the least of, subject to adjustment as provided in the 2012 Plan:
| • | 2,060,000 shares; |
| • | 4.5% of the outstanding shares of our common stock as of the last day of our immediately preceding fiscal year; or |
| • | such other amount as our board may determine. |
Plan Administration. Our compensation committee will administer the 2012 Plan. In the case of awards intended to qualify as “performance-based compensation” within the meaning of Section 162(m) of the Internal Revenue Code, the committee will consist of two or more “outside directors” within the meaning of Section 162(m). Subject to the provisions of the 2012 Plan, the administrator has the power to determine the terms of the awards, including the exercise price, the number of shares subject to each such award, the exercisability of the awards and the form of consideration, if any, payable upon exercise. The administrator also has the authority to amend existing awards to increase or reduce their exercise price, to allow participants the opportunity to transfer outstanding awards to a financial institution or other person or entity selected by the administrator and to institute an exchange program by which outstanding awards may be surrendered in exchange for cash and/or awards of the same or different type with a higher or lower exercise price and/or different terms.
Stock Options. The exercise price of options granted under the 2012 Plan must at least be equal to the fair market value of our common stock on the date of grant. The term of an incentive stock option may not exceed 10 years, except that with respect to any employee who owns more than 10% of the voting power of all classes of our outstanding stock, the term must not exceed five years and the exercise price must equal at least 110% of the fair market value of our common stock on the grant date. Subject to the provisions of the 2012 Plan, the administrator determines the term of all other options. After the termination of service of an employee, director or consultant, he or she may exercise his or her option for the period of time stated in his or her option agreement. Generally, if termination is due to death or disability, the option will remain exercisable for 12 months. In all other cases, the option will generally remain exercisable for three months following the termination of service. However, in no event may an option be exercised later than the expiration of its term.
Stock Appreciation Rights. Stock appreciation rights may be granted under the 2012 Plan. Stock appreciation rights allow the recipient to receive the appreciation in the fair market value of shares of our common stock between the exercise date and the date of grant. Subject to the provisions of the 2012 Plan, the administrator determines the terms of stock appreciation rights, including when such rights become exercisable and whether to pay any increased appreciation in cash or with shares of our common stock, or a combination thereof, except that the per share exercise price for the shares to be issued pursuant to the exercise of a stock appreciation right will be no less than 100% of the fair market value per share on the date of grant.
Restricted Stock. Restricted stock may be granted under the 2012 Plan. Restricted stock awards are grants of shares of our common stock that vest in accordance with terms and conditions established by the administrator. The administrator will determine the number of shares of restricted stock granted to any employee, director or consultant. The administrator may impose whatever conditions to vesting it determines to be appropriate (for example, the administrator may set restrictions based on the achievement of specific performance goals or continued service to us); provided, however, that the administrator, in its sole discretion, may accelerate the time at which any restrictions will lapse or be removed. Shares of restricted stock that do not vest are subject to our right of repurchase or forfeiture.
-100-
Table of Contents
Restricted Stock Units. Restricted stock units may be granted under the 2012 Plan. Restricted stock units are bookkeeping entries representing an amount equal to the fair market value of one share of our common stock. The administrator determines the terms and conditions of restricted stock units including the vesting criteria (which may include accomplishing specified performance criteria or continued service to us) and the form and timing of payment. Notwithstanding the foregoing, the administrator, in its sole discretion may accelerate the time at which any restrictions will lapse or be removed.
Performance Units and Performance Shares. Performance units and performance shares may be granted under the 2012 Plan. Performance units and performance shares are awards that will result in a payment to a participant only if performance goals established by the administrator are achieved or the awards otherwise vest. The administrator will establish organizational or individual performance goals in its discretion, which, depending on the extent to which they are met, will determine the number and/or the value of performance units and performance shares to be paid out to participants. After the grant of a performance unit or performance share, the administrator, in its sole discretion, may reduce or waive any performance objectives or other vesting provisions for such performance units or performance shares. Performance units shall have an initial dollar value established by the administrator prior to the grant date. Performance shares shall have an initial value equal to the fair market value of our common stock on the grant date. The administrator, in its sole discretion, may pay earned performance units or performance shares in the form of cash, in shares or in some combination thereof.
Outside Directors. The 2012 Plan provides that all non-employee directors will be eligible to receive all types of awards (except for incentive stock options) under the 2012 Plan.
Non-Transferability of Awards. Unless the administrator provides otherwise, the 2012 Plan generally does not allow for the transfer of awards and only the recipient of an award may exercise an award during his or her lifetime.
Certain Adjustments. In the event of certain changes in our capitalization, to prevent diminution or enlargement of the benefits or potential benefits available under the 2012 Plan, the administrator will adjust the number and class of shares that may be delivered under the 2012 Plan and/or the number, class, and price of shares covered by each outstanding award, and the numerical share limits set forth in the 2012 Plan. In the event of our proposed liquidation or dissolution, the administrator will notify participants as soon as practicable and all awards will terminate immediately prior to the consummation of such proposed transaction.
Merger or Change in Control. The 2012 Plan provides that in the event of a merger or change in control, as defined under the 2012 Plan, each outstanding award will be treated as the administrator determines, except that if a successor corporation or its parent or subsidiary does not assume or substitute an equivalent award for any outstanding award, then such award will fully vest, all restrictions on such award will lapse, all performance goals or other vesting criteria applicable to such award will be deemed achieved at 100% of target levels and such award will become fully exercisable, if applicable, for a specified period prior to the transaction. The award will then terminate upon the expiration of the specified period of time. If the service of an outside director is terminated on or following a change of control, other than pursuant to a voluntary resignation, his or her options, restricted stock units and stock appreciation rights, if any, will vest fully and become immediately exercisable, all restrictions on his or her restricted stock will lapse, and all performance goals or other vesting requirements for his or her performance shares and units will be deemed achieved at 100% of target levels, and all other terms and conditions met.
Amendment, Termination. Our board has the authority to amend, suspend or terminate the 2012 Plan provided such action does not impair the existing rights of any participant. The 2012 Plan will automatically terminate in 2022, unless we terminate it sooner.
2007 Equity Incentive Plan, as amended
Our board adopted and our stockholders approved our 2007 Equity Incentive Plan, or the 2007 Plan, in July 2007. The 2007 Plan was most recently amended in April 2012.
-101-
Table of Contents
Authorized Shares. The 2007 Plan will be terminated as of the effective date of this offering and, accordingly, no shares will be available for issuance under this plan. The 2007 Plan will continue to govern outstanding awards granted thereunder. As of March 31, 2012, the maximum aggregate number of shares of our common stock that remained available to be subject to awards granted, and sold under, the 2007 Plan was, (i) 2,868,165 shares, plus (ii) up to a maximum of 335,082 shares subject to stock options or similar awards granted under our 2004 Equity Incentive Plan, or the 2004 Plan, that expire or otherwise terminate without having been exercised in full after such date and shares issued pursuant to awards granted under the 2004 Plan that are forfeited to or repurchased by us after such date. In addition, if an award granted under the 2007 Plan expires or becomes unexercisable without having been exercised in full, or is surrendered pursuant to an exchange program, the unpurchased shares that were subject to such awards will become available for future grant or sale under the 2007 Plan (unless the 2007 Plan has terminated). As of March 31, 2012, options to purchase 2,715,356 shares of our common stock remained outstanding under the 2007 Plan.
Plan Administration. Our board or a committee thereof appointed by our board has the authority to administer the 2007 Plan. Currently, our compensation committee administers the 2007 Plan. Subject to the provisions of the 2007 Plan, the administrator has the power to determine the terms of awards, including the recipients, the number of shares subject to each award, the exercise price (if any), the fair market value of a share of our common stock, the vesting schedule applicable to the awards, together with any vesting acceleration, and the terms of the award agreement for use under the 2007 Plan. The administrator also has the authority, subject to the terms of the 2007 Plan, to institute an exchange program under which (i) outstanding awards may be surrendered or cancelled in exchange for awards of the same type (which may have lower or higher exercise prices and different terms), awards of a different type and/or cash, (ii) participants would have the opportunity to transfer any outstanding awards to a financial institution or other person or entity selected by the administrator and/or (iii) the exercise price of an outstanding award is increased or reduced, to prescribe rules and regulations pertaining to the 2007 Plan, including establishing sub-plans for the purposes of satisfying applicable foreign laws, and to construe and interpret the 2007 Plan and awards granted thereunder.
Options. The administrator may grant options. The exercise price per share of all options must equal at least 100% of the fair market value per share of our common stock on the date of grant. The term of an option may not exceed 10 years. An incentive stock option held by an employee who owns more than 10% of the total combined voting power of all classes of our stock, or any parent or subsidiary corporations, may not have a term in excess of five years and must have an exercise price of at least 110% of the fair market value per share of our common stock on the date of grant. The administrator will determine the methods of payment of the exercise price of an option, which may include cash, shares, promissory note or certain other property or other consideration acceptable to the administrator. After the termination of service of an employee, director or consultant, the participant may exercise his or her option, to the extent vested as of such date of termination, within 30 days of termination or such longer period of time as stated in his or her option agreement. If termination is due to death or disability, the option will remain exercisable, to the extent vested as of such date of termination, for six months or such longer period of time as stated in his or her option agreement. However, in no event may an option be exercised later than the expiration of its term.
Restricted Stock. Restricted stock may be granted under the 2007 Plan. Restricted stock awards are grants of shares of our common stock that are subject to various restrictions, including restrictions on transferability and forfeiture provisions. Shares of restricted stock will vest, and the restrictions on such shares will lapse, in accordance with terms and conditions established by the administrator. Recipients of restricted stock awards will generally have rights equivalent to those of a stockholder with respect to such shares upon grant without regard to vesting.
Transferability of Awards. Unless the administrator provides otherwise, the 2007 Plan generally does not allow for the transfer of awards and only the recipient of an option may exercise such an award during his or her lifetime.
Certain Adjustments. In the event of certain changes in our capitalization, to prevent diminution or enlargement of the benefits or potential benefits available under the 2007 Plan, the administrator will adjust the
-102-
Table of Contents
number and class of shares that may be delivered under the 2007 Plan and/or the number, class and price of shares covered by each outstanding award. In the event of our proposed liquidation or dissolution, the administrator will notify participants as soon as practicable, and all unexercised awards will terminate immediately prior to the consummation of such proposed transaction.
Merger or Change in Control. The 2007 Plan provides that in the event of a merger or change in control, as defined under the 2007 Plan, each outstanding award will be treated as the administrator determines, including, without limitation, that each award be assumed or substituted for an equivalent award. In the event that awards are not assumed or substituted for, then the administrator will notify holders that such awards will fully vest and such awards will become fully exercisable, if applicable, for a specified period prior to the transaction. The award will then terminate upon the expiration of the specified period of time for no consideration, unless otherwise determined by the administrator.
Amendment, Termination. Our board may amend the 2007 Plan at any time, provided that such amendment does not impair the rights under outstanding awards without the award holder’s written consent. As noted above, as of the effective date of this offering, the 2007 Plan will be terminated and no further awards will be granted thereunder. All outstanding awards will continue to be governed by their existing terms.
2004 Equity Incentive Plan, as amended
The board of directors of Extend Benefits Group, LLC, our predecessor entity, adopted the 2004 Plan on May 12, 2004, and it became effective as of such date. The 2004 plan was most recently amended in April 2012.
Authorized Shares. The 2004 Plan has been terminated and no shares of our common stock are available for issuance under this plan. The 2004 Plan will continue to govern outstanding awards granted thereunder. The 2004 Plan provided for the grant of options and unit awards. In accordance with the transaction converting Extend Benefits Group, LLC into our current corporate entity, all outstanding options to purchase membership units under the 2004 Plan were automatically converted into options to purchase the same number of shares of our common stock at the same exercise price and all outstanding unit awards were converted into awards to purchase shares of our common stock. For purpose of this summary, the units available for grant under the 2004 Plan will be described, as converted in connection with the merger transaction, in shares of our common stock. As of March 31, 2012, options to purchase 335,082 shares of our common stock remained outstanding under the 2004 Plan.
Plan Administration. A committee appointed by our board or, if no committee has been appointed, the board has the authority to administer the 2004 Plan. The administrator has the power to determine the service providers who receive awards and the terms thereof. Subject to the provisions of the 2004 Plan, the administrator has full and conclusive authority to interpret the 2004 Plan, to prescribe rules and regulations relating to the 2004 Plan, to determine the terms and conditions of option agreements and unit award agreements and to make all other determinations necessary or advisable for the proper administration of the 2004 Plan. The administrator also has the authority, subject to the terms of the 2004 Plan, to institute an exchange program under which (i) outstanding awards may be surrendered or cancelled in exchange for awards of the same type (which may have lower or higher exercise prices and different terms), awards of a different type and/or cash, (ii) participants would have the opportunity to transfer any outstanding awards to a financial institution or other person or entity selected by the administrator and/or (iii) the exercise price of an outstanding award is increased or reduced.
Options. Prior to the 2004 Plan’s termination, the administrator had the authority to grant options. The exercise price per share of all options must equal at least the fair market value per share of our common stock on the date of grant. The terms and conditions of an option are set forth in an option agreement. Payment upon the exercise of an option will be made in cash or check, or, in the discretion of the administrator, a promissory note or other shares of our common stock or other means acceptable to the administrator. After the termination of service for any reason other than for cause (as defined in the 2004 Plan), the participant may exercise his or her option, to the extent vested as of such date of termination, within the period of time as stated in his or her option agreement. If the termination of service is for cause, the option will terminate immediately.
-103-
Table of Contents
Repurchase Rights. Shares of our common stock acquired upon exercise of an option or lapsing of restrictions on unit awards will be subject to a repurchase right if a participant terminates employment for any reason and prior to the date our shares have been publicly traded for at least 90 days. The repurchase right may be exercised by us within one year following the participant’s termination of employment. The repurchase right price will be an amount equal to the fair market value of our common stock on the date of repurchase, except that if the shares are repurchased within 90 days following (i) a termination of employment for cause or (ii) the breach of any confidentiality, non-competition or solicitation agreement he or she may have had with us, then the repurchase price will be the lowest of (x) the fair market value of our common stock, (y) the exercise price or purchase price paid for the shares or (z) the book value of the shares as of the date of repurchase, determined by us for financial accounting purposes. Payment of the repurchase price may be in cash or, at our election, in substantially equal installments over a period designated by us of no more than three years with interest paid on the unpaid balance.
Transferability of Awards. Unless the administrator provides otherwise, the 2004 Plan generally does not allow for the transfer of awards, and only the recipient of an option may exercise such an award during his or her lifetime. In the case of a participant that is an entity, options are not transferable except to another entity that is an affiliate of the participant. Unless an option agreement provides otherwise, a participant may, with the consent of the administrator, transfer an option for no consideration to or for the benefit of a participant’s immediate family.
Certain Adjustments. In the event of certain changes in our capitalization, the number of shares of our common stock reserved under the 2004 Plan, the number of shares granted under any option or unit award, the exercise price of any option and the purchase price of any unit award will be proportionately adjusted in the manner deemed necessary or appropriate by the administrator in its discretion.
Merger or Change in Control. The 2004 Plan provides that in the event of a merger or change in control transaction or certain other transactions and changes in our capital structure, the administrator may make such adjustments with respect to options and unit awards and take such other action as it deems necessary or appropriate to reflect such event. Such actions include, without limitation, the substitution of new awards, the adjustment of outstanding awards, the vesting acceleration of awards, the removal of restrictions on outstanding awards, or the termination of outstanding awards in exchange for a cash value of the vested and/or unvested portion of the award determined in good faith by the administrator.
Amendment, Termination. Our board may amend the 2004 Plan at any time, provided that such amendment does not adversely affect the then-vested rights of a participant. As noted above, the 2004 Plan has been terminated and no further awards will be granted thereunder. All outstanding awards will continue to be governed by their existing terms.
Executive Incentive Compensation Plan
Our Executive Incentive Compensation Plan, or the Bonus Plan, was adopted by our board of directors in April 2012. The Bonus Plan allows our compensation committee to provide cash incentive awards to selected employees, including our named executive officers, based upon performance goals established by our compensation committee.
Under the Bonus Plan, our compensation committee determines the performance goals applicable to any award, which goals may include, without limitation: enrollments, business divestitures and acquisitions, cash flow, cash position, customer satisfaction, earnings (which may include earnings before interest and taxes, earnings before taxes and net earnings), earnings per share, adherence to budget, expenses, gross margin, growth in stockholder value relative to the moving average of the S&P 500 Index or another index, innovation, internal rate of return, net income, net profit, net sales, new product development, new product invention or innovation, number of customers, operating cash flow, operating expenses, operating income, operating margin, overhead or other expense reduction, productivity, profit, reduce cost per enrollment, return on assets, return on capital, return on equity, return on investment, return on sales, revenue, revenue growth, sales results, sales growth, stock price,
-104-
Table of Contents
time to market, total stockholder return, working capital, and individual objectives such as peer reviews or other subjective or objective criteria and individual objectives such as peer reviews or other subjective or objective criteria. Performance goals that include our financial results may be determined in accordance with U.S. generally accepted accounting principles, or GAAP, or such financial results may consist of non-GAAP financial measures and any actual results may be adjusted by the compensation committee for one-time items or unbudgeted or unexpected items when determining whether the performance goals have been met. The goals may be on the basis of any factors the compensation committee determines relevant, and may be adjusted on an individual, divisional, business unit or company-wide basis. The performance goals may differ from participant to participant and from award to award.
Our compensation committee may, in its sole discretion and at any time, increase, reduce or eliminate a participant’s actual award, and/or increase, reduce or eliminate the amount allocated to the bonus pool for a particular performance period. The actual award may be below, at or above a participant’s target award, in the compensation committee’s discretion. Our compensation committee may determine the amount of any reduction on the basis of such factors as it deems relevant, and it is not be required to establish any allocation or weighting with respect to the factors it considers.
Actual awards are paid in cash only after they are earned, which usually requires continued employment through the date a bonus is paid. Payment of bonuses occurs as soon as administratively practicable after they are earned, but no later than the dates set forth in the Bonus Plan.
Our board of directors has the authority to amend, alter, suspend or terminate the Bonus Plan provided such action does not impair the existing rights of any participant with respect to any earned bonus.
401(k) Plan
We maintain a tax-qualified retirement plan that provides eligible employees with an opportunity to save for retirement on a tax advantaged basis. Eligible employees are able to participate in the 401(k) plan as of the sixth month anniversary of the date they begin employment, and participants are able to defer up to 50% of their eligible compensation subject to applicable annual Internal Revenue Code limits. All participants’ interests in their deferrals are 100% vested when contributed. In fiscal 2011, we made matching contributions into the 401(k) plan. Our contributions to the 401(k) plan are discretionary and fully vested when contributed. Pre-tax contributions are allocated to each participant’s individual account and are then invested in selected investment alternatives according to the participants’ directions. The 401(k) plan is intended to qualify under Sections 401(a) and 501(a) of the Internal Revenue Code. As a tax-qualified retirement plan, contributions to the 401(k) plan and earnings on those contributions are not taxable to the employees until distributed from the 401(k) plan, and all contributions are deductible by us when made.
Limitation on Liability and Indemnification Matters
Our amended and restated certificate of incorporation and bylaws that will become effective upon the completion of this offering contain provisions that limit the personal liability of our directors for monetary damages to the fullest extent permitted by Delaware law. Consequently, our directors will not be personally liable to us or our stockholders for monetary damages for any breach of fiduciary duties as directors, except liability for:
| • | any breach of the director’s duty of loyalty to us or our stockholders; |
| • | any act or omission not in good faith or that involves intentional misconduct or a knowing violation of law; |
| • | unlawful payments of dividends or unlawful stock repurchases or redemptions as provided in Section 174 of the Delaware General Corporation Law; or |
| • | any transaction from which the director derived an improper personal benefit. |
-105-
Table of Contents
Our amended and restated certificate of incorporation that will become effective upon the completion of this offering provides that we indemnify our directors to the fullest extent permitted by Delaware law. In addition, our amended and restated bylaws that will become effective upon the completion of this offering provide that we indemnify our directors and officers to the fullest extent permitted by Delaware law. Our amended and restated bylaws that will become effective upon the completion of this offering also provide that we shall advance expenses incurred by a director or officer in advance of the final disposition of any action or proceeding, and permit us to secure insurance on behalf of any officer, director, employee or other agent for any liability arising out of his or her actions in that capacity, regardless of whether we would otherwise be permitted to indemnify him or her under the provisions of Delaware law. We have entered and expect to continue to enter into agreements to indemnify our directors, executive officers and other employees as determined by the board. With certain exceptions, these agreements provide for indemnification for related expenses including, among others, attorneys’ fees, judgments, fines and settlement amounts incurred by any of these individuals in any action or proceeding. We believe that these bylaw provisions and indemnification agreements are necessary to attract and retain qualified persons as directors and officers. We also maintain directors’ and officers’ liability insurance.
The limitation of liability and indemnification provisions in our amended and restated certificate of incorporation and bylaws that will become effective upon the completion of this offering may discourage stockholders from bringing a lawsuit against our directors for breach of their fiduciary duty of care. They may also reduce the likelihood of derivative litigation against our directors and officers, even though an action, if successful, might benefit us and other stockholders. Further, a stockholder’s investment may be adversely affected to the extent that we pay the costs of settlement and damage awards against directors and officers. At present, there is no pending litigation or proceeding involving any of our directors, officers or employees for which indemnification is sought, and we are not aware of any threatened litigation that may result in claims for indemnification.
-106-
Table of Contents
CERTAIN RELATIONSHIPS AND RELATED PERSON TRANSACTIONS
Other than compensation arrangements, the following is a description of each transaction since July 1, 2008 and each currently proposed transaction in which:
| • | we have been or are to be a participant; |
| • | the amounts involved exceeded or will exceed $120,000; and |
| • | any of our directors, executive officers or beneficial holders of more than 5% of any class of our capital stock had or will have a direct or indirect material interest. |
Compensation arrangements for our directors and named executive officers are described elsewhere in this prospectus.
Contingent Investor Loan Facility
In August 2011, we declared a cash dividend of $27.0 million. In connection with this cash dividend, we established a $10.0 million credit facility with Silicon Valley Bank, comprised of a $5.0 million revolving line of credit and a $5.0 million term loan. Simultaneous with the execution of the loan and security agreement with Silicon Valley Bank, Psilos Group Partners, which holds more than 5% of our outstanding capital stock and whose managing members include Stephen M. Krupa and Albert S. Waxman, both of whom are our directors, and Revolution Extend Holdings, LLC, which holds more than 5% of our outstanding capital stock and whose former representative, David G. Golden, is one of our directors, Bryce A. Williams, who is our Chief Executive Officer and one of our directors and who holds more than 5% of our outstanding capital stock, and Anthony E. Meyer, who is one of our directors and who holds more than 5% of our outstanding capital stock, agreed, on a contingent basis, to collectively provide us with a credit facility in an aggregate principal amount of up to $5.0 million if we were unable to renew the credit facility with Silicon Valley Bank at the end of the initial term of such facility and the amount of our unrestricted cash or cash equivalents at that time minus any outstanding indebtedness owed by us to Silicon Valley Bank is less than $5.0 million. In December 2011, in connection with an increase to the revolving line of credit to $8.0 million, these parties agreed to increase the aggregate principal amount under this arrangement to $8.0 million. All obligations under this agreement terminate on the consummation of this offering.
Investors Rights Agreement
We are party to an investors’ rights agreement which provides, among other things, that holders of our preferred stock, including stockholders affiliated with some of our directors, have the right to demand that we file a registration statement or request that their shares be covered by a registration statement that we are otherwise filing. For a more detailed description of these registration rights, see “Description of Capital Stock—Registration Rights.”
Employment Arrangements and Indemnification Agreements
We have entered into employment and consulting arrangements with certain of our executive officers. See “Management—Employment Agreements and Change in Control Arrangements.”
We have also entered into indemnification agreements with some of our directors and officers. The indemnification agreements and our amended and restated certificate of incorporation and bylaws in effect upon the completion of this offering require us to indemnify our directors and officers to the fullest extent permitted by Delaware law. See “Management—Limitation on Liability and Indemnification Matters.”
-107-
Table of Contents
Policies and Procedures for Related Person Transactions
Our board of directors has adopted a written related person transaction policy that sets forth the policies and procedures for the review and approval or ratification of related person transactions. This policy covers any transaction, arrangement or relationship, or any series of similar transactions, arrangements or relationships, in which we were or are to be a participant and a related person had or will have a direct or indirect material interest, as determined by the audit committee of our board of directors. In reviewing any proposed related person transaction, our audit committee will consider all relevant facts and circumstances, including the commercial reasonableness of the terms, the benefit or perceived benefit, or lack thereof, to us, opportunity costs of alternate transactions, the materiality and character of the related person’s direct or indirect interest and the actual or apparent conflict of interest of the related person.
All related person transactions described in this section occurred prior to adoption of this policy, and as such, these transactions were not subject to the approval and review procedures set forth in the policy. However, these transactions were reviewed and approved by our board of directors.
-108-
Table of Contents
The following table sets forth information regarding beneficial ownership of our common stock as of March 31, 2012 and as adjusted to reflect the shares of common stock to be issued and sold in the offering assuming no exercise of the underwriters’ over-allotment option, by:
| • | each person or group of affiliated persons known by us to be the beneficial owner of more than 5% of our common stock; |
| • | each of our named executive officers; |
| • | each of our directors; and |
| • | all executive officers and directors as a group. |
We have determined beneficial ownership in accordance with SEC rules. The information does not necessarily indicate beneficial ownership for any other purpose. Under these rules, the number of shares of common stock deemed outstanding includes shares issuable upon exercise of options and warrants held by the respective person or group which may be exercised or converted within 60 days after March 31, 2012. For purposes of calculating each person’s or group’s percentage ownership, stock options and warrants exercisable within 60 days after March 31, 2012 are included for that person or group but not the stock options or warrants of any other person or group.
Applicable percentage ownership is based on 16,296,745 shares of common stock outstanding at March 31, 2012, assuming the automatic conversion of all outstanding shares of our preferred stock on a one-for-one basis into 14,749,992 shares of common stock. For purposes of the table below, we have assumed that shares of common stock will be outstanding upon completion of this offering.
Unless otherwise indicated and subject to applicable community property laws, to our knowledge, each stockholder named in the following table possesses sole voting and investment power over the shares listed. Unless otherwise noted below, the address of each person listed on the table is c/o Extend Health, Inc., 2929 Campus Drive, Suite 400, San Mateo, California 94403.
| Shares Beneficially Owned Prior to the Offering |
Shares Beneficially Owned After the Offering | |||||||||||
| Name of Beneficial Owner |
Shares | Percentage | Shares | Percentage | ||||||||
| 5% Stockholders: |
||||||||||||
| Entities affiliated with Psilos Group(1) |
7,489,561 | 46.0 | % | |||||||||
| Revolution Extend Holdings LLC(2) |
3,239,322 | 19.9 | ||||||||||
| Bryce A. Williams(3) |
2,418,895 | 14.5 | ||||||||||
| Anthony E. Meyer |
1,872,116 | 11.5 | ||||||||||
| Named Executive Officers and Directors: |
||||||||||||
| Bryce A. Williams(3) |
2,418,895 | 14.5 | ||||||||||
| Terri L. Brncic(4) |
74,463 | * | ||||||||||
| Joseph J. Murad(5) |
510,931 | 3.1 | ||||||||||
| Brian R. Bohlig(6) |
112,748 | * | ||||||||||
| Cameron C. Liljenquist(7) |
253,418 | 1.5 | ||||||||||
| Richard A. Gephardt(8) |
56,987 | * | ||||||||||
| David G. Golden(9) |
106,415 | * | ||||||||||
| Stephen M. Krupa(10) |
7,489,561 | 46.0 | ||||||||||
| Anthony E. Meyer |
1,872,116 | 11.5 | ||||||||||
| Albert S. Waxman(11) |
7,489,561 | 46.0 | ||||||||||
| All executive officers and directors as a group(12) |
12,895,534 | 74.5 | ||||||||||
-109-
Table of Contents
| (*) | Represents beneficial ownership of less than 1%. |
| (1) | Consists of (i) 5,305,269 shares held of record by Psilos Group Partners III, L.P.; (ii) 187,164 shares held of record by Psilos Group Partners IIIA, L.P.; (iii) 373,847 shares held of record by Psilos Group Partners IIIB, L.P.; and (iv) 1,623,281 shares held of record by Psilos Group Partners IIIC, L.P. Psilos Group Investors III, LLC is the general partner of Psilos Group Partners III, L.P., Psilos Group Partners IIIA, L.P., Psilos Group Partners IIIB, L.P. and Psilos Group Partners IIIC, L.P. (collectively referred to as the “Psilos Group Entities”). Albert Waxman, Stephen Krupa, Lisa Suennen, Joseph Riley and David Eichler are the managing members of Psilos Group Investors III, LLC and share voting and dispositive power over the shares held by the Psilos Group Entities. The address for these entities is 140 Broadway, 51st Floor, New York, NY 10005. |
| (2) | Consists of shares held by Revolution Extend Holdings LLC (“Revolution Extend”). Stephen M. Case is the sole manager of Revolution Extend and has sole voting and dispositive power over the shares held by Revolution Extend. In January 2012, Revolution Extend transferred 83,060 shares to David G. Golden, one of our directors, in order to satisfy certain obligations of Revolution Extend to Mr. Golden. The address for these entities is 1717 Rhode Island Avenue, NW, Washington, DC 20036. |
| (3) | Consists of (i) 1,964,933 shares held of record by Mr. Williams; (ii) 50,000 shares held in trust for Dawson M. Williams, Mr. Williams’ son, and for which Rebecca Brumley serves as trustee; (iii) 50,000 shares held in trust for Brennon T. Williams, Mr. Williams’ son, and for which Rebecca Brumley serves as trustee; and (iv) 353,962 shares issuable pursuant to stock options exercisable within 60 days of March 31, 2012. |
| (4) | Consists of (i) 32,396 shares; and (ii) 42,067 shares issuable pursuant to stock options exercisable within 60 days of March 31, 2012. |
| (5) | Consists of (i) 192,431 shares; and (ii) 318,500 shares issuable pursuant to stock options exercisable within 60 days of March 31, 2012. |
| (6) | Consists of (i) 51,458 shares; and (ii) 61,290 shares issuable pursuant to stock options exercisable within 60 days of March 31, 2012. |
| (7) | Consists of (i) 80,168 shares; and (ii) 173,250 shares issuable pursuant to stock options exercisable within 60 days of March 31, 2012. |
| (8) | Consists of 56,987 shares issuable pursuant to stock options exercisable within 60 days of March 31, 2012. |
| (9) | Consists of (i) 19,055 shares held of record by Golden Valley Partners, L.P. for which Mr. Golden is a managing partner; (ii) 83,060 shares held of record by Mr. Golden; and (iii) 4,300 shares issuable pursuant to stock options exercisable within 60 days of March 31, 2012. |
| (10) | Consists of the shares listed in footnote (1) above, which are held of record by the Psilos Group Entities. Mr. Krupa, one of our directors, is a Managing Member at Psilos Group Managers, LLC and shares voting and dispositive power over the shares held by the Psilos Group Entities. |
| (11) | Consists of the shares listed in footnote (1) above, which are held by the Psilos Group Entities. Dr. Waxman, one of our directors, is Senior Managing Member and Chief Executive Officer at Psilos Group Managers, LLC and shares voting and dispositive power over the shares held by the Psilos Group Entities. |
| (12) | Consists of (i) 11,885,178 shares beneficially owned by our directors and executive officers; and (ii) 1,010,356 shares issuable pursuant to stock options exercisable within 60 days of March 31, 2012. |
-110-
Table of Contents
General
The following is a summary of the rights of our common stock and preferred stock and certain provisions of our amended and restated certificate of incorporation and bylaws as they will be in effect upon the completion of this offering. This summary does not purport to be complete and is qualified in its entirety by the provisions of our amended and restated certificate of incorporation and bylaws, copies of which have been filed as exhibits to the registration statement of which this prospectus is a part.
Immediately following the completion of this offering, our authorized capital stock will consist of 105,000,000 shares, with a par value of $0.001 per share, of which:
| • | 100,000,000 shares are designated as common stock; and |
| • | 5,000,000 shares are designated as preferred stock. |
As of March 31, 2012, we had outstanding 16,296,745 shares of common stock, held by approximately 50 stockholders of record, and no shares of preferred stock, assuming the automatic conversion of all outstanding shares of our preferred stock into common stock upon the completion of this offering. In addition, as of March 31, 2012, we had outstanding options to acquire 3,050,438 shares of our common stock and an outstanding warrant to purchase up to 948,011 shares of our common stock subject to the warrant holder achieving specified targets of enrollment targets.
Common Stock
The holders of common stock are entitled to one vote per share on all matters submitted to a vote of our stockholders and do not have cumulative voting rights. Accordingly, holders of a majority of the shares of common stock entitled to vote in any election of directors may elect all of the directors standing for election. Subject to preferences that may be applicable to any preferred stock outstanding at the time, the holders of outstanding shares of common stock are entitled to receive ratably any dividends declared by our board of directors out of assets legally available. Upon our liquidation, dissolution or winding up, holders of our common stock are entitled to share ratably in all assets remaining after payment of liabilities and the liquidation preference of any then outstanding shares of preferred stock. Holders of common stock have no preemptive or conversion rights or other subscription rights. There are no redemption or sinking fund provisions applicable to the common stock.
Preferred Stock
After the completion of this offering, no shares of preferred stock will be outstanding. Pursuant to our amended and restated certificate of incorporation, our board of directors will have the authority, without further action by the stockholders, to issue from time to time up to 5,000,000 shares of preferred stock in one or more series. Our board of directors may designate the rights, preferences, privileges and restrictions of the preferred stock, including dividend rights, conversion rights, voting rights, redemption rights, liquidation preference, sinking fund terms and the number of shares constituting any series or the designation of any series. The issuance of preferred stock could have the effect of restricting dividends on the common stock, diluting the voting power of the common stock, impairing the liquidation rights of the common stock or delaying, deterring or preventing a change in control. Such issuance could have the effect of decreasing the market price of the common stock. The issuance of preferred stock or even the ability to issue preferred stock could also have the effect of delaying, deterring or preventing a change in control. We currently have no plans to issue any shares of preferred stock.
Warrant
As of March 31, 2012, a warrant to purchase up to 948,011 shares of our common stock was outstanding with an exercise price of $10.00 per share. The number of shares eligible to be purchased by the warrant holder in
-111-
Table of Contents
connection with this warrant depends on the warrant holder achieving specified enrollment targets. This warrant expires upon the earliest of (i) July 15, 2012, (ii) the effective date of our acquisition by another entity or a sale, lease or other disposition of all or substantially all of our assets, and (iii) two days prior to the commencement of the roadshow in connection with this offering, as further described in the warrant, which has been filed as an exhibit to the registration statement of which this prospectus is a part.
Registration Rights
Following the completion of this offering, the holders of an aggregate of 14,749,992 shares of our common stock or their permitted transferees are entitled to rights with respect to the registration of these shares under the Securities Act. These rights are provided under the terms of an investors’ rights agreement between us and the holders of these shares, which was entered into in connection with our preferred stock financings, and include demand registration rights, short-form registration rights and piggyback registration rights.
The registration rights terminate (i) upon a change of control of ownership or sale of all or substantially all of our assets, and (ii) with respect to the registration rights of an individual holder, (a) upon the earlier of the date five years following the completion of this offering or (b) the time when the holder can sell all of the holder’s shares in any three month period under Rule 144.
Demand Registration Rights
The holders of an aggregate of 14,749,992 shares of our common stock or their permitted transferees are entitled to demand registration rights. Under the terms of the investors’ rights agreement, we will be required, upon the written request of at least 30% of the holders of a majority of the shares that are entitled to rights under the investors’ rights agreement, to use commercially reasonable efforts to register all or a portion of these shares for public resale. We are not required to effect a registration pursuant to this provision of the investors’ rights agreement if the aggregate proceeds from such registration, net of underwriting discounts and commissions, would be less than $20.0 million, if Psilos Group Partners III, L.P. or Revolution Extend Holdings LLC request such a registration and have previously requested a registration, or for a period of six months after the effective date of this registration statement.
Short-Form Registration Rights
The holders of an aggregate of 14,749,992 shares of our common stock or their permitted transferees are also entitled to short-form registration rights. If we are eligible to file a registration statement on Form S-3 and have not done so within the preceding six month period, these holders have the right, upon written request to us, to have such shares registered by us if the proposed aggregate offering price of the shares to be registered by the holders requesting registration, net of underwriting discounts and commissions, is at least $5.0 million, subject to certain exceptions.
Piggyback Registration Rights
The holders of an aggregate of 14,749,992 shares of our common stock or their permitted transferees are entitled to piggyback registration rights. If we register any of our securities for our own account after the completion of this offering the holders of these shares are entitled to include their shares in the registration. The underwriters of any underwritten offering have the right to limit the number of shares to be included in the registration registered by these holders for marketing reasons, subject to certain limitations.
In any registration made pursuant to such investors’ rights agreement, all fees, costs and expenses of underwritten registrations will be borne by us and all selling expenses, including underwriting discounts and selling commissions, will be borne by the holders of the shares being registered.
-112-
Table of Contents
Anti-Takeover Effects of Delaware Law and Our Certificate of Incorporation and Bylaws
Our amended and restated certificate of incorporation and bylaws contain certain provisions that could have the effect of delaying, deferring or discouraging another party from acquiring control of us. These provisions and certain provisions of Delaware law, which are summarized below, could discourage takeovers, coercive or otherwise. These provisions are also designed, in part, to encourage persons seeking to acquire control of us to negotiate first with our board of directors. We believe that the benefits of increased protection of our potential ability to negotiate with an unfriendly or unsolicited acquirer outweigh the disadvantages of discouraging a proposal to acquire us.
Undesignated Preferred Stock
As discussed above, our board of directors has the ability to designate and issue preferred stock with voting or other rights or preferences that could deter hostile takeovers or delay changes in our control or management.
Limits on Ability of Stockholders to Act by Written Consent or Call a Special Meeting
Our amended and restated certificate of incorporation provides that our stockholders may not act by written consent. This limit on the ability of stockholders to act by written consent may lengthen the amount of time required to take stockholder actions. As a result, the holders of a majority of our capital stock would not be able to amend our bylaws or remove directors without holding a meeting of stockholders called in accordance with the bylaws.
In addition, our bylaws provide that special meetings of the stockholders may be called only by the chairman of the board, the chief executive officer, the president (in the absence of a chief executive officer) or our board of directors. A stockholder may not call a special meeting, which may delay the ability of our stockholders to force consideration of a proposal or for holders controlling a majority of our capital stock to take any action, including the removal of directors.
Requirements for Advance Notification of Stockholder Nominations and Proposals
Our bylaws establish advance notice procedures with respect to stockholder proposals and the nomination of candidates for election as directors, other than nominations made by or at the direction of our board of directors or a committee of the board of directors. These may have the effect of precluding the conduct of certain business at a meeting if the proper procedures are not followed and may also discourage or deter a potential acquirer from conducting a solicitation of proxies to elect its own slate of directors or otherwise attempt to obtain control of our company.
Board Classification
Our board of directors is divided into three classes. The directors in each class will serve for a three-year term, one class being elected each year by our stockholders. This system of electing and removing directors may tend to discourage a third party from making a tender offer or otherwise attempting to obtain control of us because it generally makes it more difficult for stockholders to replace a majority of the directors.
Delaware Anti-Takeover Statute
We are subject to the provisions of Section 203 of the Delaware General Corporation Law regulating corporate takeovers. In general, Section 203 prohibits a publicly held Delaware corporation from engaging, under certain circumstances, in a business combination with an interested stockholder for a period of three years following the date the person became an interested stockholder unless:
| • | prior to the date of the transaction, our board of directors approved either the business combination or the transaction that resulted in the stockholder becoming an interested stockholder; |
-113-
Table of Contents
| • | upon completion of the transaction that resulted in the stockholder becoming an interested stockholder, the interested stockholder owned at least 85% of the voting stock of the corporation outstanding at the time the transaction commenced, excluding for purposes of determining the voting stock outstanding, but not the outstanding voting stock owned by the interested stockholder, (i) shares owned by persons who are directors and also officers and (ii) shares owned by employee stock plans in which employee participants do not have the right to determine confidentially whether shares held subject to the plan will be tendered in a tender or exchange offer; or |
| • | at or subsequent to the date of the transaction, the business combination is approved by our board of directors and authorized at an annual or special meeting of stockholders, and not by written consent, by the affirmative vote of at least 66 2/3% of the outstanding voting stock that is not owned by the interested stockholder. |
Generally, a business combination includes a merger, asset or stock sale, or other transaction resulting in a financial benefit to the interested stockholder. An interested stockholder is a person who, together with affiliates and associates, owns or, within three years prior to the determination of interested stockholder status, did own 15% or more of a corporation’s outstanding voting stock. We expect the existence of this provision to have an anti-takeover effect with respect to transactions our board of directors does not approve in advance. We also anticipate that Section 203 may discourage attempts that might result in a premium over the market price for the shares of common stock held by stockholders.
The provisions of Delaware law and the provisions of our amended and restated certificate of incorporation and bylaws could have the effect of discouraging others from attempting hostile takeovers, and as a consequence, they might also inhibit temporary fluctuations in the market price of our common stock that often result from actual or rumored hostile takeover attempts. These provisions might also have the effect of preventing changes in our management. It is also possible that these provisions could make it more difficult to accomplish transactions that stockholders might otherwise deem to be in their best interests.
Transfer Agent and Registrar
Upon the completion of this offering, the transfer agent and registrar for our common stock will be Wells Fargo Shareowner Services. The transfer agent’s address is 161 North Concord Exchange, South St. Paul, Minnesota 55075, and its telephone number is (800) 689-8788.
NASDAQ Exchange Listing
We have applied to list our common stock on The NASDAQ Global Market under the symbol “XH.”
-114-
Table of Contents
SHARES ELIGIBLE FOR FUTURE SALE
Prior to this offering, there has been no public market for shares of our common stock. Future sales of substantial amounts of shares of common stock, including shares issued upon the exercise of outstanding options, in the public market after this offering, or the possibility of these sales occurring, could adversely affect the prevailing market price for our common stock or impair our ability to raise equity capital.
Upon the completion of this offering, a total of shares of common stock will be outstanding, assuming the automatic conversion of all outstanding shares of preferred stock into shares of common stock. Of these shares, all shares of common stock sold in this offering by us, plus any shares sold upon exercise of the underwriters’ over-allotment option, will be freely tradable in the public market without restriction or further registration under the Securities Act, unless these shares are held by “affiliates,” as that term is defined in Rule 144 under the Securities Act. The remaining shares of common stock will be “restricted securities,” as that term is defined in Rule 144 under the Securities Act. These restricted securities are eligible for public sale only if they are registered under the Securities Act or if they qualify for an exemption from registration under Rules 144 or 701 under the Securities Act, which are summarized below.
Subject to the lock-up agreements described below and the provisions of Rules 144 and 701 under the Securities Act, these restricted securities will be available for sale in the public market at various times beginning more than 180 days after the date of this prospectus.
In addition, of the 3,050,438 shares of our common stock that were subject to stock options outstanding as of March 31, 2012, options to purchase 1,866,918 shares of common stock were vested as of March 31, 2012 and will be eligible for sale 180 days following the effective date of this offering, subject to extension as described in the section entitled “Underwriters.”
Rule 144
In general, under Rule 144 as currently in effect, once we have been subject to public company reporting requirements for at least 90 days, a person who is not deemed to have been one of our affiliates for purposes of the Securities Act at any time during the 90 days preceding a sale and who has beneficially owned the shares proposed to be sold for at least six months, including the holding period of any prior owner other than our affiliates, is entitled to sell such shares without complying with the manner of sale, volume limitation or notice provisions of Rule 144, subject to compliance with the public information requirements of Rule 144. If such a person has beneficially owned the shares proposed to be sold for at least one year, including the holding period of any prior owner other than our affiliates, then such person is entitled to sell such shares without complying with any of the requirements of Rule 144.
In general, under Rule 144, as currently in effect, our affiliates or persons selling shares on behalf of our affiliates are entitled to sell upon expiration of the lock-up agreements described above, within any three-month period beginning 90 days after the date of this prospectus, a number of shares that does not exceed the greater of:
| • | 1% of the number of shares of common stock then outstanding, which will equal approximately shares immediately after this offering; or |
| • | the average weekly trading volume of the common stock during the four calendar weeks preceding the filing of a notice on Form 144 with respect to such sale. |
Sales under Rule 144 by our affiliates or persons selling shares on behalf of our affiliates are also subject to the manner of sale, notice, and current public information provisions of Rule 144.
-115-
Table of Contents
Rule 701
Rule 701 generally allows a stockholder who purchased shares of our common stock pursuant to a written compensatory plan or contract and who is not deemed to have been an affiliate of our company during the immediately preceding 90 days to sell these shares in reliance upon Rule 144 but without being required to comply with the public information, holding period, volume limitation, or notice provisions of Rule 144. Rule 701 also permits affiliates of our company to sell their Rule 701 shares under Rule 144 without complying with the holding period requirements of Rule 144. All holders of Rule 701 shares are required to wait until 90 days after the date of this prospectus before selling such shares pursuant to Rule 701.
Lock-Up Agreements
We, all of our directors and officers and the other holders of shares of common stock and holders of securities exercisable for or convertible into our common stock outstanding immediately prior to this offering have agreed that, without the prior written consent of Morgan Stanley & Co. LLC and Barclays Capital Inc. on behalf of the underwriters, we and they will not, during the period ending 180 days after the date of this prospectus:
| • | offer, pledge, sell, contract to sell, sell any option or contract to purchase, purchase any option or contract to sell, grant any option, right or warrant to purchase, lend or otherwise transfer or dispose of, directly or indirectly, any shares of our common stock or any securities convertible into or exercisable or exchangeable for shares of our common stock; or |
| • | enter into any hedge or other arrangement that transfers to another, in whole or in part, any of the economic consequences of ownership of our common stock; |
whether any transaction described above is to be settled by delivery of shares of our common stock or such other securities, in cash or otherwise. This agreement is subject to certain exceptions and is also subject to extension for up to an additional 34 days, as further described in “Underwriters.”
Registration Rights
Upon completion of this offering, the holders of 14,749,992 shares of common stock or their transferees will be entitled to various rights with respect to the registration of these shares under the Securities Act. Registration of these shares under the Securities Act would result in these shares becoming fully tradable without restriction under the Securities Act immediately upon the effectiveness of the registration, except for shares purchased by affiliates. See “Description of Capital Stock–Registration Rights” for additional information.
Registration Statements on Form S-8
We intend to file a registration statement on Form S-8 under the Securities Act to register the shares of common stock issued or reserved for issuance under our stock option plans. We expect to file this registration statement after this offering. Shares covered by this registration statement will be eligible for sale in the public market, upon the expiration or release from the terms of the lock-up agreements, and subject to vesting of such shares.
-116-
Table of Contents
CERTAIN MATERIAL UNITED STATES FEDERAL INCOME TAX
AND ESTATE TAX CONSEQUENCES TO NON-U.S. HOLDERS
The following discussion is a summary of certain material U.S. Federal income tax consequences applicable to non-U.S. holders (as defined below) of the acquisition, ownership and disposition of our common stock issued pursuant to this offering. This discussion is not a complete analysis of all the potential U.S. Federal income tax consequences relating thereto, nor does it address any tax consequences arising under any state, local or non-U.S. tax laws, the U.S. Federal estate tax or gift tax rules or any other U.S. Federal tax laws. This discussion is based on the Internal Revenue Code of 1986, as amended, or Code, Treasury Regulations promulgated thereunder, judicial decisions and published rulings and administrative pronouncements of the Internal Revenue Service, or IRS, all as in effect as of the date of this offering. These authorities may change, possibly retroactively, resulting in U.S. Federal income tax consequences different from those discussed below. No ruling has been or will be sought from the IRS with respect to the matters discussed below, and there can be no assurance that the IRS will not take a contrary position regarding the tax consequences of the acquisition, ownership or disposition of our common stock, or that any such contrary position would not be sustained by a court.
This discussion is limited to non-U.S. holders who purchase our common stock issued pursuant to this offering and who hold our common stock as a capital asset within the meaning of Section 1221 of the Code (generally, property held for investment). This discussion does not address all U.S. Federal income tax considerations that may be relevant to a particular holder in light of that holder’s particular circumstances. This discussion also does not consider any specific facts or circumstances that may be relevant to holders subject to special rules under the U.S. Federal income tax laws, including, without limitation, persons that own, or are deemed to own, more than 5% of our capital stock (except to the extent specifically set forth below), certain former citizens or long-term residents of the United States, an integral part or controlled entity of a foreign sovereign, partnerships and other pass-through entities, real estate investment trusts, regulated investment companies, “controlled foreign corporations,” “passive foreign investment companies,” corporations that accumulate earnings to avoid U.S. Federal income tax, banks, financial institutions, insurance companies, brokers, dealers or traders in securities, commodities or currencies, tax-exempt organizations, tax-qualified retirement plans, persons subject to the alternative minimum tax, persons who hold or receive our common stock pursuant to the exercise of any employee stock option or otherwise as compensation, persons holding our common stock as part of a hedge, straddle or other risk reduction strategy or as part of a conversion transaction or other integrated investment or persons deemed to sell our common stock under the constructive sale provisions of the Code.
If a partnership (or other entity taxed as a partnership for U.S. Federal income tax purposes) holds our common stock, the U.S. Federal income tax treatment of a partner in the partnership generally will depend on the status of the partner and upon the activities of the partnership. Accordingly, partnerships that hold our common stock and partners in such partnerships are urged to consult their tax advisors regarding the specific U.S. Federal income tax consequences to them of acquiring, owning or disposing of our common stock.
THIS DISCUSSION OF MATERIAL U.S. FEDERAL INCOME TAX CONSEQUENCES TO NON-U.S. HOLDERS IS FOR GENERAL INFORMATION ONLY AND IS NOT TAX ADVICE. PROSPECTIVE INVESTORS ARE URGED TO CONSULT THEIR TAX ADVISORS REGARDING THE PARTICULAR U.S. FEDERAL INCOME TAX CONSEQUENCES TO THEM OF ACQUIRING, OWNING AND DISPOSING OF OUR COMMON STOCK WITH RESPECT TO THEIR PARTICULAR SITUATIONS, AS WELL AS ANY TAX CONSEQUENCES ARISING UNDER ANY STATE, LOCAL OR NON-U.S. TAX LAWS, THE U.S. FEDERAL ESTATE OR GIFT TAX RULES, ANY OTHER U.S. FEDERAL TAX LAWS AND ANY APPLICABLE TAX TREATY.
-117-
Table of Contents
Definition of Non-U.S. Holder
For purposes of this discussion, a non-U.S. holder is any beneficial owner of our common stock that is neither a “U.S. person” nor a partnership for U.S. Federal income tax purposes. A U.S. person is any of the following:
| • | an individual citizen or resident of the United States; |
| • | a corporation (or other entity treated as a corporation for U.S. Federal income tax purposes) created or organized in or under the laws of the United States, any state thereof or the District of Columbia; |
| • | an estate the income of which is subject to U.S. Federal income taxation regardless of its source; or |
| • | a trust (i) if a court within the United States is able to exercise primary supervision over the administration of such trust and one or more U.S. persons have the authority to control all substantial decisions of such trust or (ii) that has a valid election in effect under applicable Treasury Regulations to be treated as a U.S. person for U.S. Federal income tax purposes. |
Distributions on Our Common Stock
As described in “Dividend Policy” above, we do not anticipate paying cash dividends on our common stock. If, however, we make distributions of cash or property on our common stock, such distributions will constitute dividends for U.S. Federal income tax purposes to the extent paid from our current or accumulated earnings and profits, as determined under U.S. Federal income tax principles. Amounts not treated as dividends for U.S. Federal income tax purposes will constitute a return of capital and will first be applied against and reduce a non-U.S. holder’s adjusted tax basis in its common stock, but not below zero. Any excess will be treated as gain from the sale of stock and will be treated as described under “Gain on Sale or Disposition of Our Common Stock” below.
Dividends paid to a non-U.S. holder of our common stock that are not effectively connected with a U.S. trade or business conducted by such holder generally will be subject to U.S. Federal withholding tax at a rate of 30% of the gross amount of the dividends, or such lower rate specified by an applicable tax treaty. To receive the benefit of a reduced treaty rate, a non-U.S. holder must timely furnish to us or our paying agent a valid IRS Form W-8BEN (or applicable successor form) certifying such holder’s qualification for the reduced rate. This certification must be provided to us or our paying agent prior to the payment of dividends and must be updated periodically. If the non- U.S. holder holds the stock through a financial institution or other agent acting on the non-U.S. holder’s behalf, the non-U.S. holder will be required to provide appropriate documentation to the agent, who then will be required to provide certification to us or our paying agent, either directly or through other intermediaries. Non-U.S. holders that do not timely provide us or our paying agent with the required certification, but that qualify for a reduced treaty rate, may obtain a refund of any excess amounts withheld by timely filing an appropriate claim for refund with the IRS. Non-U.S. holders should consult their tax advisors regarding possible entitlement to benefits under a tax treaty.
If a non-U.S. holder holds our common stock in connection with the conduct of a trade or business in the United States, and dividends paid on the common stock are effectively connected with such holder’s U.S. trade or business (and, if required by an applicable tax treaty, attributable to a permanent establishment maintained by the non-U.S. holder in the United States), dividends paid to the non-U.S. holder will be exempt from U.S. Federal withholding tax. To claim the exemption, the non-U.S. holder must furnish to us or our paying agent a valid IRS Form W-8ECI (or applicable successor form), certifying that the dividends are effectively connected with the non-U.S. holder’s conduct of a trade or business within the United States.
Any dividends paid on our common stock that are effectively connected with a non-U.S. holder’s U.S. trade or business (and, if required by an applicable tax treaty, attributable to a permanent establishment maintained by the non-U.S. holder in the United States) generally will be subject to graduated U.S. Federal income tax rates, net
-118-
Table of Contents
of deductions and credits, in the same manner as if such holder were a U.S. person. Dividends that are effectively connected with the conduct of a U.S. trade or business and paid to a non-U.S. holder that is a corporation also may be subject to a branch profits tax at a rate of 30% (or such lower rate specified by an applicable tax treaty). Non-U.S. holders should consult their tax advisors regarding any applicable tax treaties that may provide for different rules.
A non-U.S. holder that claims the benefit of an applicable income tax treaty generally will be required to satisfy applicable certification and other requirements prior to the distribution date. Non-U.S. holders should consult their tax advisors regarding their entitlement to benefits under a relevant income tax treaty.
Gain on Sale or Disposition of Our Common Stock
Subject to the discussion below regarding backup withholding, a non-U.S. holder generally will not be subject to U.S. Federal income tax on any gain realized upon the sale or disposition of our common stock unless:
| • | the gain is effectively connected with the non-U.S. holder’s conduct of a trade or business in the United States and, if required by an applicable tax treaty, attributable to a permanent establishment maintained by the non-U.S. holder in the United States; |
| • | the non-U.S. holder is a nonresident alien individual present in the United States for a period or periods of 183 days or more in the aggregate during the taxable year of the sale or disposition and certain other requirements are met; or |
| • | our common stock constitutes a U.S. real property interest by reason of our status as a U.S. real property holding corporation, or USRPHC, for U.S. Federal income tax purposes during the relevant statutory period. |
Unless an applicable tax treaty provides otherwise, the gain described in the first bullet point above generally will be subject to U.S. Federal income tax at graduated tax rates on a net income basis in the same manner as if such holder were a U.S. person. A non-U.S. holder that is a corporation also may be subject to a branch profits tax at a rate of 30% (or such lower rate specified by an applicable tax treaty). Non-U.S. holders should consult their tax advisors regarding any applicable tax treaties that may provide for different rules.
Gain described in the second bullet point above generally will be subject to U.S. Federal income tax at a flat 30% rate (or such a lower rate specified by an applicable income tax treaty), but may be offset by U.S. source capital losses of the non-U.S. holder (even though the individual is not considered a resident of the United States), provided that the non-U.S. holder has timely filed U.S. Federal income tax returns with respect to such losses.
With respect to the third bullet point above, we believe that we currently are not, and we do not anticipate becoming, a USRPHC for U.S. Federal income tax purposes. Because the determination of whether we are a USRPHC depends on the fair market value of our U.S. real property interests relative to the fair market value of our non-U.S. real property interests and other trade or business assets, however, there can be no assurance that we will not become a USRPHC in the future. In the event we do become a USRPHC, as long as our common stock is “regularly traded,” as defined by applicable Treasury Regulations, on an established securities market, our common stock will be treated as a U.S. real property interest only with respect to a non-U.S. holder that actually or constructively holds more than 5 percent of our common stock at any time during the shorter of the five-year period preceding the date of disposition or the holder’s holding period. We expect our common stock to be “regularly traded” on an established securities market, although we cannot guarantee that it will be so traded. If gain on the sale or other taxable disposition of our stock were subject to taxation under the third bullet point above, the non-U.S. holder would be subject to regular U.S. Federal income tax with respect to such gain in generally the same manner as a U.S. person.
-119-
Table of Contents
Information Reporting and Backup Withholding
Generally, we must report annually to the IRS and to each non-U.S. holder the amount of dividends paid to such holder, the name and address of the non-U.S. holder, and the amount of any tax withheld with respect to those dividends. This information also may be made available under a specific treaty or agreement with the tax authorities of the country in which the non-U.S. holder resides or is established. Under certain circumstances, the Code imposes an information reporting and a backup withholding obligation (currently at a rate of 28%) on certain reportable payments such as dividends paid on, or the gross proceeds from the disposition of, our common stock. Backup withholding generally will not, however, apply to payments of dividends to a non-U.S. holder of our common stock provided the non-U.S. holder furnishes to us or our paying agent the required certification as to its non-U.S. status, such as by providing a valid IRS Form W-8BEN or W-8ECI, or otherwise establishes an exemption. Notwithstanding the foregoing, backup withholding may apply if either we or our paying agent has actual knowledge, or reason to know, that the holder is a U.S. person that is not an exempt recipient.
Backup withholding is not an additional tax. Any amounts withheld under the backup withholding rules may be allowed as a refund or a credit against a non-U.S. holder’s U.S. Federal income tax liability, provided the required information is timely furnished to the IRS.
New Legislation Relating to Foreign Accounts
Newly enacted legislation may impose withholding taxes on certain types of payments made to “foreign financial institutions” (as specially defined under these rules) and certain other non-U.S. entities. Under this legislation, the failure to comply with additional certification, information reporting and other specified requirements could result in withholding tax being imposed on payments of dividends and sales proceeds to foreign intermediaries and certain non-U.S. holders. The legislation imposes a 30% withholding tax on dividends on, or gross proceeds from the sale or other disposition of, our common stock paid to a foreign financial institution or to a foreign non-financial entity, unless (i) the foreign financial institution undertakes certain diligence and reporting obligations, and other specified requirements are satisfied or (ii) the foreign non-financial entity either certifies it does not have any substantial U.S. owners or furnishes identifying information regarding each substantial U.S. owner, and other specified requirements are satisfied. If the payee is a foreign financial institution, it must enter into an agreement with the U.S. Treasury requiring, among other things, that it undertake to identify accounts held by certain U.S. persons or U.S.-owned foreign entities, annually report certain information about such accounts, and withhold 30% on payments to account holders whose actions prevent it from complying with these reporting and other requirements. The legislation would apply to payments made after December 31, 2012. Prospective investors should consult their tax advisors regarding this legislation.
-120-
Table of Contents
Under the terms and subject to the conditions in an underwriting agreement dated the date of this prospectus, the underwriters named below, for whom Morgan Stanley & Co. LLC and Barclays Capital Inc. are acting as representatives, have severally agreed to purchase, and we have agreed to sell to them, severally, the number of shares indicated below:
| Name |
Number of Shares | |
| Morgan Stanley & Co. LLC |
||
| Barclays Capital Inc. |
||
| Wells Fargo Securities, LLC |
||
|
| ||
| Total: |
||
|
|
The underwriters and the representatives are collectively referred to as the “underwriters” and the “representatives,” respectively. The underwriters are offering the shares of common stock subject to their acceptance of the shares from us and subject to prior sale. The underwriting agreement provides that the obligations of the several underwriters to pay for and accept delivery of the shares of common stock offered by this prospectus are subject to the approval of certain legal matters by their counsel and to certain other conditions. The underwriters are obligated to take and pay for all of the shares of common stock offered by this prospectus if any such shares are taken. However, the underwriters are not required to take or pay for the shares covered by the underwriters’ over-allotment option described below.
The underwriters initially propose to offer part of the shares of common stock directly to the public at the offering price listed on the cover page of this prospectus and part to certain dealers, which may include the underwriters, at such offering price less a selling concession not in excess of $ per share. After the initial offering of the shares of common stock, the offering price and other selling terms may from time to time be varied by the representatives.
We have granted to the underwriters an option, exercisable for 30 days from the date of this prospectus, to purchase up to additional shares of common stock at the public offering price listed on the cover page of this prospectus, less underwriting discounts and commissions. The underwriters may exercise this option solely for the purpose of covering over-allotments, if any, made in connection with the offering of the shares of common stock offered by this prospectus. To the extent the option is exercised, each underwriter will become obligated, subject to certain conditions, to purchase about the same percentage of the additional shares of common stock as the number listed next to the underwriter’s name in the preceding table bears to the total number of shares of common stock listed next to the names of all underwriters in the preceding table.
The following table shows the per share and total public offering price, underwriting discounts and commissions, and proceeds before expenses to us. These amounts are shown assuming both no exercise and full exercise of the underwriters’ option to purchase up to an additional shares of common stock.
| Total
Per Share |
No Exercise |
Full Exercise |
||||||||||
| Public offering price |
$ | $ | $ | |||||||||
| Underwriting discounts and commissions to be paid by us |
$ | $ | $ | |||||||||
| Proceeds, before expenses, to us |
$ | $ | $ | |||||||||
The estimated offering expenses payable by us, exclusive of the underwriting discounts and commissions, are approximately $ .
The underwriters have informed us that they do not intend sales to discretionary accounts to exceed 5% of the total number of shares of common stock offered by them.
-121-
Table of Contents
We have applied to list our common stock on The NASDAQ Global Market under the symbol “XH.”
We and all directors and officers and the holders of all of our outstanding stock and stock options have agreed that, without the prior written consent of Morgan Stanley & Co. LLC and Barclays Capital Inc. on behalf of the underwriters, we and they will not, during the period ending 180 days after the date of this prospectus:
| • | offer, pledge, sell, contract to sell, sell any option or contract to purchase, purchase any option or contract to sell, grant any option, right or warrant to purchase lend or otherwise transfer or dispose of, directly or indirectly, any shares of common stock or any securities convertible into or exercisable or exchangeable for shares of common stock; |
| • | file any registration statement with the Securities and Exchange Commission relating to the offering of any shares of common stock or any securities convertible into or exercisable or exchangeable for common stock; or |
| • | enter into any swap or other arrangement that transfers to another, in whole or in part, any of the economic consequences of ownership of the common stock, |
whether any such transaction described above is to be settled by delivery of common stock or such other securities, in cash or otherwise. In addition, we and each such person agrees that, without the prior written consent of Morgan Stanley & Co. LLC and Barclays Capital Inc. on behalf of the underwriters, we will not, during the period ending 180 days after the date of this prospectus, make any demand for, or exercise any right with respect to, the registration of any shares of common stock or any security convertible into or exercisable or exchangeable for common stock.
The restrictions described in the immediately preceding paragraph to do not apply to:
| • | the sale of shares to the underwriters; or |
| • | transactions by any person other than us relating to shares of common stock or other securities acquired in open market transactions after the completion of the offering of the shares. |
The 180 day restricted period described in the preceding paragraph will be extended if:
| • | during the last 17 days of the 180 day restricted period we issue an earnings release or material news event relating to us occurs, or |
| • | prior to the expiration of the 180 day restricted period, we announce that we will release earnings results during the 16 day period beginning on the last day of the 180 day period, |
in which case the restrictions described in the preceding paragraph will continue to apply until the expiration of the 18 day period beginning on the issuance of the earnings release or the occurrence of the material news or material event.
In order to facilitate the offering of the common stock, the underwriters may engage in transactions that stabilize, maintain or otherwise affect the price of the common stock. Specifically, the underwriters may sell more shares than they are obligated to purchase under the underwriting agreement, creating a short position. A short sale is covered if the short position is no greater than the number of shares available for purchase by the underwriters under the over-allotment option. The underwriters can close out a covered short sale by exercising the over-allotment option or purchasing shares in the open market. In determining the source of shares to close out a covered short sale, the underwriters will consider, among other things, the open market price of shares compared to the price available under the over-allotment option. The underwriters may also sell shares in excess of the over-allotment option, creating a naked short position. The underwriters must close out any naked short position by purchasing shares in the open market. A naked short position is more likely to be created if the underwriters are concerned that there may be downward pressure on the price of the common stock in the open market after pricing that could adversely affect investors who purchase in this offering. As an additional means
-122-
Table of Contents
of facilitating this offering, the underwriters may bid for, and purchase, shares of common stock in the open market to stabilize the price of the common stock. These activities may raise or maintain the market price of the common stock above independent market levels or prevent or retard a decline in the market price of the common stock. The underwriters are not required to engage in these activities and may end any of these activities at any time.
We have agreed to indemnify the underwriters from and against losses, claims, damages and liabilities caused by any untrue statement or alleged untrue statement or omission of a material fact contained in or omitted from this prospectus or other materials related to this offering. Each underwriter has agreed, severally and not jointly, to indemnify us and hold us harmless from any untrue statement or alleged untrue statement or omission of a material fact contained in or omitted from this prospectus or other materials related to this offering but only with reference to information relating to the underwriter furnished to us in writing expressly for use in this prospectus or other materials related to this offering.
A prospectus in electronic format may be made available on websites maintained by one or more underwriters, or selling group members, if any, participating in this offering. The representatives may agree to allocate a number of shares of common stock to underwriters for sale to their online brokerage account holders. Internet distributions will be allocated by the representatives to underwriters that may make internet distributions on the same basis as other allocations.
In the ordinary course of business, affiliates of Wells Fargo & Company, the parent company of Wells Fargo Securities, LLC, one of the underwriters’ in this offering, have, from time to time, co-marketed, and may in the future co-market, our services for us, for which they have received or will receive customary fees. These services are unrelated to this offering.
Pricing of the Offering
Prior to this offering, there has been no public market for our common stock. The initial public offering price was determined by negotiations between us and the representatives. Among the factors considered in determining the initial public offering price were our future prospects and those of our industry in general, our sales, earnings and certain other financial and operating information in recent periods, and the price-earnings ratios, price-sales ratios, market prices of securities, and certain financial and operating information of companies engaged in activities similar to ours.
Selling Restrictions
European Economic Area
In relation to each Member State of the European Economic Area which has implemented the Prospectus Directive (each, a “Relevant Member State”) an offer to the public of any shares of our common stock may not be made in that Relevant Member State, except that an offer to the public in that Relevant Member State of any shares of our common stock may be made at any time under the following exemptions under the Prospectus Directive, if they have been implemented in that Relevant Member State:
| • | to any legal entity which is a qualified investor as defined in the Prospectus Directive; |
| • | to fewer than 100 or, if the Relevant Member State has implemented the relevant provision of the 2010 PD Amending Directive, 150, natural or legal persons (other than qualified investors as defined in the Prospectus Directive), as permitted under the Prospectus Directive, subject to obtaining the prior consent of the representatives for any such offer; or |
| • | in any other circumstances falling within Article 3(2) of the Prospectus Directive, provided that no such offer of shares of our common stock shall result in a requirement for the publication by us or any underwriter of a prospectus pursuant to Article 3 of the Prospectus Directive. |
-123-
Table of Contents
For the purposes of this provision, the expression an “offer to the public” in relation to any shares of our common stock in any Relevant Member State means the communication in any form and by any means of sufficient information on the terms of the offer and any shares of our common stock to be offered so as to enable an investor to decide to purchase any shares of our common stock, as the same may be varied in that Member State by any measure implementing the Prospectus Directive in that Member State, the expression “Prospectus Directive” means Directive 2003/71/EC (and amendments thereto, including the 2010 PD Amending Directive, to the extent implemented in the Relevant Member State), and includes any relevant implementing measure in the Relevant Member State, and the expression “2010 PD Amending Directive” means Directive 2010/73/EU.
United Kingdom
Each underwriter has represented and agreed that:
| • | it has only communicated or caused to be communicated and will only communicate or cause to be communicated an invitation or inducement to engage in investment activity (within the meaning of Section 21 of the FSMA) received by it in connection with the issue or sale of the shares of our common stock in circumstances in which Section 21(1) of the FSMA does not apply to us; and |
| • | it has complied and will comply with all applicable provisions of the FSMA with respect to anything done by it in relation to the shares of our common stock in, from or otherwise involving the United Kingdom. |
-124-
Table of Contents
The validity of the shares of common stock offered hereby will be passed upon for us by Wilson Sonsini Goodrich & Rosati, Professional Corporation, Palo Alto, California. The underwriters are being represented by Goodwin Procter LLP, Menlo Park, California, in connection with this offering.
The consolidated financial statements of Extend Health, Inc. at June 30, 2010 and 2011, and for each of the three years in the period ended June 30, 2011, appearing in this Prospectus and Registration Statement have been audited by Ernst & Young LLP, independent registered public accounting firm, as set forth in their report thereon appearing elsewhere herein, and are included in reliance upon such report given on the authority of such firm as experts in accounting and auditing.
WHERE YOU CAN FIND MORE INFORMATION
We have filed with the SEC a registration statement on Form S-1 under the Securities Act with respect to the shares of common stock offered by this prospectus. This prospectus, which constitutes a part of the registration statement, does not contain all of the information set forth in the registration statement, some of which is contained in exhibits to the registration statement as permitted by the rules and regulations of the SEC. For further information with respect to us and our common stock, we refer you to the registration statement, including the exhibits filed as a part of the registration statement. Statements contained in this prospectus concerning the contents of any contract or any other document is not necessarily complete. If a contract or document has been filed as an exhibit to the registration statement, please see the copy of the contract or document that has been filed. Each statement is this prospectus relating to a contract or document filed as an exhibit is qualified in all respects by the filed exhibit. You may obtain copies of this information by mail from the Public Reference Section of the SEC, 100 F Street, N.E., Room 1580, Washington, D.C. 20549, at prescribed rates. You may obtain information on the operation of the public reference rooms by calling the SEC at 1-800-SEC-0330. The SEC also maintains an internet website that contains reports, proxy statements and other information about issuers, like us, that file electronically with the SEC. The address of that website is www.sec.gov.
As a result of this offering, we will become subject to the information and reporting requirements of the Securities Exchange Act of 1934 and, in accordance with this law, will file periodic reports, proxy statements and other information with the SEC. These periodic reports, proxy statements and other information will be available for inspection and copying at the SEC’s public reference facilities and the website of the SEC referred to above. We also maintain a website at www.extendhealth.com. Upon completion of this offering, you may access these materials free of charge as soon as reasonably practicable after they are electronically filed with, or furnished to, the SEC. Information contained on our website is not a part of this prospectus and the inclusion of our website address in this prospectus is an inactive textual reference only.
-125-
Table of Contents
INDEX TO CONSOLIDATED FINANCIAL STATEMENTS
| Page | ||||
| F-2 | ||||
| F-3 | ||||
| F-4 | ||||
| Consolidated Statements of Convertible Preferred Stock and Stockholders’ Deficit |
F-5 | |||
| F-6 | ||||
| F-7 | ||||
F-1
Table of Contents
Report of Independent Registered Public Accounting Firm
The Board of Directors and Stockholders of Extend Health, Inc.
We have audited the accompanying consolidated balance sheets of Extend Health, Inc. as of June 30, 2011 and 2010, and the related consolidated statements of operations, convertible preferred stock and stockholders’ deficit and cash flows for each of the three years in the period ended June 30, 2011. These financial statements are the responsibility of the Company’s management. Our responsibility is to express an opinion on these financial statements based on our audits.
We conducted our audits in accordance with the standards of the Public Company Accounting Oversight Board (United States). Those standards require that we plan and perform the audit to obtain reasonable assurance about whether the financial statements are free of material misstatement. We were not engaged to perform an audit of the Company’s internal control over financial reporting. Our audits included consideration of internal control over financial reporting as a basis for designing audit procedures that are appropriate in the circumstances, but not for the purpose of expressing an opinion on the effectiveness of the Company’s internal control over financial reporting. Accordingly, we express no such opinion. An audit also includes examining, on a test basis, evidence supporting the amounts and disclosures in the financial statements, assessing the accounting principles used and significant estimates made by management, and evaluating the overall financial statement presentation. We believe that our audits provide a reasonable basis for our opinion.
In our opinion, the financial statements referred to above present fairly, in all material respects, the consolidated financial position of Extend Health, Inc. at June 30, 2011 and 2010, and the consolidated results of their operations and their cash flows for each of the three years in the period ended June 30, 2011, in conformity with U.S. generally accepted accounting principles.
/s/ Ernst & Young LLP
San Francisco, California
September 1, 2011
F-2
Table of Contents
Consolidated Balance Sheets
(In thousands, except share and per share amounts)
| June 30, | March 31, 2012 |
Pro
forma Convertible Preferred Stock and Stockholders’ Deficit March 31, 2012 |
||||||||||||||
| 2010 | 2011 | |||||||||||||||
| (unaudited) | ||||||||||||||||
| ASSETS |
||||||||||||||||
| Current assets: |
||||||||||||||||
| Cash and cash equivalents |
$ | 20,612 | $ | 23,081 | $ | 13,261 | ||||||||||
| Short-term investments |
— | 15,689 | — | |||||||||||||
| Restricted cash |
242 | 204 | 77 | |||||||||||||
| Prepaid expenses and other current assets |
698 | 791 | 3,070 | |||||||||||||
| Accounts receivable |
245 | 470 | 687 | |||||||||||||
| Deferred tax assets |
— | 805 | 805 | |||||||||||||
|
|
|
|
|
|
|
|||||||||||
| Total current assets |
21,797 | 41,040 | 17,900 | |||||||||||||
| Property and equipment, net |
3,615 | 3,095 | 3,265 | |||||||||||||
| Deferred tax assets, non-current |
— | 257 | 257 | |||||||||||||
| Other assets |
115 | 104 | 70 | |||||||||||||
|
|
|
|
|
|
|
|||||||||||
| TOTAL ASSETS |
$ | 25,527 | $ | 44,496 | $ | 21,492 | ||||||||||
|
|
|
|
|
|
|
|||||||||||
| LIABILITIES AND STOCKHOLDERS’ DEFICIT |
||||||||||||||||
| Current liabilities: |
||||||||||||||||
| Accounts payable |
$ | 178 | $ | 490 | $ | 256 | ||||||||||
| Accrued expenses |
1,703 | 7,266 | 6,668 | |||||||||||||
| Debt obligations |
— | 139 | 3,480 | |||||||||||||
| Capital lease obligations |
721 | 108 | 47 | |||||||||||||
| Deferred revenue |
12,664 | 15,509 | 16,443 | |||||||||||||
|
|
|
|
|
|
|
|||||||||||
| Total current liabilities |
15,266 | 23,512 | 26,894 | |||||||||||||
| Debt obligations, non-current |
— | 241 | 6,641 | |||||||||||||
| Capital lease obligations, non-current |
468 | 19 | — | |||||||||||||
| Deferred revenue, non-current |
123 | 195 | 141 | |||||||||||||
| Other long-term liabilities |
— | 528 | 599 | |||||||||||||
|
|
|
|
|
|
|
|||||||||||
| Total liabilities |
15,857 | 24,495 | 34,275 | |||||||||||||
| Commitments and contingencies (Note 7) |
||||||||||||||||
| Convertible preferred stock; $0.001 par value: |
||||||||||||||||
| Series A; 9,000,000 shares authorized as of June 30, 2010 and 2011 and March 31, 2012 (unaudited); 9,000,000 shares issued and outstanding as of June 30, 2010 and 2011 and March 31, 2012 (unaudited) (aggregate liquidation preference of $13,500), actual; no shares issued and outstanding (unaudited), pro forma |
8,761 | 8,761 | 8,761 | $ | — | |||||||||||
| Series B; 5,750,000 shares authorized as of June 30, 2010 and 2011 and March 31, 2012 (unaudited); 5,749,992 shares issued and outstanding as of June 30, 2010 and 2011 and March 31, 2012 (unaudited) (aggregate liquidation preference of $15,000), actual; no shares issued and outstanding (unaudited), pro forma |
13,778 | 13,778 | 13,778 | — | ||||||||||||
| Stockholders’ deficit: |
||||||||||||||||
| Common stock; $0.001 par value: 19,250,000 shares authorized as of June 30, 2010 and 2011 and 20,475,000 shares authorized as of March 31, 2012 (unaudited); 1,360,359, 1,517,267 and 1,546,753 shares issued and outstanding as of June 30, 2010, 2011 and March 31, 2012 (unaudited), respectively, actual; 16,296,745 shares issued and outstanding (unaudited), pro forma |
1 | 1 | 1 | 16 | ||||||||||||
| Additional paid-in capital |
744 | 1,113 | 2,110 | 24,634 | ||||||||||||
| Accumulated other comprehensive income |
— | 5 | — | — | ||||||||||||
| Accumulated deficit |
(13,614 | ) | (3,657 | ) |
|
(37,433 |
) |
|
(37,433 |
) | ||||||
|
|
|
|
|
|
|
|
|
|||||||||
| Total stockholders’ deficit |
(12,869 | ) | (2,538 | ) |
|
(35,322 |
) |
|
(12,783 |
) | ||||||
|
|
|
|
|
|
|
|
|
|||||||||
| TOTAL LIABILITIES AND STOCKHOLDERS’ DEFICIT |
$ | 25,527 | $ | 44,496 | $ |
21,492 |
|
$ |
21,492 |
| ||||||
|
|
|
|
|
|
|
|
|
|||||||||
See accompanying notes to consolidated financial statements.
F-3
Table of Contents
Consolidated Statements of Operations
(In thousands, except share and per share amounts)
| Year Ended June 30, | Nine Months Ended March 31, |
|||||||||||||||||||
| 2009 | 2010 | 2011 | 2011 | 2012 | ||||||||||||||||
| (unaudited) | ||||||||||||||||||||
| Revenue: |
||||||||||||||||||||
| Commissions |
$ | 16,933 | $ | 43,646 | $ | 50,451 | $ | 35,716 | $ | 48,411 | ||||||||||
| Other |
779 | 370 | 676 | 442 | 468 | |||||||||||||||
|
|
|
|
|
|
|
|
|
|
|
|||||||||||
| Total revenue |
17,712 | 44,016 | 51,127 | 36,158 | 48,879 | |||||||||||||||
|
|
|
|
|
|
|
|
|
|
|
|||||||||||
| Operating expenses: |
||||||||||||||||||||
| Service center |
18,117 | 14,994 | 18,551 | 15,050 | 19,955 | |||||||||||||||
| Sales and marketing |
6,768 | 7,290 | 10,134 | 6,346 | 10,856 | |||||||||||||||
| Technology |
2,096 | 3,060 | 3,195 | 2,242 | 3,264 | |||||||||||||||
| General and administrative |
5,072 | 5,464 | 6,728 | 5,043 | 5,974 | |||||||||||||||
| Restructuring expense |
— | 314 | — | — | — | |||||||||||||||
|
|
|
|
|
|
|
|
|
|
|
|||||||||||
| Total operating expenses |
32,053 | 31,122 | 38,608 | 28,681 | 40,049 | |||||||||||||||
|
|
|
|
|
|
|
|
|
|
|
|||||||||||
| Income (loss) from operations |
(14,341 | ) | 12,894 | 12,519 | 7,477 | 8,830 | ||||||||||||||
| Interest income |
58 | 28 | 53 | 35 | 30 | |||||||||||||||
| Interest expense |
(80 | ) | (69 | ) | (110 | ) | (81 | ) | (323 | ) | ||||||||||
|
|
|
|
|
|
|
|
|
|
|
|||||||||||
| Income (loss) before income taxes |
(14,363 | ) | 12,853 | 12,462 | 7,431 | 8,537 | ||||||||||||||
| Provision (benefit) for income taxes |
2 | 346 | 2,505 | 575 | 3,313 | |||||||||||||||
|
|
|
|
|
|
|
|
|
|
|
|||||||||||
| Net income (loss) |
$ | (14,365 | ) | $ | 12,507 | $ | 9,957 | $ | 6,856 | $ | 5,224 | |||||||||
|
|
|
|
|
|
|
|
|
|
|
|||||||||||
| Net income (loss) attributable to common stockholders: |
||||||||||||||||||||
| Basic |
$ | (14,365 | ) | $ | 280 | $ | 676 | $ | 395 | $ | (30,345 | ) | ||||||||
|
|
|
|
|
|
|
|
|
|
|
|||||||||||
| Diluted |
$ | (14,365 | ) | $ | 821 | $ | 1,139 | $ | 635 | $ | (30,345 | ) | ||||||||
|
|
|
|
|
|
|
|
|
|
|
|||||||||||
| Net income (loss) per share attributable to common stockholders: |
||||||||||||||||||||
| Basic |
$ | (72.01 | ) | $ | 0.67 | $ | 0.47 | $ | 0.28 | $ | (19.95 | ) | ||||||||
|
|
|
|
|
|
|
|
|
|
|
|||||||||||
| Diluted |
$ | (72.01 | ) | $ | 0.64 | $ | 0.44 | $ | 0.27 | $ | (19.95 | ) | ||||||||
|
|
|
|
|
|
|
|
|
|
|
|||||||||||
| Weighted-average shares used to compute net income (loss) per share attributable to common stockholders: |
||||||||||||||||||||
| Basic |
199,495 | 414,615 | 1,424,511 | 1,394,005 | 1,521,353 | |||||||||||||||
|
|
|
|
|
|
|
|
|
|
|
|||||||||||
| Diluted |
199,495 | 1,288,140 | 2,569,722 | 2,378,444 | 1,521,353 | |||||||||||||||
|
|
|
|
|
|
|
|
|
|
|
|||||||||||
| Cash dividend declared per common share |
$ | — | $ | — | $ | — | $ | — | $ | 2.25 | ||||||||||
|
|
|
|
|
|
|
|
|
|
|
|||||||||||
| Pro forma net income per share attributable to common stockholders (unaudited): |
||||||||||||||||||||
| Basic |
$ | $ | ||||||||||||||||||
|
|
|
|
|
|||||||||||||||||
| Diluted |
$ | $ | ||||||||||||||||||
|
|
|
|
|
|||||||||||||||||
| Weighted-average shares used to compute |
||||||||||||||||||||
| Basic |
||||||||||||||||||||
|
|
|
|
|
|||||||||||||||||
| Diluted |
||||||||||||||||||||
|
|
|
|
|
|||||||||||||||||
See accompanying notes to consolidated financial statements.
F-4
Table of Contents
Consolidated Statements of Convertible Preferred Stock and Stockholders’ Deficit
(In thousands, except share amounts)
| Convertible Preferred Stock | Common Stock | Additional Paid-In Capital |
Accumulated Other Comprehensive Income (Loss) |
Accumulated Deficit |
Total Stockholders’ Deficit |
|||||||||||||||||||||||||||||||||||||
| Series A | Series B | |||||||||||||||||||||||||||||||||||||||||
| Shares | Amount | Shares | Amount | Shares | Amount | |||||||||||||||||||||||||||||||||||||
| Balance at June 30, 2008 |
9,000,000 | $ | 8,761 | 5,749,992 | $ | 13,778 | 103,845 | $ | — | $ | 73 | $ | — | $ | (11,756 | ) | $ | (11,683 | ) | |||||||||||||||||||||||
| Issuance of common stock for option exercises |
— | — | — | — | 205,979 | — | 54 | — | — | 54 | ||||||||||||||||||||||||||||||||
| Stock-based compensation expense |
— | — | — | — | — | — | 69 | — | — | 69 | ||||||||||||||||||||||||||||||||
| Net loss and total comprehensive loss |
— | — | — | — | — | — | — | — | (14,365 | ) | (14,365 | ) | ||||||||||||||||||||||||||||||
|
|
|
|
|
|
|
|
|
|
|
|
|
|
|
|
|
|
|
|
|
|||||||||||||||||||||||
| Balance at June 30, 2009 |
9,000,000 | 8,761 | 5,749,992 | 13,778 | 309,824 | — | 196 | (26,121 | ) | (25,925 | ) | |||||||||||||||||||||||||||||||
| Issuance of common stock for option exercises |
— | — | — | — | 1,050,535 | 1 | 454 | — | — | 455 | ||||||||||||||||||||||||||||||||
| Stock-based compensation expense |
— | — | — | — | — | — | 94 | — | — | 94 | ||||||||||||||||||||||||||||||||
| Net income and total comprehensive income |
— | — | — | — | — | — | — | — | 12,507 | 12,507 | ||||||||||||||||||||||||||||||||
|
|
|
|
|
|
|
|
|
|
|
|
|
|
|
|
|
|
|
|
|
|||||||||||||||||||||||
| Balance at June 30, 2010 |
9,000,000 | 8,761 | 5,749,992 | 13,778 | 1,360,359 | 1 | 744 | — | (13,614 | ) | (12,869 | ) | ||||||||||||||||||||||||||||||
| Issuance of common stock for option exercises |
— | — | — | — | 156,908 | — | 88 | — | 88 | |||||||||||||||||||||||||||||||||
| Stock-based compensation expense |
— | — | — | — | — | — | 250 | — | — | 250 | ||||||||||||||||||||||||||||||||
| Excess tax benefits from stock-based compensation |
— | — | — | — | — | — | 31 | — | — | 31 | ||||||||||||||||||||||||||||||||
| Other comprehensive income: |
||||||||||||||||||||||||||||||||||||||||||
| Change in unrealized gain on short-term investments |
— | — | — | — | — | — | — | 5 | — | 5 | ||||||||||||||||||||||||||||||||
| Net income |
— | — | — | — | — | — | — | — | 9,957 | 9,957 | ||||||||||||||||||||||||||||||||
|
|
|
|||||||||||||||||||||||||||||||||||||||||
| Total comprehensive income |
9,962 | |||||||||||||||||||||||||||||||||||||||||
|
|
|
|
|
|
|
|
|
|
|
|
|
|
|
|
|
|
|
|
|
|||||||||||||||||||||||
| Balance at June 30, 2011 |
9,000,000 | 8,761 | 5,749,992 | 13,778 | 1,517,267 | 1 | 1,113 | 5 | (3,657 | ) | (2,538 | ) | ||||||||||||||||||||||||||||||
| Issuance of common stock for option exercises (unaudited) |
— | — | — | — | 29,486 | — | 5 | — | — | 5 | ||||||||||||||||||||||||||||||||
| Stock-based compensation expense (unaudited) |
— | — | — | — | — | — | 992 | — | — | 992 | ||||||||||||||||||||||||||||||||
| Dividend distributions (unaudited) |
— | — | — | — | — | — | — | — | (39,000 | ) | (39,000 | ) | ||||||||||||||||||||||||||||||
| Other comprehensive income: |
||||||||||||||||||||||||||||||||||||||||||
| Change in unrealized gain on short-term investments (unaudited) |
— | — | — | — | — | — | — | (5 | ) | — | (5 | ) | ||||||||||||||||||||||||||||||
| Net income (unaudited) |
— | — | — | — | — | — | — | — | 5,224 | 5,224 | ||||||||||||||||||||||||||||||||
|
|
|
|||||||||||||||||||||||||||||||||||||||||
| Total comprehensive income (unaudited) |
5,219 | |||||||||||||||||||||||||||||||||||||||||
|
|
|
|
|
|
|
|
|
|
|
|
|
|
|
|
|
|
|
|
|
|||||||||||||||||||||||
| Balance at March 31, 2012 (unaudited) |
9,000,000 | $ | 8,761 | 5,749,992 | $ | 13,778 | 1,546,753 | $ | 1 | $ | 2,110 | $ | — | $ | (37,433 | ) | $ | (35,322 | ) | |||||||||||||||||||||||
|
|
|
|
|
|
|
|
|
|
|
|
|
|
|
|
|
|
|
|
|
|
||||||||||||||||||||||
See accompanying notes to consolidated financial statements.
F-5
Table of Contents
Consolidated Statements of Cash Flows
(In thousands)
| Year Ended June 30, | Nine Months Ended March 31, |
|||||||||||||||||||
| 2009 | 2010 | 2011 | 2011 | 2012 | ||||||||||||||||
| (unaudited) | ||||||||||||||||||||
| CASH FLOWS FROM OPERATING ACTIVITIES: |
||||||||||||||||||||
| Net income (loss) |
$ | (14,365 | ) | $ | 12,507 | $ | 9,957 | $ | 6,856 | $ | 5,224 | |||||||||
| Adjustments to reconcile net income (loss) to net cash from operating activities: |
||||||||||||||||||||
| Depreciation and amortization |
1,013 | 1,831 | 2,144 | 1,636 | 1,384 | |||||||||||||||
| Loss on disposal of property and equipment |
— | — | 33 | 33 | — | |||||||||||||||
| Stock-based compensation expense |
69 | 94 | 250 | 157 | 992 | |||||||||||||||
| Excess tax benefits from stock-based compensation |
— | — | (31 | ) | (31 | ) | — | |||||||||||||
| Deferred income taxes |
— | — | (1,062 | ) | (827 | ) | — | |||||||||||||
| Changes in operating assets and liabilities: |
||||||||||||||||||||
| Prepaid expenses and other current assets |
(203 | ) | (387 | ) | (93 | ) | 129 | (2,279 | ) | |||||||||||
| Accounts receivable |
(90 | ) | (155 | ) | (225 | ) | (492 | ) | (217 | ) | ||||||||||
| Other assets |
(59 | ) | 17 | 11 | 48 | 34 | ||||||||||||||
| Accounts payable |
505 | (454 | ) | 312 | 229 | (234 | ) | |||||||||||||
| Accrued expenses |
1,267 | (89 | ) | 5,594 | 3,268 | (598 | ) | |||||||||||||
| Deferred revenue |
12,268 | (882 | ) | 2,917 | 6,152 | 880 | ||||||||||||||
| Other non-current liabilities |
— | — | 528 | 214 | 71 | |||||||||||||||
|
|
|
|
|
|
|
|
|
|
|
|||||||||||
| Net cash from operating activities |
405 | 12,482 | 20,335 | 17,372 | 5,257 | |||||||||||||||
|
|
|
|
|
|
|
|
|
|
|
|||||||||||
| CASH FLOWS FROM INVESTING ACTIVITIES: |
||||||||||||||||||||
| Purchases of property and equipment |
(1,721 | ) | (1,290 | ) | (2,135 | ) | (1,825 | ) | (1,554 | ) | ||||||||||
| Proceeds from sale of property and equipment |
— | — | 3 | 3 | — | |||||||||||||||
| Purchases of short-term investments |
— | — | (17,484 | ) | (8,820 | ) | (4,044 | ) | ||||||||||||
| Sales of short-term investments |
— | — | — | — | 11,878 | |||||||||||||||
| Maturities of short-term investments |
— | — | 1,800 | — | 7,850 | |||||||||||||||
| Changes in restricted cash |
(84 | ) | (46 | ) | 38 | (11 | ) | 127 | ||||||||||||
|
|
|
|
|
|
|
|
|
|
|
|||||||||||
| Net cash from investing activities |
(1,805 | ) | (1,336 | ) | (17,778 | ) | (10,653 | ) | 14,257 | |||||||||||
|
|
|
|
|
|
|
|
|
|
|
|||||||||||
| CASH FLOWS FROM FINANCING ACTIVITIES: |
||||||||||||||||||||
| Proceeds from exercise of options |
54 | 455 | 88 | 82 | 5 | |||||||||||||||
| Dividend distributions |
— | — | — | — | (39,000 | ) | ||||||||||||||
| Excess tax benefits from stock-based compensation |
— | — | 31 | 31 | — | |||||||||||||||
| Proceeds from debt obligations |
— | — | 500 | 500 | 15,000 | |||||||||||||||
| Principal payments on debt obligations |
— | — | (120 | ) | (87 | ) | (5,259 | ) | ||||||||||||
| Principal payments on capital lease obligations |
(587 | ) | (822 | ) | (587 | ) | (560 | ) | (80 | ) | ||||||||||
|
|
|
|
|
|
|
|
|
|
|
|||||||||||
| Net cash from financing activities |
(533 | ) | (367 | ) | (88 | ) | (34 | ) | (29,334 | ) | ||||||||||
|
|
|
|
|
|
|
|
|
|
|
|||||||||||
| NET INCREASE (DECREASE) IN CASH AND CASH EQUIVALENTS |
(1,933 | ) | 10,779 | 2,469 | 6,685 | (9,820 | ) | |||||||||||||
| CASH AND CASH EQUIVALENTS—Beginning of period |
11,766 | 9,833 | 20,612 | 20,612 | 23,081 | |||||||||||||||
|
|
|
|
|
|
|
|
|
|
|
|||||||||||
| CASH AND CASH EQUIVALENTS—End of period |
$ | 9,833 | $ | 20,612 | $ | 23,081 | $ | 27,297 | $ | 13,261 | ||||||||||
|
|
|
|
|
|
|
|
|
|
|
|||||||||||
| SUPPLEMENTAL DISCLOSURES OF CASH FLOW INFORMATION: |
||||||||||||||||||||
| Cash paid for interest |
$ | 76 | $ | 70 | $ | 105 | $ | 81 | $ | 272 | ||||||||||
|
|
|
|
|
|
|
|
|
|
|
|||||||||||
| Cash paid for income taxes |
$ | 2 | $ | 112 | $ | 1,237 | $ | 452 | $ | 5,206 | ||||||||||
|
|
|
|
|
|
|
|
|
|
|
|||||||||||
| SUPPLEMENTAL DISCLOSURES OF NON-CASH ACTIVITIES: |
||||||||||||||||||||
| Property and equipment acquired under capital leases |
$ | 929 | $ | 636 | $ | — | $ | — | $ | — | ||||||||||
|
|
|
|
|
|
|
|
|
|
|
|||||||||||
See accompanying notes to consolidated financial statements.
F-6
Table of Contents
NOTES TO CONSOLIDATED FINANCIAL STATEMENTS
Note 1. Description of the Company
Extend Health, Inc. (together with its consolidated subsidiaries, “we”, “us”, or “our”) operates a private Medicare exchange that enables retirees to purchase Medicare insurance. We partner with private and public sector employers that are seeking to transition their retirees to an individual health solution. Through the Extend Health platform, retirees can select from a wide variety of insurance carriers and plans based on their specific health profile. We believe the availability of this offering in an exchange environment drives market efficiency, enabling competitive pricing of health plan offerings to the retiree. Additionally, employer clients are able to use the buying power of their retiree subsidies while minimizing the administrative costs of servicing their retiree population. Our revenue is primarily derived from commissions paid to us by insurance carriers for health insurance policies issued as a direct result of our enrollment services.
The timing of our revenue recognition and enrollment-related costs are affected by seasonal factors. The benefits enrollment period for most private employers occurs during the three months ended December 31 for a January 1 effective date, and this period also coincides with the timing of the annual enrollment period, or AEP, when Medicare-eligible individuals can make changes to their plan selections for the following year. As a result, the majority of our new enrollment activity has historically occurred during October through December of each year. To accommodate the higher enrollment volumes during this period, we hire additional seasonal benefit advisors to supplement our full-time benefit advisor workforce. The compensation costs associated with our benefit advisors are expensed as incurred, which results in the majority of the AEP-related enrollment costs being recognized during the three months ended December 31. However, we do not begin recognizing the commission revenue associated with the AEP enrollments until the three months ended March 31, when the underlying policies become effective.
We commenced operations in April 2002 as Wellness Services LLC, a Delaware limited liability company. In February 2004, we changed our name to Extend Benefits Group, LLC. In July 2007, we formed Extend Health, Inc., a Delaware corporation, and merged with Extend Benefits Group, LLC, with Extend Health, Inc. as the surviving entity.
Note 2. Summary of Significant Accounting Policies
Basis of Presentation and Consolidation
The consolidated financial statements have been prepared in accordance with accounting principles generally accepted in the United States, or U.S. GAAP. The accompanying consolidated financial statements include the Extend Health, Inc. accounts and our wholly-owned subsidiaries, Extend Insurance Services, LLC and Extend Administrators, LLC. All intercompany accounts and transactions have been eliminated in consolidation. The 2007 merger between Extend Benefits Group, LLC and Extend Health, Inc. had no accounting impact as the transaction involved entities under common control.
Segment Information
Our chief operating decision-maker, who is our chief executive officer, reviews our results of operations on a consolidated basis and manages our operations as a single operating segment. In addition, our operations, revenues and decision-making functions are based solely in the United States. Therefore, we have concluded that we operate in one operating and geographic segment.
F-7
Table of Contents
EXTEND HEALTH, INC.
NOTES TO CONSOLIDATED FINANCIAL STATEMENTS—(CONTINUED)
Use of Estimates
The preparation of the consolidated financial statements in conformity with U.S. GAAP requires management to make estimates, judgments and assumptions that affect the reported assets and liabilities and disclosure of contingent assets and liabilities at the date of the financial statements, as well as the reported amounts of revenue and expenses during the reporting period. Significant estimates used in the preparation of the consolidated financial statements and accompanying notes include, but are not limited to, the following: 1) the determination of the useful lives of property and equipment; 2) the assessment of whether internal-use software will result in additional functionality and the useful life; 3) the valuation of our common stock and other assumptions used in determining stock-based compensation; and 4) the determination of the valuation allowance for deferred tax assets. Actual results could differ from those estimates, and such differences could be material to the consolidated financial statements.
Unaudited Interim Financial Information
The accompanying consolidated balance sheet as of March 31, 2012, the consolidated statements of operations and cash flows for the nine months ended March 31, 2011 and 2012 and the consolidated statements of convertible preferred stock and stockholders’ deficit for the nine months ended March 31, 2012 are unaudited. The unaudited interim financial statements have been prepared on the same basis as the annual consolidated financial statements and, in the opinion of management, reflect all adjustments, which include only normal recurring adjustments, necessary to present fairly our financial position as of March 31, 2012 and results of operations and cash flows for the nine months ended March 31, 2011 and 2012. The financial data and the other information disclosed in these notes to the consolidated financial statements related to the nine-month periods are unaudited. The results for the nine months ended March 31, 2012 are not necessarily indicative of the results to be expected for the fiscal year ending June 30, 2012 or for any other interim period or for any other future year.
Unaudited Pro Forma Consolidated Balance Sheet
Upon the completion of our initial public offering, all outstanding convertible preferred stock will automatically convert into shares of common stock. The March 31, 2012 unaudited pro forma consolidated balance sheet data has been prepared assuming the conversion of the outstanding convertible preferred stock into 14,749,992 shares of common stock.
Fair Value Measurements
We measure and report our financial assets, which consist of cash, cash equivalents and short-term investments, at fair value on a recurring basis. We have no financial liabilities measured at fair value or other assets measured at fair value on a recurring or non-recurring basis. Fair value is defined as the exchange price that would be received for an asset or paid to transfer a liability (referred to as an exit price) in the principal or most advantageous market for the asset or liability in an orderly transaction between market participants on the measurement date. Valuation techniques used to measure fair value must maximize the use of observable inputs and minimize the use of unobservable inputs. The fair value of our financial assets and liabilities is determined by using three levels of input, which are defined as follows:
| Level 1 | Unadjusted quoted prices in active markets for identical assets or liabilities | |
| Level 2 | Unadjusted quoted prices in active markets for similar assets or liabilities, unadjusted quoted prices for identical or similar assets or liabilities in markets that are not active, or inputs other than quoted prices that are observable for the asset or liability | |
| Level 3 | Unobservable inputs for the asset or liability | |
F-8
Table of Contents
EXTEND HEALTH, INC.
NOTES TO CONSOLIDATED FINANCIAL STATEMENTS—(CONTINUED)
The categorization of a financial instrument within the valuation hierarchy is based upon the lowest level of input that is significant to the fair value measurement.
We utilize the market approach to measure the fair value of our financial assets and liabilities. The market approach uses prices and other relevant information generated by market transactions involving identical or comparable assets or liabilities. Our Level 2 securities are primarily valued using quoted market prices for similar instruments and nonbinding market prices that are corroborated by observable market data. We use inputs such as actual trade data, benchmark yields, broker/dealer quotes, and other similar data, which are obtained from independent pricing vendors, quoted market prices, or other sources to determine the ultimate fair value of our financial assets. The inputs and fair value are reviewed for reasonableness and may be further validated by comparison to publicly available information or compared to multiple independent valuation sources.
Concentrations of Credit Risk and Significant Customers
Financial instruments that are potentially subject to concentrations of credit risk consist primarily of cash and cash equivalents and short-term investments. Cash and cash equivalents are maintained in deposit accounts at financial institutions and amounts held at these institutions may exceed Federally insured limits. We are exposed to credit risk in the event of a default by the financial institutions holding our cash and cash equivalents up to the amount recognized on the consolidated balance sheets. As of June 30, 2011 and March 31, 2012, 95% and 100%, respectively, of our cash equivalents were invested in one AAA-rated money market fund.
Our commission revenue is derived from payments made to us by insurance carriers for health insurance policies issued as a direct result of our enrollment services. Substantially all of our commission revenue for all periods presented was attributable to Medicare-related policies. The following carrier groups individually accounted for 10% or more of our total commission revenue:
| Year Ended June 30, | Nine Months Ended March 31, |
|||||||||||||||||||
| 2009 | 2010 | 2011 | 2011 | 2012 | ||||||||||||||||
| (unaudited) | ||||||||||||||||||||
| Mutual of Omaha |
22 | % | 26 | % | 36 | % | 36 | % | 31 | % | ||||||||||
| UnitedHealthcare |
22 | % | 19 | % | 22 | % | 22 | % | 25 | % | ||||||||||
| Anthem Blue Cross |
12 | % | 13 | % | * | * | 10 | % | ||||||||||||
| Blue Cross Blue Shield of Michigan/Blue Care Network |
11 | % | * | * | * | * | ||||||||||||||
| * | Less than 10% |
We recognize accounts receivable for amounts due from customers in connection with our third party administration and transition services. As of June 30, 2010 and 2011 and March 31, 2012, three customers represented an aggregate of 46%, 36% and 49%, respectively, of our total outstanding accounts receivable. No other customers represented 10% or more of our total accounts receivable.
Cash and Cash Equivalents and Short-Term Investments
We invest our excess cash primarily in highly liquid instruments of the U.S. government and its agencies, money market funds, and commercial paper. We consider all instruments with a stated maturity of three months or less from date of purchase to be cash equivalents, and all other instruments with a stated maturity of less than twelve months to be short-term investments.
F-9
Table of Contents
EXTEND HEALTH, INC.
NOTES TO CONSOLIDATED FINANCIAL STATEMENTS—(CONTINUED)
We determine the appropriate classification of our investments at the time of purchase and reevaluate such designation at each balance sheet date. We have classified and accounted for our short-term investments as available-for-sale. After consideration of our risk versus reward objectives, as well as our liquidity requirements, we may sell these securities prior to their stated maturities. We carry these investments at fair value, and report the unrealized gains and losses, net of taxes, as a component of stockholders’ deficit, except for unrealized losses determined to be other-than-temporary which we would record within other income (expense). We determine any realized gains or losses on the sale of short-term investments on a specific identification method, and we record such gains and losses within other income (expense). We do not intend to, and it is not more likely than not that we will be required to, sell the short-term investments before recovery of their amortized cost bases, which may be at maturity.
The fair value of our investments approximates cost. Gross unrealized and realized gains and losses on cash equivalents and short-term investments were not material for the years ended June 30, 2009, 2010 or 2011, or the nine months ended March 31, 2011 or 2012.
Restricted Cash
Restricted cash represents cash that is not readily available for general operating needs. The balance is primarily comprised of amounts held in connection with our third-party claims administration, or TPA, services.
In connection with the TPA services, we receive health benefit contributions from participating employers which are subsequently paid out against qualifying employee claims reimbursement requests. These funds are held in trust at a financial institution for the benefit of the participating employer. As of June 30, 2010 and 2011, and March 31, 2012 we held $242,000, $154,000 and $77,000, respectively, in funds related to the TPA services.
Deferred Offering Costs
Deferred offering costs consist primarily of legal and accounting fees directly related to our proposed initial public offering. Upon completion of the initial public offering, these amounts will be offset against the proceeds of the offering. If the offering is not completed, the deferred offering costs will be expensed. Deferred offering costs are included in prepaid expenses and other current assets on the consolidated balance sheets and were zero and $2.3 million as of June 30, 2011 and March 31, 2012, respectively.
Accounts Receivable
Accounts receivable primarily consist of amounts due to us in connection with the TPA services. We perform ongoing credit evaluations of our customers, all of which are located in the United States. We assess our ability to collect outstanding receivables and provide allowances when their collection becomes doubtful. We have not experienced significant credit losses from our accounts receivable and accordingly, did not recognize any allowance for bad debt expense during the years ended June 30, 2009, 2010 and 2011, and the nine months ended March 31, 2011 and 2012.
Property and Equipment
Property and equipment are stated at cost, less accumulated depreciation and amortization. Depreciation is computed using the straight-line method over the estimated useful lives of the respective assets. Leasehold improvements and equipment under capital leases are amortized over the lesser of their respective useful lives or the remaining term of the lease. Amortization of assets recorded under capital leases is included in depreciation and amortization expense. The costs of normal maintenance, repairs and minor replacements are charged to expense when incurred.
F-10
Table of Contents
EXTEND HEALTH, INC.
NOTES TO CONSOLIDATED FINANCIAL STATEMENTS—(CONTINUED)
The estimated useful lives of property and equipment are as follows:
| Computer software |
3 years | |||
| Computer equipment |
2-3 years | |||
| Furniture and fixtures |
7 years | |||
| Leasehold improvements |
Shorter of the lease term or estimated useful life up to 7 years |
Internal-Use Software
We capitalize qualifying computer software costs incurred during the application development stage, including consulting costs and compensation expenses related to employees who devote time to the development projects. Costs related to preliminary project activities and post implementation activities are expensed as incurred. Amortization is calculated using the straight-line method over the estimated useful life, typically three years, and is recorded as depreciation and amortization expense within the service center operating expenses in the consolidated statements of operations.
Impairment of Long-Lived Assets
We evaluate long-lived assets, such as property and equipment and capitalized internal-use software development costs, for impairment whenever events or changes in circumstances indicate that the carrying amount of an asset may not be recoverable. If such assets are considered to be impaired, an impairment charge would be recognized equal to the amount by which the carrying amount of the asset exceeds its fair value.
Revenue Recognition
Our revenue is primarily derived from commissions paid to us by insurance carriers for health insurance policies issued as a direct result of our enrollment services. Once the insurance carrier has confirmed that a policy has been issued, we have no further obligation to service the enrollment. Under our carrier compensation contracts, we are generally entitled to receive commissions for five or more years from the policy effective date, provided that the policy is not cancelled during that time period. These commissions may be paid in advance or monthly as the underlying premium is paid to the carrier. Commissions that are paid in advance are typically subject to refund provisions that require the carrier to recover some or all of the commissions paid to us if the policy is cancelled prior to the end of the advance period.
We recognize commission revenue when all of the four following criteria are met: (1) persuasive evidence of an arrangement exists; (2) delivery has occurred; (3) the commission amount is fixed or determinable; and (4) collectability is reasonably assured. We consider the evidence of arrangement criteria to be satisfied when we have a compensation contract with the carrier and upon the earlier of (a) confirmation of policy issuance from the carrier or (b) receipt of payment from the carrier. Because we have no obligation to provide services once a policy has been issued, services are considered to have been rendered upon the earlier of confirmation of the policy issuance from the carrier or receipt of payment from the carrier. Due to the complexity and uncertainty around the amount and timing of carrier commissions, the commission amount is considered fixed and collectable upon receipt of payment from the carrier, provided the commission is not subject to refund. In instances where a refund provision exists, revenue that is subject to refund is deferred until the refund provision has lapsed.
We also generate revenue from TPA services provided to employers for the processing of employee health reimbursement claims. We receive a monthly processing fee for the TPA services, which is recognized in the month the services are rendered. For a majority of the TPA services provided, we utilize outside service
F-11
Table of Contents
EXTEND HEALTH, INC.
NOTES TO CONSOLIDATED FINANCIAL STATEMENTS—(CONTINUED)
providers to process the health reimbursement claims, for which we pay a fee. We have assessed whether the TPA services revenue should be presented gross or net of this fee and have determined that, because we are not the primary obligor in these services arrangements, the TPA services revenue should be presented net of the related costs. Through December 2011, the TPA services revenue is presented in the other revenue line of our consolidated statements of operations, net of costs incurred for the outside service providers. Starting with January 1, 2012 client transitions, we are increasingly offering discounts on the fees that we charge for our TPA services. In the substantial majority of cases, we receive fees from new clients that are equal to or less than the fees we pay to the outside service providers we utilize to provide these TPA services, and in many cases the fees are waived entirely, resulting in a net expense. As these fee discounts represent a selling cost to acquire new clients, the net expense for the TPA services incurred for new client contracts after December 31, 2011 are presented in operating expenses within the sales and marketing line item on our consolidated statements of operations. The TPA net revenue related to existing client contracts that were negotiated prior to this change in sales strategy will continue to be included in other revenue and is therefore expected to diminish over time as these existing contracts begin to expire.
Other revenue also includes amounts earned for transition fees paid by employer sponsors in order to transition their retirees to our platform. The transition fees are recognized on a straight-line basis over the term of the client agreement, which is typically one to three years.
Deferred Revenue
Deferred revenue consists primarily of commission payments received from carriers for which the associated refund provisions have not yet lapsed. We also defer amounts paid in advance for client transition fees. Deferred revenue, non-current reflects amounts that are expected to be recognized as revenue in a period that is greater than 12 months from the balance sheet date.
Service Center
Service center expenses consist primarily of compensation and related expenses for personnel associated with our enrollment and customer service operations, including commission expense paid to our benefit advisors for their enrollment activity and amortization of internal-use software costs.
Technology
Technology expenses consist primarily of compensation and related expenses for personnel associated with maintaining our enrollment platform and tools and management of our information systems infrastructure. Costs incurred for research and development activities are expensed as incurred.
Advertising Costs
Advertising costs are expensed as incurred and are included in sales and marketing expenses in the accompanying consolidated statements of operations. Advertising expenses were $160,000, $132,000 and $210,000 during the years ended June 30, 2009, 2010 and 2011, respectively, and $60,000 and $452,000 for the nine months ended March 31, 2011 and 2012, respectively.
Stock-Based Compensation
We recognize compensation costs related to stock options granted to employees based on the estimated fair value of the awards on the date of grant, net of estimated forfeitures. We estimate the grant date fair value of
F-12
Table of Contents
EXTEND HEALTH, INC.
NOTES TO CONSOLIDATED FINANCIAL STATEMENTS—(CONTINUED)
option grants, and the resulting stock-based compensation expense, using the Black-Scholes-Merton option-pricing model. The grant date fair value of the stock-based awards is recognized on a straight-line basis over the requisite service period, which is generally the vesting period of the respective awards.
We account for stock options issued to consultants based on the fair value of the awards also determined using the Black-Scholes-Merton option-pricing model. The fair value of stock options granted to consultants is remeasured as the stock options vest, and the resulting change in value, if any, is recognized in our consolidated statements of operations during the period the related services are rendered.
Net Income (Loss) and Pro Forma Net Income per Common Share
Our basic and diluted net income (loss) per share attributable to common stockholders is presented in conformity with the two-class method required for participating securities, which is further described in Note 13. The basic net income (loss) per share attributable to common stockholders is calculated by dividing the net income (loss) attributable to common stockholders by the weighted-average number of shares of common stock outstanding for the period. The diluted net income (loss) per share attributable to common stockholders is computed by giving effect to all potential common stock equivalents outstanding for the period. For purposes of this calculation, options to purchase common stock are considered to be common stock equivalents. The dilutive effect of outstanding options is computed using the treasury stock method.
We have also presented the unaudited pro forma basic and diluted net income per share attributable to common stockholders which have been computed to give effect to the automatic conversion of the convertible preferred stock into shares of common stock upon the completion of a qualifying initial public offering of our common stock.
Income Taxes
We use the liability method of accounting for income taxes. Under this method, deferred tax assets and liabilities are recognized by applying the statutory tax rates in effect in the years in which the differences between the financial reporting and tax filings basis of existing assets and liabilities are expected to reverse. We have considered future taxable income and ongoing prudent and feasible tax planning strategies in assessing the need for a valuation allowance against our deferred tax assets. We believe that the net deferred tax assets shown on our balance sheet as of June 30, 2011 and March 31, 2012 are more likely than not to be realized in the future. In the event that actual results differ from those estimates in future periods, we may need to record a valuation allowance, which will impact deferred tax assets and the results of operations in the period the change is made.
Effective July 1, 2009, we adopted new accounting guidance related to the recognition, measurement and presentation of uncertain tax positions. We did not recognize any uncertain tax positions or unrecognized tax benefits for any periods presented. Our policy is to recognize interest and/or penalties related to all tax positions in income tax expense. No interest or penalties have been accrued for any period presented.
Comprehensive Income
Comprehensive income is presented in the consolidated statements of convertible preferred stock and stockholders’ deficit. Comprehensive income is comprised of net income (loss) and other comprehensive income (loss), which consists of changes in unrealized gains and losses on our short-term investments.
F-13
Table of Contents
EXTEND HEALTH, INC.
NOTES TO CONSOLIDATED FINANCIAL STATEMENTS—(CONTINUED)
Note 3. Fair Value of Financial Instruments
We measure and report our cash, cash equivalents and short-term investments at fair value on a recurring basis. The following table sets forth the fair value of our financial assets by level within the fair value hierarchy (in thousands):
| June 30, 2010 | ||||||||||||
| Fair Value | Level 1 | Level 2 | ||||||||||
| Cash and cash equivalents: |
||||||||||||
| Cash |
$ | 14,587 | $ | 14,587 | $ | — | ||||||
| Money market funds |
6,025 | 6,025 | — | |||||||||
|
|
|
|
|
|
|
|||||||
| Total cash and cash equivalents |
$ | 20,612 | $ | 20,612 | $ | — | ||||||
|
|
|
|
|
|
|
|||||||
| June 30, 2011 | ||||||||||||
| Fair Value | Level 1 | Level 2 | ||||||||||
| Cash and cash equivalents: |
||||||||||||
| Cash |
$ | 6,763 | $ | 6,763 | $ | — | ||||||
| Money market funds |
15,518 | 15,518 | — | |||||||||
| Commercial paper |
800 | — | 800 | |||||||||
|
|
|
|
|
|
|
|||||||
| Total cash and cash equivalents |
$ | 23,081 | $ | 22,281 | $ | 800 | ||||||
|
|
|
|
|
|
|
|||||||
| Short-term investments: |
||||||||||||
| Commercial paper |
$ | 8,640 | $ | — | $ | 8,640 | ||||||
| U.S. Treasury securities |
5,034 | 5,034 | — | |||||||||
| U.S. government agencies bonds |
2,015 | — | 2,015 | |||||||||
|
|
|
|
|
|
|
|||||||
| Total short-term investments |
$ | 15,689 | $ | 5,034 | $ | 10,655 | ||||||
|
|
|
|
|
|
|
|||||||
| March 31, 2012 | ||||||||||||
| Fair Value | Level 1 | Level 2 | ||||||||||
| (unaudited) |
||||||||||||
| Cash and cash equivalents: |
||||||||||||
| Cash |
$ | 4,225 | $ | 4,225 | $ | — | ||||||
| Money market funds |
9,036 | 9,036 | — | |||||||||
|
|
|
|
|
|
|
|||||||
| Total cash and cash equivalents |
$ | 13,261 | $ | 13,261 | $ | — | ||||||
|
|
|
|
|
|
|
|||||||
We had no investments classified as Level 3 at June 30, 2010 and 2011 or March 31, 2012.
F-14
Table of Contents
EXTEND HEALTH, INC.
NOTES TO CONSOLIDATED FINANCIAL STATEMENTS—(CONTINUED)
Note 4. Balance Sheet Components
Property and Equipment, net
Property and equipment, net consists of the following (in thousands):
| June 30, | March
31, 2012 |
|||||||||||
| 2010 | 2011 | |||||||||||
| (unaudited) | ||||||||||||
| Computer software, including internal-use software |
$ | 3,444 | $ | 3,371 | $ | 4,043 | ||||||
| Computer equipment |
1,950 | 1,527 | 1,935 | |||||||||
| Furniture and fixtures |
1,392 | 1,117 | 1,450 | |||||||||
| Leasehold improvements |
220 | 544 | 685 | |||||||||
|
|
|
|
|
|
|
|||||||
| Total property and equipment |
7,006 | 6,559 | 8,113 | |||||||||
| Accumulated depreciation and amortization |
(3,391 | ) | (3,464 | ) | (4,848 | ) | ||||||
|
|
|
|
|
|
|
|||||||
| Property and equipment, net |
$ | 3,615 | $ | 3,095 | $ | 3,265 | ||||||
|
|
|
|
|
|
|
|||||||
Property and equipment acquired under capital leases, included in the table above, consist of the following (in thousands):
| June 30, | March 31, 2012 |
|||||||||||
| 2010 | 2011 | |||||||||||
| (unaudited) | ||||||||||||
| Computer software |
$ | 796 | $ | 12 | $ | 12 | ||||||
| Computer equipment |
1,659 | 297 | 297 | |||||||||
| Furniture and fixtures |
353 | — | — | |||||||||
|
|
|
|
|
|
|
|||||||
| Total property and equipment |
2,808 | 309 | 309 | |||||||||
| Accumulated depreciation and amortization |
(1,658 | ) | (193 | ) | (271 | ) | ||||||
|
|
|
|
|
|
|
|||||||
| Property and equipment, net |
$ | 1,150 | $ | 116 | $ | 38 | ||||||
|
|
|
|
|
|
|
|||||||
Depreciation and amortization expense was $1.0 million, $1.8 million and $2.1 million during the years ended June 30, 2009, 2010 and 2011, respectively, and $1.6 million and $1.4 million during the nine months ended March 31, 2011 and 2012, respectively.
We capitalized $639,000, $390,000 and $544,000 in internal-use software development costs, and recognized amortization expense related to these assets of $181,000, $404,000 and $458,000 during the years ended June 30, 2009, 2010 and 2011, respectively. During the nine months ended March 31, 2011 and 2012, we capitalized $347,000 and $527,000 in internal-use software development costs and recognized amortization expense of $337,000 and $463,000, respectively. As of June 30, 2010 and 2011 and March 31, 2012, the net book value of internal-use software was $790,000, $876,000 and $940,000, respectively.
In March 2011, we terminated certain capital leases and purchased the computer equipment under these leases for total consideration of $721,000, of which $626,000 was paid in cash and the remaining $95,000 was paid through the surrender of cash security deposits. In connection with this purchase, we recorded total consideration paid as the cost of the equipment, and removed all of the assets and liabilities previously recorded under these leases, including $1.3 million of property and equipment at cost, $785,000 of accumulated depreciation, and $353,000 and $123,000 of current and non-current capital lease obligations, respectively. These assets are being depreciated over their remaining useful lives.
F-15
Table of Contents
EXTEND HEALTH, INC.
NOTES TO CONSOLIDATED FINANCIAL STATEMENTS—(CONTINUED)
Accrued Expenses
Accrued expenses consist of the following (in thousands):
| June 30, | March
31, 2012 |
|||||||||||
| 2010 | 2011 | |||||||||||
| (unaudited) | ||||||||||||
| Employee compensation and benefits |
$ | 455 | $ | 2,525 | $ | 3,380 | ||||||
| Professional fees |
433 | 1,045 | 1,020 | |||||||||
| Income taxes payable |
234 | 2,539 | 646 | |||||||||
| TPA claims payable |
242 | 154 | 94 | |||||||||
| Other accrued liabilities |
339 | 1,003 | 1,528 | |||||||||
|
|
|
|
|
|
|
|||||||
| Total accrued expenses |
$ | 1,703 | $ | 7,266 | $ | 6,668 | ||||||
|
|
|
|
|
|
|
|||||||
Note 5. Debt Obligations
In July 2010, we entered into a loan agreement with Silicon Valley Bank, our primary financial institution, to establish a $6.0 million credit facility, including a $5.0 million revolving line of credit and a $1.0 million equipment loan. The purpose of this credit facility is to finance general working capital requirements and purchases of property and equipment. Borrowings under the facility are secured by all of our assets, including, but not limited to, cash accounts, short-term investment accounts, accounts receivable and property and equipment. The loan agreement includes a financial covenant pertaining to revenue achievement against plan, which must be met in order to maintain indebtedness under the line of credit. Advances under the revolving line of credit mature 12 months from the effective date of the loan agreement and bear interest at a rate of 1.0% over the prime rate on the date of the advance, subject to a minimum rate of 4.25%. Advances under the equipment loan are payable in 42 monthly installments and bear interest at a fixed rate of 3.97%, and bear an additional final payment equal to 6.00% of the equipment loan amount payable on the due date of the last installment. In connection with this loan agreement, we drew $500,000 under the equipment loan in July 2010. The weighted- average interest rate on this borrowing is 7.27% and will be repaid through January 2014. As of June 30, 2011, the outstanding amount under this loan agreement was $380,000.
As of June 30, 2011, the future principal payments on the equipment loan were as follows (in thousands):
| Year Ending June 30: |
Debt Obligations |
|||
| 2012 |
$ | 139 | ||
| 2013 |
149 | |||
| 2014 |
92 | |||
|
|
|
|||
| Total minimum principal payments |
380 | |||
| Less current portion |
(139 | ) | ||
|
|
|
|||
| Noncurrent portion |
$ | 241 | ||
|
|
|
|||
In July 2011, we amended our loan agreement with Silicon Valley Bank to remove the financial covenant pertaining to revenue achievement in connection with the expiration of the revolving line of credit established in July 2010.
In August 2011, we amended our loan agreement with Silicon Valley Bank to renew the $5.0 million revolving line of credit and add a $5.0 million term loan. The amended loan agreement includes certain financial
F-16
Table of Contents
EXTEND HEALTH, INC.
NOTES TO CONSOLIDATED FINANCIAL STATEMENTS—(CONTINUED)
covenants pertaining to revenue achievement against plan, adjusted earnings levels and fixed charge coverage ratios. All of the covenants must be met in order to maintain indebtedness under the loan agreement. Borrowings under the revolving line of credit mature 12 months from the effective date of the loan agreement and bear interest at the prime rate on the date of the advance. Borrowings under the term loan bear interest at a fixed rate of 6.25% and are payable in 36 monthly installments, with the first six months on an interest-only basis. In connection with this amended agreement, we drew $5.0 million under the term loan in August 2011 which will be repaid through August 2014.
In December 2011, we amended our loan agreement with Silicon Valley Bank to increase our credit facility by $8.0 million, comprised of a $3.0 million increase to the revolving line of credit and an additional $5.0 million term loan. Concurrent with entering into the amendment, we drew $5.0 million under the term loan, which will be repaid through December 2014. In addition, we drew $5.0 million under the line of credit in December 2011, which was subsequently repaid in January 2012. As of March 31, 2012, the total outstanding amount under the amended loan agreement was $10.1 million and we were in compliance with the loan covenants.
Note 6. Capital Lease Obligations
We have entered into several capital lease obligations to finance certain purchases of equipment. The leases have terms expiring beginning June 2012. As of June 30, 2011, future cash payment commitments related to these leases were as follows (in thousands):
| Year Ending June 30: |
Capital Lease Obligations |
|||
| 2012 |
$ | 113 | ||
| 2013 |
19 | |||
|
|
|
|||
| Total minimum lease payments |
132 | |||
| Less amount representing interest |
(5 | ) | ||
|
|
|
|||
| Present value of minimum lease payments |
127 | |||
| Less current portion |
(108 | ) | ||
|
|
|
|||
| Noncurrent portion |
$ | 19 | ||
|
|
|
|||
The average interest rate on our capital leases as of June 30, 2010 and 2011 and March 31, 2012 was 4.2%, 5.6% and 5.6%, respectively.
Note 7. Commitments and Contingencies
Operating Leases
We lease office facilities and certain equipment under operating leases which expire on various dates through October 2015. Certain of the operating lease agreements contain rent holidays and rent escalation provisions. Rent holidays and rent escalation provisions are considered in determining straight-line rent expense to be recorded over the lease term. We record the difference between cash rent payments and the recognition of rent expense as a accrued rent liability.
F-17
Table of Contents
EXTEND HEALTH, INC.
NOTES TO CONSOLIDATED FINANCIAL STATEMENTS—(CONTINUED)
As of June 30, 2011, the future minimum lease payments under non-cancellable operating leases were as follows (in thousands):
| Year Ending June 30: |
Operating Lease Commitments |
|||
| 2012 |
$ | 1,185 | ||
| 2013 |
571 | |||
| 2014 |
576 | |||
| 2015 |
453 | |||
| 2016 |
173 | |||
|
|
|
|||
| Total |
$ | 2,958 | ||
|
|
|
|||
Total rent expense under all operating leases was $855,000, $1.4 million and $1.3 million during the years ended June 30, 2009, 2010 and 2011, respectively, and $953,000 and $1.2 million for the nine months ended March 31, 2011 and 2012, respectively.
Legal Matters
From time to time, we may be involved in various legal proceedings arising in the ordinary course of business. There are no matters as of June 30, 2011 and March 31, 2012 that, in the opinion of management, would have a material adverse effect on our consolidated financial position, results of operations or cash flows.
Note 8. Convertible Preferred Stock
We recorded the Series A and Series B convertible preferred stock at carryover value or fair value on the dates of issuance, as appropriate, net of issuance costs. We classify the convertible preferred stock outside of stockholders’ deficit because the shares contain liquidation features that are not solely within our control. At June 30, 2010 and 2011 and March 31, 2012, we did not adjust the carrying values of the convertible preferred stock to the deemed liquidation values of such shares since a liquidation event is not probable at each balance sheet date. Subsequent adjustments to increase the carrying values to the ultimate liquidation values will be made only when it becomes probable that such a liquidation event will occur.
Significant terms of the Series A convertible preferred stock (“Series A”) and Series B convertible preferred stock (“Series B”) are as follows:
Conversion
Each share of Series A and Series B is convertible, at the holder’s option, into one share of common stock based on the original issue price, subject to anti-dilution adjustments for (i) any stock split, combination of shares, reclassification, exchange, substitution or other similar event, or (ii) subsequent issuances of securities at a price lower than the initial issue price for each series of convertible preferred stock, subject to certain exceptions, such as option grants pursuant to stock compensation plans and agreements, securities issued to acquire another company and securities issued with the written consent of the holders of a majority of the outstanding shares of such series either before or after the issuance causing the adjustment. For subsequent issuances of securities under (ii) above, the Series A and Series B conversion price will be adjusted based upon a predetermined formula. For all other anti-dilution adjustments under (i) above, the conversion price will be adjusted proportionally to account for the impact of such adjustment. As of June 30, 2010 and 2011 and March 31, 2012, the conversion ratio for the Series A and Series B was 1-to-1. Each share of Series A and
F-18
Table of Contents
EXTEND HEALTH, INC.
NOTES TO CONSOLIDATED FINANCIAL STATEMENTS—(CONTINUED)
Series B shall automatically convert in certain events, including a public offering at an offering price of at least $7.8261 per share with aggregate proceeds to us of at least $30.0 million, or upon request of the holders of a majority of such class of convertible preferred stock.
Liquidation
A liquidation or winding up of our Company, a greater than 50% change in control, or a sale of substantially all of our assets would constitute a redemption event. The preferred stock has liquidation preferences per share equal to $1.50 for Series A and $2.6087 for Series B. The Series B has a liquidation preference over Series A and common stock and the Series A has a liquidation preference over common stock. The Series B participates as common stock on an as-if-converted basis upon liquidation until the total proceeds per share of Series B equal $6.52175 per share.
Voting Rights
The Series A and Series B vote with the common stock on an as-if-converted basis. The Series A and Series B have certain veto rights on certain actions. Additionally, Series A and Series B holders each have the right to elect two members of the board of directors, while the common stockholders shall be entitled to elect three directors.
Dividends
Dividends are payable at the discretion of the board of directors. In the event that dividends are declared, the Series B is first entitled to receive a dividend of 8.0% per annum on the liquidation price of $2.6087 per share, subject to reclassifications or adjustments. The Series A is then entitled to receive a dividend of 8.0% per annum on the liquidation price of $1.50 per share, subject to reclassifications or adjustments. Thereafter, the Series B, Series A and common stock all share in the remaining proceeds on an as-if converted basis.
Note 9. Common Stock
The holders of common stock are entitled to one vote per share on matters submitted to the stockholders. Subject to any preferences that may apply to outstanding preferred stock, the holders of common stock are entitled to share equally in any dividends, when and if declared by the board of directors.
A summary of the common stock available and reserved for issuance is as follows:
| June 30, | March 31, 2012 |
|||||||||||
| 2010 | 2011 | |||||||||||
| (unaudited) | ||||||||||||
| Available for issuance: |
||||||||||||
| Authorized |
19,250,000 | 19,250,000 | 20,475,000 | |||||||||
| Issued and outstanding |
(1,360,359 | ) | (1,517,267 | ) | (1,546,753 | ) | ||||||
|
|
|
|
|
|
|
|||||||
| Available for issuance |
17,889,641 | 17,732,733 | 18,928,247 | |||||||||
|
|
|
|
|
|
|
|||||||
| Reserved for future issuance: |
||||||||||||
| Conversion of Series A |
9,000,000 | 9,000,000 | 9,000,000 | |||||||||
| Conversion of Series B |
5,749,992 | 5,749,992 | 5,749,992 | |||||||||
| Stock options outstanding |
2,416,796 | 2,122,520 | 3,050,438 | |||||||||
| Stock options available for future grant |
722,845 | 860,213 | 152,809 | |||||||||
| Warrant outstanding |
— | — | 948,011 | |||||||||
|
|
|
|
|
|
|
|||||||
| Reserved for future issuance |
17,889,633 | 17,732,725 | 18,901,250 | |||||||||
|
|
|
|
|
|
|
|||||||
F-19
Table of Contents
EXTEND HEALTH, INC.
NOTES TO CONSOLIDATED FINANCIAL STATEMENTS—(CONTINUED)
Note 10. Dividend Payments (unaudited)
During the nine months ended March 31, 2012, we declared and paid two cash dividends to stockholders of record on each declaration date. The holders of Series A and Series B had preference rights representing 8.0% of their original issue price. Thereafter, holders of Series A, Series B and common stock received the remaining dividend on a pro-rata as-if converted basis.
Under our 2007 Equity Incentive Plan, option holders are entitled to option adjustments for any distributions to stockholders in which they do not participate to mitigate the dilutive effect of such distribution on the outstanding stock options. In accordance with this provision, the number of shares underlying each stock option outstanding on the dividend record date was increased by multiplying the number of outstanding options by an adjustment ratio, and the exercise price of each option was decreased by dividing the exercise price by the same adjustment ratio. The adjustment ratios were calculated based on the determination by our board of directors of the fair market value of a share of our common stock immediately before and after the payment of the dividend. As a result of applying this adjustment ratio, we increased our outstanding options and reduced the associated option exercise prices for all options outstanding under our 2004 and 2007 Equity Incentive Plans as of the declaration date.
We did not recognize a stock-based compensation charge associated with the modification of the outstanding options under the 2007 Equity Incentive Plan because these option adjustments were contractually required under the plan provisions. The 2004 Equity Incentive Plan does not have a provision that requires option adjustments in the event of a cash dividend. Due to the fact that the option adjustments under the 2004 Equity Incentive Plan were not contractually required, we recorded stock-based compensation charges related to this option modification, all of which were recognized during the period as the options were fully vested as of the modification date.
The following table summarizes the dividend payments and resulting option modifications during the nine months ended March 31, 2012 (in thousands except share, per share and ratio data):
| Dividend Record Date | ||||||||
| August 29, 2011 |
December 28, 2011 |
|||||||
| Series A |
||||||||
| Payments for preference rights: |
$ | 1,080 | $ | — | ||||
| Remaining pro-rata as-if converted payments: |
13,674 | 6,637 | ||||||
|
|
|
|
|
|||||
| Total Series A dividend payments . . . . . . . . . . . . . . . . . . . . . . . . . . . |
14,754 | 6,637 | ||||||
| Series B |
||||||||
| Payments for preference rights. . . . . . . . . . . . . . . . . . . . . . . . . . . |
1,200 | — | ||||||
| Remaining pro-rata as-if converted payments: . . . . . . . . . . . . . . . . . . . . . . . . . |
8,737 | 4,241 | ||||||
|
|
|
|
|
|||||
| Total Series B dividend payments. . . . . . . . . . . . . . . . . . . . . . |
9,937 | 4,241 | ||||||
| Common stock |
2,309 | 1,122 | ||||||
|
|
|
|
|
|||||
| Total dividend payments |
$ | 27,000 | $ | 12,000 | ||||
|
|
|
|
|
|||||
| Dividend payment per share: |
||||||||
| Series A . . . . . . . . . . . . . . . . . . . . . . . . . . . |
$ | 1.64 | $ | 0.74 | ||||
| Series B . . . . . . . . . . . . . . . . . . . . . . . . . . . |
1.73 | 0.74 | ||||||
| Common stock . . . . . . . . . . . . . . . . . . . . . . |
1.52 | 0.74 | ||||||
| Option adjustment ratio |
1.16129 | 1.11111 | ||||||
| Increase in outstanding options |
383,777 | 306,041 | ||||||
| Option modification charge |
$ | 337 | $ | 249 | ||||
F-20
Table of Contents
EXTEND HEALTH, INC.
NOTES TO CONSOLIDATED FINANCIAL STATEMENTS—(CONTINUED)
Note 11. Stock-Based Compensation
Stock Plans
We have two stock option plans—the 2004 Equity Incentive Plan, adopted in May 2004 (the “2004 Plan”) and the 2007 Equity Incentive Plan, adopted in July 2007 (the “2007 Plan”). Under the 2004 Plan, a total of 1,000,000 shares were authorized for issuance. In connection with the adoption of the 2007 Plan, no further grants are permitted to be made from the 2004 Plan, and all remaining unissued shares were transferred from the 2004 Plan to the 2007 Plan allotment. Additionally, any cancellations or expirations from the 2004 Plan may be returned to the 2007 Plan and made available for reissuance. Under the 2007 Plan, 1,500,000 shares were originally authorized for issuance. This amount was increased by 1,000,000 shares in both December 2008 and June 2010 and by 250,000 shares in December 2011. Under the 2007 Plan, options that terminate or expire may be reissued. As of June 30, 2011 and March 31, 2012, there were 860,213 and 152,809 shares available for issuance under the 2007 Plan, respectively.
Stock options granted to employees under the 2004 and 2007 Plans generally vest over four years, while grants to non-employee advisors typically vest over a three-year period. Options granted under the 2004 Plan and 2007 Plan expire eight years and ten years after the date of grant, respectively. Certain of the grants to executive-level employees provide for vesting acceleration in the event of specified strategic events.
F-21
Table of Contents
EXTEND HEALTH, INC.
NOTES TO CONSOLIDATED FINANCIAL STATEMENTS—(CONTINUED)
Stock Option Activity
The following table summarizes stock option activity under the stock plans. The values presented above the line items titled “August option adjustments — share increase (unaudited)” and “December option adjustments — share increase (unaudited)” reflect the number of options and exercise prices as of the date of grant, exercise, forfeiture or expiration and do not reflect any subsequent adjustments related to the dividends. The values presented on or below these line items reflect the option adjustments as discussed in Note 10.
| Shares Available for Grant |
Options Outstanding |
Weighted- Average Exercise Price |
Weighted- Average Remaining Contractual Life (Years) |
Aggregate Intrinsic Value |
||||||||||||||||
| (in thousands) | ||||||||||||||||||||
|
|
|
|
|
|
|
|||||||||||||||
| Balance as of June 30, 2010 |
722,845 | 2,416,796 | $ | 0.76 | ||||||||||||||||
|
|
|
|
|
|
|
|||||||||||||||
| Granted |
(174,000 | ) | 174,000 | 1.70 | ||||||||||||||||
| Exercised |
— | (156,908 | ) | 0.56 | ||||||||||||||||
| Forfeited |
264,608 | (264,608 | ) | 0.84 | ||||||||||||||||
| Expired |
46,760 | (46,760 | ) | 0.40 | ||||||||||||||||
|
|
|
|
|
|
|
|
|
|
|
|||||||||||
| Balance as of June 30, 2011 |
860,213 | 2,122,520 | 0.86 | 7.06 | $ | 17,280 | ||||||||||||||
|
|
|
|
|
|
|
|
|
|
|
|||||||||||
| Granted (unaudited) |
(269,511 | ) | 269,511 | 9.00 | ||||||||||||||||
| Exercised (unaudited) |
— | (1,459 | ) | 0.98 | ||||||||||||||||
| Forfeited (unaudited) |
4,223 | (4,223 | ) | 1.42 | ||||||||||||||||
| Expired (unaudited) |
5,563 | (5,563 | ) | 0.35 | ||||||||||||||||
| August option adjustments — share increase (unaudited) |
(383,777 | ) | 383,777 | 1.78 | ||||||||||||||||
| August option adjustments — exercise price decrease (unaudited)(1) |
— | — | (0.24 | ) | ||||||||||||||||
| Exercised (unaudited) |
— | (2,829 | ) | 0.69 | ||||||||||||||||
| Forfeited (unaudited) |
2,835 | (2,835 | ) | 4.63 | ||||||||||||||||
| Expired (unaudited) |
3,237 | (3,237 | ) | 0.67 | ||||||||||||||||
| Authorized (unaudited) |
250,000 | — | — | |||||||||||||||||
| December option adjustments — share increase (unaudited) |
(306,041 | ) | 306,041 | 1.53 | ||||||||||||||||
| December option adjustments — exercise price decrease (unaudited)(2) |
— | — | (0.15 | ) | ||||||||||||||||
| Granted |
(22,250 | ) | 22,250 | 7.20 | ||||||||||||||||
| Exercised (unaudited) |
— | (25,198 | ) | 0.52 | ||||||||||||||||
| Forfeited (unaudited) |
8,317 | (8,317 | ) | 7.42 | ||||||||||||||||
|
|
|
|
|
|
|
|
|
|
|
|||||||||||
| Balance as of March 31, 2012 (unaudited) |
152,809 | 3,050,438 | $ | 1.43 | 6.71 | $ | 23,577 | |||||||||||||
|
|
|
|
|
|
|
|
|
|
|
|||||||||||
| Vested and expected to vest as of June 30, 2011 |
2,030,571 | $ | 0.84 | 7.00 | $ | 16,574 | ||||||||||||||
|
|
|
|
|
|
|
|
|
|||||||||||||
| Exercisable as of June 30, 2011 |
1,180,715 | $ | 0.57 | 6.03 | $ | 9,955 | ||||||||||||||
|
|
|
|
|
|
|
|
|
|||||||||||||
| Vested and expected to vest as of March 31, 2012 (unaudited) |
2,946,622 | $ | 1.35 | 6.65 | $ | 22,976 | ||||||||||||||
|
|
|
|
|
|
|
|
|
|||||||||||||
| Exercisable as of March 31, 2012 (unaudited) |
1,866,918 | $ | 0.57 | 5.77 | $ | 16,013 | ||||||||||||||
|
|
|
|
|
|
|
|
|
|||||||||||||
| (1) | Reflects the decrease in the weighted-average exercise price on 2,764,563 options outstanding as of August 29, 2011, the date of the dividend-related option adjustments. |
| (2) | Reflects the decrease in the weighted-average exercise price on 3,061,703 options outstanding as of December 28, 2011, the date of the dividend-related option adjustments. |
F-22
Table of Contents
EXTEND HEALTH, INC.
NOTES TO CONSOLIDATED FINANCIAL STATEMENTS—(CONTINUED)
The aggregate intrinsic value is calculated as the difference between the exercise price of the underlying stock option awards and the fair value of our common stock at each period end. During the years ended June 30, 2009, 2010 and 2011, and the nine months ended March 31, 2011 and 2012, the aggregate intrinsic value of stock option awards exercised was $8,000, $349,000 and $187,000, respectively, and $186,000 and $188,000, respectively, as determined at the date of option exercise.
Stock-Based Compensation Expense
The fair value of options grants is estimated at the date of grant using the Black-Scholes-Merton option-pricing model, which requires the use of highly subjective and complex assumptions, including the following:
| • | Expected volatility. Because we have no trading history, the expected volatility is derived from historical volatilities of several unrelated public companies with characteristics deemed to be comparable to our business. When making the selections of our peer companies, we considered the size and operational and economic similarities to our business operations. |
| • | Expected term. The expected term represents the period that our stock-based awards are expected to be outstanding and was primarily determined using the simplified method in accordance with guidance provided by the Securities and Exchange Commission. The simplified method calculates the expected term as the average of the time-to-vesting and the contractual life of the awards. |
| • | Risk-free interest rate. The risk-free interest rate is based on the U.S. Treasury yield in effect at the time of grant for zero coupon U.S. Treasury notes with maturities approximately equal to each award’s expected term. |
| • | Expected dividend rate. The expected dividend rate was assumed to be zero on all grant dates as we had no plans to pay regular dividends on those dates. |
| • | Fair Value of Common Stock. Because there has been no public market for our common stock, the fair value of the shares of common stock underlying the stock options has historically been determined by the board of directors. To assist us in determining the fair value of our common stock, we obtained valuation analyses prepared by an independent third-party valuation firm that used methodologies, approaches and assumptions consistent with the American Institute of Certified Public Accountants practice aid titled “Valuation of Privately-Held Company Equity Securities Issued as Compensation.” To determine the fair value of our common stock, the board of directors considered these valuation reports, and other objective and subjective factors including valuations of comparable companies, operating and financial performance, general and industry specific economic outlook, and other relevant factors relating to our business. To date, we have not granted stock options with an exercise price that is less than the fair value of the underlying common stock as determined at the time of grant by our board of directors. |
F-23
Table of Contents
EXTEND HEALTH, INC.
NOTES TO CONSOLIDATED FINANCIAL STATEMENTS—(CONTINUED)
In addition to assumptions used in the Black-Scholes-Merton option-pricing model, we must also estimate a forfeiture rate to calculate the stock-based compensation for our awards. Our forfeiture rate is based on an analysis of our actual forfeitures. We will continue to evaluate the appropriateness of the forfeiture rate based on actual forfeiture experience, analysis of employee turnover and other factors. Changes in the estimated forfeiture rate can have a significant impact on our stock-based compensation expense as the cumulative effect of adjusting the rate is recognized in the period in which the forfeiture estimate is changed. The fair value of options granted to employees and directors was estimated using the following weighted-average assumptions:
| Year Ended June 30, | Nine Months Ended March 31, |
|||||||||||||||||||
| 2009 | 2010 | 2011 | 2011 | 2012 | ||||||||||||||||
| (unaudited) | ||||||||||||||||||||
| Expected volatility |
33.0 | % | 36.0 | % | 36.5 | % | 36.0 | % | 38.7 | % | ||||||||||
| Expected term (in years) |
6.08 | 6.08 | 6.08 | 6.08 | 6.08 | |||||||||||||||
| Risk-free interest rate |
2.3 | % | 2.3 | % | 2.2 | % | 2.6 | % | 1.3 | % | ||||||||||
| Expected dividend rate |
0.0 | % | 0.0 | % | 0.0 | % | 0.0 | % | 0.0 | % | ||||||||||
| Fair value of common stock |
$ | 0.31 | $ | 1.14 | $ | 1.70 | $ | 1.70 | $ | 8.86 | ||||||||||
The weighted-average grant date fair value of options granted was $0.11, $0.44 and $0.67 per share during the years ended June 30, 2009, 2010 and 2011, respectively and $0.67 and $2.65 per share during the nine months ended March 31, 2011 and 2012, respectively. As of June 30, 2011 and March 31, 2012, we had $0.6 million and $1.2 million of unrecognized stock-based compensation expense, net of estimated forfeitures, that is expected to be recognized over a weighted-average period of 2.7 and 2.8 years, respectively.
During the years ended June 30, 2009, 2010 and 2011, and the nine months ended March 31, 2011 and 2012, we issued options to consultants for the purchase of zero, 7,500 and 60,000, respectively, and 60,000 and zero, respectively, shares of common stock in exchange for services. These options were issued with an exercise price ranging from $0.50 to $1.84 per share and generally vest over three years with contractual terms up to 10 years. Total stock-based compensation related to consultants amounted to $3,000, $5,000 and $74,000 for the years ended June 30, 2009, 2010 and 2011, respectively, and $24,000 and $129,000 for the nine months ended March 31, 2011 and 2012, respectively and is included in total stock-based compensation expense.
The following table summarizes total stock-based compensation expense included in the consolidated statements of operations by line item (in thousands):
| Year Ended June 30, | Nine Months Ended March 31, |
|||||||||||||||||||
| 2009 | 2010 | 2011 | 2011 | 2012 | ||||||||||||||||
| (unaudited) | ||||||||||||||||||||
| Service center |
$ | 3 | $ | 5 | $ | 26 | $ | 19 | $ | 172 | ||||||||||
| Sales and marketing |
19 | 29 | 52 | 34 | 364 | |||||||||||||||
| Technology |
6 | 8 | 30 | 23 | 165 | |||||||||||||||
| General and administrative |
41 | 52 | 142 | 81 | 291 | |||||||||||||||
|
|
|
|
|
|
|
|
|
|
|
|||||||||||
| Total stock-based compensation |
$ | 69 | $ | 94 | $ | 250 | $ | 157 | $ | 992 | ||||||||||
|
|
|
|
|
|
|
|
|
|
|
|||||||||||
Common Stock Warrant (unaudited)
In August 2011, we issued a performance based warrant to one of our channel partners to purchase up to 948,011 shares of our common stock at an exercise price of $10.00 per share. Under the terms of this agreement,
F-24
Table of Contents
EXTEND HEALTH, INC.
NOTES TO CONSOLIDATED FINANCIAL STATEMENTS—(CONTINUED)
the warrant vests and becomes exercisable based on the achievement of specified enrollment levels and expires upon the earliest of (i) July 15, 2012, (ii) the effective date of our acquisition by another entity or a sale, lease or other disposition of all or substantially all of our assets, or (iii) two days before the commencement of a road show in connection with an initial public offering of our common stock. The fair value of the warrant is determined using the Black-Scholes-Merton option pricing model. We will revalue this warrant each period as enrollment levels are achieved and expense the portion of the warrant that vests each period. During the nine months ended March 31, 2012, we recognized zero expense related to this warrant.
In connection with the issuance of this warrant, the board of directors and stockholders approved an increase to our authorized common stock of 975,000 shares, and our certificate of incorporation was amended to reflect this increase in authorized shares.
Note 12. Restructuring Expense
In February 2010, we undertook a strategic initiative to reorganize the business in order to improve operational and financial efficiencies. In connection with this initiative, we recorded a restructuring charge of $314,000, which was comprised of severance charges associated with the reduction in the workforce of 26 employees. As of June 30, 2010, there was a remaining restructuring liability of $27,000 included within accrued liabilities, which was paid in September 2010.
Note 13. Net Income (Loss) per Common Share
Basic and diluted net income (loss) per common share is presented in conformity with the two-class method required for participating securities. Under the two-class method, net income (loss) attributable to common stockholders is determined by allocating undistributed earnings, calculated as net income less current period Series B and then Series A non-cumulative dividends, between common stock and Series A and Series B. In computing diluted net income (loss) attributable to common stockholders, undistributed earnings are re-allocated to reflect the potential impact of dilutive securities. Basic net income (loss) per share attributable to common stockholders is computed by dividing the net income (loss) attributable to common stockholders by the weighted-average number of common shares outstanding during the period. Diluted net income (loss) per share attributable to common stockholders is computed by dividing the net income (loss) attributable to common stockholders by the weighted-average number of common shares outstanding, including potential dilutive common shares assuming the effect of outstanding stock options using the treasury stock method is dilutive.
In the event that dividends are declared, holders of Series B are first entitled to receive noncumulative dividends at the per annum rate of $0.21 per share. Holders of Series A are then entitled to receive noncumulative dividends at the per annum rate of $0.12 per share. Thereafter, as declared by the board of directors, dividends are paid to the holders of common stock and all holders of Series A and Series B on a pro-rata as-if converted basis.
F-25
Table of Contents
EXTEND HEALTH, INC.
NOTES TO CONSOLIDATED FINANCIAL STATEMENTS—(CONTINUED)
The following table sets forth the computation of our basic and diluted net income (loss) per share attributable to common stockholders during the years ended June 30, 2009, 2010 and 2011 and the nine months ended March 31, 2011 and 2012 (in thousands, except for share and per share amounts):
| Year Ended June 30, | Nine Months Ended March 31, |
|||||||||||||||||||
| 2009 | 2010 | 2011 | 2011 | 2012 | ||||||||||||||||
| (unaudited) | ||||||||||||||||||||
| Basic net income (loss): |
||||||||||||||||||||
| Net income (loss) |
$ | (14,365 | ) | $ | 12,507 | $ | 9,957 | $ | 6,856 | $ | 5,224 | |||||||||
| Less: preferred stock dividends |
— | — | — | — | (35,569 | ) | ||||||||||||||
| Less: undistributed net income allocated to preferred stockholders |
— | (12,227 | ) | (9,281 | ) | (6,461 | ) | — | ||||||||||||
|
|
|
|
|
|
|
|
|
|
|
|||||||||||
| Net income (loss) attributable to common stockholders |
$ | (14,365 | ) | $ | 280 | $ | 676 | $ | 395 | $ | (30,345 | ) | ||||||||
|
|
|
|
|
|
|
|
|
|
|
|||||||||||
| Diluted net income (loss): |
||||||||||||||||||||
| Net income (loss) used to compute basic net income (loss) per share |
$ | (14,365 | ) | $ | 280 | $ | 676 | $ | 395 | $ | (30,345 | ) | ||||||||
| Undistributed net income re-allocated to common stockholders |
— | 541 | 463 |
|
240 |
|
|
— |
| |||||||||||
|
|
|
|
|
|
|
|
|
|
|
|||||||||||
| Net income (loss) used to compute diluted net income (loss) per share |
$ | (14,365 | ) | $ | 821 | $ | 1,139 | $ | 635 | $ | (30,345 | ) | ||||||||
|
|
|
|
|
|
|
|
|
|
|
|||||||||||
| Basic shares: |
||||||||||||||||||||
| Weighted-average common shares outstanding |
199,495 | 414,615 | 1,424,511 | 1,394,005 | 1,521,353 | |||||||||||||||
|
|
|
|
|
|
|
|
|
|
|
|||||||||||
| Diluted shares: |
||||||||||||||||||||
| Weighted-average shares used to compute basic net income (loss) per share |
199,495 | 414,615 | 1,424,511 | 1,394,005 | 1,521,353 | |||||||||||||||
| Dilutive effect of stock options |
— | 873,525 | 1,145,211 | 984,439 | — | |||||||||||||||
|
|
|
|
|
|
|
|
|
|
|
|||||||||||
| Weighted-average shares used to compute diluted net income (loss) per share |
199,495 | 1,288,140 | 2,569,722 | 2,378,444 | 1,521,353 | |||||||||||||||
|
|
|
|
|
|
|
|
|
|
|
|||||||||||
| Net income (loss) per share attributable to common stockholders: |
||||||||||||||||||||
| Basic |
$ | (72.01 | ) | $ | 0.67 | $ | 0.47 | $ | 0.28 | $ | (19.95 | ) | ||||||||
|
|
|
|
|
|
|
|
|
|
|
|||||||||||
| Diluted |
$ | (72.01 | ) | $ | 0.64 | $ | 0.44 | $ | 0.27 | $ | (19.95 | ) | ||||||||
|
|
|
|
|
|
|
|
|
|
|
|||||||||||
The following outstanding shares of common stock equivalents were excluded from the computation of diluted net income (loss) per common share for the periods presented because including them would have been antidilutive:
| Year Ended June 30, | Nine Months Ended March 31, |
|||||||||||||||||||
| 2009 | 2010 | 2011 | 2011 | 2012 | ||||||||||||||||
| (unaudited) |
||||||||||||||||||||
| Stock options to purchase common stock |
2,504,294 | 635,141 | 526,194 | 688,258 | 2,729,946 | |||||||||||||||
F-26
Table of Contents
EXTEND HEALTH, INC.
NOTES TO CONSOLIDATED FINANCIAL STATEMENTS—(CONTINUED)
Unaudited Pro Forma Net Income Per Share
The following table sets forth the computation of our pro forma basic and diluted net income per share attributable to common stockholders during the year ended June 30, 2011 and the nine months ended March 31, 2012 (in thousands, except for share and per share amounts):
| Year Ended June 30, |
Nine Months Ended March 31, |
|||||||
| 2011 | 2012 | |||||||
| Net income |
$ | 9,957 | $ | 5,224 | ||||
|
|
|
|
|
|||||
| Basic shares: |
||||||||
| Weighted-average shares used to compute basic net income per share |
1,424,511 | 1,521,353 | ||||||
| Pro forma adjustment to reflect assumed conversion of convertible preferred stock to occur upon consummation of our expected initial public offering |
14,749,992 | 14,749,992 | ||||||
| Pro forma adjustment to reflect the number of shares issued in our expected initial public offering whose proceeds would be required to cover dividends paid* |
||||||||
|
|
|
|
|
|||||
| Weighted-average shares used to compute basic pro forma net income per share |
||||||||
|
|
|
|
|
|||||
| Diluted shares: |
||||||||
| Weighted-average shares used to compute basic pro forma net income per share |
||||||||
| Dilutive effect of stock options |
1,145,211 | 2,030,850 | ||||||
|
|
|
|
|
|||||
| Weighted-average shares used to compute diluted pro forma net income per share |
||||||||
|
|
|
|
|
|||||
| Pro forma net income per share attributable to common stockholders: |
||||||||
| Basic |
$ | $ | ||||||
|
|
|
|
|
|||||
| Diluted |
$ | $ | ||||||
|
|
|
|
|
|||||
| * | Adjustment cannot be quantified until price range for initial public offering has been finalized. |
Note 14. Income Taxes
The following table presents the components of the provision for income taxes for the periods presented (in thousands):
| Year Ended June 30, | ||||||||||||
| 2009 | 2010 | 2011 | ||||||||||
| Current: |
||||||||||||
| Federal |
$ | — | $ | 232 | $ | 3,019 | ||||||
| State |
2 | 114 | 548 | |||||||||
|
|
|
|
|
|
|
|||||||
| Total current |
2 | 346 | 3,567 | |||||||||
|
|
|
|
|
|
|
|||||||
| Deferred: |
||||||||||||
| Federal |
— | — | (898 | ) | ||||||||
| State |
— | — | (164 | ) | ||||||||
|
|
|
|
|
|
|
|||||||
| Total deferred |
— | — | (1,062 | ) | ||||||||
|
|
|
|
|
|
|
|||||||
| Total provision for income taxes |
$ | 2 | $ | 346 | $ | 2,505 | ||||||
|
|
|
|
|
|
|
|||||||
F-27
Table of Contents
EXTEND HEALTH, INC.
NOTES TO CONSOLIDATED FINANCIAL STATEMENTS—(CONTINUED)
The total income tax expense differs from the amounts computed by applying the statutory federal income tax rate of 34% as follows (in thousands):
| Year Ended June 30, | ||||||||||||
| 2009 | 2010 | 2011 | ||||||||||
| U.S. federal taxes (benefit) at statutory rate |
$ | (4,883 | ) | $ | 4,370 | $ | 4,237 | |||||
| State taxes, net of federal benefit |
(482 | ) | 449 | 440 | ||||||||
| Change in valuation allowance |
5,328 | (4,610 | ) | (2,219 | ) | |||||||
| Other |
39 | 137 | 47 | |||||||||
|
|
|
|
|
|
|
|||||||
| Provision for income taxes |
$ | 2 | $ | 346 | $ | 2,505 | ||||||
|
|
|
|
|
|
|
|||||||
| Effective income tax rate |
0.0 | % | 2.7 | % | 20.1 | % | ||||||
Significant components of the deferred tax assets and liabilities are as follows (in thousands):
| June 30, | ||||||||
| 2010 | 2011 | |||||||
| Deferred tax assets: |
||||||||
| Net operating loss carryforwards |
$ | 1,544 | $ | 98 | ||||
| Accrued expenses |
118 | 902 | ||||||
| Goodwill |
747 | 673 | ||||||
| Alternative minimum tax credits |
231 | — | ||||||
| Stock-based compensation expense |
29 | 55 | ||||||
|
|
|
|
|
|||||
| Gross deferred tax assets |
2,669 | 1,728 | ||||||
| Valuation allowance |
(2,219 | ) | — | |||||
|
|
|
|
|
|||||
| Total deferred tax assets |
450 | 1,728 | ||||||
| Deferred tax liabilities—depreciation and amortization |
(450 | ) | (666 | ) | ||||
|
|
|
|
|
|||||
| Total net deferred tax assets |
$ | — | $ | 1,062 | ||||
|
|
|
|
|
|||||
| Net deferred tax assets—current |
$ | — | $ | 805 | ||||
| Net deferred tax assets—non-current |
— | 257 | ||||||
|
|
|
|
|
|||||
| Total net deferred tax assets |
$ | — | $ | 1,062 | ||||
|
|
|
|
|
|||||
We had recorded a full valuation allowance against our net deferred tax assets as of June 30, 2010 due to the uncertainty as to whether such assets would be realized. Based on available evidence during the year ended June 30, 2011, we determined it was more likely than not that the net deferred tax assets will be utilized. The valuation allowance decreased by $2.2 million during the year ended June 30, 2011 due to current year taxable income and the release of the valuation allowance.
As of June 30, 2011, we had $1.7 million of state net operating loss carryforwards available to offset future taxable income. The state net operating loss carryforwards begin to expire in 2030, if not utilized. In addition, the use of net operating loss carryforwards may be limited under Section 382 of the Internal Revenue Code in certain situations where changes occur in the stock ownership of a company. In the event that we have a change in ownership, utilization of the state net operating loss carryforwards could be restricted.
We file income tax returns in the United States on a federal basis, as well as California, Utah and other states. Tax regulations within each jurisdiction are subject to the interpretation of the related tax laws and
F-28
Table of Contents
EXTEND HEALTH, INC.
NOTES TO CONSOLIDATED FINANCIAL STATEMENTS—(CONTINUED)
regulations and require significant judgment. The tax periods from 2008 forward remain open to examination in the United States and Utah, and the tax periods from 2007 and forward remain open to examination in California. The federal, California and Utah jurisdictions represent the major taxing jurisdictions where we are subject to tax.
Note 15. Employee Benefit Plan
We have in place a defined contribution retirement plan (“401(k) Plan”) which is qualified under the Internal Revenue Code. All eligible employees are entitled to participate in the 401(k) Plan. Employee contributions are fully vested when contributed. Our contributions to the 401(k) Plan are discretionary and are fully vested when contributed. During the years ended June 30, 2009, 2010 and 2011, and the nine months ended March 31, 2011 and 2012, we made discretionary contributions to the 401(k) Plan of $200,000, $292,000, $316,000, $211,000 and $349,000, respectively, which were expensed as incurred.
Note 16. Subsequent Events
For our consolidated financial statements as of June 30, 2010 and 2011, and for each of the three years in the period ended June 30, 2009, 2010 and 2011, we evaluated the following subsequent events through September 1, 2011, the date our consolidated financial statements were available to be issued.
Amendments to Silicon Valley Bank Loan Agreement
On July 27, 2011 and August 22, 2011, we amended our Silicon Valley Bank loan agreement as discussed in Note 5.
Dividend Declaration
On August 29, 2011, the board of directors declared a cash dividend payment of $27.0 million to stockholders of record as discussed in Note 10.
Warrant Issuance
On August 15, 2011, we issued a performance based warrant to one of our referral partners as discussed in Note 11.
Note 17. Subsequent Events (unaudited)
For our consolidated financial statements as of March 31, 2012 and for the nine months then ended, we evaluated subsequent events through April 30, 2012, the date our interim consolidated financial statements were available to be issued.
Stock Plan
In April 2012, our board adopted a 2012 Equity Incentive Plan, or the 2012 Plan, and we expect our stockholders will approve it prior to the completion of this offering. Subject to stockholder approval, the 2012 Plan is effective upon the later to occur of its adoption by our board or the business day immediately prior to the effective date for this offering, but is not expected to be used until after the completion of this offering. A total of 1,800,00 shares, subject to adjustment as provided in the 2012 Plan, of our common stock are reserved for issuance pursuant to the 2012 Plan, of which no awards are issued and outstanding.
F-29
Table of Contents
Table of Contents
PART II
INFORMATION NOT REQUIRED IN THE PROSPECTUS
| Item 13. | Other Expenses of Issuance and Distribution. |
Estimated expenses, other than underwriting discounts and commissions, payable by the Registrant in connection with the sale of the common stock being registered under this registration statement are as follows:
| SEC registration fee |
$ | 8,595 | ||
| FINRA filing fee |
8,000 | |||
| NASDAQ Listing fee |
* | |||
| Printing and engraving expenses |
* | |||
| Legal fees and expenses |
* | |||
| Accounting fees and expenses |
* | |||
| Transfer agent and registrar fees and expenses |
* | |||
| Miscellaneous |
* | |||
|
|
|
|||
| Total |
$ | * | ||
|
|
|
| * | To be filed by amendment. |
| Item 14. | Indemnification of Directors and Officers. |
On completion of this offering, the Registrant’s amended and restated certificate of incorporation will contain provisions that eliminate, to the maximum extent permitted by the General Corporation Law of the State of Delaware, the personal liability of the Registrant’s directors and executive officers for monetary damages for breach of their fiduciary duties as directors or officers. The Registrant’s amended and restated certificate of incorporation and bylaws will provide that the Registrant must indemnify its directors and executive officers and may indemnify its employees and other agents to the fullest extent permitted by the General Corporation Law of the State of Delaware.
Sections 145 and 102(b)(7) of the General Corporation Law of the State of Delaware provide that a corporation may indemnify any person made a party to an action by reason of the fact that he or she was a director, executive officer, employee or agent of the corporation or is or was serving at the request of a corporation against expenses (including attorneys’ fees), judgments, fines and amounts paid in settlement actually and reasonably incurred by him or her in connection with such action if he or she acted in good faith and in a manner he or she reasonably believed to be in, or not opposed to, the best interests of the corporation and, with respect to any criminal action or proceeding, had no reasonable cause to believe his or her conduct was unlawful, except that, in the case of an action by or in right of the corporation, no indemnification may generally be made in respect of any claim as to which such person is adjudged to be liable to the corporation.
The Registrant has entered into indemnification agreements with its directors and executive officers, in addition to the indemnification provided for in its amended and restated certificate of incorporation and bylaws, and intends to enter into indemnification agreements with any new directors and executive officers in the future.
The Registrant has purchased and intends to maintain insurance on behalf of each and any person who is or was a director or officer of the Registrant against any loss arising from any claim asserted against him or her and incurred by him or her in any such capacity, subject to certain exclusions.
The Underwriting Agreement (Exhibit 1.1 hereto) provides for indemnification by the underwriters of the Registrant and its executive officers and directors, and by the Registrant of the underwriters, for certain liabilities, including liabilities arising under the Securities Act.
See also the undertakings set out in response to Item 17 herein.
II-1
Table of Contents
| Item 15. | Recent Sales of Unregistered Securities. |
During the last three years, we sold the following unregistered securities:
Warrant
In August 2011, the Registrant issued a warrant to purchase up to 948,011 shares of the Registrant’s common stock to an accredited investor at an exercise price of $10.00 per share.
Option and Common Stock Issuances
From April 1, 2009 through March 31, 2012, the Registrant granted to its directors, employees, consultants and other service providers options to purchase an aggregate of 2,299,689 shares of common stock under the Registrant’s 2007 Equity Incentive Plan, or the 2007 Plan, at exercise prices ranging from $0.28 to $7.20 per share, which reflects the adjustments in August and December 2011 to numbers of shares and exercise prices of these options.
From April 1, 2009 through March 31, 2012, the Registrant issued and sold to its directors, employees, consultants and other service providers an aggregate of 1,242,908 shares of common stock upon the exercise of options under the 2007 Plan and the 2004 Equity Incentive Plan at exercise prices ranging from $0.06 to $1.59 per share, for an aggregate exercise price of $561,000.
None of the foregoing transactions involved any underwriters, underwriting discounts or commissions, or any public offering, and the Registrant believes that each transaction was exempt from the registration requirements of the Securities Act in reliance on Rule 701 promulgated under the Securities Act as transactions pursuant to a compensatory benefit plan approved by the Registrant’s board of directors, or Section 4(2) of the Securities Act, as transactions by an issuer not involving a public offering. Each recipient of the securities in these transactions represented his or her intention to acquire the securities for investment only and not with a view to, or for resale in connection with, any distribution thereof, and appropriate legends were affixed to the share certificates issued in each such transaction. In each case, the recipient received adequate information about the Registrant or had adequate access, through his or her relationship with the Registrant, to information about the Registrant.
| Item 16. | Exhibits and Financial Statement Schedules. |
(a) Exhibits:
We have filed the exhibits listed on the accompanying Exhibit Index of this Registration Statement.
(b) Financial Statement Schedules.
All other schedules have been omitted because the information required to be presented in them is not applicable or is shown in the consolidated financial statements or related notes.
| Item 17. | Undertakings. |
The Registrant hereby undertakes to provide to the underwriters at the closing as specified in the underwriting agreement certificates in such denominations and registered in such names as required by the underwriters to permit prompt delivery to each purchaser
Insofar as indemnification for liabilities arising under the Securities Act of 1933, as amended, may be permitted to directors, officers and controlling persons of the Registrant pursuant to the foregoing provisions, or otherwise, the Registrant has been advised that in the opinion of the Securities and Exchange Commission such
II-2
Table of Contents
indemnification is against public policy as expressed in the Securities Act of 1933, as amended, and is, therefore, unenforceable. In the event that a claim for indemnification against such liabilities (other than the payment by the Registrant of expenses incurred or paid by a director, officer or controlling person of the Registrant in the successful defense of any action, suit or proceeding) is asserted by such director, officer or controlling person in connection with the securities being registered, the Registrant will, unless in the opinion of its counsel the matter has been settled by controlling precedent, submit to a court of appropriate jurisdiction the question whether such indemnification by it is against public policy as expressed in the Securities Act of 1933, as amended, and will be governed by the final adjudication of such issue.
The Registrant hereby undertakes that:
(1) For purposes of determining any liability under the Securities Act of 1933, as amended, the information omitted from a form of prospectus filed as part of this registration statement in reliance upon Rule 430A and contained in the form of prospectus filed by the Registrant pursuant to Rule 424(b)(1) or (4) or 497(h) under the Securities Act of 1933, as amended, shall be deemed to be part of this registration statement as of the time it was declared effective.
(2) For the purpose of determining any liability under the Securities Act of 1933, as amended, each post-effective amendment that contains a form of prospectus shall be deemed to be a new registration statement relating to the securities offered therein, and the offering of such securities at that time shall be deemed to be the initial bona fide offering thereof.
II-3
Table of Contents
SIGNATURES
Pursuant to the requirements of the Securities Act of 1933, the registrant has duly caused this amendment to registration statement to be signed on its behalf by the undersigned, thereunto duly authorized, in the City of San Mateo, State of California, on April 30, 2012.
| EXTEND HEALTH, INC. | ||
| By: | /s/ Bryce A. Williams | |
| Bryce A. Williams | ||
| President and Chief Executive Officer | ||
Pursuant to the requirements of the Securities Act of 1933, this amendment to registration statement has been signed by the following persons in the capacities indicated below:
| Signature |
Title |
Date | ||
| /s/ Bryce A. Williams Bryce A. Williams |
President, Chief Executive Officer and Director (Principal Executive Officer) |
April 30, 2012 | ||
| /s/ Terri L. Brncic Terri L. Brncic |
Vice President and Chief Financial Officer (Principal Financial and Accounting Officer) |
April 30, 2012 | ||
| * Richard A. Gephardt |
Director | April 30, 2012 | ||
| * David G. Golden |
Director | April 30, 2012 | ||
| * Stephen M. Krupa |
Director | April 30, 2012 | ||
| * Anthony E. Meyer |
Director | April 30, 2012 | ||
| * Albert S. Waxman |
Director | April 30, 2012 | ||
| * By: | /s/ Bryce A. Williams | |
| Bryce A. Williams | ||
| Attorney-in-fact | ||
II-4
Table of Contents
EXHIBIT INDEX
| Exhibit |
Description | |
| 1.1 | Form of Underwriting Agreement. | |
| 3.1# | Form of Amended and Restated Certificate of Incorporation of the Registrant, to be in effect upon the completion of this offering. | |
| 3.2# | Form of Amended and Restated Bylaws of the Registrant, to be in effect upon the completion of this offering. | |
| 3.3# | Third Amended and Restated Certificate of Incorporation of the Registrant, as amended, as currently in effect. | |
| 3.4# | Amended and Restated Bylaws of the Registrant, as currently in effect. | |
| 4.1 | Specimen common stock certificate of the Registrant. | |
| 4.2# | Amended and Restated Investors’ Rights Agreement, dated as of February 27, 2009, among the Registrant and certain holders of the Registrant’s capital stock named therein. | |
| 4.3†# | Warrant to Purchase Stock issued by the Registrant to Towers Watson Pennsylvania, Inc., dated August 15, 2011. | |
| 5.1* | Opinion of Wilson Sonsini Goodrich & Rosati, Professional Corporation. | |
| 10.1 | Form of Indemnification Agreement between the Registrant and each of its directors and officers. | |
| 10.2 | 2004 Equity Incentive Plan and Form of Stock Option Agreement under 2004 Equity Incentive Plan. | |
| 10.3 | 2007 Equity Incentive Plan and Form of Stock Option Agreement under 2007 Equity Incentive Plan. | |
| 10.4 | 2012 Equity Incentive Plan and Form of Award Agreements under 2012 Equity Incentive Plan. | |
| 10.5# | Employment Agreement between the Registrant and Bryce A. Williams, dated as of July 27, 2007. | |
| 10.6# | Employment Agreement between the Registrant and Terri L. Brncic, dated as of September 29, 2011. | |
| 10.7# | Employment Agreement between the Registrant and Joseph J. Murad, dated as of July 27, 2007. | |
| 10.8# | Employment Agreement between the Registrant and Cameron C. Liljenquist, dated as of August 24, 2007. | |
| 10.9# | Employment Agreement between the Registrant and Brian R. Bohlig, dated as of August 24, 2009. | |
| 10.10†# | Written Description of FY2012 Executive Incentive Compensation Plan Covering Named Executive Officers. | |
| 10.11# | Industrial Multi-Tenant Lease, dated as of May 17, 2011, by and between the Registrant and | |
| 10.12# | Office Lease, dated as of June 28, 2010, by and between the Registrant and EOP-Peninsula Office Park, L.L.C, as amended. | |
| 10.13# | Commercial Triple Net Lease, dated May 11, 2009, by and among the Registrant and Sterling View Drive, LLC (f/k/a Fidelity Funding Company), as amended. | |
| 10.14# | Commercial Triple Net Lease, dated as of February 1, 2010, by and between the Registrant and Sterling View Drive, LLC (f/k/a Fidelity Funding Company), as amended. | |
| 10.15# | Loan and Security Agreement, dated as of July 15, 2010, by and among the Registrant, Extend Administrators, LLC, Extend Insurance Services LLC and Silicon Valley Bank, as amended. | |
| 10.16 | Executive Incentive Compensation Plan | |
| 21.1 | List of subsidiaries of the Registrant. | |
| 23.1 | Consent of Independent Registered Public Accounting Firm. | |
| 23.2* | Consent of Wilson Sonsini Goodrich & Rosati, Professional Corporation (included in Exhibit 5.1). | |
II-5
Table of Contents
| Exhibit |
Description | |
| 24.1# | Power of Attorney (see page II-4 to the original filing of this registration statement on Form S-1). | |
| * | To be filed by amendment. |
| † | Portions of this exhibit have been omitted pending a determination by the Securities and Exchange Commission as to whether these portions should be granted confidential treatment. |
| # | Previously filed. |
II-6