Attached files
| file | filename |
|---|---|
| EX-99.1 - CAL DIVE 1Q12 EARNINGS PRESS RELEASE - Cal Dive International, Inc. | exhibit99_1.htm |
| 8-K - CAL DIVE FORM 8-K 1Q12 EARNINGS RELEASE - Cal Dive International, Inc. | form8k033112earn.htm |
Exhibit 99.2

Cal Dive International
1st Quarter 2012 Earnings Conference Call
Forward-Looking Statements
This press release may include “forward-looking” statements that are generally identifiable through the
use of words such as “believe,” “expect,” “anticipate,” “intend,” “plan,” “estimate,” “project” and similar
expressions and include any statements that are made regarding earnings expectations. The forward-
looking statements speak only as of the date of this release, and we undertake no obligation to update or
revise such statements to reflect new information or events as they occur. Actual future results may differ
materially due to a variety of factors, including current economic and financial market conditions,
changes in commodity prices for natural gas and oil and in the level of offshore exploration, development
and production activity in the oil and natural gas industry, the impact on the market and regulatory
environment in the U.S. Gulf of Mexico resulting from the Macondo well blowout, the inability to obtain
contracts with favorable pricing terms if there is a downturn in our business cycle, intense competition in
our industry, the operational risks inherent in our business, and other risks detailed in our most recently
filed Annual Report on Form 10-K.
2
Presentation Outline
3
Summary of 1Q 2012 Results
Backlog
Discussion of Financial Results
Non-GAAP Reconciliations
Q & A
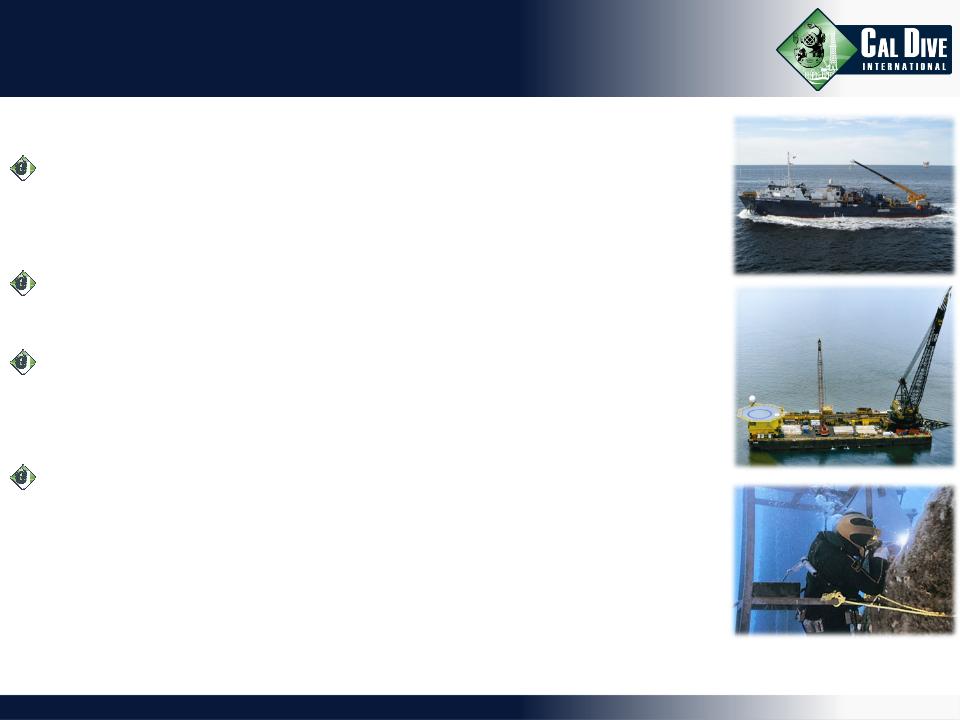
Summary of 1Q Results
4
Uncle John, Kestrel, and Atlantic in dry-
dock during quarter.
Typical weather seasonality in the GoM.
Increased March 31 backlog over $80
million from December 31.
Sale of DSV Eclipse.
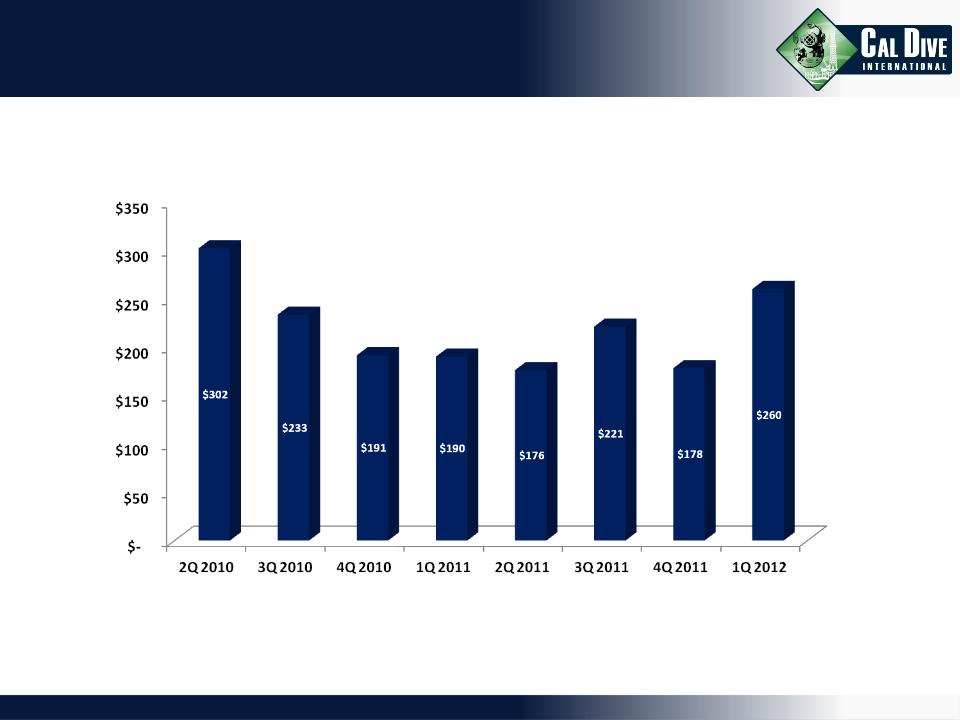
Backlog
5
($ millions)
Financial Results
6
(1) See reconciliation on Non-GAAP financial measures at the end of the presentation.
(2) Tax effected.
|
|
Three Months
|
||
|
|
Ended March 31,
|
||
|
|
2012
|
|
2011
|
|
|
|
|
|
|
Revenues
|
$60,017
|
|
$95,431
|
|
|
|
|
|
|
Gross Profit
|
(16,420)
|
|
(7,226)
|
|
Margins
|
(27%)
|
|
(8%)
|
|
|
|
|
|
|
Loss Attributable to Cal Dive
|
(24,305)
|
|
(18,745)
|
|
Margins
|
(40%)
|
|
(20%)
|
|
|
|
|
|
|
Diluted Loss Per Share
|
($0.26)
|
|
($0.20)
|
|
|
|
|
|
|
Loss Attributable to Cal Dive
|
($24,305)
|
|
($18,745)
|
|
Non-cash asset impairments (2)
|
878
|
|
-
|
|
Adjusted Loss Attributable to Cal Dive
|
($23,427)
|
|
($18,745)
|
|
Margins
|
(39%)
|
|
(20%)
|
|
|
|
|
|
|
Adjusted Diluted Loss Per Share
|
($0.25)
|
|
($0.20)
|
|
|
|
|
|
|
EBITDA (1)
|
($12,029)
|
|
($1,338)
|
|
Margins
|
(20%)
|
|
(1%)
|

Utilization
7
|
(The following statistics are for owned
and operated vessels only) |
|
|
Three Months
|
||
|
|
Ended March 31,
|
||
|
|
2012
|
|
2011
|
|
Effective Utilization (1) -
|
|
|
|
|
Saturation Diving Vessels (2)
|
52%
|
|
48%
|
|
Surface Diving Vessels
|
23%
|
|
34%
|
|
Construction Barges
|
20%
|
|
15%
|
|
Total Fleet
|
28%
|
|
30%
|
|
|
|
||
|
Calendar Day Utilization -
|
|
|
|
|
Saturation Diving Vessels (2)
|
37%
|
|
38%
|
|
Surface Diving Vessels
|
23%
|
|
32%
|
|
Construction Barges
|
18%
|
|
14%
|
|
Total Fleet
|
25%
|
|
27%
|
|
(1)
|
Effective vessel utilization is calculated by dividing the total number of days the vessels generated revenues by the total number of days the vessels were
available for operation in each period, including those temporarily removed from service, but excluding vessels permanently removed from service or while in dry-dock. |
|
(2)
|
The calendar and effective utilization calculations for the first quarter of 2011 include a dive support vessel that was sold during the first quarter of 2012, and
is excluded from the calendar and effective utilization calculations for the first quarter of 2012. |
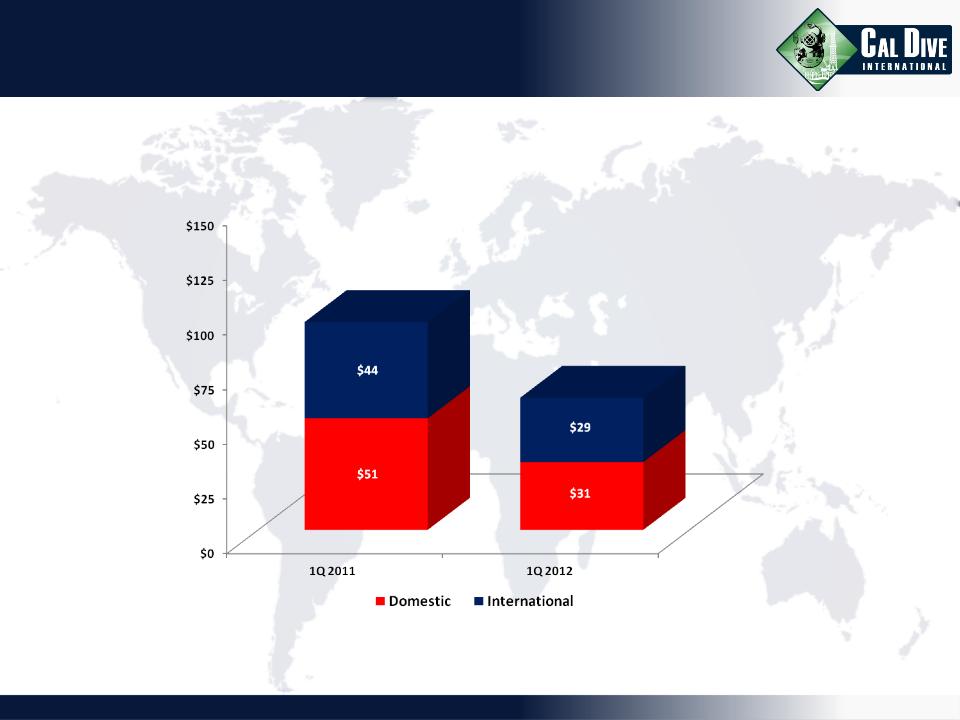
Revenue Breakdown
8
($ millions)
{46%}
{54%}
{48%}
{52%}
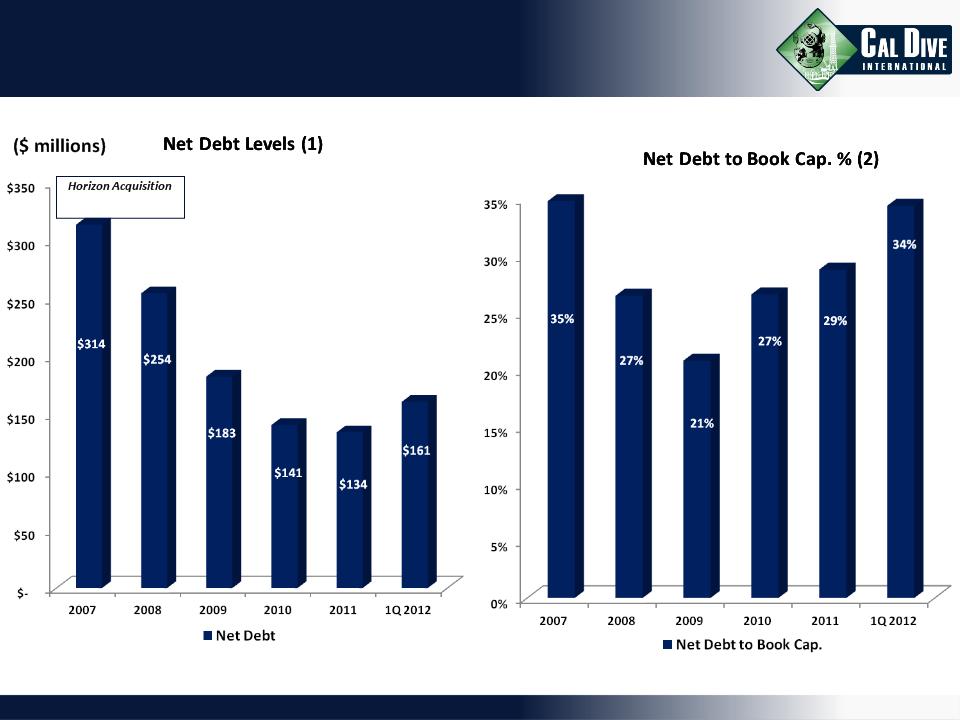
Debt Levels
9
(1) Calculated as Total Debt less Cash and Cash Equivalents.
(2) Calculated as Net Debt divided by Equity plus Net Debt.
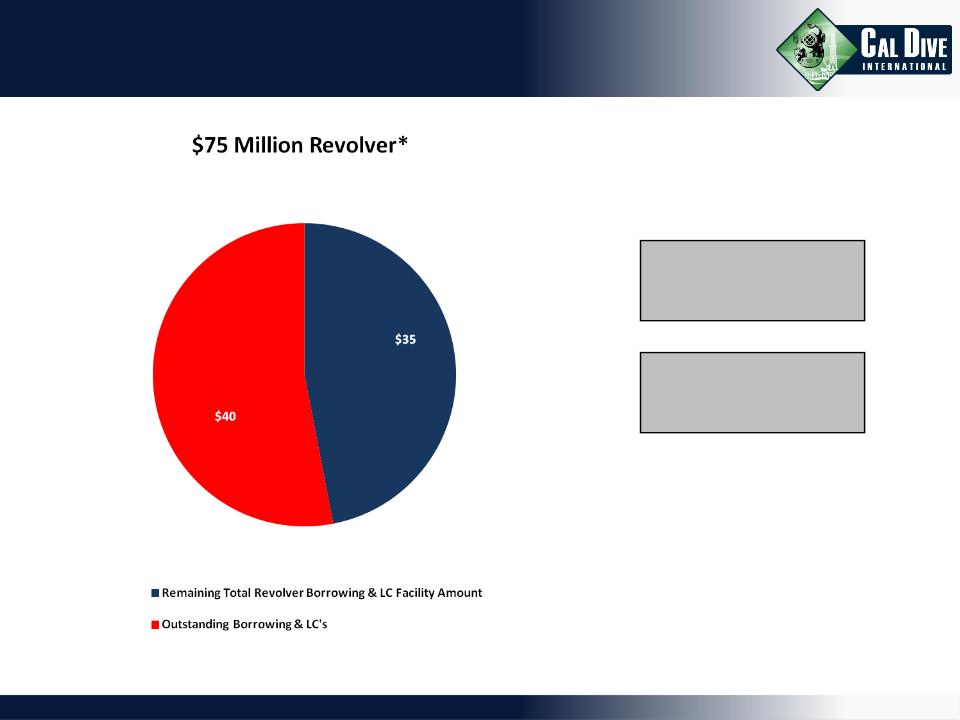
Liquidity
10
Cash at 3/31/2012:
$9 Million
$9 Million
*Revolver size temporarily stepped
down to $75 million for 1Q12 and
subsequently returns to $150 million.
down to $75 million for 1Q12 and
subsequently returns to $150 million.
Non-GAAP Reconciliations
11

EBITDA Reconciliations
12
|
(all amounts in thousands)
|
|
Three Months
|
|||
|
|
Ended March 31,
|
||
|
|
2012
|
|
2011
|
|
|
|
|
|
|
EBITDA (unaudited)
|
($12,029)
|
|
($1,338)
|
|
|
|
|
|
|
Less: Depreciation & Amortization
|
14,636
|
|
16,876
|
|
Less: Income Tax Expense (Benefit)
|
(8,389)
|
|
(3,777)
|
|
Less: Interest Expense, net
|
2,300
|
|
2,027
|
|
Less: Non-Cash Stock Comp. Expense
|
2,378
|
|
2,281
|
|
Less: Non-Cash Asset Impairment Charge
|
1,351
|
|
-
|
|
Loss Attributable to Cal Dive
|
($24,305)
|
|
($18,745)
|