Attached files
UNITED STATES
SECURITIES AND EXCHANGE COMMISSION
WASHINGTON, DC 20549
FORM 10-K/A
(AMENDMENT NO. 2 )
|
[X]
|
ANNUAL REPORT PURSUANT TO SECTION 13 OR 15(D) OF THE SECURITIES EXCHANGE ACT OF 1934
|
For the year ended December 31, 2011
Commission file number: 000-31380
|
APPLIED MINERALS, INC.
|
||
|
(Exact name of registrant as specified in its charter)
|
||
|
Delaware
|
82-0096527
|
|
|
(State or other jurisdiction of incorporation or organization)
|
(I.R.S. Employer Identification No.)
|
|
|
110 Greene Street – Suite 1101, New York, NY
|
10012
|
||||
|
(Address of principal executive offices)
|
(Zip Code)
|
||||
|
(800) 356-6463
|
|||||
|
Issuer's telephone number, including area code
|
|||||
Indicate by check mark if the registrant is a well-known seasoned issuer, as defined in Rule 405 of the Securities Act.
|
YES
|
o |
NO
|
x
|
Indicate by check mark if the registrant is not required to file reports pursuant to Section 13 or 15(d) of the Act:
|
YES
|
o |
NO
|
x
|
Indicate by check mark whether the registrant: (1) has filed all reports required to be filed by Section 13 or 15(d) of the Securities Exchange Act of 1934 during the preceding 12 months (or for such shorter period that the registrant was required to file such reports), and (2) has been subject to such filing requirements for the past 90 days.
|
YES
|
x
|
NO
|
o |
Indicate by check mark whether the registrant submitted electronically and posted on its corporate website, if any, every Interactive Data File required to be submitted and posted pursuant to Rule 405 of Regulation S-T (§ 232.405 of this chapter) during the preceding 12 months (or for such shorter period that the registrant was required to submit and post such files).
|
YES
|
x
|
NO
|
o |
Indicate by check mark if disclosure of delinquent filers pursuant to Item 405 of Regulations S-K is not contained herein, and will not be contained, to the best of registrant’s knowledge, in definitive proxy or information statements incorporated by reference in Part III of this Form 10-K/A (AMENDMENT NO. 2 ) or any amendment to this Form 10-K/A (AMENDMENT NO. 2 ).
|
x
|
Indicate by check mark whether the registrant is a large accelerated filer, an accelerated filer, a non-accelerated filer, or a smaller reporting company. See the definitions of “large accelerated filer,” “accelerated filer” and “smaller-reporting company” in Rule 12b-2 of the Exchange Act.
|
Large Accelerated Filer
|
o |
Accelerated Filer
|
x
|
Non-accelerated Filer
|
o |
Smaller Reporting Company
|
o |
Indicate by check mark whether the registrant is a shell company (as defined in Rule 12b-2 of the Exchange Act).
|
YES
|
o |
NO
|
x
|
The aggregate market value of the voting and non-voting common equity held by non-affiliates of the registrant on June 30, 2011, based on the last sales price on the OTC Bulletin Board on that date, was approximately $89,144,127.
APPLIED MINERALS, INC. AND SUBSIDIARY
YEAR 2011 ANNUAL REPORT ON FORM 10-K/A (AMENDMENT NO. 2 )
TABLE OF CONTENTS
|
PART I
|
Page(s)
|
|
|
Item 1.
|
Business
|
3
|
|
Item 1A.
|
Risk Factors
|
10
|
|
Item 1B.
|
Unresolved Staff Comments
|
11
|
|
Item 2.
|
Properties
|
11
|
|
Item 3.
|
Legal Proceedings
|
12
|
|
Item 4.
|
Mine Safety Disclosures
|
12
|
|
PART II
|
||
|
Item 5.
|
Market Price for the Registrant’s Common Equity, Related Stockholders Matters and Issuer Purchases of Equity Securities
|
12
|
|
Item 6.
|
Selected Financial Data
|
15
|
|
Item 7.
|
Management’s Discussion and Analysis of Financial Condition and Results of Operation
|
15
|
|
Item 7A.
|
Quantitative and Qualitative Disclosures About Market Risk
|
19
|
|
Item 8.
|
Financial Statements and Supplementary Data
|
19
|
|
Item 9.
|
Changes in and Disagreements with Accountants on Accounting and Financial Disclosure
|
19
|
|
Item 9A.
|
Controls and Procedures
|
19
|
|
Item 9B.
|
Other Information
|
21
|
|
PART III
|
||
|
Item 10.
|
Directors and Executive Officers and Corporate Governance
|
21
|
|
Item 11.
|
Executive Compensation
|
24
|
|
Item 12.
|
Security Ownership of Certain Beneficial Owners and Management and Related Stockholder Matters
|
28
|
|
Item 13.
|
Certain Relationships and Related Transactions, and Director Independence
|
29
|
|
Item 14.
|
Principal Accounting Fees and Services
|
30
|
|
Item 15.
|
Exhibits
|
31
|
|
PART IV
|
||
|
Item 16.
|
Exhibits, Financial Statement Schedules and Reports on Form 8-K
|
F-1 – F-31
|
2
PREFERATORY NOTE
The purpose of this Amendment No. 2 to our Annual Report on Form 10-K for the fiscal year ended December 31, 2011 ("Form 10-K"), as filed with the Securities and Exchange Commission ("SEC") on March 19, 2012, is to furnish information for Items 10 through 14. . In prior years, such information has been included in definitive proxy materials filed prior to 120 days after the end of the fiscal year and incorporated into the 10-K. The 10-K is deemed to be timely filed if such information is incorporated by reference within the 120 day period. After the filing of the 10-K in March, the Company determined to hold its annual meeting in September 2012 and, as a result, it is impractical to file definitive proxy materials within the 120-day period. Accordingly, the 10-K is amended to include the information for Items 10 to 14 within 120 days and as amended the 10-K is deemed to be timely filed.
No other changes have been made to the Form 10-K other than the furnishing of the information described above. This Amendment No. 2 to the Form 10-K speaks as of the original filing date of the Form 10-K, and does not reflect subsequent events occurring after the original filing date of the Form 10-K or modify or update in any way disclosures made in the Form 10-K.
Pursuant to Rule 406T of Regulation S-T, the XBRL Exhibit attached hereto are deemed not filed or part of a registration statement or prospectus for purposes of Sections 11 or 12 of the Securities Act of 1933, as amended, are deemed not filed for purposes of Section 18 of the Securities Exchange Act of 1934, as amended, and otherwise are not subject to liability under those sections.
NOTE REGARDING FORWARD LOOKING STATEMENTS
This Annual Report on Form 10-K contains "forward-looking statements" within the meaning of Section 27A of the Securities Act of 1933 and Section 21E of the Securities Exchange Act of 1934. These forward-looking statements are based on our current expectations, assumptions, estimates and projections about our business and our industry. Words such as "believe," "anticipate," "expect," "intend," "plan," "will," "may," and other similar expressions identify forward-looking statements. In addition, any statements that refer to expectations, projections or other characterizations of future events or circumstances are forward-looking statements. These forward-looking statements are subject to certain risks and uncertainties that could cause actual results to differ materially from those reflected in the forward-looking statements. Factors that might cause such a difference include, but are not limited to, those discussed in the section of this Annual Report entitled “1A. RISK FACTORS.”
PART I
ITEM 1. BUSINESS
|
|
HISTORY AND DEVELOPMENT OF THE COMPANY
|
Applied Minerals, Inc. (“the Company”) was originally formed for the purpose of exploring and developing the Atlas Mine, a silver mine located in the Coeur d’Alene Mining District near Mullan, Idaho. During 1980 the Company suspended operations at the mine as a result of a decline in silver prices until mining operations would be profitable again. In September 1997, the Company entered the contract mining business, which was the Company’s sole source of revenue until the contract mining business was discontinued in December 2008 due to adverse economic changes in the mining industry.
In 2001 we entered a lease/purchase agreement for the Dragon Mine, located in Juab County, Utah (Tintic mining District). In 2005 we acquired a 100% ownership interest in the Dragon Mine for $500,000 in cash. The Dragon Mine is a halloysite clay property located in Juab County, Utah (Tintic Mining Distric t ). The Company purchased the Dragon Mine for the purpose of mining and marketing the unique chemical and morphological characteristics of the clay to a number of advanced application markets.
Beginning in January 2008 with the appointment of two new directors and ending in December 2008 with the resignation of a director, the membership of board of directors completely turned over. On January 1, 2008, new management was appointed. Generally speaking current management believes that the corporate strategies employed by the Company’s former management were ineffective in successfully commercializing the Dragon Mine.
THE DRAGON MINE
The Dragon Mine, to our knowledge, is the only source of halloysite clay in the Western Hemisphere large enough, and of high enough purity, to supply commercial-sized application demand.
The property is located in the Tintic District of Utah, covering approximately 230 acres with a large mining permit covering 40 acres allowing for the extraction of minerals. The property consists of 38 patented and six unpatented mining claims located in the following sections: T10S, R2W, sections 29, 30, 31, and T10S, R3W, Section 36, all relative to the Salt Lake Base Meridian. The Company pays approximately $800 in annual maintenance fees to the U.S. Department of Interior Bureau of Land Management to maintain rights to its unpatented claims. The BLM Claim Numbers are: UMC385543, UMC 385544, UMC394659, UMC394660, UMC408539, and UMC408540. The Company has no underlying royalty agreements with any third-party with respect to the Dragon Mine.
Formation of the Dragon Mine property is attributed to the alteration of fine clay sediments that accumulated on what was then a shallow sea floor over 600 million years ago. From 1949 through 1976, Filtrol Corporation operated the Dragon Mine on a contracted basis for the property’s owner at the time, a subsidiary of Anaconda Mining Company.
3
According to certain mining-related records, Filtrol mined approximately 1.35 million tons of clay from the Dragon Mine for use as an input of a petroleum-cracking catalyst product. The mine was idle from 1977 until it was leased by the Company beginning in 2001. The Company eventually purchased a 100% interest in the property in 2005 for $500,000 in cash. Currently, the Company has no underlying royalty agreements with any third-party with respect to the Dragon Mine. The current management of the Company hired geologist Dr. Ian Wilson who has supervised an extensive drilling program and continues to explore underground areas of the Dragon property including, but not limited to, two mines developed by prior operators as well as one area that had previously remained unexplored. Dr. Wilson has supervised our drilling program and has played a critical role in classifying the mineralization of the Dragon Mine property, which is essential to the successful commercialization of the mine’s deposit. Dr. Wilson is a member of iom 3 (Institute of Materials, Minerals and Mining of the UK). As of the date of this report, an above-ground area covering approximately 11.5 of the Dragon Mine’s 230 acres have been explored. The extraction of material from certain targeted areas of this resource is in progress.
The Company applied for and was granted a large mining permit in early 2011 for which it posted the required surety bond in May 2011. To date the Company has completed underground work to the 300’ level of the eastern portion of its property from where it is currently extracting halloysite clay. The Company explores underground and mines its clay mineral utilizing traditional methods and equipment and expends the necessary resources to maintain Mining Heath and Safety Act (MSHA) compliance. From our drilling activity we have sampled certain cores by engaging a leading UK-based geological consulting organization to identify the chemical composition of our mineral and classify its purity levels, the results of which are used, in part, to map our property. All quality control and quality assurance protocols utilized as part of our exploration program have been developed by this third-party organization. Analytical equipment used to classify the mineral mined at the mine includes, but is not limited to, a Scanning Electron Microscope (SEM), and XRD and XRF machines.
The Dragon Mine property also contains five waste piles comprised of material, which can, in our opinion, be processed to create a saleable product. The piles are the result of prior mining operations that took place between 1949 and 1976. The clay mined during that period was used in a petroleum-cracking catalyst application. For that application the clay mined had to contain no more than 2% of an iron oxide impurity. Any clay, which exceeded such limit, was discarded into the piles. To date, Applied Minerals has characterized the chemistry and mineralogy of the surface piles and has developed a processing system to convert them into purified halloysite products. The Company has identified a number of application areas to which it is marketing its waste pile material.
In addition to the presence of halloysite, the Dragon Mine also possesses quantities of other clays as well as iron oxide ores in the form of hematite, goethite, and ferrihydrite, some of which we are in the process of commercializing. The Dragon Mine is present at the contact between the Silver City quartz monzonite stock and limestone and dolomite of the Paleozoic formation. Gold and silver is found in veinlets in pervasively altered rocks of the Silver City stock immediately south of the Dragon mine and were one of the first discoveries made in the Tintic district in 1869. The Dragon Mine was mined as a copper-gold deposit not long after these initial findings. The mine’s fissure fault system forms the southern extremity of the Iron Blossom ore run.
It is known that within five kilometers of the Dragon Mine, exploration is being carried out by at least one major mining company to determine the possibility of the existence a large copper-gold porphyry. Whether such a porphyry exists, the location of such a porphyry, whether any deposits related to any such porphyry are located on our property and whether any such deposits would be of commercial grade or could be economically extracted is not known. If there is a porphyry, it is likely to be located at least 1000 feet under the surface and could be accessed only through a large open pit mine (so that we could not access it on our property by means of an open pit mine confined to our property). It is estimated that if there is a commercial grade mineralization that could be economically extracted, a large mining company would have to acquire sufficient land for a large open pit mine, expend billions in preparation for mining and it is estimated that it would be at least 15 or 20 years before mining could begin.
Testing of surface rock samples in the vicinity of the Dragon Mine carried out in the past show anomalous copper values with gold values exceeding one ounce per ton and silver values of approximately five ounces per ton. Records indicate that, during the 1870’s, mining activity at the Dragon Mine had been focused on the iron ore presence at the mine. According to certain records kept by the former U.S. Bureau of Mines, the 305,000 tons of iron ore mined during the 1870’s produced 18,000 ounces of gold and 928,000 ounces of silver. . In connection with our mining of iron ore at the Dragon Mine and in connection with drilling in connection with a resource statement concerning the iron ore, we have tested for the presence of commercial amounts of copper, gold and silver and we have not found any. We will continue testing and if commercial amounts are located, we will consider the appropriate alternatives.
The Company has spent significant resources on the exploration of its Dragon Mine property. The results of an extensive drilling program supervised by the Company’s consulting geologist has identified what is believed to be a sufficient amount of clay material, both underground and on the surface of the property, to support a commercial operation. The clay mineral identified at the Dragon Mine has been classified by level of purity. The Company will not be able to refer to the mineral found in its Dragon Mine property as a “reserve” until it can demonstrate the deposit is economically viable. As the Company continues to sell its halloysite clay products into existing and developing markets, it will revisit the possibility of classifying its deposit as a reserve.
Currently, the property is without known reserves and our drilling program has been exploratory in nature. During the last twelve months, the Company produced approximately 650 tons of halloysite clay and 7,500 tons of iron ore. The halloysite clay produced during this period has been used to supply certain customers and provide samples to potential customers at different stages of product development utilizing our material. We are in the process of mining and storing iron ore present on our property while we determine the best way to monetize the mineral.
4
We have completed our initial exploration program. A description of the program is as follows:
|
·
|
Cores from 80 boreholes drilled in 2003, 2005, 2006, 2009 and 2010, totaling 15,362 ft, were tested. The average depth of the 80 boreholes drilled was 192 ft with a range of depths drilled from 50ft to 360 ft;
|
|
·
|
The Western area of the property, drilled from 2003 to 2006, includes 44 boreholes totaling 9,448 ft covering an area of 6.33 acres. These boreholes were drilled in mainly altered quartz monzonite, which is an intrusive igneous rock with approximately equal parts of orthoclase and plagioclase feldspar. Quartz monzonite porphyry is often associated with copper mineralization in porphyry copper deposits;
|
|
·
|
The Dragon Pit area of the property, drilled in 2009 and 2010, includes 36 boreholes totaling 5,914 ft and covering an area of 4.95 acres. The area is mainly iron ore and some altered monzanite on the periphery. High levels of halloysite (up to 100% in some cases) are adjacent to the iron ore;
|
|
·
|
To date over 500 samples of borehole material has been tested to determine mineralogy, particularly for halloysite, kaolinite, illite, smectite levels and other properties;
|
|
·
|
Five waste piles, the product of previous clay mining activity, were drilled. The waste piles cover 34.2 acres and have volume of 1.99 million cubic yards. Following a detailed trenching campaign on the waste piles, fifty-two boreholes were drilled totaling 1,986 ft. The whole rock evaluation included chemical testing by XRF of 216 samples with 69 of these samples tested for their mineralogy by XRD. To determine clay content, samples were processed to <45 μm and <5μm fractions and 185 samples were tested for their mineralogy by XRD and 133 samples for their chemistry by XRF;
|
|
·
|
An evaluation of the iron ore present in the Pit Area (4.95 acres) and elsewhere was carried out. Testing of approximately 100 samples was carried out to determine the quality of the iron ore; and
|
|
·
|
A detailed evaluation of surface samples, from which some halloysite is now being mined from the open pit, was carried out.
|
From the above program, we believe we have identified the presence of enough halloysite and iron ore at the Dragon Mine to move forward with a commercialization of each mineral. We are contemplating further exploration of the Dragon Mine property.
Our exploration expenses for the twelve months ending December 31, 2011, 2010 and 2009 were $2,971,3626 , $2,307,202, and $1,299,753, respectively, on the halloysite clay project. Since January 1, 2009, the date on which the Company’s current exploration program of the Dragon Mine began, approximately $6.6 million has been expended on exploration-related activities. We expect our exploration costs for both the fiscal years ended December 31, 2012 and December 31, 2013 to approximate the exploration costs incurred during the fiscal year ended December 31, 2011. At this moment we are unable to identify the total costs that will be incurred to complete the exploration of the 230-acre Dragon Mine property.
We believe the physical plant and equipment utilized at the Dragon Mine are satisfactory condition to continue our current mining activity. The Company continually reviews the adequacy of its physical plant and equipment inventory and expects to invest accordingly to ensure that the size and quality of its physical plant and equipment can meet its needs. Currently, our physical plant includes, but is not limited to, a processing mill, a dry house, a site office, a general storage facility, an equipment repair facility, and a structure housing three IR compressors, which are used to power the mill and certain drilling equipment used underground. Our mining equipment includes, but is not limited to, a road header, an underground drill, a Scooptrams, a skid steer, a front-end loader and a number of other pieces traditionally used to mine underground. There are some pieces of equipment we choose to rent on a daily basis rather than own or lease to own. The Company uses diesel fuel as it primary source of power and has water transported to the property from an external source. The property has sufficient access roads to enable the transportation of materials and products
ATLAS MINE
The Company owns a 100% interest in the Atlas Mine, which consists of approximately 900 acres of fee simple property and patented mining claims, and 260 acres of mineral rights and unpatented claims, located in the Coeur d'Alene mining district in Shoshone County, Idaho, commonly referred to as the Silver Valley of North Idaho. The property is divided in to the following five tracts: Atlas Mine, Sierra Trapper Creek, Aulbach – Section 6 & 7, Sierra Silver, Woodland Park and 9 Mi., Sierra Hardscrabble, and L&M Claims. We pay approximately $1,300 to keep certain claims related to these properties active. The Company was originally incorporated to pursue silver mining activities on the Atlas mine property. The property has been idle since the early 1980’s. At the present moment, we do not consider this property material and have classified it as an asset held-for-sale. We are exploring ways in which to monetize this property. Currently, the property is without known reserves.
SAMPLING
From our drilling activity at the Dragon Mine, we have sampled certain cores by engaging a leading UK-based geological consulting organization to identify the chemical composition of our mineral and classify its purity levels, the results of which are used, in part, to map our property. All quality control and quality assurance protocols utilized as part of our exploration program have been developed by this third-party organization. Analytical equipment used to classify the mineral mined at the mine includes, but is not limited to, a Scanning Electron Microscope (SEM), and XRD and XRF machines. Our consulting geologist, Dr. Ian Wilson, oversees our relationship with the firm that provides us these services.
5
PROCESSING
The Company has a dry-process facility at its Dragon Mine property with which it is able to process the material from the underground areas of the Dragon Mine. Additionally, the Company has a tolling agreement with KaMin Performance Minerals, LLC, utilizing a wet process technology, to process both underground material and the material from the waste piles. The dry-process facility at the Dragon Mine includes, but is not limited to, a KDS Micronex, an air-powered jet mill, a dust capture system and a bagging system. The Company is exploring the possibility of building an expanded, advanced production facility in proximity to the Dragon Mine property that will be equipped to process both clay material and iron ore.
PRODUCTS AND SALES
There are three types of clay that can be extracted from the Dragon Mine, halloysite, kaolinite, and illite-smectite. Halloysite is a high value clay whose uses are discussed below. Kaolinite and illite-smectite are lower value clays, which the Company will use in products not requiring high concentrations of halloysite. The concentrations of the minerals vary at the Dragon Mine, with some areas containing relatively high concentrations of halloysite. The Dragon Mine also contains an iron our resource from which the Company has developed a product.
Halloysite-based products:
|
·
|
Dragonite–XR: An advanced reinforcing filler for polymers used at loadings of 20%-50% by weight and offering improved modulus, yield strength and HDT. This product grade offers advantages compared to other reinforcing fillers for polymers such as glass fiber, mica, wollastonite or talc. These include rentention of impact resistance, elongation to break, control over CTE and warpage, and lack of abrasiveness. Flame retardance up to V0 level is also possible when Dragonite-XR is used alone or as a synergist.
|
|
·
|
Dragonite–HP: A high performance additive for engineered thermoplastics, used at loadings of just 1-3 weight %, offering improvements in mechanical performance and cycle time reduction. This product grade offers a drop-in solution for polymer applications needing mechanical improvements without the density penalty associated with traditional fillers. By using Dragonite-HP, customers can reduce their overall manufacturing and materials costs through cycle time improvements and thin-walling.
|
|
·
|
Dragonite–Pure White: Highest purity Dragonite™ product - meeting the strict specifications of the cosmetics industry.
|
Iron-based Product:
|
·
|
Dragonite–IO: High grade iron oxide product line from the Dragon Mine. Products include Goethite and Hematite grades for use in pigments and technical applications such as smoke suppression and remediation of arsenic and metal contamination.
|
COMMERCIAL APPLICATIONS OF HALLOYSITE
Halloysite is an aluminosilicate clay exhibiting a rare, naturally occurring hollow tubular structure. Halloysite tubes have a length in the range of 0.5 - 3.0 microns, an exterior diameter in the range of 50 - 70 nanometers and an internal diameter (lumen) in the range of 15 - 30 nanometers. The clay is non-toxic and natural, demonstrating high biocompatibility without posing any risk to the environment. It is chemically identical to commonly used kaolin clay (Al2Si2O5(OH)4 x nH2O) with one layer of water molecules existing between layers of alumina and silica. Formation of halloysite occurs when kaolin sheets roll into tubes due to the strain caused by a lattice mismatch between the adjacent silicone dioxide and aluminum oxide layers. This is a process that occurs over millions of years under extremely rare geological conditions.
The results of research carried out by the Company, academic institutions, and other third parties have determined that the unique morphological and chemical characteristics of the Dragon Mine’s halloysite resource add functionality to applications such as, but not limited to, the controlled release of biological and chemical agents, polymer-related additives, fillers and fire retardants, paints and coatings, agricultural products, sorbents for environmental remediation, oil field drilling minerals, catalysts, filtration technologies, hydrogen storage for fuel cells and cosmetics.
To our knowledge, the only other large-scale commercial source of halloysite clay is located in New Zealand. The New Zealand property, which is owned by Imerys, (Euronext: NK), has been historically focused on supplying its halloysite clay to the porcelain, fine china and other commodity-like markets. Our primary focus, however, is centered on marketing the Dragon Mine’s halloysite clay to certain advanced application markets to which the material’s unique morphological and chemical characteristics provides enhanced functionality, contributing to the development of a number of high-performance products within an range of industries. At the time of this report, we have sold our Dragon Mine clay to two customers who plan to utilize it in plastic applications. Additionally, we are at different stages of the halloysite commercialization process with at least one hundred potential customers.
The Company currently markets its line of halloysite-based products under the Dragonite™ name. A description of certain application markets for which products have been developed, or will be developed, utilizing the Company’s Dragonite are provided below.
FUNCTIONAL FILLERS AND ADDITIVES FOR POLYMER COMPOSITES
High-performance functional fillers and additives are generally defined as particulates, whether spherical, platy, fibrous or tubular, which are introduced into a polymer matrix to enhance or create specific properties in an end product. Traditionally, fillers, such as talc, kaolin, silica and glass fibers have been loaded into polymer matrices to reduce costs by partially replacing more expensive resin. Functional fillers and additives are now used to improve mechanical properties such as impact strength, tensile strength, modulus, elongation at break and toughness, improve electrical properties such as conductivity and insulation, create flame retardancy (smoke suppression and char formation), improve polymer processing characteristics such as rheology, melt flow and viscosity, reduce weight and decrease permeability within plastics.
6
The factors driving the increased utilization of functional fillers and additives in plastics include, but are not limited to, the need for greater mechanical properties in high performance applications, the adoption of increasingly stringent environmental and safety legislation, the demand for lighter engineered plastic components, and the development of surface modifiers, allowing for the utilization of a wider array of materials as fillers and additives. According to Frost & Sullivan, the market for functional fillers and additives in 2008 was approximately $11.6 billion (approximately 15.7 million tons by volume), with mechanical property modifiers, electrical property modifiers and processing aids representing approximately 79.2%, 10.0% and 5.6% of the market, respectively. According to Frost & Sullivan, the market for functional fillers and additives in plastics is expected to grow to approximately $18.4 billion (20.1 million tons by volume) by 2015.
We currently produce and market Dragonite-XR ™ as our high performance, halloysite-based functional filler and Dragonite-HP ™ as our high performance, halloysite-based functional additive. Dragonite-XR is used at loading rates of 5.0% - 40.0% by weight while Dragonite-HP, in many applications, is utilized at loading rates of just 1.0% - 5.0% by weight. The unique tubular morphology, naturally exfoliated state and uniform surface charge of the Dragonite clay results in an even dispersion throughout the polymer matrix without the need for a costly surface modification required by other silicate fillers and additives. The complete dispersion of the Dragonite clay throughout the polymer matrix results in a significant enhancement in a number of mechanical properties of the polymer such as, but not limited to, increased stiffness, strength, and impact resistance (ability to resist fracturing under certain stresses), a reduction in uneven shrinkage and warpage, and improvement in fire retardant properties.
Plastic manufacturers are continuously looking to either (i) improve the mechanical properties of an engineered plastic component without sacrificing impact resistance or (ii) reduce the manufacturing costs and weight of an engineered plastic component by replacing a portion of the resin with a lower cost filler without sacrificing mechanical properties. Traditionally, when a manufacturer desires to increase the mechanical properties of a plastic component it must either use a higher cost resin or utilize a filler to obtain the desired mechanical improvements.
The utilization of a higher cost resin will reduce the profitability of the component and the use of a filler often degrades the impact resistance of the component. We have found that the utilization of Dragonite-HP at loadings of 1.0% - 2.0% by weight allows a manufacturer to both avoid the use of a more expensive resin while increasing mechanical properties, such as strength and modulus (a measure of elasticity), of an engineered plastic component without sacrificing impact resistance. When looking to reduce the cost and weight of a component through the partial replacement of resin with traditional fillers, a manufacturer must frequently accept a certain level of degradation of the mechanical properties of the component to achieve such cost savings and weight reduction. We have found the utilization of Dragonite-HP at loadings of 1.0% - 2.0% by weight enables a manufacturer to reduce both the resin-related cost and weight of a plastic component without have to accept a decline in mechanical properties. We have also found that Dragonite-XR, at relatively high loading rates by weight, not only improves certain mechanical properties without impairing impact resistance but also adds fire retardant characteristics to the polymer.
In addition to providing mechanical property improvements, we have also found that the utilization of Dragonite-HP contributes to the reduction of the manufacturing cycle time of a number of resin-based components by 20.0% - 27.0%. Cycle time represents the amount of time it takes to manufacture a single engineered plastic component. A reduction in cycle time, depending on the degree, can produce significant cost savings for a manufacturer. Dragonite produces a nucleating effect within a polymer matrix, which shortens the time it takes for a part to solidify within a mold, resulting in a shorter manufacturing cycle time. To our knowledge, Dragonite-HP is only one of two additives on the market that can nucleate high-density polyethylene. We have filed a provisional patent with respect to this technology.
We are currently marketing the benefits of Dragonite-XR and Dragonite-HP to the mechanical property modifier and processability modifier segments of the high performance filler market. According to Frost & Sullivan, in 2008 the market for mechanical property modifiers was approximately $9.2 billion (13.7 million tons by volume) with carbon black representing approximately 80% of the market by value (approximately 68.0% by volume), precipitated silica, silica fume, and fumed silica representing approximately 14.3% of the market by value (approximately 13.0% by volume) and calcium carbonate representing 1.8% of the market by value (approximately 4.0% by volume).
According to Frost & Sullivan, carbon black dominates the tire reinforcement market, precipitated silica is increasingly being used as a “green” reinforcement filler in tires, silica fume is used as a reinforcement for cement and certain plastics, fumed silica is used to reinforce rubber and calcium carbonate is used primarily to strengthen PVC. Except for carbon black as a tire filler, our research shows that Dragonite outperforms these other fillers under a number of scenarios and, as such, is presented with sizeable market opportunities both in terms of values and volumes. For example, at the time of this report, two customers of ours are utilizing our Dragonite-HP additive in high-density polyethylene applications to obtain mechanical property improvements. The annual global demand for high-density polyethylene is approximately 100 million pounds, which presents an attractive market opportunity for us even if we penetrate a relatively small portion of the market.
FIRE RETARDANTS FILLERS
According to Industrial Minerals Magazine, the world market for flame retardant additives for polymers is approximately 1.65 million tons, with a value of over $2.8 billion. Mineral-based flame retardants, such as Dragonite-XR, represent 50% of the market by volume and 35% by value. UL 94 is a plastics flammability standard released by Underwriters Laboratories of the USA. The standard classifies plastics according to how they burn in various orientations and thicknesses. For plastic composites the highest rating that can be achieved, with respect to the applications into which Dragonite-XR is being marketed, is V0.
The results of research and development activities carried out by the Company and certain potential commercial customers has demonstrated that the introduction of Dragonite-XR into polymer matrices at loadings between 30% and 50% by weight produces a V0 flame retardant rating for the composite. Additionally, unlike other mineral-based flame retardants, the Dragonite-XR increases the mechanical properties and retains the impact resistance of the plastic into which it is loaded. We have found that the structural water bound to Dragonite-XR, when liberated at 400° C, most likely contributes to the flame retardant capability of the filler. Dragonite-HP has been shown to act as an effective char forming additive that can be used in conjunction with other mineral-based flame retardant to improve both mechanical properties and the flame retardancy of a plastic composite. As the demand for mineral-based flame retardants, such as aluminum trihydrate, magnesium hydroxide and hydromagnesite, continue to grow due to the effects of the ban of the use of halogenated flame retardants, we expect Dragonite-XR to be attractively positioned to compete with these alternative flame retardant fillers.
7
CONTROLLED RELEASE CARRIER
The results of research and development activities carried out by the Company, certain potential commercial customers, and a number of academic institutions have demonstrated that the tubular nature of the Dragonite clay can act as an effective carrier of active ingredients, enabling an agent to be released from the carrier over an extended time frame. This controlled release capability can be utilized in a wide array of applications including, but not limited to, anti-corrosive and anti-mold paint applications, agricultural applications, cosmetics, and certain pharmaceutical products, which would require the prevention of overdosing.
The release rates of the agent from the Dragonite can be controlled through the selection of tube diameter and length and the type of encapsulation method utilized. The controlled-release capability provided by the Dragonite reduces the amount of active agent needed to achieve desired results, translating into significant cost savings and environmental protection. The Company is a co-exclusive licensee of the Naval Research Lab’s patented halloysite-based, controlled-release technology for certain applications. We are currently working with a number of partners to commercialize certain applications utilizing the patented controlled-release technology.
According to BCC Research, the market for materials used as carriers for controlled release applications is expected to grow to approximately $1.0 billion by 2015.
ENVIRONMENTAL REMEDIATION
Dragonite, due to its high selectivity of toxic compounds, high porosity, high surface area, fine particle size, fast adsorption rate and high absorption capacity, acts as an effective sorbent in environmental remediation and emissions capture. According to the results of research and development activities carried out by the Company and certain academic institutions, Dragonite can be utilized to facilitate the remediation of environments polluted with oil, PCB’s, toluene, phenols, methylene blue, chromium-6, ammonium, heavy and alkali metals, and uranium.
In a deepwater environment, Dragonite performs as an effective sieve to sequester pollutants released from a variety of sources such as oil spills, power plant and mine site run-off. Once captured in the clay, the pollutant is immobilized in a solid form, which can be collected and disposed of in an environmentally friendly manner. Dragonite works as a hydrocarbon remediation material through its ability to adsorb, de-emulsify and disperse micro-droplets of oil, which then float in the upper water column of the deep-sea environment. The outer silica surface of Dragonite rapidly enhances the growth of bacteria necessary, which is necessary for hydrocarbon degradation.
According to research conducted by the Company and certain academic institutions, Dragonite is able to adsorb between 85% and 245% of its weight in oil. Data indicates that upon colonization of bacteria within the Dragonite clay, 98% of the adsorbed hydrocarbon naturally degrades within 7 days, eliminating the need to retrieve the sequestered oil. In a marshland environment, Dragonite adsorbs the oil via capillary “wicking” and prevents penetration to the subsurface. Because Dragonite does not need to be recovered once the oil is adsorbed, disruption of the marsh wildlife is avoided.
In June 2011 the Company announced that it had entered into a Cooperative Research and Development Agreement with the U.S. Environmental Protection Agency’s National Risk Management Research Laboratory to pursue the development of its Dragonite Halloysite Clay sorbent technology used for the bio-remediation of oil from contaminated salt marsh and wetland environments.
AGRICULTURE
Dragonite provides a natural, environmentally friendly solution for a more direct and efficient delivery method of often-toxic agricultural agents. Utilizing the inner lumen of the clay as a natural reservoir, Dragonite is able to load, store, and control the release of a range of agents in a uniform manner, which, in turn, allows a lower loading of a substance, such as pesticide or herbicide, to be as effective as a higher loading delivered in a more traditional manner. Dragonite release rates can be controlled to match the duration of a growth or reproductive cycle, resulting in a reduction of the frequency of applications of an agent. The ability to both utilize lower loadings of toxic agents and reduce the frequency of their application will lead to an improvement in the safety of applying such agricultural agents and prevent of harmful run-off which results from traditional agricultural spraying.
CATALYSTS & MOLECULAR SIEVES
Dragonite works as an excellent binder to zeolite crystals to enhance a molecular sieve’s productivity in critical functions such as drying of natural gas and air, separation of liquid from product streams, and separation of impurities from a gas stream. Dragonite possesses a superb dispersion ability that allows it to combine with the zeolite crystals without attracting to them or reducing the rate of diffusion of liquids and gases. Dragonite’s fine particle size, porosity, and thermal stability also ensure that adsorbates diffuse rapidly through the sieve without affecting the adsorbent blend’s physical properties.
Dragonite is proven to be an effective catalyst and catalyst support for the hydrotreatment and hydrodemetalation of hydrocarbonaceous feedstocks. The clay’s unique tubular morphology, pore size, thermal stability, and high surface area create a perfect recipe for removing impurities such as metals, sulfur, nitrogen, and asphaltenes. Halloysite from the Dragon Mine was previously dedicated strictly to this application, successfully supplying the market over 1.1 million tons of material. Certain results of our drilling program demonstrate that we can produce commercial quantities of clay from the Dragon Mine that meet the purity requirements of catalyst applications. According to the U.S. Geological Service’s 2008 Minerals Yearbook, approximately 337,000 tons of various clays were used in catalyst applications.
8
COSMETICS
Dragonite’s tubular morphology is uniquely suited for an array of cosmetic applications. Dragonite has been shown to be capable of functioning as a non-irritating carrier and release mechanism of cosmetic ingredients for a long lasting application. Additionally, the adsorptive nature of the Dragonite clay serves as an effective hypoallergenic skin cleanser capable of removing unwanted toxins and oils from the skin without the need for harsh chemicals. Dragonite is also capable of exfoliating the skin. We are currently assessing commercial opportunities for the unique cosmetic-related characteristics of Dragonite within the skincare segment of the cosmetic industry.
RESEARCH & DEVELOPMENT
The Company’s research and developments efforts, accounted for as exploration expense, are focused on the continued creation of commercial applications based on the unique morphological and chemical characteristics of the Dragon Mine’s halloysite resource. We have engaged a number of highly regarded consultants who have expertise in controlled release technologies, advanced material development, and polymer engineering.
In 2008, we engaged Ian Wilson, Ph.D. as our consulting geologist. Dr. Wilson has supervised our drilling program and has played a critical role in classifying the mineralization of the Dragon Mine property, which is essential to the successful commercialization of the mine’s deposit. Dr. Wilson is a member of iom3 (Institute of Materials, Minerals and Mining of the UK). His Ph.D. was carried out on wall rock alteration and trace element dispersion patterns around gold and tin ore bodies in Ashanti Gold Mine, Ghana and Geevor Tin Mine, Cornwall, respectively. From 1974 to 2001 he worked with English China Clays/Imerys mainly as a geologist and with management roles in Brazil, Spain, Sweden and China. Since his retirement in 2001, he has worked as an independent consultant dealing with many industrial minerals including halloysite.
Since 2008, we have utilized the services of Steve Hillier, Ph.D. of the James Hutton Institute (Scotland, UK) (formerly known as Macaulay Institute) to analyze the mineralogical characteristics of the Dragon Mine deposit. Dr. Hillier works closely with Dr. Wilson to characterize our property. Dr. Hillier has a Ph.D. from Southampton University (UK) and his research interests revolve around a mixture of clay, soil and environmental mineralogy. Dr. Hillier is considered a leading expert in his field of research.
In 2009, we entered into a development agreement with Yuri M. Lvov, Ph.D., a professor of chemistry at Louisiana Tech University and the T.C. Pipes Eminent Endowed Chair on Micro and Nanosystems at the Institute for Micromanufacturing (Louisiana Tech University). The scope of the agreement includes, among other things, the development of the Dragon Mine halloysite as part of an anti-corrosion paint application in addition to the development of other emerging applications.
In 2009, we entered into an agreement with Transmit Technology Group, LLC (“TTG”) of Austin, TX to act as our research and development facility focused primarily on polymer composite applications. TTG provides contract research and development, testing, technical marketing and consulting services to domestics and international plastic resin producers, compounders, and converters. Amit Dharia, Ph.D., is President of TTG. Dr. Dharia has over 23 years of experience in the plastics industry focused primarily on R&D and new product development. Dr. Dharia is advising us with regard to its pursuit of opportunities within the polymer composite market. Dr. Dharia is also acting as an agent with respect to the sale of Dragonite into customer applications, which he plays a role in developing.
In May 2010, we entered into a consulting agreement with Yash Khanna of Innoplast Solutions. Dr. Khanna has over 34 years of highly diversified experience within the plastics industry focused primarily on new product development and marketing. Dr. Khanna is consulting us on the development, commercialization and marketing of polymer-based applications that utilize our halloysite clay to enhance performance. Dr. Khanna is also acting as an agent with respect to the sale of Dragonite into customer applications, which he plays a role in developing.
In October 2010, we entered into an agreement with KibbeChem, Inc. in which KibbeChem agreed to act as the Company’s partner to toll pelletize a new range of high performance Dragonite™ branded halloysite clay products developed specifically for the polyolefin and elastomer markets. These solution-driven products contain a grade of our Dragonite to be used as a multi-functional additive designed to provide a meaningful improvement in properties at loadings of just 1 to 3%.
In February 2011, we hired Chris DeArmitt, Ph.D. as our Chief Technology Officer. Dr. DeArmitt is a globally recognized expert in plastics, functional fillers and additives. His experience spans all facets of the value chain, having served in senior level positions in areas including R&D, product development, and marketing during his tenures at Electrolux (OEM), BASF (plastics & additives manufacturer) and Hybrid Plastics (specialty additives producer). Dr. DeArmitt worked with the Company as a technical advisor for seven months before being named Chief Technology Officer.
GOVERNMENTAL REGULATION
DRAGON MINE
The Utah Department of Natural Resources sets the guidelines for exploration and other mineral related activities based on provisions of the Mined Land Reclamation Act, Title 40-8, Utah Code Annotated 1953, as amended, and the General Rules and Rules of Practice and Procedures, R647-1 through R647-5. We have received a large mine permit from the department.
We carry a Mine Safety and Health Administration (MSHA) license (#4202383) for this property and report as required to this agency.
The Company is subject to extensive regulation by the Mine Safety and Health Administration, which was created by the Mine Safety and Health Act of 1977. The regulations generally are designed to assure the health and safety of miners and our mine is periodically inspected by MSHA inspectors .
9
The clays that the Company mines, including halloysite, contains crystalline silica when mined. Crystalline silica is considered a hazardous substance under regulations promulgated by the U.S. Occupational Health and Safety Administration (OSHA) and U.S. Mine Health and Safety Administration (MSHA) and as a result is subject to permissible exposure limits (PELs), both in the mine and at the workplaces of our customers. The Company is required to provide Material Saftey Data Sheets (MSDS) at the mine and accompanying sales of products to customers. The Company must also apply hazard warning to labels of containers of the product sold to customers. Kaolin and halloysite are also subject to PELs.
EPA has stated that it is developing a test rule under the Toxic Substances Control Act (TSCA) to require manufacturers (which would include the Company) of certain nanoscale materials including kaolin, halloysite, and alumina (which is present in the clays mined by the company) to conduct testing for health effects, ecological effects, and environmental fate, as well as provide material characterization data. The impact of such a rule on the Company cannot be determined at this time. It seems clear, however, that if the results of the testing of particular nanomaterials indicate adverse health, ecological, or environmental effects, the EPA may seek to regulate those nanomaterials more extensively. Such regulation could include, among other things, limiting the uses of the nanoscale materials; requiring the use of personal protective equipment, such as impervious gloves and NIOSH approved respirators, and limiting environmental releases. The EPA is developing a SNUR for nanoscale materials under TSCA.
EMPLOYEES
As of December 31, 2011, Applied Minerals, Inc. and its subsidiary had 17 employees. None of our employees were covered by a collective bargaining agreement, we have never experienced a work stoppage, and we considered our labor relations to be excellent.
ITEM 1A. RISK FACTORS
RISK FACTORS
AN INVESTMENT IN OUR SECURITIES IS VERY SPECULATIVE AND INVOLVES A HIGH DEGREE OF RISK. YOU SHOULD CAREFULLY CONSIDER THE FOLLOWING RISK FACTORS, ALONG WITH THE OTHER MATTERS REFERRED TO IN THIS ANNUAL REPORT, BEFORE YOU DECIDE TO BUY OUR SECURITIES. IF YOU DECIDE TO BUY OUR SECURITIES, YOU SHOULD BE ABLE TO AFFORD A COMPLETE LOSS OF YOUR INVESTMENT.
At December 31, 2011 and 2010, the Company had accumulated deficits of $39,183,632 and $31,543,411, respectively, in addition to limited cash and unprofitable operations. For the year ended December 31, 2011 and 2010, the Company sustained net losses before discontinued operations of $7,476,864 and $4,891,525, respectively. As of the date of filing this report, the Company has not commercialized the Dragon Mine and has had to rely on cash flow generated from the sale of stock and convertibe debt to fund its operations. If the Company is unable to fund its operations through the commercialization of the Dragon Mine, the sale of equity and/or debt or a combination of both, it may have to file bankruptcy. There is no assurance that we will be able to commercialize the Dragon Mine or if necessary raise money through the sale of debt or equity
NO SIGNIFICANT REVENUE HAS BEEN GENERATED FROM THE SALE OF HALLOYSITE CLAY
The Company has yet to generate any significant revenue from the sale of its Dragonite halloysite clay products. One cannot assume that any significant revenue will be generated from the sale of halloysite clay in 2012 or beyond.
WE HAVE EXPERIENCED CONTINUED, ANNUAL OPERATING LOSSES SINCE SEPTEMBER 1997.
We have experienced annual operating losses since our reactivation in September 1997. As of December 31, 2011, we had an accumulated deficit of $39,026,047. We cannot assure that products can be successfully marketed to an extent that we will ever achieve significant revenues or profit margins.
WE CAN PROVIDE NO ASSURANCE THAT OUR PRODUCTS WILL BE SUCCESSFULLY COMMERCIALIZED
The development or modification of a product that utilizes our Dragonite halloysite frequently requires a manufacturer to expend resources to modify certain aspects of its manufacturing processes. We can provide no assurance that potential customers will be willing to expend the resources necessary to commercialize products utilizing Dragonite.
THE COMPANY’S SUCCESS DEPENDS LARGELY ON THE COMMITTED SERVICE AND AVAILABILITY OF KEY PERSONNEL
In January 2009, Material Advisors, LLC was engaged to assume the managerial responsibilities of Applied Minerals, Inc. Also in January 2009, Andre Zeitoun, the majority partner of Material Advisors, LLC, assumed the role of President and CEO of Applied Minerals, Inc. Mr. Zeitoun has played a critical role in leading the effort to commercialize the Company’s Dragon Mine property. If the Company loses the service of Mr. Zeitoun, there is no assurance that the Company would be able to attract and retain a qualified replacement.
THERE ARE NO ASSURANCES THAT OUR HALLOYSITE PRODUCTS WILL GAIN ADEQUATE COMMERCIAL ACCEPTANCE
We have spent, and will continue to spend, considerable resources on the development of halloysite-based products for a number of applications, which, we believe, would benefit from the utilization of our halloysite clay. Despite the advantages we believe our products provide, there are no assurances that the manufacturers of the applications, to which we are marketing our products, will move to incorporate our halloysite clay into their respective applications. If this does not happen, our ability to achieve significant revenue and profit margins may be impaired.
10
THE COMPANY’S SUCCESS DEPENDS, IN PART, ON ITS ABILITY TO MAINTAIN RELATIONSHIPS WITH CONSULTANTS WHO ASSIST US WITH THE RESEARCH AND DEVELOPMENT OF OUR PRODUCTS.
We currently engage a number of consultants who have assisted us with the research and development of our products. We engage one consultant, in particular, who provides us with access to laboratory facilities through which we much of our product testing is conducted. If we are unable to continue to identify and maintain relationship with consultants who are familiar with halloysite and have expertise in the application areas for which we plan to develop products, our ability to successfully commercialize the Dragon Mine property will be impaired.
MATERIAL WEAKNESS OF INTERNAL CONTROL
As of December 31, 2011 the following material weaknesses in our internal controls over financial reporting were identified: (i) certain controls over equity were not effective to ensure that all transactions involving equity were recorded in an accurate and timely fashion; (ii) certain controls were not effective to ensure that all expenses were accurately categorized; (iii) the Company did not have adequate control over the recording and monitoring of purchase orders and accounts receivables; and (iv) the Company, given its relatively small size, did not have sufficient segregation of duties over a variety of financial processes. If these weaknesses are not remedied, our ability to avoid a material loss may be impaired.
THERE IS COMPREHENSIVE FEDERAL, STATE AND LOCAL REGULATION OF THE EXPLORATION INDUSTRY THAT COULD HAVE A NEGATIVE IMPACT OUR MINING OPERATIONS.
Exploration and mining operations are subject to federal, state and local laws relating to the protection of the environment, including laws regulating removal of natural resources from the ground and the discharge of materials into the environment. Exploration and mining operations and some of the products we sell are also subject to federal, state and local laws and regulations which seek to maintain health and safety standards by regulating the design and use of exploration methods and equipment. We cannot assure you that such permits will be received. No assurance can be given that environmental standards imposed by federal, state or local authorities will not be changed or that any such changes would not have material adverse effects on our activities. Moreover, compliance with such laws may cause substantial delays or require capital outlays in excess of those anticipated, thus causing an adverse effect on our financial position. Additionally, we may be subject to liability for pollution or other environmental damages that we may elect not to insure against due to prohibitive premium costs and other reasons. Management is aware of the necessity of obtaining proper permits prior to conducting any exploration activity.
FAIR MARKET VALUE
We have recorded our properties and equipment held for sale at what we believe to be fair market value. We are actively seeking to sell such properties and equipment. There can be no assurance we can sell such properties and equipment at the value recorded, if at all.
ITEM 1B. UNRESOLVED STAFF COMMENTS
None.
ITEM 2. PROPERTIES
PRINCIPAL OFFICE
As of the date of this filing, the primary corporate office was located at 110 Greene Street, Suite 1101, New York, N.Y., 10012. We also rent office space at 630 East Mullan Avenue #D, Osburn, Idaho 83849.
MINING PROPERTIES
We have assets of real property, mineral leases and options. The following section describes our right, title, or claim to our properties and each property's location. This section also discusses our present plans for exploration of the properties.
JUAB COUNTY, UTAH
Dragon Mine
The Dragon Mine property, located in Juab County, Utah near the City of Eureka (Tintic Mining District), has been principally exploited for halloysite clay. It is located approximately 2 miles southwest of Eureka, Utah and can be accessed via state highway and county road. The Union Pacific Railroad has a spur approximately 2 miles from the property. Electrical power is located approximately 1.5 miles from the site and there was no evidence of a water source on the property except in the mine shaft.
The property consists of 38 patented mining claims, approximately 230 acres, located in the following sections: T10S, R2W, sections 29, 30, 31, and T10S, R3W, Section 36, all relative to the Salt Lake Meridian. We leased the property in 2001 and on August 18, 2005, we purchased the property for approximately $500,000 in cash.
11
It is known that within five kilometers of the Dragon Mine, exploration is being carried out by at least one major mining company to determine the possibility of the existence of a large copper-gold porphyry. We offer the following cautionary statements. Whether such a porphyry exists, the location of such a porphyry, whether any deposits related to any such porphyry are located on our property and whether any such deposits would be of commercial grade or could be economically extracted is not known. If there is a porphyry, it is likely to be located at least 1000 feet under the surface and could be accessed only through a large open pit mine (so that we could not access it on our property by means of an open pit mine confined to our property). It is estimated that if there is a commercial grade mineralization that could be economically extracted, a large mining company would have to acquire sufficient land for a large open pit mine, expend billions in preparation for mining and it is estimated that it would be at least 15 or 20 years before mining could begin.
Testing of surface rock samples in the vicinity of the Dragon Mine carried out in the past show anomalous copper values with gold values exceeding one ounce per ton and silver values of approximately five ounces per ton. Records indicate that, during the 1870’s, mining activity at the Dragon Mine had been focused on the iron ore presence at the mine. According to certain records kept by the U.S. Bureau of Mines, the 305,000 tons of iron ore mined during the 1870’s produced 18,000 ounces of gold and 928,000 ounces of silver. In connection with our mining of iron ore at the Dragon Mine and in connection with drilling in connection with a resource statement concerning the iron ore, we have tested for the presence of commercial amounts of copper, gold and silver and we have not found any. We will continue testing and if commercial amounts are located, we will consider the appropriate alternatives.
Certain geological research indicates that the existence of certain clays, such as the ones found at the Dragon Mine, is one of a number of possible indicators of the possible presence of an underground, copper-gold porphyry. We are currently evaluating the feasibility of exploring for a potential copper-gold deposit at the Dragon Mine. If we decide to pursue such exploration activities, we can provide no assurance that our exploration activities will be successful.
PROPERTIES HELD FOR SALE
Shoshone County, ID
We own approximately 900 acres of fee simple property and patented mining claims, and 260 acres of mineral rights and unpatented claims, including the Atlas Mine, located in the Coeur d'Alene mining district in Shoshone County, Idaho, commonly referred to as the Silver Valley of North Idaho. At December 31, 2011, this property was classified as held for sale. We are actively seeking to sell our properties in Idaho, however, we cannot provide any assurances that we will be able to do so.
ITEM 3. LEGAL PROCEEDINGS
In accordance with SFAS No. 5, Accounting for Contingencies, when applicable, we record accruals for contingencies when it is probable that a liability will be incurred and the amount of loss can be reasonably estimated. In addition to the matters described herein, we are involved in or subject to, or may become involved in or subject to, routine litigation, claims, disputes, proceedings and investigations in the ordinary course of business, which in our opinion will not have a material adverse effect on our financial condition, cash flows or results of operations. Currently, we have no lawsuits, claims, proceedings and investigations pending involving us.
ITEM 4. MINE SAFETY DISCLOSURES
The information concerning mine safety violations or other regulatory matters required by Section 1503(a) of the Dodd-Frank Wall Street Reform and Consumer Protection Act and this Item is included in exhibit 95 to this 10-K.
PART II
|
ITEM 5.
|
MARKET PRICE FOR THE REGISTRANT’S COMMON EQUITY, RELATED STOCKHOLDERS MATTERS AND ISSUER PURCHASES OF EQUITY SECURITIES
|
Market Prices for Our Common Stock
Our common stock is quoted on the OTCBB under the symbol “AMNL.” The following quotations reflect inter-dealer prices, without retail mark-up, mark-down, or commission, and may not represent actual transactions.
|
Year 2011
|
Year 2010
|
|||||||
|
High
|
Low
|
High
|
Low
|
|||||
|
First Quarter
|
$ 0.83
|
$ 0.71
|
$ 0.93
|
$ 0.59
|
||||
|
Second Quarter
|
$ 1.78
|
$ 0.82
|
$ 1.08
|
$ 0.71
|
||||
|
Third Quarter
|
$ 2.10
|
$ 1.30
|
$ 1.06
|
$ 0.75
|
||||
|
Fourth Quarter
|
$ 1.70
|
$ 1.07
|
$ 0.87
|
$ 0.62
|
||||
Record Holders
As of December 31, 2011, there were approximately 1,535 holders of record of our common stock. This number does not include an indeterminate number of shareholders whose shares are held by brokers in street name.
12
Dividends
Since we became a reporting company in 1999, we have never declared or paid any cash dividend on our common stock. We are not subject to any restrictions or limitations relating to the declaration or payment of dividends other than those imposed by state corporate laws applicable to corporations generally.
Equity Compensation Plans
In June 2008, as compensation for his work as Chief Executive Officer, Michael Lyon was granted 50,000 options to purchase common stock with an exercise price of $0.65 per share and a term of 5 years. The options vest monthly over a 12-month period beginning June 2008.
In August 2008, as compensation for his work as Chief Executive Officer, Michael Lyon was granted 25,000 options to purchase common stock with an exercise price of $0.71 per share and a term of 5 years. The options vest monthly over a 12-month period beginning August 2008.
In October 2008, Mr. Morris D. Weiss, a former director, was named the Company’s Chief Restructuring Officer for a period of six months and, as part of his agreement with us, was granted 550,000 options to purchase common stock with an exercise price of $0.70 per share and a term of 10 years. 250,000 of these options vested upon the appointment of Mr. Weiss as Chief Restructuring Officer and the remaining 300,000 options vested at the conclusion of his term as Chief Restructuring Officer. In May 2009, Mr. Weiss was granted an additional 100,000 options an exercise price of $0.70 per share and a term of 10 years for work related to a class action settlement. As of the date of this report, the 100,000 have fully vested.
In December 2008, the Company entered into a Management Agreement with Material Advisors LLC, a management services company. The agreement granted Material Advisors, LLC 6,583,277 options to purchase common stock at $0.70 per share with a ten-year term. The options vest equally over 36 months starting on the effective date of the Management Agreement. A copy of the Management Agreement was filed as an 8-K on January 7, 2009.
In April 2009, as compensation per the terms of a consulting agreement, Rubenstein Investor Relations was granted 100,000 options to purchase common stock that have an exercise price of $0.35 and a term of five years. The options have vested.
In October 2009, as compensation related to his election as Chairman of the Board of Directors, John Levy was granted 125,000 options to purchase common stock that have an exercise price of $0.70 per share and a term of five years. The options have vested.
In October 2009, as compensation for acting as agent related to a financing, Rodman & Renshaw, LLC was granted 160,000 warrants to purchase common stock with an exercise price of $1.00 per share and a term of five years. The warrants have vested.
In February 2010, as compensation related to his position as Chief Technical Officer, Chris DeArmitt was granted 213,402 warrants to purchase common stock that have an exercise price of $0.78 per share and a term of five years. The warrants have vested.
In March 2010, as compensation related to his position as Chairman of the Board of Directors, John Levy was granted 60,000 options to purchase common stock that have an exercise price of $1.00 per share and a term of five years. The options have vested.
In October 2010, as compensation fro acting as agent related to a financing, Tejas Securities, Inc. was granted 180,000 warrants to purchase common stock that have an exercise price of $1.00 per share and a term of five years. The warrants have vested.
In October 2010, as part of work provided per the terms of consulting agreement related to the marketing of certain non-core assets, the Company granted Victor Lazarovici 139,340 warrants to purchase common stock that have an exercise price of $0.75. The warrants have vested.
In February 2011, as part of the extension of its Management Agreement with the Company, Material Advisors, LLC was granted 2,904,653 options to purchase common stock that have an exercise price of $0.83 per share and a term of 10 years. The options have vested.
In January 2011, as part of work provided per the terms of consulting agreement related to the marketing of certain non-core assets, the Company granted Victor Lazarovici 124,481 warrants to purchase common stock that have an exercise price of $0.80. The warrants have vested.
In February 2011, as compensation related to his position as Chairman of the Board of Directors, John Levy was granted 100,000 options to purchase common stock that have an exercise price of $0.83 per share and a term of five years. The options have vested.
In February 2011, as compensation related to his position as work performed as Chairman of the Executive Committee, Evan Stone was granted 200,481 options that have an exercise price of $0.83 per share and a term of five years. The options have vested.
In April 2011, as part of an engagement of Dahlman Rose & Co. as its financial advisors, granted it 461,340 options to purchase common stock with an exercise price of $1.15 per share and a term of ten years. The options have vested.
In August 2011, the Company issued to Chris DeArmitt, it Chief Technology Officer, 54,367 warrants to purchase common stock that have an exercise price of $2.00 per share and a term of five years. The options were granted in lieu of a portion of cash salary Mr. DeArmitt was due per the terms of his employment agreement. The options have vested.
In August 2011, as compensation related to his position as General Counsel of the Company, William Gleeson was granted 900,000 options to purchase common stock that have an exercise price of $1.90 per share and a term of ten years. The options vest equally over a thirty-sixth month period beginning August 2011.
13
|
Equity Compensation Information
|
||||
|
As of December 31, 2011
|
||||
|
Number of securities to be issued upon exercise of outstanding options, warrants, and rights
|
Weighted-average exercise price of outstanding options, warrants and rights
|
Number of securities remaining available for future issuance under equity compensation plans (excluding securities reflected in column (a))
|
||
|
(a)
|
(b)
|
(c)
|
||
|
Equity compensation plans approved by security holders
|
- 0 -
|
- 0 -
|
-0-
|
|
|
Equity compensation plans
|
||||
|
not approved by security holders
|
13,021,341
|
$0.85
|
-0-
|
|
|
Total
|
13,021,341
|
$0.85
|
||
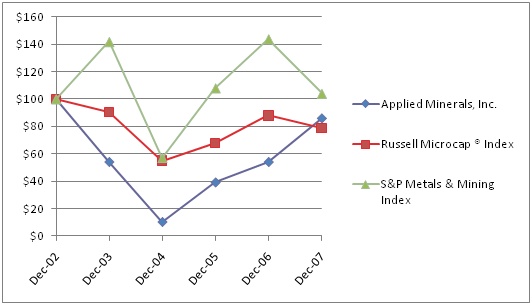
COMPARISON OF 5-YEAR CUMULATIVE TOTAL RETURN*
AMONG APPLIED MINERALS, INC.
|
Dec-06
|
Dec-07
|
Dec-08
|
Dec-09
|
Dec-10
|
Dec-11
|
|
|
Applied Minerals, Inc.
|
$100
|
$54
|
$10
|
$39
|
$54
|
$86
|
|
Russell Microcap ® Index
|
$100
|
$91
|
$55
|
$68
|
$88
|
$79
|
|
S&P Metals & Mining Index
|
$100
|
$142
|
$57
|
$108
|
$144
|
$104
|
* Cumulative return assumes a $100 investment of each respective security at December 31, 2006
14
|
ITEM 6.
|
SELECTED FINANCIAL DATA
|
|
Year Ended December 31 (in 000’s except per share data)
|
2011
|
2010
|
2009
|
2008
|
2007
|
|
Revenue
|
$92.0
|
$0
|
$0
|
$0
|
$0
|
|
Income (loss) from continuing operations
|
$(7,529.2)
|
$(4,891.5)
|
$(6,701.5)
|
$(6,215.7)
|
$(4,700.1)
|
|
Net income (loss)
|
$(7,534.9)
|
$(4,767,7)
|
$(6,766.2)
|
$(5,420.4)
|
$(1,681.7)
|
|
Income (loss) from continuing operations - basic
|
$(0.10)
|
$(0.07)
|
$(0.11)
|
$(0.11)
|
$(0.09)
|
|
Net income (loss) - basic
|
$(0.10)
|
$(0.07)
|
$(0.11)
|
$(0.10)
|
$(0.03)
|
|
Income (loss) from continuing operations - diluted
|
$(0.10)
|
$(0.07)
|
$(0.11)
|
$(0.11)
|
$(0.09)
|
|
Net income (loss) - diluted
|
$(0.10)
|
$(0.07)
|
$(0.11)
|
$(0.10)
|
$(0.03)
|
|
Cash and equivalents
|
$10,170.5
|
$1,642.3
|
$1,584.9
|
$903.0
|
$1,210.6
|
|
Total assets
|
$12,874.8
|
$4,215.1
|
$4,005.3
|
$4,506.1
|
$6,271.6
|
|
Long-term liabilities
|
$97.8
|
$5,055.0
|
$2,257.3
|
$1,357.9
|
$705.9
|
|
Shareholders’ equity (deficit)
|
$8,828.4
|
$(1,561.3)
|
$310.6
|
$2,197.0
|
$4,517.0
|
|
ITEM 7.
|
MANAGEMENT’S DISCUSSION AND ANALYSIS OF FINANCIAL
|
CONDITION AND RESULTS OF OPERATIONS
OVERVIEW
Applied Minerals, Inc. is a leading global producer of halloysite clay used in the development of advanced polymer, catalytic, environmental remediation, and controlled release applications. The Company operates the Dragon Mine located in Juab County, Utah, the only commercial source of halloysite clay in the western hemisphere. We believe that the only source of halloysite clay in the Western Hemisphere large enough, and of high enough purity, to supply commercial-sized application demand.
Since January 1, 2011 we have sold approximately $93,000 of halloysite clay to two companies that are using it in the production of a number polymer-based applications. We have three grades of halloysite products, the difference among them being the percentage of halloysite contained in each. We also differntiate our halloysite products based on color. At times we surface treat our product to achieve certain performance characteristics required by customers products. There are approximately 300 companies in various stages of testing halloysite clay products.
There have been no sales of iron ore. We intend to market the goethite and the hematite as iron ore pigments.
GCRITICAL ACCOUNTING POLICIES
The following accounting policies have been identified by management as policies critical to the Company’s financial reporting:
Use of Estimates
The preparation of financial statements in conformity with accounting principles generally accepted in the United States of America requires management to make estimates and assumptions that affect reported amounts of assets and liabilities, disclosure of contingent assets and liabilities at the date of the financial statements and revenues and expenses during the reporting period. In these financial statements assets and liabilities involve extensive reliance on management’s estimates. Actual results could differ from those estimates.
Accounting Standards Codification
The Financial Accounting Standards Board (the “FASB”) has compiled the “Accounting Standards Codification” (the “ASC” or “Codification”), which is a new structure that takes accounting pronouncements and organizes them by approximately ninety accounting topics. The Codification is the single source of authoritative generally accepted accounting principles in the United States. All guidance included in the Codification is considered authoritative and at December 31, 2011, we had adopted such guidance.
Impairment of Assets
FASB ASC 360-10-50 requires that long-lived assets be measured at the lower of carrying amount or fair value less cost to sell, whether reported in continuing operations or discontinued operations. The Company records losses due to impairment of assets held in continuing operations, and losses on assets held for sale from impairment, which is included in net loss from discontinued operations.
Mining Exploration and Development Costs
Land and mining property acquisitions are carried at cost. We expense prospecting and mining exploration costs. At the point when a property is determined to have proven and probable reserves, subsequent development costs are capitalized as capitalized development costs. Capitalized development costs will include acquisition costs and property development costs. When these properties are developed and operations commence, capitalized costs will be charged to operations using the units-of-production method over proven and probable reserves. Upon abandonment or sale of a mineral property, all capitalized costs relating to the specific property are written off in the period abandoned or sold and a gain or loss is recognized. At December 31, 2011 and 2010, all costs associated with the Dragon Mine have been expensed.
15
Provision for Income Taxes
Income taxes are calculated based upon the liability method of accounting in accordance with the FASB ASC 750-10-60, “Income Taxes.” In accordance with FASB ASC 750-10-60, deferred income taxes are recorded to reflect the tax consequences in future years of differences between the tax basis of assets and liabilities and their financial reporting amounts at each year-end. A valuation allowance is recorded against deferred tax assets if management does not believe the Company has met the “more likely than not” standard to allow for recognition of such an asset. In addition, realization of an uncertain income tax position must be estimated as “more likely than not” (i.e., greater than 50% likelihood of receiving a benefit) before it can be recognized in the financial statements. Further, the recognition of tax benefits recorded in the financial statements to be based on the amount most likely to be realized assuming a review by tax authorities having all relevant information.
Stock Options and Warrants
We have stock option plans that provide for stock-based employee compensation, including the granting of stock options, to certain key employees. The plans are more fully described in Note 9 to the financial statements.
We have adopted the provisions of FASB ASC 505-50 and FASB ASC 718-10-50 where compensation expense is recorded for all share-based awards granted to either non-employees, or employees and directors. Accordingly, compensation expense has been recognized for vesting of options and warrants to consultants and directors in the accompanying statements of operations.
We account for the issuance of equity instruments (including options and warrants) to acquire goods and services based on the fair value of the goods and services or the fair value of the equity instrument at the time of issuance, whichever is more reliably measurable.
RECENT ACCOUNTING PRONOUNCEMENTS
In January 2010, the FASB issued further guidance under ASC No. 820, Fair Value Measurements and Disclosures ("ASC 820"). ASC 820 requires disclosures about the transfers of investments between levels in the fair value hierarchy and disclosures relating to the reconciliation of fair value measurements using significant unobservable inputs (level 3 investments). ASC 820 is effective for the fiscal years and interim periods beginning after December 15, 2010. The Company will adopt the update on January 1, 2011 and expects that ASC 820 will not have a material impact on the Company's consolidated financial statements.
In January 2010, the FASB issued Accounting Standard Update (“ASU”) 2010-06 to improve disclosures about fair value measurements. ASU 2010-6 clarifies certain existing disclosures and requires new disclosure regarding significant transfers in and out of Level 1 and Level 2 of fair value measurements and the reasons for the transfer. In addition, ASU 2010-06 clarifies existing fair value disclosures about the level of disaggregation and about inputs and valuation techniques used to measure fair value. The amendments in ASU 2010-06 were effective for fiscal years beginning after December 15, 2009, and for interim periods within those fiscal periods. The adoption of ASU 2010-06 did not have a material impact on our disclosure about fair value measurements.
RESULTS OF OPERATIONS
The Dragon Mine property has yet to produce any material revenue and, as such, the Company generated no material revenue or gross profit for the twelve months ended December 31, 2011 and 2010.
Total revenue for the twelve months ended December 31, 2011 was approximately $93,000 compared to $0 for the comparable period in 2010. We sold our Dragonite product to two customers who used it in polymer applications.
Total operating expenses for the twelve months ended December 31, 2011 were approximately $7,179,500 compared to approximately $4,807,500 for the comparable period in 2010, an increase of $2,372,000, or approximately 49.3%. The increase was driven by a $612,100, or 26.5%, increase in exploration costs and a $1,770,800, or 71.1%, increase in general and administrative expense, and a $2,100 decline in the gain from the disposition of land and equipment, partially offset by the elimination of a $13,100 loss on the impairment of equipment.
Exploration expenses for the twelve months ended December 31, 2011 were approximately $2,919,300 compared to approximately $2,307,200 during the same period ended December 31, 2010. The increase of 26.5% was due primarily to a $299,700, or 51.2%, increase in safety, diesel, explosives, ground support expense, materials, and utilities expense due to an increase in drilling activity at the mine, a $294,800, or 70.8%, increase in wages due to an increase in both activity and rates paid to the Company’s mining staff, an $86,400, or 54.7%, increase in depreciation expense due to an increase in mining equipment owned by the Company, an $84,100, or 60.1%, increase in contract testing expense due to an increase in certain iron ore exploration activity, a $62,700, or 71.8%, increase in workers’ compensation expense due to the increase in payroll this period, the incurrence of $62,600 of employee health insurance costs that were not provided in 2010, and a $60,500, or 71.7%, increase in equipment maintenance expense related to the increase in the size of the Company’s fleet of mining equipment, all partially offset by a $285,800 decrease in professional consulting expense related to a general decline in exploration activity at the mine.
General and administrative expense for the twelve months ended December 31, 2011 was approximately $4,261,200 compared to $2,490,300 for the comparable period in 2010. The increase of 71.1% was driven primarily by a $1,839,100, or 493.8%, increase in non-cash compensation expense related to the issuance of options and warrants to certain employees and consultants during 2011, and a $167,800, or 90.2%, increase in corporate payroll due, primarily, to the hiring of a General Counsel, all partially offset by a $190,000, or 51.2%, decline in legal expense due to a decrease in the need for outside counsel related to the review of SEC filings, contract reviews and other legal-related matters, and a $20,000 decline in director-related expense. During 2011 and 2010, the Company paid a management fee of $1.0 million to Material Advisors, LLC to provide the Company services customarily provided by senior management including, but not limited to, the services of the Chief Executive Officer. Of the $1.0 million paid to Material Advisors, LLC, approximately $532,000 was spent on compensation and benefits for the managerial personnel provided to the Company and approximately $468,000 was spent on costs related to the business such as marketing, travel, entertainment, the renting and equipping of a corporate office in New York, N.Y., and the salary and benefits associated with providing the Company a Chief Financial Officer.
16
Our net loss from exploration stage before discontinued operations for the year ended December 31, 2011 was approximately $7,424,600 compared to approximately $4,891,500 for the same period ending December 31, 2010, an increase of $2,533,000. The increase was due to a net increase in operating expense of $2,372,000 (as described above), an increase in interest expense of approximately $139,600 due to an increase in the average balance of our PIK Notes, which we converted into common stock in October 2011, the elimination of a $145,000 gain resulting from the forfeiture of a stock award in 2010, a $143,800 increase in amortization of deferred financing costs, and a $232,100 decline in the gain on the settlement of certain debts, all partially offset by a $225,000 gain on the revaluation of warrants, the elimination of $292,200 of expense related to a legal settlement, an increase $12,400 in gross profit.
Total operating expenses for the twelve months ended December 31, 2010 were approximately $4,807,500 versus $6,025,300 for the comparable period in 2009, a decrease of $1,217,800 or approximately 20.2%. The decrease was driven by a $2,193,600, or 46.8%, decline in general and administrative expense and a $29,000, or 69.0%, decline in the loss on impairment of equipment, partially offset by a $1,007,400, or 77.5%, increase in exploration expense.
Exploration expenses for the twelve months ended December 31, 2010 were approximately $2,307,200 compared to approximately $1,299,800 for the same period ended December 31, 2009. The increase of 77.5% was due primarily to a $290,000 increase in geological consulting expense, a $235,000 increase in wages and benefits for employees at the Dragon Mine, a $136,000 increase in contract testing expense, an $80,000 increase in equipment lease expense, a $61,000 increase in shipping expense, a $60,000 increase in utilities, a $56,000 increase in mining supplies and fuel consumption, and a $42,000 increase in depreciation expense. The increase in these costs was driven by an increased level of activity at the Dragon Mine resulting from the Company’s need to increase the production of halloysite in preparation for potential commercial-sized orders.
General and administrative costs for the twelve months ended December 31, 2010 were approximately $2,490,300, versus approximately $4,683,900 in the comparable period in 2009. The 46.8% decrease was driven primarily by a $1,655,000 decline in legal fees, a $335,000 decrease in consulting fees related to product development, and a $118,000 decline in corporate payroll-related expense. The decline in legal expense was driven primarily by the elimination of certain legal services related to becoming SEC-compliant with our financial reporting, settling a class action lawsuit and filing documents related to the registration of stock. Total legal expense for 2009 and 2010 were $2,054,100 and $370,800, respectively. During the year 2009, we spent approximately $1.8 million on legal matters related to the resolution of an SEC investigation into the actions of the Company’s previous management, the resolution of a class action lawsuit filed against the Company, and general corporate matters including, but not limited to, bringing the Company into full reporting compliance with the SEC, drafting and filing the 2009 Proxy Statement, and drafting and filing the Form S-1 to register the sale of certain securities
During the year 2010, we spent approximately $310,000 on general corporate matters related to review of financial reports and related SEC filings, drafting and filing our 2010 Proxy Statement, and the drafting and filing of Form S-1 to register the sale of certain securities. The remainder of legal expenses in 2010 was related to the filing of certain patents (approximately $30,000) and fees related to mediation with one of our law firms (approximately $20,000). We expect legal fees incurred in 2011 to be lower than those incurred in 2010 as the Company continues to reduce its reliability on outside legal counsel. During 2010 and 2009, the Company paid a management fee of $1.0 million to Material Advisors, LLC to provide the Company services customarily provided by senior management including, but not limited to, the services of the Chief Executive Officer. Of the $1.0 million paid to Material Advisors, LLC, approximately $559,500 was spent on compensation and benefits for the managerial personnel provided to the Company and approximately $440,500 was spent on costs related to the business such as marketing, travel, entertainment, the renting and equipping of a corporate office in New York, N.Y., and the salary and benefits associated with providing the Company a Chief Financial Officer.
Our net loss before discontinued operations for the year ended December 31, 2010 was approximately $4,891,500 compared to approximately $6,701,500 for the same period ending December 31, 2009, a decrease of $1,810,000. The decrease was due to a net decrease in operating expense of $1,217,800 (as described above), a decrease in interest expense of $62,500 due to a net reduction in the outstanding balance of the Company’s 10% PIK Convertible-Election Notes due 2018, a $361,000 decline in the amortization of the debt discount related to certain 10% PIK-Election Convertible Notes due 2018, a reduction in the loss on the revaluation of stock awards of $128,500, the recognition of a $145,000 gain related to the forfeiture of a stock award granted to a previous CEO of the Company, the recognition of a $333,500 gain related to the reduction of an outstanding legal expense payable through a mediated settlement, partially offset by a $411,000 increase in expense related to the settlement of a class action lawsuit.
The Company classified its contract mining business as a discontinued operation on December 31, 2008. Net loss from discontinued operations was approximately $5,800 for the twelve months ended December 31, 2011 compared to net income of approximately $123,800 in the comparable period in 2010, a decline of $129,600. The decline in net income was driven by the elimination of $252,800 in revenue resulting from the recovery of certain accounts receivable previously written off, a $23,900 impairment of the Company’s Park Copper & Gold subsidiary, all partially offset by a $122,000 decline in the impairment of certain assets.
LIQUIDITY AND CAPITAL RESOURCES
Through December 31, 2011 our activities have been financed primarily the sale of equity securities as needed. Our current asset and debt structure is explained below. We may have to raise additional capital in 2012 through the sale of equity and the disposal of certain non-core assets to successfully fund our operations. If we cannot raise sufficient capital through the sale of equity securities and/or the assumption of debt, our ability to fund our operations may be severely impaired.
17
Our total assets as of December 31, 2011 were approximately $12,874,800 compared to approximately $4,215,100 as of December 31, 2010, or an increase of approximately $8,659,700. For the year ended December 31, 2011, the Company increased its current assets by approximately $8,638,600 primarily through the sale of shares of the Company’s common stock. During March 2011 the Company sold 2,812,500 shares of common stock for $2,250,000 in cash. During April 2011 the Company sold 150,000 shares of common stock for $135,000 in cash. During June 2011 the Company sold 1,250,000 shares of common stock for $2 million in cash. During December 2011 the Company sold 10 million shares of common stock and a warrant to purchase 5 million shares of common stock for $2.00 per share for $10 million in cash. The Company reduced its long-term assets by approximately $21,100 through a $172,900 increase in net property and equipment partially offset by a $151,800 decrease in deferred financing costs.
Total liabilities were approximately $4,046,400 at December 31, 2011 compared to $5,776,500 at December 31, 2010. Total current liabilities were approximately $3,948,600 at December 31, 2011 versus $721,500 at December 31, 2010. The $3,227,100 increase was due primarily to a $3,355,000 warrant derivative resulting from a December 2011 capital raise and a $47,000 increase in stock awards payable, partially offset by a $157,900 decline in the current portion of leases payable. Total long-term liabilities were approximately $97,800 at December 31, 2011 compared to $5,055,000 at December 31, 2010. The $4,957,200 decrease was due primarily to the conversion of 4,683,600 principal amount of 10% PIK-Election Notes due 2018 into shares of common stock during October 2011 and a $361,300 reduction in notes payable related to the settlement, in December 2011, of a note payable to a law firm.
Our principal source of cash flow during the 2011 was primarily from the sale of 14,962,500 shares of common stock and a warrant to purchase 5 million shares of common stock for $2.00 per share. We expect to rely on credit facilities and public or private sales of equity for additional cash flow until we produce enough revenue to fund our operations with internally generated cash flow.
Cash flows used by operating activities for the twelve months ended December 31, 2011 totaled approximately $4,699,700 compared to $4,182,000 for the same period in 2010, an increase of $517,700. This increase in the use of cash was driven primarily by a $2,714,900 increase in net loss, a $225,000 non-cash gain related to the revaluation of stock warrants, a $119,200 decrease in cash generated from discontinued operations, and a $101,400 non-cash gain related to the settlement of debts all partially offset by a 1,846,700 increase in non-cash expense related to the fair value of warrants and options issued to consultants and directors, a $152,900 increase in cash generated from an increase in the balance of accounts payable and accrued expenses, the elimination of a $145,000 non-cash gain on a stock award forfeiture, a $143,900 increase in amortization of deferred financing costs, a $104,500 increase in non-cash interest paid through the issuance of PIK Notes, a $90,100 increase in cash generated from the collections of accounts receivable, an $85,700 increase depreciation expense, and an $53,400 increase in non-cash expense related to the issuance of stock to directors and consultants.
The cash used by investing activities for the twelve months ended December 31, 2011 was approximately $270,400, compared to $21,700 of cash generated by such activities in the same period in 2010, a difference of $292,100. This difference was attributed to a net increase of $227,300 used to purchase property and equipment, a decline of $149,000 in cash proceeds generated from the sale of assets, partially offset by a $70,700 decrease in cash used for land improvement.
Cash flow from financing activities for the twelve months ended December 31, 2011 was approximately $13,498,300 compared to approximately $4,217,800 for the same period in 2010. The increase in cash generated from financing activities was due primarily to the sale of 14,212,500 shares of common stock and a warrant to purchase 5 million shares of common stock for $2.00 per share for total proceeds of $14,185,000 in cash (net of $200,000 of advisory fees), the elimination of a $170,000 payment related to the forfeiture of stock, $141,900 of proceeds from the issuance of notes payable, all partially offset by a $369,400 increase in payments of notes payable and the elimination of $115,000 of proceeds from an insurance settlement.
Our total assets as of December 31, 2010 were approximately $4,215,100 compared to $4,005,300 as of December 31, 2009, or an increase of $209,800. For the year ended December 31, 2010, the Company increased its current assets by approximately $149,900 primarily through the raising of cash through the sale of $4.55 million of 10% PIK-Election Convertible Notes due 2018 and reduced its long-term assets by $9,500 through a $271,500 increase in property and equipment (through the transfer of assets from held for sale to operations, and then impaired to market value), and an increase in deferred finance costs, net of amortization of $146,900, partially offset by the transfer of approximately $428,000 of assets-held-for-sale back to operations.
Total liabilities were approximately $5,776,500 at December 31, 2010 compared to approximately $3,694,700 at December 31, 2009. Current liabilities were approximately $721,500 at December 31, 2010 versus approximately $1,437,400 at December 31, 2009. The $715,900 decrease was due primarily to a $781,400 decrease in accounts payable and accrued liabilities resulting from a pay down of $480,000 payables related to a third-party processor and other vendors, the write-down of approximately $300,000 of accrued legal expenses, and the reduction in a stock award payable of $123,000, partially offset by a $133,400 increase in notes payable related to the structuring of a mediated settlement agreement of legal expenses and a $152,300 increase in leases payable related to the financing of additional equipment. Long-term liabilities totaled approximately $5,055,000 at December 31, 2010 compared to approximately $2,257,300 at December 31, 2009. The $2,449,200 increase was due primarily to a $361,300 increase in notes payable due to the structuring of a mediated settlement related to accrued legal expenses and a $2,449,200 increase in outstanding 10% PIK-Election Convertible Notes due 2018 related to the sale of $4,550,000 million of 10% PIK-Election Notes due 2018 during 2010, partially offset by the conversion of approximately $2,100,000 of 10% PIK-Election Notes due 2018.
Our principal source of cash flow during the 2010 was from the sale of $4.55 million of 10% PIK-Election Convertible Notes due 2018 and proceeds raised from the sale of certain equipment related to our discontinued contract mining operation. We expect to rely on credit facilities and public or private sales of equity for additional cash flow until we produce enough revenue to fund our operations with internally generated cash flow.
18
Cash flows used by operating activities for the twelve months ended December 31, 2010 was approximately $4,182,000 compared to approximately $4,454,800 for the same period in 2009, a decrease of $272,700. This decrease in the use of cash was driven by a $1,316,300 decline in cash loss, partially offset by a $234,800 decline in cash generated from the change in operating assets and liabilities, a $440,100 decline in cash generated from the change in accounts payable and accrued liabilities, and a $368,700 decline in cash generated from discontinued operations.
The cash generated by investing activities for the twelve months ended December 31, 2010 was approximately $21,700 compared to approximately $307,400 of cash generated by such activities in the same period in 2009, a decline of $285,700. This difference was attributed to a $429,700 decline in cash generated from discontinued operations, partially offset by a $62,500 decline in purchases of equipment and vehicles, and a $150,000 increase in proceeds from assets sales.
Cash flow from financing activities for the twelve months ended December 31, 2010 was approximately $4,217,800 compared to approximately $4,829,200 for the same period in 2009, a difference of $611,400. The decline is cash generated from financing activities was due primarily to a $500,000 decline in proceeds generated through the sale of PIK Notes, a $170,000 payment to a former executive related to the forfeiture of stock, and a $124,100 decline in proceeds generated through creation of notes payable, partially offset by the receipt of a $115,000 insurance settlement.
ISSUANCE OF CONVERTIBLE DEBT
In December 2008, April 2009, May 2009, July 2009, October 2009, May 2010 and October 2010, the Company sold to accredited investors, in aggregate, $10,600,000 principal amount of Series 10% PIK-Election Convertible Notes due 2018 (the “Notes”) at a conversion prices of between $0.35 and $1.00 per share (the “Conversion Price”) and entered into a Registration Rights Agreement in connection with the shares of common stock to be issued upon conversion of the Notes. The principal under the Notes is due December 15, 2018 subject to earlier acceleration or conversion of the Notes as described below. The Notes bear interest at the rate of 10% per annum payable (including by issuance of additional in kind notes) semi-annually in arrears on June 15 and December 15 of each year commencing June 15, 2009. On November 13, 2009, the December 2008, April 2009 and May 2009 Notes were converted into 10,513,809 shares of common stock. On February 8, 2010, the July 2009 Notes were converted into 324,191 shares of common stock. On June 22, 2010, the October 2009 Notes were converted into 2,133,307 shares of common stock. On May 17, 2011 the May 2010 Notes were converted into 1,654,725 shares of common stock. On October 25, 2011 the October 2010 Notes were converted into 3,365,170 shares of common stock. At December 31, 2011 there were no 10% PIK-Election Notes due 2018 outstanding.
OFF-BALANCE SHEET ARRANGEMENTS
There are no off-balance sheet arrangements between us and any other entity that have, or are reasonable likely to have, a current or future effect on our financial condition, changes in financial condition, revenues or expenses, results of operations, liquidity, capital expenditures, or capital resources that is material to investors.
|
ITEM 7A.
|
QUANTITATIVE AND QUALITATIVE DISCLOSURES ABOUT MARKET RISK
|
The Company has no exposure to fluctuations in interest rates, foreign currencies, or other market factors.
ITEM 8. FINANCIAL STATEMENTS AND SUPPLEMENTARY DATA
Our Financial Statements are included herein at Item 16. Financial statement schedules are omitted as they are not applicable or the information required is included in the Financial Statements.
|
ITEM 9.
|
CHANGES IN AND DISAGREEMENTS WITH ACCOUNTANTS ON ACCOUNTING AND FINANCIAL DISCLOSURE
|
During the years ended December 31, 2011 and 2010, there were no disagreements with our independent registered public accounting firm.
ITEM 9A. CONTROLS AND PROCEDURES
Disclosure Controls and Procedures
We evaluated the effectiveness of the design and operation of our disclosure controls and procedures, as defined in Rules 13a-15(e) and 15d-15(e) of the Exchange Act, as of December 31, 2007. Our principal executive and financial officers supervised and participated in the evaluation. Based on the evaluation, our principal executive and financial officers each concluded that our disclosure controls and procedures were not effective in providing reasonable assurance that information required to be disclosed by us in the reports we file or submit under the Exchange Act is recorded, processed, summarized and reported within the time periods specified in the SEC’s forms and rules as of December 31, 2007. We determined that the Company did not have sufficient control over the closing process and could not prepare its financial statements, footnotes and 10-K disclosures in a timely fashion. This weakness resulted in significant last minute changes to the Company’s financial reports and Form 10-K which could have resulted in material errors in the financial reports and 10-K.
19
Internal Control Over Financial Reporting
Our management is responsible for establishing and maintaining adequate internal control over financial reporting, as defined in Rules 13a-15(f) and 15d-15(f) of the Exchange Act. Internal control over financial reporting is designed to provide reasonable assurance regarding the reliability of financial reporting and the preparation of financial statements for external purposes in accordance with GAAP. Our internal control over financial reporting includes those policies and procedures that:
|
·
|
pertain to the maintenance of records that, in reasonable detail, accurately and fairly reflect the transactions and dispositions of our assets;
|
|
·
|
provide reasonable assurance that transactions are recorded as necessary to permit preparation of financial statements in accordance with GAAP, and that our receipts and expenditures are being made only in accordance with authorizations of our management and directors; and
|
|
·
|
provide reasonable assurance regarding prevention or timely detection of unauthorized acquisition, use or disposition of our assets that could have a material effect on our financial statements.
|
Internal control over financial reporting cannot provide absolute assurance of achieving financial reporting objectives because of its inherent limitations. Internal control over financial reporting is a process that involves human diligence and compliance and is subject to lapses in judgment and breakdowns resulting from human failures. Internal control over financial reporting can also be circumvented by collusion or improper management override. Because of such limitations, there is a risk that material misstatements may not be prevented or detected on a timely basis by internal control over financial reporting. Also, projections of any evaluation of effectiveness to future periods are subject to the risk that controls may be inadequate because of changes in conditions, or that the degree of compliance with the policies or procedures may deteriorate.
Management’s Annual Report on Internal Control over Financial Reporting
Our management, including the chief executive officer and principal financial officer, concluded that the Company’s internal control over financial reporting was ineffective as of December 31, 2011. In arriving at that conclusion, we considered the criteria established in Internal Control—Integrated Framework issued by the Committee of Sponsoring Organizations of the Treadway Commission (“COSO”) and we performed a complete assessment as outlined in Commission Guidance Regarding Management’s Report on Internal Control Over Financial Reporting Under Section 13(a) or 15(d) of the Exchange Act ("SOX"). The effectiveness of our internal control over financial reporting as of December 31, 2011 has been audited by PMB Helin Donovan, our independent registered public accounting firm, as stated in their report, which is included herein.
In performing our assessment, we identified the risks that most likely affect reliable financial reporting and are most likely to have a material impact on the company’s financial statements, documented each business process within the risk area, determined the control points related to the business process and tested the design and effectiveness of each control. In addition to process (transactional) level controls, we evaluated entity level controls to determine if compensating controls mitigated any process level risks. Entity level controls include a broad range of non-transactional activities including account reconciliations, management review of results, the company’s Code of Conduct and Audit Committee review of practices and results.
SEC Release 33-8809 defines “material weakness” as a deficiency, or a combination of deficiencies in internal control over financial reporting such that there is a reasonable possibility that a material misstatement of the registrant’s financial statement will not be prevented or detected on a timely basis. SEC release 33829 defines “significant deficiency” as a deficiency, or combination of deficiencies in internal control over financial reporting that is less severe than a material weakness, yet important enough to merit attention by those responsible for oversight of the registrant’s financial reporting.
In summary, as a result of our first assessment of internal control over financial reporting under COSO criteria we identified a number of material weaknesses in high to low risk processes within high risk areas of financial statement control. Despite the existence of the material weaknesses, we believe that our consolidated financial statements contained in this Form 10-K filed with the SEC fairly present our financial position, results of operations and cash flows for the fiscal year ending December 31, 2011 in all material respects. In conjunction with this conclusion, our independent registered public accounting firm has tested our internal control over financial reporting evaluation process and has provided an adverse opinion on the Company’s control over financial reporting audit report.
As of December 31, 2011, the following material weaknesses in our internal controls over financial reporting were identified:
Material Weaknesses
|
1.
|
Certain controls over equity were not effective to ensure that all transactions involving equity were recorded in an accurate and timely fashion;
|
|
2.
|
Certain controls were not effective to ensure that all expenses were accurately categorized;
|
|
3.
|
The Company did not have adequate control over the recording and monitoring of purchase orders and accounts receivables; and
|
|
4.
|
Management determined there was an insufficient number of personnel with appropriate technical accounting and SEC reporting expertise to perform a timely financial close process, adhere to certain control disciplines, and to evaluate and properly record certain non-routine and complex transactions. This resulted in audit adjustments, which are material in the aggregate and necessary to present the annual audited financial statements in accordance with generally accepted accounting principles. In light of the actual audit adjustments required and the effect on the account balances and related disclosures in the financial statements management determined there is a more than a remote likelihood that material misstatement could occur and not be detected in the Company's interim or annual audited financial statements.
|
The above material weaknesses resulted in post-closing adjustments, which impacted accrued expenses, accounts receivable, and stockholders’ equity. These material weakness, if not remediated, could result in misstatements to any of our financial statement accounts which would result in a material misstatement of our annual or interim consolidated financial statements which would not be prevented or detected.
20
Changes in Internal Controls over Financial Reporting
Management, with the participation of the principal executive officer and principal financial officer, is committed to remediating the material weaknesses identified above by implementing changes to the Company’s internal control over financial reporting. Management has implemented, or is in the process of implementing, the following changes to the Company’s internal control systems and procedures:
|
1.
|
Management is conducting a search for a permanent Chief Accounting Officer who has particular experience remediating the inadequate controls exhibited by the Company;
|
|
2.
|
Management hired a CPA firm in late 2011 to assume its bookkeeping function from its soon-to-be-closed Idaho office, which, we believe, will result in a significant improvement in the accurate and timely recording of transactions; and
|
|
3.
|
Management expects to hire additional accounting personnel as it grows its business and generates the cash flow necessary to make such hires.
|
ITEM 9B. OTHER INFORMATION
None.
PART III
ITEM 10. DIRECTORS, EXECUTIVE OFFICERS AND CORPORATE GOVERNANCE
Identification of Directors and Officers
The following table provides the names, positions, ages and principal occupations of our current directors, and our executive officers.
|
Name and Position with The Company
|
Age
|
Director 1 /Officer Since
|
Principal Occupation
|
|
John F. Levy
|
56
|
Non-executive Chairman since August 2009, Director since January 2008
|
CEO of Board Advisory
|
|
Evan D. Stone
|
40
|
Director since August 2009
|
Partner, Lee & Stone
|
|
David A. Taft
|
55
|
Director since October 2008
|
President, IBS Capital LLC
|
|
Andre M. Zeitoun
|
39
|
Chief Executive Officer, President and Director since January 2009
|
President, Chief Executive Officer and Director of Company
|
|
Christopher T. Carney
|
41
|
Officer since February 2009
|
Interim Chief Financial Officer of Company
|
|
William Gleeson
|
68
|
Officer since September 2011
|
General Counsel
|
|
(1)
|
The directors are elected to serve until the next annual meeting of shareholders. Officers are appointed annually by the Board of Directors and serve at the pleasure of the Board.
|
Background of Directors and Officers
John F. Levy, Non-Executive Chairman and Director
Since May 2005, Mr. Levy is Chief Executive Officer and principal consultant for Board Advisory, a consulting firm that advises public companies, or companies aspiring to be public, in the areas of corporate governance, corporate compliance, ethics, financial reporting and financial strategies. From November 2005 to March 2006, Mr. Levy served as Interim Chief Financial Officer of Universal Food & Beverage Company, which filed a voluntary petition under the provisions of Chapter 11 of the United States Bankruptcy Act on August 31, 2007. From March 2006 through April 2010, Mr. Levy was a director and Chairman of the audit committee of Take-Two Interactive Software, Inc. and from November 2008 through June 2010, Mr. Levy was a director of Applied Natural Gas Fuels, Inc. (formerly PNG Ventures, Inc.). Mr. Levy currently is a member of the Board of Directors and Lead Director for Gilman Ciocia, Inc., is a member of the Board of Directors of Applied Energetics, Inc. and is a member of the Board of Directors of Brightpoint, Inc.
Mr. Levy is a Certified Public Accountant with nine years experience with the national public accounting firms of Ernst & Young, Laventhol & Horwath, and Grant Thornton. Mr. Levy has a B.S. degree in economics from the Wharton School of the University of Pennsylvania and received his M.B.A. from St. Joseph's University (PA).
Key attributes, experience and skills: Mr. Levy has over 30 years of progressive financial, accounting and business experience, including having served as Chief Financial Officer of both public and private companies for over 13 years. Mr. Levy brings to the board expertise in corporate governance and compliance matters along with extensive experience gained from numerous senior executive positions with public companies. Further, Mr. Levy’s service on the boards of directors of public companies in a variety of industries also allows him to bring a diverse blend of experiences to our board.
21
Evan D. Stone, Director
Mr. Stone has represented hedge funds, private equity funds, venture capital funds and public and private corporations on a wide range of sophisticated corporate and securities matters. Mr. Stone is co-founder of Lee & Stone LLP, a Dallas based law firm specializing in services for the investment community and a principal of Steelbridge Compliance LLC, a Dallas-based firm providing compliance advisory services to investment advisors. Prior to co-founding Lee & Stone in 2009, Mr. Stone served as Vice President and General Counsel for Dallas-based investment manager, Newcastle Capital Management, L.P., which Mr. Stone joined in 2006. Prior to Newcastle, from 2003 through 2006, Mr. Stone worked in the mergers and acquisitions department of the international law firm Skadden Arps Slate Meagher & Flom LLP in New York. Prior to Skadden, Mr. Stone served as a member of the investment banking department at Merrill Lynch & Co. and Vice President, Corporate Development at Borland Software, Inc. In addition to his work on behalf of investors at Lee & Stone, Mr. Stone currently serves as General Counsel and Secretary of Wilhelmina International, Inc., a leading model and artist management firm, to which offices he was appointed in 2009. Mr. Stone was a director of Wilhelmina International, Inc. from 2009 through 2011.
Key attributes, experience and skills: Mr. Stone brings a strong mix of legal, asset management, corporate development and investment banking experience to the Company’s Board of Directors. Mr. Stone’s legal practice, at his own firm and at Skadden Arps, has focused primarily on mergers and acquisitions, private equity and investment management.
In addition, as General Counsel for Newcastle Management, L.P., an activist investment manager, Mr. Stone was involved in the sourcing, analysis, negotiation and monitoring of a number of the firm’s investments and also advised on corporate governance and operational matters. As General Counsel and Secretary and a director of Wilhelmina International, Inc., Mr. Stone gained valuable additional board corporate governance experience related to a public company.
Mr. Stone also has investment banking and corporate development experience. It is these attributes that led the Board to conclude that Mr. Stone should continue to serve as a director of Applied Minerals, Inc.
David A. Taft, Director
Mr. Taft is the President of IBS Capital LLC, a private investment company based in Boston, Massachusetts, which he founded in 1990. Prior to founding IBS Capital LLC, Mr. Taft spent ten years working in corporate finance with Drexel Burnham Lambert, Winthrop Financial and Merrill Lynch. Mr. Taft is a graduate of Amherst College and Amos Tuck School of Business Administration at Dartmouth College.
Key attributes, experience and skills: Mr. Taft has over 30 years experience as a corporate investment banker and the manager of IBS Capital LLC, a private investment fund. Mr. Taft brings significant leadership, financial expertise, business development skills and corporate restructuring experience to the Company’s Board of Directors. The investments Mr. Taft has made through his management of the IBS Turnaround Fund has, on occasion, required him to advise companies on issues such as corporate governance, capital raising, balance sheet restructuring and general business strategy. IBS Capital LLC, under Mr. Taft’s direction, has been a large shareholder of Applied Minerals, Inc. for a number of years. It is these attributes that led the Board to conclude that Mr. Taft should continue to serve as a director of Applied Minerals, Inc.
Andre M. Zeitoun, Chief Executive Officer, President, Director
Mr. Zeitoun is manager of Material Advisors LLC (“Material Advisors”), which provides managerial services to the Company pursuant to a Management Agreement entered into as of January 1, 2009 and extended twice. Mr. Zeitoun was elected as a director and as CEO pursuant to the terms of the Management Agreement as described in “Related Party Transactions.”
Mr. Zeitoun was a Portfolio Manager at SAC Capital/CR Intrinsic Investors from March 2007 through December 2008. At SAC, he led a team of six professionals and managed a several hundred million dollar investment portfolio focused on companies that required a balance sheet recapitalization and/or operational turnaround. Many of these investments required Mr. Zeitoun to take an active role in the turnaround process. From 2003 to 2006, Mr. Zeitoun headed the Special Situations Group at RBC Dain Rauscher as a Senior Vice President and head of the division. He managed all group matters related to sales, trading, research and the investment of the firm’s proprietary capital. From 1999 to 2003 Mr. Zeitoun was a Senior Vice President at Solomon Smith Barney. In this role, Mr. Zeitoun led a Special Situations sales trading research team serving middle market institutions. Mr. Zeitoun is a graduate of Canisius College.
Key attributes, experience and skills: Mr. Zeitoun has over 10 years experience indentifying, allocating capital to, and taking an active role in corporate situations requiring a balance sheet recapitalization and/or operational restructuring. Since January 2009, Mr. Zeitoun has spearheaded effort to stabilize the Company’s balance sheet, raise critically needed capital, engage industry-leading consultants to quantify and characterize the Company’s Dragon Mine resource, and establish a marketing infrastructure. Mr. Zeitoun’s accomplishments during his first year as Chief Executive Officer has led the Board to conclude that he should continue as a director of Applied Minerals, Inc. During his time as President and Chief Executive Officer of Applied Minerals, Inc., Mr. Zeitoun has developed a level of expertise in the area of the commercialization of halloysite-based applications and has developed a network of relationships with other experts within the field.
Christopher T. Carney, Interim Chief Financial Officer
Pursuant to the Management Agreement between Material Advisors LLC and the Company, he was appointed to his position as Interim Chief Financial Officer in February 2009. From March 2007 until December 2008, Mr. Carney was an analyst at SAC Capital/CR Intrinsic Investors, LLC where he evaluated the debt and equity securities of companies undergoing financial restructurings and operational turnarounds. From March 2004 until October 2006, Mr. Carney was a distressed debt and special situations analyst for RBC Dain Rauscher Inc., a registered broker dealer. Mr. Carney graduated with a BA in Computer Science from CUNY-Lehman College and an MBA in finance from Tulane University.
22
William Gleeson, General Counsel
Mr. Gleeson began his legal career as a litigator with the SEC, specializing in accounting cases. Prior to joining the Company, he was a partner at K&L Gates, LLP for eleven years, focusing on various areas of corporate law. For the last three years he served as Applied Minerals, Inc.’s outside counsel, a time during which he acquired an in-depth understanding of the Company’s business. Mr. Gleeson received his J.D. from the University of Michigan, from which he also received his undergraduate degree.
Committees
As of December 31, 2011, we did not have nominating, auditing or compensation committees and there were no procedures by which shareholders might recommend nominees to the board of directors,
As of December 31, 2011, we did not have an audit committee. The Board of Directors functioned as an audit committee.
Audit Committee Financial Expert
The Board of Directors has determined that Mr. Levy is an audit committee financial expert as this term is defined in the rules of the Securities and Exchange Commission and is independent under the independence standards of Nasdaq and the enhanced independence standards of Section 10A-3 of the Securities Exchange Act.
Management Agreement with Material Advisors, LLC
Messrs. Zeitoun and Carney were appointed to positions with the Company pursuant to an agreement with Material Advisors, of which they are members and owners.
On December 30, 2008, the Company entered into a Management Agreement with Material Advisors, a management services company (“Manager”). The Management Agreement, commencing on January 1, 2009, had a term ending on December 31, 2010 with automatic renewal for successive one-year periods unless either Manager or Company provided 90 days prior notice of cancellation to the other party or pursuant to the termination provisions of the Management Agreement. On March 9, 2010, the Company and the Manager determined not to provide notice of cancellation for 2011, in effect extending the Management Agreement for 2011. Under the Management Agreement, Manager is to perform or engage others, including Mr. Zeitoun, a principal of Manager, Christopher Carney and Eric Basroon (“Management Personnel”) to perform senior management services including such services as are customarily provided by a chief executive officer but not (unless otherwise agreed) services customarily provided by a chief financial officer (it was subsequently agreed to have Mr. Carney perform as Interim Chief Financial Officer). Pursuant to the Management Agreement, Andre Zeitoun is serving as the Company’s Chief Executive Officer and as a member of the Company’s Board of Directors.
The services provided by Manager include, without limitation, consulting with the Board of Directors of the Company and the Company’s management on business and financial matters, including matters related to (i) new business development, creating and implementing the Company’s business plan and overseeing and supervising the Company’s operations, (ii) preparation of operating budgets and business plans, (iii) Company’s corporate and financial structure, (iv) formulation of long term business strategies, (v) recruiting senior management, (vi) financing, (vii) transactions with third parties, including mergers and acquisitions, (viii) evaluating potential sale or exit opportunities, structuring and negotiating a sale of the Company, or leveraged recapitalization, and (ix) resolving investigations and litigation involving the Company. Manager is paid an annual fee of $1,000,000 per year for the three-year term of the Management Agreement, payable in equal monthly installments of $83,333. Manager will be solely responsible for the compensation of the Management Personnel and the Management Personnel will not be entitled to any direct compensation or benefits from the Company (including in the case of Mr. Zeitoun, for service on the Board). The Management Agreement does not specify the levels of compensation to Messrs. Zeitoun or Carney. Additionally, the Company granted Manager non-qualified stock options to purchase, for $0.70 per share (the “$0.70 Option”) a number of shares of the Company equal to 10% of the outstanding common stock of the Company on a fully diluted basis (which shall vest in equal monthly installments over three years). On December 31, 2008, the closing stock price of the Company’s Common Stock was $0.15.
The following sets forth the treatment of the $0.70 Option in the event of a “going private transaction.” Upon the consummation of a transaction resulting in (i) the Company ceasing to be a SEC reporting company, or having less than 300 shareholders of record and (ii) David A. Taft, IBS Capital LLC, The IBS Turnaround Fund L.P., The IBS Turnaround Fund (QP), The IBS Opportunity Fund (BVI). Ltd., or any of their affiliates or related entities own in the aggregate more than 50% of the outstanding equity capital of the Company immediately following such transaction (a “Going Private Transaction”), the $0.70 option will be cancelled and replaced by a non-qualified option (the “Going Private Option”), accompanied by a tandem stock appreciation right (the “SAR”). The Going Private Option will provide Manager the right to purchase the same percentage of Company’s (or its successor’s) outstanding shares of common stock after giving effect to the going private transaction that were subject to the $0.70 Option. The SAR will entitle Manager to receive either shares of common stock or cash equal in value to the excess of the fair market value of a share of common stock on the date of exercise over the base price per share under the SAR. The exercise price of the Going Private Option and the base price under the SAR will be the fair market value per share to be paid in the Going Private Transaction to shareholders who are not investing in the going private vehicle. The term of the $0.70 Option, the Going Private Option and the SAR will be 10 years. During such periods, the Going Private Option and the SAR will be fully exercisable. Manager will have the right to participate in the Going Private Transaction for up to 20% of the equity on terms and conditions which are as favorable to Manager as the terms and conditions available to any other person who invests in the going private entity.
On February 8, 2011, the Board of Directors extended the Management Agreement through December 31, 2012. As part of the extension, the Managers were granted options to purchase 2,904,653 shares of common stock of the Company at $0.83 per share with a 10-year term, vesting equally over twelve months beginning January 1, 2012.
23
Section 16(a) Beneficial Ownership Reporting Compliance
Section 16(a) of the Securities Exchange Act of 1934 requires our officers, directors, and any person who beneficially owns more than 10% of our common stock to file reports of ownership and changes in ownership with the Securities and Exchange Commission. Executive officers, directors, and more than 10% shareholders are required by regulation to furnish us with copies of all Section 16(a) forms which they file.
During 2011, certain of our directors and executive officers who own our stock filed Forms 3 or Forms 4 with the Securities and Exchange Commission. The information on these filings reflects the current ownership position of all such individuals. To the best of our knowledge, during 2011 all such filings by our officers and directors were made timely except for that filed for William Gleeson due to a clerical error.
Code of Ethics
We have adopted a Code of Conduct and Ethics for our Chief Executive Officer and our senior financial officers. A copy of our Code of Conduct and Ethics is posted on our website at www.appliedminerals.com and can be obtained at no cost by mail at: Applied Minerals, Inc., 110 Greene Street, Suite 1101, New York, New York, 1002. We believe our Code of Conduct and Ethics is reasonably designed to deter wrongdoing and promote honest and ethical conduct; provide full, fair, accurate, timely and understandable disclosure in public reports; comply with applicable laws; ensure prompt internal reporting of code violations; and provide accountability for adherence to the code.
Committees of the Board
The Board of Directors as a whole performs the functions which would otherwise be performed by the audit, compensation and nominating committees. Our Board views the addition of standing audit, compensation, and nominating committees as an unnecessary additional expense and process to the Company given its stage of development. On February 8, 2011, the Board of Directors established an Executive Committee (the “Committee”) consisting of Evan Stone, John Levy and Andre Zeitoun, all directors of the Company. Evan Stone was appointed Chairman of the Committee.
The Nomination Process
The general criteria that our Board uses to select nominees includes the following: individuals reputation for integrity, honesty and adherence to high ethical standards; their demonstrated business acumen, experience and ability to exercise sound judgments in matters that relate to the current and long-term objectives of the Company; their willingness and ability to contribute positively to the decision-making process of the Company; their commitment to understand the Company and its industry and to regularly attend and participate in meetings of the Board and its committees; their interest and ability to understand the sometimes conflicting interests of the various constituencies of the Company, which include stockholders, employees, customers, creditors and the general public; their ability to act in the interests of all stakeholders; and no nominee should have, or appear to have, a conflict of interest that would impair the nominees ability to represent the interests of all of the Company’s stockholders and to fulfill the responsibilities of a director. There are, however, no specific minimum qualifications that nominees must have in order to be selected. The Board will consider director candidates recommended by our stockholders. In evaluating candidates recommended by our stockholders, the Board of Directors applies the same criteria discussed above. Any stockholder recommendations for director nominees proposed for consideration by the Board should include the nominees name and qualifications for Board membership and should be addressed in writing to the President, Applied Minerals, Inc., 110 Greene St., Suite 1101, NY, NY 10012. There have been no changes in the procedures by which shareholders may recommend candidates for director.
ITEM 11. EXECUTIVE COMPENSATION
The section discusses the 2011 compensation paid to Material Advisors LLC (“Material Advisors”), the management company that provides us with the services of Andre Zeitoun, our CEO, Chris Carney, our Interim CFO, and one other person (“Management Personnel”).
In 2011 compensation was paid to Material Advisors was paid pursuant to a management agreement (“Management Agreement“) entered into on December 30, 2008. The Management Agreement initially covered 2009 and 2010. The Management Agreement provided for an automatic extension for 2011 unless either the Company or Material Advisors gave written notice of non-renewal by September 30, 2010. On February 8, 2010 (“Extension Date”), the Company and Material Advisors agreed not to give notice of non-renewal, with the result that the Management Agreement covered 2011. As of the Extension Date, the Board of Directors deemed that the 2011 compensation to Material Advisors as provided for in the Management Agreement was appropriate compensation for 2011 and given Material Advisors’ willingness to accept such compensation for 2011, the Board determined that it was not in the best interest of the Company to attempt to negotiate a different compensation package for 2011. As a result the compensation paid in 2011 was the compensation provided for in the Management Agreement.
The compensation paid in 2011 consisted of two elements,
|
·
|
$1.0 million management fee. Under the Management Agreement, Material Advisors was required to pay all travel, entertainment, office and marketing expenses and all other ordinary and necessary business expenses incurred by the Material Advisors and the Management Personnel in connection with the performance of the Management Agreement (“Expenses”). The cash compensation paid in 2010 was also $1.0 million. Material Advisors paid approximately $440,500, and $468,000 for Expenses in 2010 and 2011, respectively.
|
|
·
|
Options vesting in 12 monthly installments and expiring on January 1, 2019 to purchase 2,194,425 shares of common stock (equal to 3.6% and 2.8% of the outstanding shares on a fully diluted basis on December 30, 2008 and February 8, 2010, respectively). The exercise price of the options was $.70. When the Management Agreement was entered into on December 29, 2008 the closing market price of the common stock was $0.14 per share. On February 7, 2010, the closing market price of the common stock was $0.69 per share.
|
24
The cash compensation (net of Expenses) in 2011reflected the Company’s limited financial resources to pay Material Advisors for the Services. The Company did not know at the time of the extension for 2011 and had no right to know the amounts of compensation paid by Material Advisors to Mr. Zeitoun or Mr. Carney.
The options that vested in 2011 were granted pursuant to the Management Agreement. The number of options and the terms of the options were deemed appropriate in order to provide Material Advisors with a reasonable compensation package that provided an appropriate degree of incentive in light of (i) the limited cash compensation and (ii) given the Company’s history, prospects, and financial condition, the degree of risk assumed by Material Advisors that the options would provide meaningful value. Because of the inability to make meaningful projections as to the future performance, tying the terms of the options to the attainment of specific performance goals was deemed to be inappropriate.
On February 8, 2011 the Company and Material Advisors agreed to an extension for 2012, with compensation of a $1 million annual management fee and the grant of 2,904,653 options vesting in 12 monthly installments beginning January 1, 2012 and expiring on January 1, 2022 (equal to 2.8% of the outstanding shares on a fully diluted basis on December 31, 2011). The exercise price was $.83 per share. On January 18, 2012, the 2012 compensation arrangement was amended to eliminate the obligation of Material Advisors to pay Expenses. In addition, as of that date, Material Advisors was awarded a bonus of $750,000.
The description of the Company’s equity compensation plans included in Item 5 is herein incorporated by reference.
Executive Compensation and Highly Paid Employees
|
Option
|
All Other
|
||||||||
|
Name and
|
Salary
|
Bonus
|
Awards
|
Comp.
|
Total
|
||||
|
Principal Position
|
Year
|
($)
|
($)
|
($)(1)
|
($)(3)
|
($)
|
|||
|
Andre M. Zeitoun,,
|
2011
|
-0-
|
-0-
|
-0-
|
- 0 -
|
-0-
|
|||
|
CEO, Director (2)
|
2010
|
-0-
|
-0-
|
-0-
|
- 0 -
|
-0-
|
|||
|
Christopher T. Carney,
|
2011
|
-0-
|
-0-
|
-0-
|
- 0 -
|
-0-
|
|||
|
Interim CFO (2)
|
2010
|
-0-
|
-0-
|
-0-
|
- 0 -
|
-0-
|
|||
|
William Gleeson,
|
2011
|
58,333
|
-0-
|
532,400
|
31,660
|
622,393
|
|||
|
General Counsel (3)
|
2010
|
-0-
|
-0-
|
-0-
|
- 0 -
|
-0-
|
|
(1)
|
This column represents the dollar amount recognized for financial statement reporting purposes with respect to the 2011 and 2010 fiscal years for the fair value of stock options granted to each of the individuals in 2011 and 2010 in accordance with SFAS 123R. Pursuant to SEC rules, the amounts shown exclude the impact of estimated forfeitures related to service-based vesting conditions. For additional information, refer to Note 9 to the Notes to Consolidated Financial Statements found in Item 15, Part IV of this document. These amounts reflect the Company’s accounting expense for these awards, and do not correspond to the actual value that will be recognized by the named executive officers.
|
|
(2)
|
Messrs. Zeitoun and Carney received no direct compensation from the Company. Each is a partner of Material Advisors LLC, a consulting firm that provides managerial services to the Company pursuant to a Management Agreement (the “Agreement”) entered into on January 1, 2009 and extended through December 31, 2012. Per the terms of the Agreement, Applied Minerals, Inc. pays Material Advisors, LLC a $1 million fee annually in exchange for management services provided by Material Advisors, LLC. Applied Minerals, Inc. paid Material Advisors, LLC the $1 million management fee in both 2010 and 2011. Upon entering the Agreement on January 1, 2009, Material Advisors, LLC was granted options to purchase 6,583,277 shares of common stock of Applied Minerals, Inc. at $0.70 per share with a ten-year term. The options vest equally over 36 months starting on the effective date of the Management Agreement. A copy of the Management Agreement was filed as an 8-K on January 7, 2009. The value of the options vested to Material Advisors in 2010 was $872,284. Upon the extension of the Agreement on February 8, 2011, Material Advisors, LLC was granted options to purchase 2,904,653 shares of common stock of Applied Minerals, at $0.83 per share with a 10-year term. The options vest equally over 12 months beginning on January 1, 2012.
|
|
(3)
|
Mr. Gleeson’s employment began on September 15, 2011. All other compensation includes the reimbursement of moving expenses ($28,100) and health insurance premiums ($3,560).
|
25
Grants of Plan-Based Awards
|
Name
|
Grant date
|
Estimated future payouts under non-equity incentive plan awards
|
Estimated future payouts under equity incentive plan awards
|
All other stock awards: Number of shares of stock or units
(#)
|
All other option awards: Number of securities underlying options
(#)
|
Exercise or base price of option awards
($/Sh)
|
Grant date fair value of stock and option awards
($)
|
||||
|
Threshold
($)
|
Target
($)
|
Maximum
($)
|
Threshold
(#)
|
Target
(#)
|
Maximum
(#)
|
||||||
|
Andre M. Zeitoun, CEO (1)
|
- 0 -
|
- 0 -
|
- 0 -
|
||||||||
|
Christopher T. Carney, Interim CFO (1)
|
- 0 -
|
- 0 -
|
- 0 -
|
||||||||
|
Willaim Gleeson, General Counsel
|
9-15-11
|
900,000
|
1.90
|
1,490,393
|
|||||||
(1) Messrs. Zeitoun and Carney have not been granted options directly by the Company. Each is a partner of Material Advisors LLC, a consulting firm that provides managerial services to the Company pursuant to a Management Agreement entered into on January 1, 2009 and effective for a two-year period. Upon the extension of the Agreement on February 8, 2011, Material Advisors, LLC was granted options to purchase 2,904,653 shares of common stock of Applied Minerals, at $0.83 per share with a 10-year term. The options vest equally over 12 months beginning on January 1, 2012. The grant date fair value of the option award issued to Material Advisors, LLC was approximately $351,800. Of the options granted to Material Advisors, LLC, Messrs. Zeitoun and Carney received 1,742,792 and 580,930, respectively.
Outstanding Equity Awards at December 31, 2011
The following table provides information on the holdings as of December 31, 2008 of stock options granted to the named executive officers. This table includes unexercised and unvested option awards. Each equity grant is shown separately for each named executive officer
|
OUTSTANDING EQUITY AWARDS AT FISCAL YEAR END
|
||||||
|
OPTION AWARDS
|
||||||
|
Name
|
Grant Date
|
Number of Securities Underlying Unexercised Options: Exercisable
|
Number of Securities Underlying Unexercised Options: Unexercisable
|
Equity Incentive Plan Awards Number of Securities Underlying Unexercised Unearned Options
|
Option Exercise Price
|
Option Expiration Date
|
|
Andre Zeitoun (1)
|
|
- 0 -
|
- 0 -
|
- 0 -
|
||
|
Christopher T. Carney
(1)
|
- 0 -
|
- 0 -
|
- 0 -
|
|||
|
William Gleeson
|
8/18/2011
|
100,000
|
800,000
|
- 0 -
|
$1.80
|
8/18/2021
|
|
(1)
|
Messrs. Zeitoun and Carney have not been granted options directly by the Company. Each is a partner of Material Advisors LLC, a consulting firm that provides managerial services to the Company pursuant to a Management Agreement entered into on January 1, 2009 and effective for a two-year period. Per the terms of the Management Agreement, the Company granted Material Advisors, LLC 6,583,277 options to purchase common stock at $0.70 per share with a ten-year term. The options vest ratably over 36 months beginning on the effective date of the Management Agreement. A copy of the Management Agreement was filed as an 8-K on January 7, 2009. Upon the extension of the Agreement on February 8, 2011, Material Advisors, LLC was granted options to purchase 2,904,653 shares of common stock of Applied Minerals, at $0.83 per share with a 10-year term. The options vest equally over 12 months beginning on January 1, 2012. Mr. Zeitoun owns 3,949,966 vested options (expiring in December 2018) with a strike price of $0.70, 968,218 vested options (expiring in February 2021) with a strike price of $0.83, and 774,574 unvested options (expiring in February 2021) with a strike price of $0.83. Mr. Carney owns 1,316,655 vested options (expiring in December 2018) with a strike price of $0.70, 193,643 vested options (expiring in February 2021) with a strike price of $0.83, and 387,287 unvested options (expiring in February 2021) with a strike price of $0.83.
|
26
|
|
Director Compensation for the Year Ended December 31, 2011
|
The following sets forth compensation (1) to the persons who served as directors in 2009.
|
Name
|
Fees Earned or Paid in Cash
|
Common Stock Awards
|
Options Awards
|
Total ($)
|
||||
|
John Levy (2)
|
$ 50,000
|
$ - 0 -
|
$47,575
|
$ 97,575
|
||||
|
Evan Stone (3) (4)
|
$ 20,000
|
$ 20,000
|
$ 95,379
|
$ 135,379
|
||||
|
David Taft
|
$ 40,000
|
$ - 0 -
|
$ - 0 -
|
$ 40,000
|
||||
|
Andre Zeitoun
|
$ - 0 -
|
$ - 0 -
|
$ - 0 -
|
$ - 0 -
|
|
(1)
|
Each director, except for the Chairman, is paid $10,000 at the beginning of each calendar quarter in cash, stock or a combination of both at the discretion of the director.
|
|
(2)
|
John Levy, as Chairman of the Board of Directors of Applied Minerals, Inc. is paid $12,500 at the beginning of each calendar quarter. During February 2011 he was awarded 100,000 5-year options to purchase shares of common stock at $0.83 per share. The options began vesting monthly, on an equal basis, beginning February 2011. The value of Mr. Levy’s 91,667 vested options was $47,575 at December 31, 2011 based on the Black-Scholes Option Valuation model.
|
|
(3)
|
Mr. Stone was issued 200,481 5-year options to purchase shares of common stock at $0.83 per share for his role as Chairman of an Executive Committee formed by the Company in February 2011. The options began vesting monthly, on an equal basis, in February 2011. The value of Mr. Stones 183,774 vested options was $95,379 at December 31, 2011 based on the Black-Scholes Option Valuation Model.
|
|
(4)
|
For the year ended December 31, 2011, aggregate stock grants for director compensation were as follows: Stone – 19,205 shares.
|
Compensation Discussion and Analysis
In 2011, the only executive officer who was compensated directly by the Company was William Gleeson, our General Counsel who was hired as of September 15, 2011. Mr. Gleeson’s compensation arrangement is a three-year agreement providing for annual cash compensation of $200,000 plus 10-year options to purchase up to 900,000 shares of common stock at an exercise price of $1.90 per share. The options vest in 36 installments beginning September 15, 2011.Mr. Gleeson may be tern0mated at will, except that if he is terminated before one–year has elapsed. He will receive (including already vested options) an aggregate of 300,000 options.
The relative mix of cash and options reflects the Company’s strained cash position and its near-term revenue prospects at the time of the hiring, with the number of options designed to compensate for the relatively low cash compensation. The options were granted at the market price on the date that the Company and Mr. Gleeson agreed to his engagement as general counsel. The options were not tied to any performance standards because at the time, given the Company’s limited amount of sales and its lack of profitability, it was deemed that the meaningful performance standards could not be established. The Company did not use compensation consultants in connection with Mr. Gleeson’s engagement.
Compensation Committee Report
The Board of Directors acting as the compensation committee, has reviewed and discussed the Compensation Discussion and Analysis with management and based on such review and discussions, the Board of Directors recommended and determined to include the Annual Report on Form 10-K. The Board of Directors include: John Levy (Chairman), David Taft, Evan Stone, and Andre Zeitoun.
Narrative disclosure of the compensation policies and practices as they relate to the risk management.
The Company does not believe that its compensation policies and practices for its employees and Material Advisors, LLC (cash compensation and at-the-market or above-market five- and ten-year options without performance standards), are reasonably likely to have a material adverse effect on the Company, as they relate to risk management practices and risk-taking incentives.
In 2011 no options were exercised by any director, Material Advisors, LLC or any named executive officer.
The Company does not have any pension plan nor does it have any nonqualified defined contribution and other nonqualified deferred compensation plans
27
|
ITEM 12.
|
SECURITY OWNERSHIP OF CERTAIN BENEFICIAL OWNERS AND MANAGEMENT AND RELATED STOCKHOLDER MATTERS
|
Security Ownership of Certain Beneficial Owners and Management
Authorized Shares
As of April 26, 2012, the Company had:
|
·
|
120,000,000 authorized shares of Common Stock;
|
|
·
|
89,120,360 issued shares of Common Stock
|
|
·
|
107,636,701 issued shares of Common Stock, assuming the exercise of outstanding stock options and warrants
|
Ownership Tables
The following table sets forth, as of April 26, 2012, information regarding the beneficial ownership of our common stock with respect to each of the named executive officers, each of our directors, each person known by us to own beneficially more than 5% of the common stock, and all of our directors and executive officers as a group. Each individual or entity named has sole investment and voting power with respect to shares of common stock indicated as beneficially owned by them, subject to community property laws, where applicable, except where otherwise noted. The percentage of common stock beneficially owned is based on 89,120,360 shares of common stock outstanding as of April 26, 2012 plus a person’s shares subject to options granted that have vested.
|
Number of Shares of
|
Percentage of Common
|
|||
|
Common Stock
|
Stock Beneficially
|
|||
|
Name and Address (1)
|
Beneficially Owned (2)
|
Owned
|
||
|
Andre Zeitoun (3) (4) (7)
|
5,903,479
|
6.3%
|
||
|
John Levy (4) (5)
|
397,624
|
*
|
||
|
David Taft (4) (8) (9)
|
22,339,053
|
25.1%
|
||
|
Evan Stone (4) (6)
|
285,561
|
*
|
||
|
Christopher Carney (3) (7)
|
2,414,711
|
2.7%
|
||
|
William Gleeson (2) (3)
|
225,000
|
*
|
||
|
All Officers and Directors as a Group
|
31,565,428
|
32.9%
|
||
|
IBS Capital, LLC
|
22,339,053
|
25.1%
|
||
|
Samlyn Capital, LLC (10) (11)
|
15,000,000
|
15.9%
|
||
|
Material Advisors, LLC
|
7,793,549
|
8.3%
|
||
|
* Less than 1%
|
|
(1)
|
Unless otherwise indicated, the address of the persons named in this column is c/o Applied Minerals, Inc., 110 Greene Street, Suite 1101, New York, NY 10012.
|
|
(2)
|
Included in this calculation are shares deemed beneficially owned by virtue of the individual’s right to acquire them within 60 days of the date of this report that would be required to be reported pursuant to Rule 13d-3 of the Securities Exchange Act of 1934. Except as noted below, all shares are owned directly and the person has sole voting power.
|
|
(3)
|
Executive Officer.
|
|
(4)
|
Director.
|
|
(5)
|
Mr. Levy’s holdings include options to purchase 301,667 shares of common stock between $.070 and $1.00 per share. The term of Mr. Levy’s options is 5 years.
|
|
(6)
|
Mr. Stone’s holdings include options to purchase 200,481 shares of common stock at $0.83 per share. The term of the options is 5 years.
|
|
(7)
|
Number of shares includes 4,676,129 shares issuable to Andre Zeitoun and 1,558,711 shares issuable to Christopher Carney on the exercise of options that have vested or will vest within 60 days of April 26, 2012. Shares issuable through the exercise of these options are attributed to the respective ownership interests in Material Advisors, LLC of Mr. Zeitoun and Mr. Carney.
|
|
(8)
|
Mr. Taft is the president of IBS Capital LLC. He has beneficial ownership of shares owned by funds of which IBS Capital LLC is the general partner or investment manager, having sole voting and investment power.
|
|
(9)
|
IBS Capital, LLC, One International Place, Boston, Massachusetts 02110, is the beneficial owner of shares held by funds it manages by virtue of the right to vote and dispose of the securities. One fund, The IBS Turnaround Fund (QP) (A Limited Partnership), owned 12,724,747 shares (14.2% of shares outstanding) at April 26, 2012. Another fund, The IBS Turnaround Fund (A Limited Partnership), owned 5,692,712 shares (6.4% of outstanding shares) at April 26, 2012. Another fund, The IBS Opportunity Fund, Ltd, owned 3,921,594 shares (4.4% of outstanding shares) at April 26, 2012.
|
28
|
(10)
|
Samlyn Capital, LLC, 500 Park Avenue, 2nd Floor, New York, N.Y. 10022, is the beneficial owner of shares held by funds it manages by virtue of the right to vote and dispose of the securities. One fund, Samlyn Onshore Fund, L.P., owned, at April 26, 2012, 3,850,000 shares and a warrant to purchase 1,925,000 shares of common stock for $2.00 per share. Another fund, Samlyn Offshore Master Fund, Ltd., owned, at April 26, 2012, 6,150,000 shares of common stock and a warrant to purchase 3,075,000 shares of common stock for $2.00 per share. The ownership of Samlyn Onshore Fund, L.P. is 6.1% adjusted for the dilutive effect of the options issued to Samlyn Onshore Fund, L.P. and Samlyn Offshore Master Fund, Ltd. The ownership of Samlyn Offshore Master Fund, Ltd. is 9.8% adjusted for the dilutive effect of the options issued to Samlyn Onshore Fund, L.P. and Samlyn Offshore Master Fund, Ltd.
|
|
(11)
|
Robert Pohly is the president of Samlyn Capital, LLC. He has beneficial ownership of shares owned by funds of which IBS Capital LLC is the general partner or investment manager, having sole voting and investment power.
|
ITEM 13. CERTAIN RELATIONSHIPS AND RELATED TRANSACTIONS AND
DIRECTOR INDEPENDENCE
Review, approval or ratification of transactions with related persons.
Our Board of Directors reviews any transaction involving the Company and a related party before the transaction or upon any significant change in the transaction or relationship. There are no limitations on the types of transactions, except for ordinary business travel and entertainment. There are no set standards other than fairness. For these purposes, a related party transaction includes any transaction required to be disclosed pursuant to Item 404 of Regulation S-K of the SEC.
Transactions with Related Persons
Stock Purchase Transactions
David A. Taft, a director, is the president of IBS Capital LLC (“IBS”), a Massachusetts limited liability company, whose principal business is investing in securities. IBS is the general partner of the IBS Turnaround Fund (QP), which is a Massachusetts limited partnership, and IBS Turnaround Fund (LP), which is a Massachusetts limited partnership. Set forth below are purchases of Common Stock from the Company by the funds since January 1, 2011:
|
Date of Purchase
|
The IBS Turnaround Fund (QP) (A Limited Partnership)
|
The IBS Turnaround Fund (A Limited Partnership)
|
The IBS Opportunity Fund, Ltd.
|
Price Per Share
|
||||
|
March 28, 2011
|
1,385,000
|
459,000
|
656,000
|
$ 0.80
|
||||
|
June 27, 2011
|
706,000
|
205,000
|
338,750
|
$ 1.60
|
The above sales of shares of common stocks were used to fund the Company’s operations. The stock sold on March 28, 2011 was priced at the closing price of the Company’s common stock on March 25, 2011. The stock sold on June 27, 2011 was priced at a slight premium to the closing price of the Company’s common stock on June 24, 2011
Director Independence
The only directors deemed to be independent under the independence standards of Nasdaq are Messrs. Levy and Stone. They are also independent under the enhanced independence standards of Section 10A-3 of the Securities Exchange Act. Messrs. Zeitoun and Taft are not independent under the Nasdaq standards of independence. Mr. Zeitoun is an employee. Mr. Taft is not independent because of the size of his security holdings.
29
ITEM 14. PRINCIPAL ACCOUNTING FEES AND SERVICES
PMB Helin Donovan, LLP was selected by our Board of Directors as the Company’s independent accountant for the fiscal year ending December 31, 2011 and for the fiscal year ending December 31, 2009 . Representatives of PMB Helin Donovan will not be attending the shareholder meeting.
Fees payable to PMB
The following table presents fees for audit services rendered by PMB Helin Donovan, the independent auditor for the audit of the Company’s annual consolidated financial statements for the years ended December 31, 2011 and 2010.
|
PMB Helin Donovan, LLC
|
||||
|
December 31, 2011
|
December 31, 2010
|
|||
|
Audit Fees
|
$ 90,000
|
$ 126,000
|
||
|
Audit-Related Fees
|
- 0 -
|
- 0 -
|
||
|
Tax Fees (1)
|
8,000
|
40,000
|
||
|
All Other Fees (2)
|
- 0 -
|
- 0 -
|
||
|
Total
|
$ 98,000
|
$ 166,000
|
||
|
(1)
|
Tax fees represent the aggregate fees paid for professional services, principally including fees for tax compliance and tax advice.
|
|
(2)
|
All other fees represent the aggregate fees paid for products and services that are not included in the “Audit fees,” “Audi-related fees,” and “Tax fees” sections. The Audit Committee has considered whether the provision of non-audit services is compatible with maintaining the principal registered public accounting firm’s independence.
|
30
ITEM 15. EXHIBITS
|
Exhibit
|
||
|
Number
|
Description of Exhibit
|
|
|
3.1
|
Articles of Incorporation, as amended
|
(1)
|
|
3.2
|
Bylaws, as amended
|
(2)
|
|
4.1
|
Form on 10% PIK Election Convertible Note and related Registration Rights Agreement issued December 30, 2008
|
(3)
|
|
4.2
|
Form on 10% PIK Election Convertible Note and related Registration Rights Agreement issued April 7 – 9, 2009
|
(4)
|
|
4.3
|
Form on 10% PIK Election Convertible Note and related Registration Rights Agreement issued May 1, 2009
|
(5)
|
|
4.4
|
Form on 10% PIK Election Convertible Note and related Registration Rights Agreement issued July 28, 2009
|
(6)
|
|
4.5
|
Form on 10% PIK Election Convertible Note and related Registration Rights Agreement issued October 26, 2009
|
(7)
|
|
4.6
|
Form on 10% PIK Election Convertible Note and related Registration Rights Agreement issued May 17, 2010
|
(8)
|
|
4.7
|
Form on 10% PIK Election Convertible Note and related Registration Rights Agreement issued October 25, 2010
|
(9)
|
|
10.1
|
Lyon Employment Agreement
|
(10)
|
|
10.2
|
Amendment to Lyon Employment Agreement
|
(11)
|
|
10.3
|
Compensation arrangements of directors
|
(12)
|
|
10.4
|
Amendment to compensation arrangements of directors
|
(13)
|
|
10.5
|
Compensation arrangements of director Taft
|
(14)
|
|
10.6
|
Consulting Agreement with Morris Weiss
|
(15)
|
|
10.7
|
Additional Consulting Agreement with Morris Weiss
|
(16)
|
|
10.8
|
Ronald Price separation agreement
|
(17)
|
|
10.9
|
Agreement with Material Advisors LLC
|
(18)
|
|
10.10
|
Agreement for Appointment of Agent for the Sale of Assets with AAMCOR LLC
|
(19)
|
|
10.11
|
Settlement Agreement (“Class Action Settlement Agreement”) with the lead plaintiffs in the class action In Re Atlas Mining Company Securities Litigation
|
(20)
|
|
10.12
|
Settlement Agreement with William Jacobson
|
(21)
|
|
10.13
|
Settlement Agreement with Robert Dumont
|
(22)
|
|
10.14
|
Terms of private placements of securities
|
(23)
|
|
10.15
|
2012 Management Agreement
|
|
|
31.1
|
Certification pursuant to Rule 13a-14 of the Securities Exchange Act, as adopted pursuant to Section 302 of the Sarbanes-Oxley Act of 2002, of the Principal Executive Officer
|
|
|
31.2
|
Certification pursuant to Rule 13a-14 of the Securities Exchange Act, as adopted pursuant to Section 302 of the Sarbanes-Oxley Act of 2002, of the Principal Financial Officer
|
|
|
32.1
|
Certification pursuant to 18 U.S.C. Section 1350, as adopted pursuant to Section 906 of the Sarbanes-Oxley Act of 2002, of the Principal Financial Officer
|
|
|
32.2
|
Certification pursuant to 18 U.S.C. Section 1350, as adopted pursuant to Section 906 of the Sarbanes-Oxley Act of 2002, of the Principal Financial Officer
|
|
|
95
|
Mine Safety Discloure
|
31
|
1)
|
Incorporated by reference to exhibit 99.1 included in the Registrant's Current Report on Form 8-K, filed on November 3, 20009
|
|
2)
|
Incorporated by reference to exhibit 99.2 included in the Registrant's Current Report on Form 8-K filed November 3, 2009.
|
|
3)
|
Incorporated by reference to exhibits 99.2 and 99.3 included in the Registrant's Current Report on Form 8-K filed January 7, 2009.
|
|
4)
|
Incorporated by reference to exhibits 99.1 and 99.2 included in the Registrant's Current Report on Form 8-K filed April 10, 2009
|
|
5)
|
Incorporated by reference to exhibits 99.1 and 99.2 included in the Registrant's Current Report on Form 8-K filed May 4, 2009.
|
|
6)
|
Incorporated by reference to exhibits 99.1 and 99.2 included in the Registrant's Current Report on Form 8-K filed July 28, 2009.
|
|
7)
|
Incorporated by reference to exhibits 99.1 and 99.2 included in the Registrant's Current Report on Form 8-K filed October 26, 2009.
|
|
8)
|
Incorporated by reference to exhibits 99.1 and 99.2 included in the Registrant's Current Report on Form 8-K filed May 20, 2010.
|
|
9)
|
Incorporated by reference to exhibits 99.1 and 99.2 included in the Registrant's Current Report on Form 8-K filed October 28, 2010.
|
|
10)
|
Incorporated by reference to exhibit 99.1 included in the Registrant's Current Report on Form 8-K filed on July 3, 2008
|
|
11)
|
Incorporated by reference to Item 8.01included in the Registrant's Current Report on Form 8-K filed on October 2, 2008
|
|
12)
|
Incorporated by reference to Item 5.02 (ii) and (iii) included in the Registrant's Current Report on Form 8-K filed on January 17, 2008
|
|
13)
|
Incorporated by reference to Item 8.01 included in the Registrant's Current Report on Form 8-K filed on October 2, 2008
|
|
14)
|
Incorporated by reference to Item 5.02 included in the Registrant's Current Report on Form 8-K filed on October 22, 2008
|
|
15)
|
Incorporated by reference to exhibit 99.4 included in the Registrant's Current Report on Form 8-K filed on May 4, 2009
|
|
16)
|
Incorporated by reference to Item 5.02 included in the Registrant's Current Report on Form 8-K filed on May 4, 2009.
|
|
17)
|
Incorporated by reference to exhibit 10.11 in the Registrant’s Form 10-K filed on July 28, 2009
|
|
18)
|
Incorporated by reference to exhibit 99.1 included in the Registrant's Current Report on Form 8-K filed on January 7, 2009
|
|
19)
|
Incorporated by reference to exhibit 10.13 in the Registrant’s Form 10-K filed on July 28, 2009
|
|
20)
|
Incorporated by reference to exhibit 10.14 in the Registrant’s Form 10-K filed on July 28, 2009
|
|
21)
|
Incorporated by reference to exhibit 10.15 in the Registrant’s Form 10-K filed on July 28, 2009
|
|
22)
|
Incorporated by reference to exhibit 10.16 in the Registrant’s Form 10-K filed on July 28, 2009
|
|
23)
|
Incorporated by reference to Items 3.02, 8.01, 8.01,2.03, 2.03, 2.03 and 2.03 included in the Registrant's Current Reports on Form 8-K filed on January 16, 2009, May 29, 2008, September 29, 2008, January 7, 2009, April 10, 2009, May 4, 2009, October 26, 2009, May 20, 2010, October 28, 2010, March 31, 2011, April 18, 2011, June 27, 2011, and December 27, 2011.
|
32
PART IV
ITEM 16. EXHIBITS AND FINANCIAL STATEMENT SCHEDULES
|
Page
|
|
|
Report of Independent Registered Public Accounting Firm
|
F-1
|
|
Financial Statements:
|
|
|
Balance Sheets at December 31, 2011 and 2010
|
F-3 – F-4
|
|
Statements of Operations and Comprehensive Loss for Years Ended December 31, 2011, 2010, and 2009
|
F-5 – F-7
|
|
Statements of Shareholders’ Equity for the Years Ended December 31, 2011, 2010, and 2009
|
F8
|
|
Statements of Cash Flows for Years Ended December 31, 2011, 2010, and 2009
|
F-9 – F-10
|
|
Notes to Financial Statements
|
F-11 – F-23
|
F -1
REPORT OF INDEPENDENT REGISTERED PUBLIC ACCOUNTING FIRM
To the Board of Directors and Stockholders’ of Applied Minerals, Inc.:
We have audited the accompanying balance sheets of Applied Minerals, Inc. (the “Company”) (exploration stage company) as of December 31, 2011 and 2010, and the related statements of operations and comprehensive loss, stockholders’ equity (deficit), and cash flows for the years ended December 31, 2011, 2010 and 2009, and the cumulative period from inception (January 1, 2009) through December 31, 2011. Applied Minerals, Inc. management is responsible for these financial statements. Our responsibility is to express an opinion on these financial statements based on our audits.
We conducted our audits in accordance with the standards of the Public Company Accounting Oversight Board (United States). Those standards require that we plan and perform the audit to obtain reasonable assurance about whether the financial statement is free of material misstatement. An audit includes examining, on a test basis, evidence supporting the amounts and disclosures in the financial statement. An audit also includes assessing the accounting principles used and significant estimates made by management, as well as evaluating the overall financial statement presentation. We believe that our audits provide a reasonable basis for our opinion.
In our opinion, the financial statements referred to above present fairly, in all material respects, the financial position of Applied Minerals, Inc. as of December 31, 2011 and 2010, and the results of its operations and its cash flows for each of the years in the three-year period ended December 31, 2011, in conformity with U.S. generally accepted accounting principles.
We also have audited, in accordance with the standards of the Public Company Accounting Oversight Board (United States), Applied Minerals, Inc.’s internal control over financial reporting as of December 31, 2011, based on criteria established in Internal Control — Integrated Framework issued by the Committee of Sponsoring Organizations of the Treadway Commission (COSO), and our report dated March 15, 2012 expressed an unqualified opinion on the effectiveness of the Company’s internal control over financial reporting and an adverse opinion on the effectiveness of the Company’s internal control over financial reporting .
PMB Helin Donovan, LLP
/s/PMB Helin Donovan, LLP
Seattle, Washington
March 15, 2012
F -2
|
APPLIED MINERALS, INC.
|
||||
|
(An Exploration Stage Mining Company)
|
||||
|
BALANCE SHEETS
|
||||
|
December 31,
|
December 31,
|
|||
|
2011
|
2010
|
|||
|
Current Assets
|
||||
|
Cash and cash equivalents
|
$ 10,170,536
|
$ 1,642,340
|
||
|
Accounts receivable, net of allowance of $11,938 and $0 at December 31, 2011 and 2010, respectively
|
20,464
|
61,275
|
||
|
Mining supplies inventory
|
-0-
|
3,503
|
||
|
Deposits and prepaid expenses
|
333,447
|
178,738
|
||
|
Total Current Assets
|
10,524,447
|
1,885,856
|
||
|
Property and Equipment
|
||||
|
Land and tunnels
|
500,000
|
523,729
|
||
|
Land improvements
|
164,758
|
164,758
|
||
|
Buildings
|
455,906
|
432,997
|
||
|
Mining equipment
|
975,164
|
588,523
|
||
|
Milling equipment
|
336,146
|
333,483
|
||
|
Laboratory equipment
|
67,728
|
67,728
|
||
|
Office furniture and equipment
|
34,643
|
27,419
|
||
|
Vehicles
|
100,800
|
75,013
|
||
|
Less: Accumulated Depreciation
|
(729,969)
|
(481,364)
|
||
|
Total Property and Equipment
|
1,905,176
|
1,732,286
|
||
|
Other Assets
|
||||
|
Assets held for sale
|
445,180
|
450,042
|
||
|
Deferred financing cost
|
-0-
|
146,939
|
||
|
Total Other Assets
|
445,180
|
596,981
|
||
|
TOTAL ASSETS
|
$ 12,874,803
|
$ 4,215,123
|
||
|
The accompanying notes are an integral part of these financial statements.
|
||||
F -3
|
APPLIED MINERALS, INC.
|
||||
|
(An Exploration Stage Mining Company)
|
||||
|
BALANCE SHEETS
|
||||
|
December 31,
|
December 31,
|
|||
|
2011
|
2010
|
|||
|
Current Liabilities
|
||||
|
Accounts payable and accrued liabilities
|
$ 291,142
|
$ 266,139
|
||
|
Liabilities from discontinued operations
|
-0-
|
1,152
|
||
|
Stock awards payable
|
127,000
|
80,000
|
||
|
Current portion of notes payable
|
165,375
|
206,209
|
||
|
Current portion of leases payable
|
10,094
|
167,956
|
||
|
Warrant derivative
|
3,355,000
|
-0-
|
||
|
Total Current Liabilities
|
3,948,611
|
721,456
|
||
|
Long-Term Liabilities
|
||||
|
Long-term portion of notes payable
|
-0-
|
361,295
|
||
|
Long-term portion of leases payable
|
97,769
|
10,094
|
||
|
Convertible debt (PIK Notes)
|
-0-
|
4,683,624
|
||
|
Total Long-Term Liabilities
|
97,769
|
5,055,013
|
||
|
TOTAL LIABILITIES
|
4,046,380
|
5,776,469
|
||
|
Commitments and Contingencies
|
-0-
|
- 0 -
|
||
|
Stockholders’ Equity (Deficit)
|
||||
|
Preferred stock, $0.001 par value, 10,000,000
|
||||
|
shares authorized, noncumulative, nonvoting,
|
||||
|
nonconvertible, none issued or outstanding
|
-0-
|
- 0 -
|
||
|
Common stock, $0.001 par value, 120,000,000
|
||||
|
shares authorized, 89,119,405 and 69,704,393
|
||||
|
shares issued and outstanding at December 31, 2011
|
||||
|
and December 31, 2010, respectively
|
89,120
|
69,704
|
||
|
Additional paid-in capital
|
47,765,350
|
29,860,041
|
||
|
Accumulated deficit prior to the exploration stage
|
(20,009,496)
|
(20,009,496)
|
||
|
Accumulated deficit during the exploration stage
|
(19,016,551)
|
(11,533,915)
|
||
|
Total Applied Minerals, Inc.
|
||||
|
stockholders’ equity (deficit)
|
8,828,423
|
(1,613,666)
|
||
|
Non-controlling interest
|
-0-
|
52,320
|
||
|
Total Stockholders’ Equity (Deficit)
|
8,828,423
|
(1,561,346)
|
||
|
TOTAL LIABILITIES AND
|
||||
|
STOCKHOLDERS’ EQUITY (DEFICIT)
|
$ 12,874,803
|
$ 4,215,123
|
||
|
The accompanying notes are an integral part of these financial statements.
|
||||
F -4
|
APPLIED MINERALS, INC.
|
|||||||||
|
(An Exploration Stage Mining Company)
|
|||||||||
|
STATEMENTS OF OPERATIONS
|
|||||||||
|
For the Period
|
|||||||||
|
January 1, 2009
|
|||||||||
|
(Beginning of
|
|||||||||
|
Exploration
|
|||||||||
|
For the year ended
|
Stage) through
|
||||||||
|
December 31,
|
December 31,
|
||||||||
|
2011
|
2010
|
2009
|
2011
|
||||||
|
REVENUES
|
$ 92,952
|
$ - 0 -
|
$ - 0 -
|
$92,952
|
|||||
|
COST OF SALES
|
80,578
|
- 0 -
|
- 0 -
|
80,578
|
|||||
|
Gross Profit
|
12,374
|
- 0 -
|
- 0 -
|
12,374
|
|||||
|
OPERATING (INCOME)
|
|||||||||
|
EXPENSES:
|
|||||||||
|
Exploration costs
|
2,919,306
|
2,307,202
|
1,299,753
|
6,526,261
|
|||||
|
General and administrative
|
4,261,175
|
2,490,347
|
4,683,914
|
11,435,436
|
|||||
|
(Gain) loss from disposition
|
|||||||||
|
of land and equipment
|
(1,000)
|
(3,113)
|
(410)
|
(4,523)
|
|||||
|
Loss on impairment of equipment
|
-0-
|
13,080
|
42,042
|
55,122
|
|||||
|
Total Operating Expenses
|
7,179,481
|
4,807,516
|
6,025,299
|
18,012,296
|
|||||
|
Net Operating Loss
|
(7,167,107)
|
(4,807,516)
|
(6,025,299)
|
(17,999,922)
|
|||||
|
OTHER INCOME (EXPENSE):
|
|||||||||
|
Interest income
|
1,176
|
957
|
448
|
2,581
|
|||||
|
Interest expense
|
(387,684)
|
(248,047)
|
(310,554)
|
(946,285)
|
|||||
|
Sale of clay samples
|
-0-
|
4,943
|
6,000
|
10,943
|
|||||
|
Refund of insurance premium
|
-0-
|
6,370
|
13,786
|
20,156
|
|||||
|
Gain on stock award forfeiture
|
-0-
|
145,000
|
-0-
|
145,000
|
|||||
|
Gain(loss) on revaluation of warrants
|
225,000
|
-0-
|
-0-
|
225,000
|
|||||
|
Gain (loss) on revaluation
|
|||||||||
|
of stock awards
|
(47,000)
|
(22,000)
|
(150,500)
|
(219,500)
|
|||||
|
Net proceeds (expenses)
|
|||||||||
|
from legal settlement
|
-0-
|
(292,238)
|
118,913
|
(173,325)
|
|||||
|
Amortization of deferred
|
|||||||||
|
financing costs
|
(146,939)
|
(3,061)
|
-0-
|
(150,000)
|
|||||
|
Amortization of convertible
|
|||||||||
|
debt discount
|
-0-
|
(2,194)
|
(363,147)
|
(365,341)
|
|||||
|
Gain on settlement of debt
|
101,380
|
333,502
|
-0-
|
434,882
|
|||||
|
Other income (expense)
|
(3,370)
|
(7,241)
|
8,855
|
(1,802)
|
|||||
|
Total Other Income (Expense)
|
(257,437)
|
(84,009)
|
(676,199)
|
(1,017,691)
|
|||||
|
Loss from exploration stage,
|
|||||||||
|
before income taxes
|
(7,424,544)
|
(4,891,525)
|
(6,701,498)
|
(19,017,613)
|
|||||
|
Provision (benefit) for income taxes
|
-0-
|
- 0 -
|
- 0 -
|
-0-
|
|||||
|
Net Loss from Exploration Stage
|
|||||||||
|
Before Discontinued Operations
|
(7,424,544)
|
(4,891,525)
|
(6,701,498)
|
(19,017,613)
|
|||||
|
Net income (loss) from
|
|||||||||
|
discontinued operations
|
(5,772)
|
123,828
|
(64,674)
|
53,382
|
|||||
|
Net loss from exploration stage
|
|||||||||
|
after discontinued operations
|
(7,430,316)
|
(4,767,697)
|
(6,766,172)
|
(18,964,230)
|
|||||
|
Net income attributable to non-
|
|||||||||
|
controlling interest
|
(52,320)
|
-0-
|
-0-
|
(52,320)
|
|||||
|
Net Loss Attributable to
|
|||||||||
|
Applied Minerals, Inc.
|
$ (7,482,636)
|
$ (4,767,697)
|
$ (6,766,172)
|
$ (19,016,551)
|
|||||
|
The accompanying notes are an integral part of these financial statements.
|
|||||||||
F -5
|
APPLIED MINERALS, INC.
|
|||||
|
(An Exploration Stage Mining Company)
|
|||||
|
STATEMENTS OF OPERATIONS
|
|||||
|
(continued)
|
|||||
|
For the year ended
|
|||||
|
December 31,
|
|||||
|
2011
|
2010
|
2009
|
|||
|
Earnings Per Share Information (Basic and Diluted):
|
|||||
|
Net loss per share before discontinued operations
|
$ (0.10)
|
$ (0.07)
|
$ (0.011)
|
||
|
Discontinued operations
|
-0-
|
- 0 -
|
- 0 -
|
||
|
Net Loss Per Share
|
$ (0.10)
|
$ (0.07)
|
$ (0.11)
|
||
|
Weighted Average Shares Outstanding (basic and diluted)
|
74,568,658
|
68,396,770
|
60,665,785
|
||
|
The accompanying notes are an integral part of these financial statements.
|
|||||
F -6
|
APPLIED MINERALS, INC.
|
||||||||
|
(An Exploration Stage Mining Company)
|
||||||||
|
STATEMENTS OF OPERATIONS AND COMPREHENSIVE LOSS
|
||||||||
|
For the Period
|
||||||||
|
January 1, 2009
|
||||||||
|
(Beginning of
|
||||||||
|
Exploration
|
||||||||
|
For the year ended
|
Stage) through
|
|||||||
|
December 31,
|
December 31,
|
|||||||
|
2011
|
2010
|
2009
|
2011
|
|||||
|
Net Loss
|
$ (7,482,636)
|
$ (4,767,715)
|
$ (6,766,200)
|
$(19,016,551)
|
||||
|
Change in Market Value of Investments
|
-0-
|
1,327
|
(1,327)
|
-0-
|
||||
|
Net Comprehensive Loss
|
$ (7,534,956)
|
$ (4,766,388)
|
$ (6,767,527)
|
$ (19,016,551)
|
||||
|
The accompanying notes are an integral part of these financial statements.
|
||||||||
F -7
|
APPLIED MINERALS, INC.
|
|||||||||||||||
|
(An Exploration Stage Mining Company)
|
|||||||||||||||
|
Statements of Stockholders’ Equity (Deficit)
|
|||||||||||||||
|
For the years ended December 31, 2011, 2010, and 2009
|
|||||||||||||||
|
Accumulated
|
Accumulated
|
Other
|
Total
|
||||||||||||
|
Common Stock
|
Deficit
|
Deficit
|
Compre-
|
Non-
|
Stock-
|
||||||||||
|
Additional
|
Prior to
|
During
|
hensive
|
Control-
|
holders’
|
||||||||||
|
Paid-In
|
Exploration
|
Exploration
|
Income
|
ling
|
Equity
|
||||||||||
|
Shares
|
Amount
|
Capital
|
Stage
|
Stage
|
(Loss)
|
Interest
|
(Deficit)
|
||||||||
|
Beginning Balance,
|
|||||||||||||||
|
January 1, 2009
|
59,215,628
|
$ 59,216
|
$ 22,096,327
|
$ (20,009,496)
|
$ - 0 -
|
$ (1,466)
|
$ 52,415
|
$ 2,196,996
|
|||||||
|
Shares issued for directors fees
|
78,497
|
78
|
17,172
|
--
|
--
|
--
|
--
|
17,250
|
|||||||
|
Issuance of common stock for
|
|||||||||||||||
|
conversion of debt including
|
|||||||||||||||
|
accrued interest
|
10,487,226
|
10,487
|
4,085,434
|
--
|
--
|
--
|
--
|
4,095,921
|
|||||||
|
Amortization of convertible
|
|||||||||||||||
|
debt discount
|
--
|
--
|
365,341
|
--
|
--
|
--
|
--
|
365,341
|
|||||||
|
Fair value of stock options and
|
|||||||||||||||
|
warrants issued to directors
|
|||||||||||||||
|
and consultants
|
--
|
--
|
401,234
|
--
|
--
|
--
|
--
|
401,234
|
|||||||
|
Net change in unrealized gain
|
|||||||||||||||
|
on available for sale securities
|
--
|
--
|
--
|
--
|
--
|
139
|
--
|
139
|
|||||||
|
Change in non-controlling interest
|
--
|
--
|
--
|
--
|
--
|
--
|
(77)
|
(77)
|
|||||||
|
Net loss
|
(6,766,172)
|
(6,766,172)
|
|||||||||||||
|
Balance, December 31, 2009
|
69,781,351
|
69,781
|
26,965,508
|
(20,009,496)
|
(6,766,200)
|
(1,327)
|
52,338
|
310,604
|
|||||||
|
Shares issued for directors fees
|
81,911
|
82
|
64,997
|
--
|
--
|
--
|
--
|
65,079
|
|||||||
|
Issuance of common stock for
|
|||||||||||||||
|
conversion of debt including
|
|||||||||||||||
|
accrued interest
|
2,457,500
|
2,458
|
2,341,464
|
--
|
--
|
--
|
--
|
2,343,922
|
|||||||
|
Fair value of stock options and
|
|||||||||||||||
|
warrants issued to directors
|
|||||||||||||||
|
and consultants
|
--
|
--
|
334,669
|
--
|
--
|
--
|
--
|
334,669
|
|||||||
|
Shares canceled from forfeiture
|
|||||||||||||||
|
agreed upon in legal settlement
|
(3,044,083)
|
(3,045)
|
(166,955)
|
--
|
--
|
--
|
--
|
(170,000)
|
|||||||
|
Change in non-controlling interest
|
--
|
--
|
--
|
--
|
--
|
--
|
(18)
|
(18)
|
|||||||
|
Net Loss
|
--
|
--
|
--
|
--
|
(4,767,715)
|
1,327
|
--
|
(4,766,388)
|
|||||||
|
Balance, December 31, 2010
|
69,704,393
|
69,704
|
29,860,041
|
(20,009,496)
|
(11,533,915)
|
--
|
52,320
|
(1,561,346)
|
|||||||
|
Shares issued to related parties
|
|||||||||||||||
|
related to forbearance agreement
|
427,714
|
428
|
320,358
|
--
|
--
|
--
|
--
|
320,786
|
|||||||
|
Shares issued for directors fees
|
|||||||||||||||
|
and other services
|
97,612
|
98
|
118,301
|
--
|
--
|
--
|
--
|
118,399
|
|||||||
|
Issuance of common stock for
|
|||||||||||||||
|
conversion of debt including
|
|||||||||||||||
|
accrued interest
|
5,019,895
|
5,020
|
5,014,875
|
--
|
--
|
--
|
--
|
5,019,895
|
|||||||
|
Fair value of stock options and
|
|||||||||||||||
|
warrants issued to directors
|
|||||||||||||||
|
and consultants
|
--
|
--
|
2,181,394
|
--
|
--
|
--
|
--
|
2,181,394
|
|||||||
|
Shares issued for cashless option
|
|||||||||||||||
|
and warrant exercise
|
47,505
|
48
|
(48)
|
--
|
--
|
--
|
--
|
--
|
|||||||
|
Shares issued for cash
|
14,250,000
|
14,250
|
10,590,787
|
--
|
--
|
--
|
--
|
10,605,037
|
|||||||
|
Impairment of consolidation
|
--
|
--
|
--
|
--
|
--
|
(52,320)
|
(52,320)
|
||||||||
|
Net Loss
|
--
|
--
|
--
|
--
|
(7,482,636)
|
--
|
--
|
(7,482,636)
|
|||||||
|
Balance, December 31, 2011
|
89,119,405
|
$ 89,120
|
$ 47,765,350
|
$ (20,009,496)
|
$ (19,016,551)
|
$ - 0 -
|
$ -0-
|
$ 8,828,423
|
|||||||
|
The accompanying notes are an integral part of these consolidated financial statements.
|
|||||||||||||||
F -8
|
APPLIED MINERALS, INC.
|
|||||||||
|
(An Exploration Stage Mining Company)
|
|||||||||
|
STATEMENTS OF CASH FLOWS
|
|||||||||
|
For the Period
|
|||||||||
|
January 1, 2009
|
|||||||||
|
(Beginning of
|
|||||||||
|
For the year ended
|
Exploration Stage)
|
||||||||
|
December 31,
|
through
|
||||||||
|
2011
|
2010
|
2009
|
December 31, 2011
|
||||||
|
Cash flows from operating activities:
|
|||||||||
|
Net loss
|
$ (7,482,636)
|
$ (4,767,697)
|
$ (6,766,172)
|
$ (19,016,551)
|
|||||
|
Adjustments to reconcile net loss to
|
|||||||||
|
net cash used in operations:
|
|||||||||
|
Depreciation
|
248,605
|
162,859
|
123,733
|
535,197
|
|||||
|
Amortization of deferred financing costs
|
146,939
|
3,061
|
-0-
|
150,000
|
|||||
|
Amortization of discount – PIK Notes
|
-0-
|
2,194
|
365,340
|
367,534
|
|||||
|
Issuance of PIK Notes in payment of interest
|
342,884
|
238,399
|
282,587
|
863,870
|
|||||
|
Stock issued for director and consulting services
|
118,436
|
65,079
|
17,250
|
200,765
|
|||||
|
Fair value of warrants and options
|
|||||||||
|
issued to consultants and directors
|
2,181,394
|
334,669
|
401,234
|
2,917,297
|
|||||
|
Gain on revaluation of stock warrants
|
(225,000)
|
-0-
|
-0-
|
(225,000)
|
|||||
|
Loss on revaluation of stock awards
|
47,000
|
22,000
|
150,500
|
219,500
|
|||||
|
Gain on stock award forfeiture
|
-0-
|
(145,000)
|
-0-
|
(145,000)
|
|||||
|
(Gain) Loss on disposition of assets
|
(1,000)
|
(3,113)
|
(410)
|
(4,523)
|
|||||
|
Gain on settlement of debts
|
(101,380)
|
-0-
|
-0-
|
(101,380)
|
|||||
|
Other non-cash expense (income)
|
(28,587)
|
-0-
|
-0-
|
(28,587)
|
|||||
|
Provision for doubtful accounts
|
11,938
|
-0-
|
-0-
|
11,938
|
|||||
|
Loss on impairment of assets
|
4,862
|
19,977
|
42,042
|
66,881
|
|||||
|
Change in operating assets and liabilities:
|
|||||||||
|
(Increase) Decrease in:
|
|||||||||
|
Accounts receivable
|
28,873
|
(61,275)
|
44
|
(32,358)
|
|||||
|
Mining supplies inventory
|
3,503
|
(3,503)
|
-0-
|
-0-
|
|||||
|
Deposits and prepaid expenses
|
(12,801)
|
(33,196)
|
136,764
|
90,767)
|
|||||
|
Increase (Decrease) in:
|
|||||||||
|
Accounts payable and accrued expenses
|
18,387
|
(134,476)
|
305,656
|
189,567
|
|||||
|
Net cash used by discontinued operations
|
(1,152)
|
118,011
|
486,680
|
603,585
|
|||||
|
Net cash used by operating activities
|
(4,699,735)
|
(4,182,011)
|
(4,454,752)
|
(13,336,498)
|
|||||
|
Cash flows from investing activities:
|
|||||||||
|
Purchases of land improvements
|
-0-
|
(70,729)
|
(2,194)
|
(72,923)
|
|||||
|
Purchases of equipment and vehicles
|
(271,387)
|
(60,104)
|
(122,580)
|
(454,071)
|
|||||
|
Proceeds from sale of assets
|
1,000
|
150,000
|
-0-
|
151,000
|
|||||
|
Net cash provided by discontinued operations
|
-0-
|
2,500
|
432,170
|
434,670
|
|||||
|
Net cash provided by investing activities
|
(270,387)
|
21,667
|
307,396
|
58,676
|
|||||
|
Cash flows from financing activities:
|
|||||||||
|
Payments on notes payable
|
(518,726)
|
(145,418)
|
(167,203)
|
(831,347)
|
|||||
|
Payments on leases payable
|
(167,956)
|
(131,764)
|
(121,274)
|
(420,994)
|
|||||
|
Proceeds from insurance settlement
|
-0-
|
115,000
|
-0-
|
115,000
|
|||||
|
Proceeds from notes payable
|
-0-
|
- 0 -
|
124,129
|
124,129
|
|||||
|
Proceeds from PIK notes payable
|
-0-
|
4,550,000
|
5,050,000
|
9,600,000
|
|||||
|
Net proceeds from sale of common stock
|
|||||||||
|
with attached warrant
|
14,185,000
|
-0-
|
-0-
|
14,185,000
|
|||||
|
Payments for forfeiture of stock
|
-0-
|
(170,000)
|
-0-
|
(170,000)
|
|||||
|
Net cash used by discontinued operations
|
-0-
|
-0-
|
(56,431)
|
(56,431)
|
|||||
|
Net cash provided by financing activities
|
13,498,318
|
4,217,818
|
4,829,221
|
22,545,357
|
|||||
|
Net increase (decrease) in cash
|
8,528,196
|
57,474
|
681,865
|
9,267,535
|
|||||
|
Cash and cash equivalents at beginning of period
|
1,642,340
|
1,584,866
|
903,001
|
903,001
|
|||||
|
Cash and cash equivalents at end of period
|
$ 10,170,536
|
$ 1,642,340
|
$ 1,584,866
|
$ 10,170,536
|
|||||
|
The accompanying notes are an integral part of these financial statements.
|
|||||||||
F -9
|
APPLIED MINERALS, INC.
|
||||||||
|
(An Exploration Stage Mining Company)
|
||||||||
|
STATEMENTS OF CASH FLOWS
|
||||||||
|
(Continued)
|
||||||||
|
For the Period
|
||||||||
|
January 1, 2009
|
||||||||
|
(Beginning of
|
||||||||
|
For the year ended
|
Exploration Stage)
|
|||||||
|
December 31,
|
through
|
|||||||
|
2011
|
2010
|
2009
|
December 31, 2011
|
|||||
|
Cash Paid For:
|
||||||||
|
Interest
|
$ 58,056
|
$ 10,893
|
$ 17,587
|
$ 86,536
|
||||
|
Income Taxes
|
$ 1,465
|
$ 550
|
$ -0-
|
$ 2,015
|
||||
|
Supplemental Disclosure of Non-Cash
|
||||||||
|
Investing and Financing Activities:
|
||||||||
|
Conversion of debt and
|
||||||||
|
accrued interest to common stock
|
$5,019,895
|
$ 2,343,922
|
$ 4,095,921
|
$11,459,738
|
||||
|
Equipment financed on lease
|
$ -0-
|
$ 197,000
|
$ -0-
|
$ 197,000
|
||||
|
Prepaid insurance financed
|
$141,908
|
$-0-
|
$-0-
|
$141,908
|
||||
|
Equipment financed with note payable
|
$173,838
|
$-0-
|
$-0-
|
$173,838
|
||||
|
The accompanying notes are an integral part of these financial statements.
|
||||||||
F -10
APPLIED MINERALS, INC.
(An Exploration Stage Mining Company)
Notes to the Financial Statements
NOTE 1 – ORGANIZATION AND DESCRIPTION OF BUSINESS
The Company owns the Atlas Mine, a consolidation of several patented mining claims located in the Coeur d’Alene Mining District near Mullan, Idaho, and the Dragon Mine, a halloysite clay property located in Juab County, Utah. The Company discontinued its contract mining operation on December 31, 2008, and, thus, changed its planned principal operation to development and exploration of its mining property located in Utah on January 1, 2009, thus taking the Company to the exploration stage at that date. The Company is currently focused on the commercialization of the Dragon Mine property while actively seeking to dispose of the idle Atlas Mine property.
NOTE 2 – SUMMARY OF SIGNIFICANT ACCOUNTING POLICIES
This summary of significant accounting policies is presented to assist in understanding the financial statements. The financial statements and notes are representations of the Company’s management, which is responsible for their integrity and objectivity. These accounting policies conform to accounting principles generally accepted in the United States of America and have been consistently applied in the preparation of the financial statements.
Accounting Method
The Company’s financial statements are prepared using the accrual basis of accounting in accordance with principles generally accepted in the United States of America.
Use of Estimates
The preparation of financial statements in conformity with accounting principles generally accepted in the United States of America requires management to make estimates and assumptions that affect reported amounts of assets and liabilities, disclosure of contingent assets and liabilities at the date of the financial statements in revenues and expenses during the reporting period. In these financial statements, assets and liabilities involve extensive reliance on management’s estimates. Actual results could differ from those estimates.
Accounts Receivable
The Company records all trade accounts receivables upon completion of agreed upon terms and fulfillment, based on FOB shipping terms. Trade receivables are reviewed periodically for collectability. Any receivables deemed to be uncollectible will be written off against the allowance account, once all attempts to collect have been exhausted. The Company defines trade receivables as past due when the receivable has exceeded the net terms by one calendar day. At December 31, 2011 and 2010, the Company had trade receivables of $32,402 and $0, respectively. There were allowances for doubtful accounts of $11,938 and -0- at December 31, 2011 and 2010, respectively. At December 31, 2010, the Company had a $61,275 receivable resulting from the sale of a piece of equipment.
Amortizable Discount
Costs relating to obtaining financing are recorded as a discount on debt and amortized over the term of the related debt.
Cash and Cash Equivalents
The Company considers all highly liquid investments with original maturities of three months or less to be cash equivalents.
Concentration of Credit Risk
All eligible cash balances were insured at December 31, 2011 and 2010.
Derivatives
A derivative is an instrument whose value is “derived” from an underlying instrument or index such as a future, forward, swap, option contract, or other financial instrument with similar characteristics, including certain derivative instruments embedded in other contracts (“Embedded Derivatives”) and for hedging activities. As a matter of policy, the Company does not invest in separable financial derivatives or engage in hedging transactions. However, complex transactions that the Company entered into in order to finance its operations involved financial instruments containing certain features that have resulted in the instruments being deemed derivatives or containing embedded derivatives. The Company may engage in other similar complex debt transactions in the future, but not with the intention to enter into derivative instruments. Derivatives and Embedded Derivatives, if applicable, are measured at fair value and marked to market through earnings. However, such new and/or complex instruments may have immature or limited markets. As a result, the pricing models used for valuation often incorporate significant estimates and assumptions, which may impact the level of precision in the financial statements.
Legal Costs
In the normal course of business, the Company will incur costs to engage and retain external legal counsel to advise management on regulatory, litigation and other matters. Such legal costs are expensed as the related services are received.
Impairment of Assets
At December 31, 2011 the Company recognized $4,862 on the impairment of its timber properties held in discontinued operations. At December 31, 2010, the Company recognized $13,080 of loss due to impairment of assets held in continuing operations, and $126,876 of loss on assets held for sale from impairment, which is included in a net gain or loss from discontinued operations. Assets impaired at December 31, 2010 include mining equipment, milling equipment, and vehicles that the Company deemed to have no purpose in operations. At December 31, 2009, the Company recognized $42,042 of loss due to impairment of assets held in continuing operations, and $82,547 of loss on assets held for sale from impairment, which is included in net loss from discontinued operations.
F -11
APPLIED MINERALS, INC.
(An Exploration Stage Mining Company)
Notes to the Financial Statements
NOTE 2 – SUMMARY OF SIGNIFICANT ACCOUNTING POLICIES (CONTINUED)
Fair Value of Financial Instruments
The carrying amounts of certain of the Company’s financial instruments including cash and cash equivalents, short-term investments, accounts receivable, line of credit, accounts payable, accrued liabilities and notes payable approximate fair value due to their short maturities.
Mining Exploration and Development Costs
Land and mining property acquisitions are carried at cost. The Company expenses prospecting and mining exploration costs. At the point when a property is determined to have proven and probable reserves, subsequent development costs are capitalized. Capitalized development costs will include acquisition costs and property development costs. When these properties are developed and operations commence, capitalized costs will be charged to operations using the units-of-production method over proven and probable reserves. Upon abandonment or sale of a mineral property, all capitalized costs relating to the specific property are written off in the period abandoned or sold and a gain or loss is recognized. At December 31, 2011, 2010 and 2009, all costs associated with the Company's mine have been expensed.
Non-Controlling Interest
The Company owned 53% of the outstanding stock of Park Copper and Gold Mining Company Limited (“Park Copper”), an Idaho corporation that holds several patented and unpatented mining claims near or adjacent to the Company’s property in North Idaho. The financial information related to Park Copper was consolidated into the Company’s financial statements in 2010, which included an accounting for non-controlling interest. At December 31, 2011 the investment in Park Copper was fully impaired.
Property and Equipment
Property and equipment are carried at cost. Depreciation and amortization is computed on the straight-line method over the estimated useful lives of the assets as follows:
|
Estimated
|
|
|
Useful Life
|
|
|
Building
|
30 years
|
|
Mining equipment
|
2 – 7 years
|
|
Office and shop furniture and equipment
|
3 – 7 years
|
|
Vehicles
|
5 years
|
Depreciation expense for the years ended December 31, 2011, 2010 and 2009 totaled $248,605, $162,859 and $123,733, respectively.
Provision for Income Taxes
Income taxes are calculated based upon the asset and liability method of accounting. Deferred income taxes are recorded to reflect the tax consequences in future years of differences between the tax basis of assets and liabilities and their financial reporting amounts at each year-end. A valuation allowance is recorded against deferred tax assets if management does not believe the Company has met the “more likely than not” standard to allow for recognition of such an asset. In addition, realization of an uncertain income tax position must be estimated as “more likely than not” (i.e., greater than 50% likelihood of receiving a benefit) before it can be recognized in the financial statements. Further, the recognition of tax benefits recorded in the financial statements to be based on the amount most likely to be realized assuming a review by tax authorities having all relevant information. The Company had minimal impact from adoption of this Interpretation.
Operating Leases
The Company rents its office in Osburn, Idaho under a month-to-month rental agreement at $450 per month. The Company’s office in New York, N.Y., where its principal executives are located, is leased by and paid for by Material Advisors, LLC.
Revenue Recognition
The Company recognizes revenue for mined halloysite clay upon shipment and customer acceptance once a contract with a fixed and determinable fee has been established and collection is reasonably assured or the resulting receivable is deemed probable.
Stock Options
The Company has stock option plans that provide for stock-based employee compensation, including the granting of stock options, to certain key employees. The plans are more fully described in Note 9.
Compensation expense is recorded for all share-based awards granted to either non-employees, or employees and directors on or after January 1, 2007. Accordingly, compensation expense of $2,181,394, $334,669 and $401,234 has been recognized for vesting of options and warrants to consultants and directors in the accompanying statements of operations for the period ended December 31, 2011, 2010 and 2009, respectively.
The Company accounts for the issuance of equity instruments (including warrants) to acquire goods and services based on the fair value of the goods and services or the fair value of the equity instrument at the time of issuance, whichever is more reliably measurable.
Subsequent Events
The Company evaluates events that occur subsequent to the balance sheet date of periodic reports, but before financial statements are issued for periods ending on such balance sheet dates, for possible adjustment to such financial statements or other disclosure.
F -12
APPLIED MINERALS, INC.
(An Exploration Stage Mining Company)
Notes to the Financial Statements
NOTE 2 – SUMMARY OF SIGNIFICANT ACCOUNTING POLICIES (CONTINUED)
|
|
Recent Accounting Pronouncements
|
In May 2011, the FASB issued ASU No. 2011-04, “Fair Value Measurement (Topic 820): Amendments to Achieve Common Fair Value Measurement and Disclosure Requirements in U.S. GAAP and International Financial Reporting Standards (“IFRS”).” The amendments in this ASU generally represent clarification of Topic 820, but also include instances where a particular principle or requirement for measuring fair value or disclosing information about fair value measurements has changed. This update results in common principles and requirements for measuring fair value and for disclosing information about fair value measurements in accordance with GAAP and IFRS. The amendments are effective for interim and annual periods beginning after December 15, 2011 and are to be applied prospectively. Early application is not permitted. The Company does not expect that the adoption of ASU 2011-04 will have a material impact on its financial statements.
In June 2011, the FASB issued ASU 2011-05, “Comprehensive Income (Topic 220): Presentation of Comprehensive Income.” Specifically, the new guidance allows an entity to present components of net income or other comprehensive income in one continuous statement, referred to as the statement of comprehensive income, or in two separate, but consecutive statements. The new guidance eliminates the current option to report other comprehensive income and its components in the statement of changes in equity. While the new guidance changes the presentation of comprehensive income, there are no changes to the components that are recognized in net income or other comprehensive income under current accounting guidance. The new guidance is effective for fiscal years and interim periods beginning after December 15, 2011 and is to be applied retrospectively. The Company does not expect that the adoption of ASU 2011-05 will have a material impact on its financial statements.
NOTE 3 – DISCONTINUED OPERATIONS
The Company permanently discontinued its contract mining operations. There are no plans to resume the contract mining business.
The Company has identified assets attributed to the discontinued operation that are being held for sale or have been identified as part of the discontinued operation and have been identified as such. Assets at December 31, 2011 and 2010 attributed to the discontinued operation are as follows:
|
December 31,
|
December 31,
|
||
|
2011
|
2010
|
||
|
Property and equipment
|
$ 445,180
|
$ 450,042
|
|
|
Total assets from discontinued operations
|
$ 445,180
|
$ 450,042
|
Liabilities at December 31, 2011 and 2010 attributed to the discontinued operations are as follows:
|
December 31,
|
December 31,
|
||
|
2011
|
2010
|
||
|
Accounts payable and accrued liabilities
|
$ - 0 -
|
$ 1,152
|
|
|
Leases Payable
|
- 0 -
|
- 0 -
|
|
|
Total liabilities from discontinued operations
|
$ - 0 -
|
$ 1,152
|
Income (loss) after discontinued operations for the years ended December 31, 2011, 2010 , and 2009 was calculated as follows:
|
Year ended December 31,
|
||||||
|
2011
|
2010
|
2009
|
||||
|
Revenues from discontinued operations
|
$ - 0 -
|
$ - 0 -
|
$ - 0 -
|
|||
|
Cost of goods sold
|
- 0 -
|
- 0 -
|
- 0 -
|
|||
|
General and administrative expenses
|
(910)
|
(12,962)
|
(36,354)
|
|||
|
Payment of prior year income taxes
|
-0-
|
(550)
|
- 0 -
|
|||
|
Collection of previously recorded bad debt
|
-0-
|
234,524
|
202,365
|
|||
|
Gain on settlement of debts
|
-0-
|
27,192
|
- 0 -
|
|||
|
Gain (Loss) on disposal of assets
|
-0-
|
2,500
|
(148,138)
|
|||
|
Loss on impairment of assets
|
(4,862)
|
(126,876)
|
(82,547)
|
|||
|
Income (loss) from discontinued operations
|
(5,772)
|
123,828
|
(64,674)
|
|||
|
Income tax liability
|
- 0 -
|
- 0 -
|
- 0 -
|
|||
|
Net income (loss) from discontinued operations
|
$ (5,772)
|
$ 123,828
|
$ (64,674)
|
|||
During the year ended December 31, 2011 the mining and timber property located in northern Idaho was impaired by $4,862. During the year ended December 31, 2010, the Company reviewed the assets held for sale and determined that certain items with a net book value of $301,085 would be reinstated to the Dragon Mine and used in exploration activities. For the year ended December 31, 2010, an impairment of the remainder of equipment held for sale in the amount of $126,876 was recorded. The book value of assets held for sale at December 31, 2011 and 2010 was $445,180 and $450,042, respectively.
The Company does not believe there is an effect of income taxes on discontinued operations. Due to ongoing operating losses, the uncertainty of future profitability and limitations on the utilization of net operating loss carry-forwards under IRC Section 382, a valuation allowance has been recorded to fully offset the Company’s deferred tax asset.
F -13
APPLIED MINERALS, INC.
(An Exploration Stage Mining Company)
Notes to the Financial Statements
NOTE 4 – STOCK AWARD PAYABLE
In 2007 the Company agreed to grant 100,000 shares in total to an Executive Vice President, John Gaensbauer, as part of his employment agreement. At the time of the grant in 2007, there were not enough unauthorized, unissued and available shares necessary to issue the above referenced shares to Mr. Gaensbauer. By the time the Company had enough authorized available shares to issue the stock to Mr. Gaensbauer who had, by then, resigned his position, the Company and certain members of its former management team were defendants in a class action filed by the Company’s shareholders. Given the class action, the Company was uncertain whether it would have to ultimately issue shares to Mr. Gaensbauer, settle such stock grant in cash, or rescind the stock grant. As such the Company recorded the stock grant as a liability and revalues it accordingly at the end of each period. The Company continues to explore it options to resolve this outstanding issue. For the year ended December 31, 2011, 2010, and 2009 the Company realized a loss on the revaluation of the remaining stock awards totaling $47,000, $22,000, and $58,000, respectively. At December 31, 2011 and 2010 the value of all outstanding stock awards was $127,000 and $80,000, respectively. At December 31, 2011, the remaining stock award granted to Mr. Gaensbauer has not been issued.
NOTE 5 - NOTES AND LEASES PAYABLE
NOTES PAYABLE
Notes payable are detailed in the following schedules as of December 31, 2011 and 2010:
|
December 31,
|
December 31,
|
||
|
2011
|
2010
|
||
|
Note payable to legal firm due in monthly installments including interest at 10%. Debt was settled on December 30, 2011. (See Note 11)
|
$ -0-
|
$ 497,699
|
|
|
Note payable to an insurance company due in monthly installments, including interest at 3%. The note matures in July 2012.
|
110,648
|
69,805
|
|
|
Note payable to a company for equipment due in monthly installments, including implied interest of 9.34%. The note matures in July 2014.
|
152,496
|
-0-
|
|
|
Convertible debt (PIK Notes), net of applicable discounts, payable to multiple note holders, at an annual interest rate of 10%. The notes mature in December 2018. (See Note 7)
|
-0-
|
4,683,624
|
|
|
Total Notes Payable
|
263,144
|
5,251,128
|
|
|
Less: Current Portion
|
(165,375)
|
(206,209)
|
|
|
Total Long-Term Liabilities
|
$ 97,769
|
$5,044,919
|
The following is a schedule by year of the future minimum note payments as of December 31, 2011:
|
2012
|
$ 165,375
|
|
2013
|
60,063
|
|
2014
|
37,706
|
|
Thereafter
|
-0-
|
|
Total Notes Payable
|
$ 263,144
|
CAPITAL LEASES
The Company is a lessee of certain equipment under capital leases that expire on various dates through March 2012. Terms of the leases call for monthly payments of $1,632 and $3,518 at an implicit interest rate of 9.34% per annum (the incremental borrowing rate). The assets and liabilities under capital leases are recorded at lease inception at the lower of the present value of the minimum lease payments or the fair market value of the related assets. The assets are depreciated over their estimated useful lives.
CAPITAL LEASES-CONTINUED
The following is a schedule by years of the future minimum lease payments under capital leases together with the present value of the net minimum lease payments as of December 31, 2011:
|
2012
|
$ 11,932
|
|
|
Less: Amount Representing Interest
|
(205)
|
|
|
Present Value of Net Minimum Lease Payments
|
$ 11,727
|
F -14
APPLIED MINERALS, INC.
(An Exploration Stage Mining Company)
Notes to the Financial Statements
NOTE 5 - NOTES AND LEASES PAYABLE (CONTINUED)
The following is an analysis of the leased property under capital leases by major classes:
|
December 31,
|
|||
|
Classes of Property
|
2011
|
2010
|
|
|
Milling Equipment
|
$ 95,363
|
$ 162,052
|
|
|
Mining Equipment
|
-0-
|
197,000
|
|
|
Less: Accumulated Depreciation
|
(66,282)
|
(73,409)
|
|
|
Total assets under capital lease
|
$ 29,081
|
$ 285,643
|
|
NOTE 6 – FAIR VALUE MEASUREMENTS AND FINANCIAL INSTRUMENTS
ASC Topic 820, Fair Value Measurement and Disclosures, defines fair value as the exchange price that would be received for an asset or paid to transfer a liability (an exit price) in the principal or most advantageous market for the asset or liability in an orderly transaction between market participants on the measurement date. This topic also establishes a fair value hierarchy, which requires classification based on observable and unobservable inputs when measuring fair value. The fair value hierarchy distinguishes between assumptions based on market data (observable inputs) and an entity’s own assumptions (unobservable inputs). The hierarchy consists of three levels: fair value of the Company’s financial instruments reflects the amounts that the Company estimates to receive in connection with the sale of an asset or paid in connection with the transfer of a liability in an orderly transaction between market participants at the measurement date (exit price). For financial assets and liabilities that are periodically re-measured to fair value, the Company discloses a fair value hierarchy that prioritizes the use of inputs used in valuation techniques into the following three levels:
|
·
|
Level 1 – Quoted prices in active markets for identical assets and liabilities;
|
|
·
|
Level 2 – Inputs other than level one inputs that are either directly or indirectly observable; and
|
|
·
|
Level 3 – Unobservable inputs developed using estimates and assumptions, which are developed by the reporting entity and reflect those assumptions that a market participant would use.
|
During the year ended December 31, 2010, the Company determined that its available-for-sale investment was other than temporarily impaired and recorded a loss of $5,565.
Assets and liabilities measured at fair value on a recurring basis are summarized as follows:
|
Fair value measurement using inputs
|
Carrying amount at December 31,
|
||||||||
|
Level 1
|
Level 2
|
Level 3
|
2011
|
2010
|
|||||
|
Financial instruments:
|
|||||||||
|
Liabilities
|
|||||||||
|
Stock awards payable
|
$ - 0 -
|
$ 127,000
|
$ - 0 -
|
$ 127,000
|
$ 80,000
|
||||
|
Derivative instruments - Warrants
|
- 0 -
|
3,355,000
|
- 0 -
|
3,355,000
|
- 0 -
|
||||
|
Total
|
$ - 0 -
|
$ 3,482,000
|
$ - 0 -
|
$ 3,482,000
|
$ 80,000
|
||||
The Company estimates the fair value of the warrants using the Black-Scholes option pricing model using the following assumptions:
|
Fair value measurement using inputs
|
|||
|
December 31, 2011
|
December 22, 2011
|
||
|
Market price and estimated fair value of stock:
|
$1.27
|
$1.33
|
|
|
Exercise price:
|
$2.00
|
$2.00
|
|
|
Expected term (years):
|
5
|
5
|
|
|
Dividend yield
|
$-0-
|
$-0-
|
|
|
Expected volatility:
|
77%
|
77%
|
|
|
Risk-free interest rate:
|
.90%
|
.90%
|
|
The risk-free rate of return reflects the interest rate for United States Treasury Note with similar time-to-maturity to that of the warrants.
F -15
APPLIED MINERALS, INC.
(An Exploration Stage Mining Company)
Notes to the Financial Statements
NOTE 7 – CONVERTIBLE DEBT (PIK NOTES)
Between December 31, 2008 and October 2010, the Company sold several 10% Convertible Notes due December 15, 2018. The notes convert into common stock at a fixed conversion rate of between $0.35 to $1.00 per share, with conversion rates at the time of the issuance of the notes being lower than, higher than, or equal to the market price of the Company’s common stock. In the case in which the conversion rate of a newly issued note is lower than the market price of the Company’s common stock, a beneficial conversion feature is recognized and the intrinsic value of the beneficial conversion feature is recorded as a discount on the note with a corresponding credit to APIC. The notes bear nominal interest at the rate of 10% per annum (or an effective interest rate of 10.25%) payable (including by issuance of additional in-kind notes) semi-annually in arrears on June 15th and December 15th of each year. The notes include terms whereby interest payable may be paid in either cash or by converting the interest owed the note holder into additional PIK Notes. The Convertible Notes are notes whereby the holder may only realize the value of the conversion option by exercising the option and receiving the entire proceeds in either a fixed number of shares or the equivalent amount of cash (at the discretion of the issuer).
Conversion Feature
All notes described above may be converted at the option of the note holder at any time there is sufficient authorized unissued common stock of the Company available for conversion. The PIK Notes, except those issued in October 2010, may be converted, at the option of the Company, when the average closing bid price or market price of the Company’s common stock for the preceding five (5) days is above the conversion price. The Notes issued in October 2010 cannot be converted by the Company for one year from the date of issuance
During the year ended December 31, 2011, PIK Notes representing principal and accrued interest of $5,019,895 were converted by the Company into 5,019,895 shares of the Company’s common stock.
Deferred Financing Costs
In connection with the convertible debt issued during October 2010, the Company recorded the financing costs paid to a third party in the amount of $150,000 as deferred financing costs. These costs were being amortized over the term of the debt. The Company amortizes the deferred financing costs using straight-line over the life of the debt, which approximates the effective interest rate. In the event of conversion before note maturity, any remaining costs are immediately expensed. As of December 31, 2011, 2010 and 2009, there was $-0- and $146,939 and $ -0-, respectively of deferred financing costs on Convertible PIK Notes.
Mandatory Conversion
In May 2011, the Company mandatorily converted the May 2010 convertible debt and unpaid interest. Upon conversion, 1,654,725 shares of the Company’s common stock were issued for the conversion of the notes.
During October 2011, the Company exercised its option to mandatorily convert the principal plus accrued interest related to the convertible debt (PIK Notes) into the Company’s common stock. On the date of conversion, 3,365,170 shares of common stock were issued, valued at a total of $3,365,170, of which $3,050,000 was principal and the remainder of $315,170 was accrued interest. In addition, the related deferred financing costs were immediately amortized to zero as, at the time of mandatory conversion, the remaining convertible debt equaled $0.
NOTE 8 – STOCKHOLDERS’ EQUITY
Preferred Stock
The Company is authorized to issue 10,000,000 shares of noncumulative, non-voting, nonconvertible preferred stock, $0.001 par value per share. At December 31, 2011, 2010 and 2009, no shares of preferred stock were outstanding.
Common Stock
The Company is authorized to issue 120,000,000 shares of common stock, $0.001 par value per share. At December 31, 2011, 2010 and 2009, 89,119,405, 69,704,393 and 69,781,351 shares were issued and outstanding, respectively.
2011
During the year ended December 31, 2011, the Company issued a total of 97,612 shares of restricted, common stock to directors and consultants as payment of fees. The value of such was recorded at $118,436. During the year ended December 31, 2011, a warrant holder received 5,570 shares of the Company’s common stock through a cashless exercise. During the year ended December 31, 2011 an option holder received 41,935 shares of the Company’s common stock through a cashless exercise. Also during the year ended December 31, 2011, the Company sold a total of 14,250,000 shares of common stock at pricing between $1.25 and $1.53 per share, collecting a total of $10,805,000 less $230,000 of expenses related to the capital raised. A portion of these shares was purchased by a related party. (See Note 13)
2010
During the year ended December 31, 2010, the Company issued a total of 40,606 shares of common stock to directors as payment of director’s fees. The value of such shares was recorded at $30,000.
During the year ended December 31, 2010, the Company issued a total of 41,305 shares of common stock to outside consultants for the performance of services. The value of such shares was recorded at $35,079.
During the year ended December 31, 2010, the Company exercised its ability to mandatorily convert portions of its convertible debt and unpaid interest to 2,457,500 shares of common stock.
F -16
APPLIED MINERALS, INC.
(An Exploration Stage Mining Company)
Notes to the Financial Statements
NOTE 8 – STOCKHOLDERS’ EQUITY (CONTINUED)
During the year ended December 31, 2010, the Company issued 427,714 shares of common stock to related parties as part of a forbearance agreement signed in connection with the shareholders’ class action lawsuit. The value of such shares was recorded at $320,786. See Note 13.
During the year ended December 31, 2010, the Company received shares from its former CEO who relinquished his rights to them as part of the settlement of the shareholders’ class action lawsuit. The 3,044,083 shares of common stock were considered forfeited and returned to unissued shares. The Company paid $170,000 related to the finalization of the share forfeiture and cancellation. See Note 13.
During the year ended December 31, 2010, the Company filed an S-1 registration statement allowing for the registration of 12,981,412 shares of common stock some of which are issuable upon the conversion of 10% PIK Convertible Notes due 2018.
During the year ended December 31, 2010, the Company hired an outside firm to assist with the placement of convertible debt. As a result, $150,000 of cash was paid as a finder’s fee and was recorded as a discount on debt and was being amortized over the term of the related debt. During 2011, 2010 and 2009 the discount on debt was expensed in the amount of $146,939, $3,061 and $-0-, respectively.
2009
During the year ended December 31, 2009, the Company issued a total of 78,497 shares of restricted, common stock to directors as payment of director fees. The value of such shares was recorded at $ 17,250.
During the year ended December 31, 2009, the Company exercised its ability to mandatorily convert portions of its convertible debt and unpaid interest to 10,487,226 shares of common stock.
During the year ended December 31, 2009, the Company filed an S-1 registration statement allowing for the registration of 23,407,964 shares of common stock some of which are issuable upon the exercise of options and warrants and the conversion of 10% PIK Convertible Notes due 2018.
NOTE 9 – OPTIONS AND WARRANTS TO PURCHASE COMMON STOCK
Derivative Instruments - Warrants
The Company issued 5,000,000 Warrants in connection with the December 22, 2011 Private Placement of 10,000,000 shares of common stock. The strike price of these warrants is $2.00 per share. These warrants were not issued with the intent of effectively hedging any future cash flow, fair value of any asset, liability or any net investment in a foreign operation. These Warrants were issued with a down-round provision whereby the exercise price would be adjusted downward in the event that additional shares of the Company’s common stock or securities exercisable, convertible or exchangeable for the Company’s common stock were issued at a price less than the exercise price. Therefore, the fair value of these warrants were recorded as a liability in the balance sheet until they are exercised or expire or otherwise extinguished. Determining which category an asset or liability falls within the hierarchy requires significant judgment. The Company evaluates its hierarchy disclosures each quarter.
The proceeds from the Private Placement were allocated between the Common Shares and the Warrants issued in connection with the Private Placement based upon their estimated fair values as of the closing date at December 22, 2011, resulting in the aggregate amount of $6,420,000 to the Common Shares and $3,580,000 to the Warrants. The Company recognized a gain of $225,000 with the fair market valuation at December 31, 2011. The fair market value of the Derivative Warrants at December 31, 2011 was $3,355,000
Outstanding Stock Warrants
The warrants issued during the year ended December 31, 2011, may be exercised by the warrant holder either by payment of cash per warrant, or through a cashless exercise whereby the warrant holder may exercise the warrant without exchange of cash, at a predefined rate of conversion where the warrant holder would typically receive less than the total number of underlying common shares within the warrant if a cashless exercise occurs. The formula for the cashless exercise is [(A – B)*(X)] divided by A where A is the volume-weighted average price on the trading day immediately preceding the date of the exercise; B is the exercise price of the warrant; and X is the number of shares of common stock issuable upon the exercise of the warrant.
During the year ended December 31, 2011, the Company granted 5,853,590 warrants to purchase the Company’s common stock with an average exercise price of $1.77. Of the 5,853,590 warrants granted, 5,653,193 are vested at December 31, 2011, and the remaining 200,397 warrants will vest over 7 months, or through August 1, 2012. The intrinsic value of the outstanding warrants at December 31, 2011 was $424,216.
During the year ended December 31, 2010, the Company issued stock warrants to two non-employee, unrelated consultants. The warrants allow the warrant holders to purchase, in aggregate, 320,187 shares of common stock at a price between $0.80 and $1.00 per share. The five-year warrants expire between October 2014 and December 2015. 180,000 warrants vested upon grant, and 140,187 vested during the fourth quarter of 2010. For the year ended December 31, 2010, $180,000 of compensation expense related to warrants was recognized. The warrants have a fair market value of $268,957. The number of warrants granted may be adjusted if the Company grants subsequent warrants at a price that is less than the value of the market price of the common stock on the original grant date. The number of warrants available for exercise is adjusted to compensate for the disparity in warrant strike price. The warrants may be exercised in cash at full strike price, or may be exercised using a cashless option whereby the warrant holder would receive shares of the Company’s common stock using the total of market price less strike price multiplied by the total number of warrants available then dividing that resultant by the current market price.
F -17
APPLIED MINERALS, INC.
(An Exploration Stage Mining Company)
Notes to the Financial Statements
NOTE 9 – OPTIONS AND WARRANTS TO PURCHASE COMMON STOCK (CONTINUED)
Outstanding Stock Warrants (Continued)
During the year ended December 31, 2009, the Company issued stock warrants to two non-employee, unrelated party consultants. Such warrants were granted based upon the value of the services performed by the consultants, a measurement that is more reliably measurable. The number of warrants issued to each recipient was determined by taking the total value of the services provided the Company by the recipient and dividing it by an individual warrant value calculated using the Black-Scholes Option Pricing Model, which utilized a strike price equal to the market price of the Company’s common stock and other required inputs described below. The warrants allow the warrant holders to purchase, in aggregate, 260,000 shares of common stock at a price between $0.35 and $1.00 per share. The five-year warrants expire in April 2014 and October 2014. The April 2009 warrant vests in equal increments over twelve months, and the October 2009 warrant vested upon issuance. For the year ended December 31, 2009, $126,950 of compensation expense related to the issuance of the warrants was recognized. The warrants have a fair market value of $143,000.
A summary of the status of the warrants outstanding at December 31, 2011 is presented below:
|
Warrants Outstanding
|
Warrants Exercisable
|
||||||||
|
Exercise Price
|
Number Outstanding
|
Weighted Average Remaining Contractual Life
|
Weighted Average Exercise Price
|
Number Exercisable
|
Weighted Average Exercise Price
|
||||
|
$ 0.35
|
90,000
|
2.25 years
|
$ 0.35
|
90,000
|
$ 0.35
|
||||
|
$ 0.78
|
213,402
|
4.08 years
|
$ 0.78
|
213,402
|
$ 0.78
|
||||
|
$ 0.80
|
264,668
|
3.87 years
|
$ 0.80
|
264,668
|
$ 0.80
|
||||
|
$ 1.00
|
340,000
|
2.75 years
|
$ 1.00
|
340,000
|
$ 1.00
|
||||
|
$ 1.15
|
461,340
|
9.33 years
|
$ 1.15
|
346,005
|
$ 1.15
|
||||
|
$ 2.00
|
5,054,367
|
4.97 years
|
$ 2.00
|
5,022,655
|
$ 2.00
|
||||
|
6,423,777
|
6,276,730
|
||||||||
At December 31, 2011, the total compensation of $221,127 for unvested shares is to be recognized over the next 7 months on a weighted average basis. Compensation expense of $415,143 has been recognized for the vesting of warrants to non-related parties in the accompanying statements of operations for the year ended December 31, 2011. Warrants were issued with a down-round provision valued at $3,355,000 at December 31, 2011. (See Note 6)
The fair value of each of the Company’s stock warrant awards is estimated on the date of grant using a Black-Scholes option-pricing model that uses the assumptions noted in the table below. Expected volatility is based on an average of historical volatility of the Company’s common stock. The risk-free interest rate for periods within the contractual life of the stock option award is based on the yield curve of a zero-coupon U.S. Treasury bond on the date the award is granted with a maturity equal to the expected term of the award. The Company uses historical data to estimate forfeitures within its valuation model. The significant assumptions relating to the valuation of the Company’s warrants for the year ended December 31, 2011 were as follows:
Outstanding Stock Warrants (Continued)
|
2011
|
|
|
Dividend Yield
|
0%
|
|
Expected Life
|
5 – 10 years
|
|
Expected Volatility
|
77% - 100%
|
|
Risk Free Interest Rate
|
.90% - 2.96%
|
A summary of the status and changes of the warrants issued during the years ended December 31, 2011, 2010 and 2009 are as follows:
|
December 31, 2011
|
December 31, 2010
|
December 31, 2009
|
|||||||
|
Weighted
|
Weighted
|
Weighted
|
|||||||
|
Average
|
Average
|
Average
|
|||||||
|
Shares
|
Exercise Price
|
Shares
|
Exercise Price
|
Shares
|
Exercise Price
|
||||
|
Outstanding at beginning of period
|
580,187
|
$ 0.78
|
260,000
|
$ 0.75
|
- 0 -
|
$ - 0 -
|
|||
|
Issued
|
5,853,590
|
1.86
|
320,187
|
0.80
|
260,000
|
0.75
|
|||
|
Exercised
|
(10,000)
|
($.35)
|
- 0 -
|
- 0 -
|
- 0 -
|
- 0 -
|
|||
|
Forfeited
|
- 0 -
|
- 0 -
|
- 0 -
|
- 0 -
|
- 0 -
|
- 0 -
|
|||
|
Expired
|
- 0 -
|
- 0 -
|
- 0 -
|
- 0 -
|
- 0 -
|
- 0 -
|
|||
|
Outstanding at end of period
|
6,423,777
|
$ 1.77
|
580,187
|
$ 0.78
|
260,000
|
$ 0.75
|
|||
|
Exercisable at end of period
|
6,276,730
|
$ 1.79
|
580,187
|
$ 0.78
|
235,000
|
$ 0.75
|
|||
F -18
APPLIED MINERALS, INC.
(An Exploration Stage Mining Company)
Notes to the Financial Statements
NOTE 9 – OPTIONS AND WARRANTS TO PURCHASE COMMON STOCK (CONTINUED)
Outstanding Stock Options
The Company is authorized to issue stock options under the existing stock option plan approved by stockholders.
The fair value of each of the Company’s stock option awards is estimated on the date of grant using a Black-Scholes option-pricing model that uses the assumptions noted in the table below. Expected volatility is based on an average of historical volatility of the Company’s common stock. The risk-free interest rate for periods within the contractual life of the stock option award is based on the yield curve of a zero-coupon U.S. Treasury bond on the date the award is granted with a maturity equal to the expected term of the award. The Company uses historical data to estimate forfeitures within its valuation model.
The expected term of awards granted is derived from historical experience under the Company’s stock-based compensation plans and represents the period of time that awards granted are expected to be outstanding.
The significant assumptions relating to the valuation of the Company’s options for the year ended December 31, 2011, 2010 and 2009 were as follows:
|
2011
|
2010
|
2009
|
|||
|
Dividend Yield
|
0%
|
0%
|
0%
|
||
|
Expected Life
|
5 – 10 years
|
5 years
|
1 - 5 years
|
||
|
Expected Volatility
|
81% - 105%
|
120%
|
100%
|
||
|
Risk Free Interest Rate
|
2.02 – 3.75%
|
0.4%
|
1.68%
|
Outstanding Stock Options (continued)
A summary of the status and changes of the options granted under stock option plans and other agreements for the period ended December 31, 2011 is as follows:
|
Shares
|
Weighted Average Exercise Price
|
||
|
Outstanding at December 31, 2010
|
7,593,277
|
$ 0.70
|
|
|
Granted
|
4,105,134
|
$ 1.06
|
|
|
Exercised
|
(100,000)
|
$0.90
|
|
|
Forfeited
|
- 0 -
|
- 0 -
|
|
|
Expired
|
- 0 -
|
- 0 -
|
|
|
Outstanding at December 31, 2011
|
11,598,411
|
$ - 0 -
|
|
|
Exercisable at December 31, 2011
|
7,951,420
|
During the year ended December 31, 2011, the Company issued 4,105,134 options to purchase the Company’s common stock with an average exercise price of $1.06. Of the 4,105,134 options granted, the options will vest either monthly or quarterly as follows:
|
Vesting Information
|
||||||
|
Shares
|
Frequency
|
Begin Date
|
End Date
|
|||
|
300,481
|
Quarterly
|
March 1, 2011
|
February 28, 2012
|
|||
|
2,904,653
|
Monthly
|
January 1, 2012
|
December 31, 2012
|
|||
|
900,000
|
Monthly
|
September 15, 2011
|
September 14, 2014
|
|||
A summary of the status of the options outstanding at December 31, 2011 is presented below:
|
Options Outstanding
|
Options Exercisable
|
||||||||
|
Exercise Price
|
Number Outstanding
|
Weighted Average Remaining Contractual Life
|
Weighted Average Exercise Price
|
Number Exercisable
|
Weighted Average Exercise Price
|
||||
|
$ 0.65-$0.71
|
75,000
|
2.50 years
|
$ 0.69
|
75,000
|
$ 0.69
|
||||
|
$ 0.70
|
7,358,277
|
7.75 years
|
$ 0.70
|
7,358,275
|
$ 0.70
|
||||
|
$ 0.83
|
3,205,134
|
4.25 years
|
$ 0.83
|
358,145
|
$ 0.83
|
||||
|
$ 1.00
|
60,000
|
4.50 years
|
$ 1.00
|
60,000
|
$ 1.00
|
||||
|
$ 1.90
|
900,000
|
9.75 years
|
$ 1.90
|
100,000
|
$1.90
|
||||
|
11,598,411
|
7,951,420
|
||||||||
At December 31, 2011, the total compensation of $2,490,828 for unvested shares is to be recognized over the next thirty-three months on a weighted average basis.
At December 31, 2011, vested options of 7,951,420 and non-vested options of 3,646,991 had an aggregate intrinsic value of $5,986,629.
F -19
APPLIED MINERALS, INC.
(An Exploration Stage Mining Company)
Notes to the Financial Statements
NOTE 10 - EARNING (LOSS) PER SHARE
The computation of earnings (loss) per share of common stock is based on the weighted average number of shares outstanding at the date of the financial statements. The computation of diluted earnings per common share is based on the weighted average number of shares outstanding during the year plus the common stock equivalents that would arise from the exercise of stock options and warrants outstanding under the treasury method and the average market price per share during the year. Common stock equivalents at December 31, 2011 consisted of 18,022,188 of which 11,598,411 were in options and 6,423,777 were in warrants. Common stock equivalents at December 31, 2010 consisted of 8,173,464, of which 7,593,277 in options and 580,187 in warrants. Common stock equivalents at December 31, 2009 consisted of 7,533,277 in options and 260,000 in warrants. Common stock equivalents at December 31, 2011, 2010 and 2009 were considered but were not included in the computation of loss per share at December 31, 2011, 2010 and 2009 because they would have been anti-dilutive.
|
Net Loss
|
Shares
|
Per-Share
|
||||
|
(Numerator)
|
(Denominator)
|
Amount
|
||||
|
For the year ended December 31, 2011:
|
||||||
|
Basic EPS
|
||||||
|
Net loss to common shareholders
|
$ (7,534,956)
|
74,568,658
|
$ (0.10)
|
|||
|
For the year ended December 31, 2010:
|
||||||
|
Basic EPS
|
||||||
|
Net loss to common shareholders
|
$ (4,767,715)
|
68,396,770
|
$ (0.07)
|
|||
|
For the year ended December 31, 2009:
|
||||||
|
Basic EPS
|
||||||
|
Net loss to common shareholders
|
$ (6,766,200)
|
60,665,785
|
$ (0.11)
|
NOTE 11 – SETTLEMENT OF DEBT
At December 30, 2011 a 10% note payable to a legal firm due in monthly installments of $15,000 was settled with a $260,000 cash payment. This payment generated a gain on settlement of debt of $101,380. (See Note 6)
NOTE 12 – INCOME TAXES
At December 31, 2011, the Company had deferred tax assets principally arising from net operating loss carry-forwards for income tax purposes. The Company calculates its deferred tax assets using the federal tax rate of 35% and the following state tax rates: Idaho (7.6%) and Utah (5%). Due to operating losses, the uncertainty of future profitability and limitations on the utilization of net operating loss carry-forwards under IRC Section 382, a valuation allowance has been recorded to fully offset the Company’s deferred tax asset.
The actual Federal income tax provision differs from the amount computed by applying the Federal corporate income tax rate of 35% to income before taxes as follows:
|
December 31, 2011
|
December 31, 2010
|
December 31, 2009
|
||||
|
Expected federal tax benefit
|
(2,637,229)
|
$ (1,668,700)
|
$ (2,368,170)
|
|||
|
State and local taxes
|
(949,403)
|
(600,732)
|
(852,541)
|
|||
|
Non-deductible expenses
|
2,181,396
|
334,669
|
1,041,879
|
|||
|
Change in valuation allowance
|
1,405,236
|
1,934,767
|
3,220,711
|
|||
|
Income tax expense
|
$ -
|
$ -
|
$ -
|
The tax effect of temporary differences that give rise to the deferred tax assets at December 31, 2011 are as follows:
|
December 31, 2011
|
December 31, 2010
|
December 31, 2009
|
||||
|
Net Operating Loss Carryforwards
|
$ (12,544,019)
|
$ (11,138,782)
|
$ (9,204,020)
|
|||
|
Total gross deferred tax assets
|
12,544,019
|
11,138,782
|
9,204,020
|
|||
|
Valuation allowance
|
(12,544,019)
|
(11,138,782)
|
(9,204,020)
|
|||
|
Net deferred tax assets
|
$ - 0 -
|
$ - 0 -
|
$ - 0 -
|
F -20
APPLIED MINERALS, INC.
(An Exploration Stage Mining Company)
Notes to the Financial Statements
NOTE 12 – INCOME TAXES (CONTINUED)
In assessing the realization of deferred tax assets, management determines whether it is more likely than not some, or all, of the deferred tax assets will not be realized. The ultimate realization of deferred tax assets is dependent upon the generation of future taxable income during the periods in which those temporary differences become deductible. Management considers projected taxable income and tax planning strategies in making this assessment. Based upon the level of historical taxable losses and projected taxable losses over the periods that the deferred tax assets are deductible, management believes it is more likely than not that the Company will not realize the benefits of these deductible differences and thus recorded a valuation allowance against the entire deferred tax asset balance. As of December 31, 2011, 2010 and 2009, the valuation allowances were $12,544,019, $11,138,782 and $9,229,434, respectively. The change in valuation allowance between 2011 and 2010 was $1,405,236. The change in valuation allowance between 2010 and 2009 was $1,934,763.
At December 31, 2011, 2010 and 2009, the Company had net operating loss carry-forwards of approximately $29,399,200, $24,355,400 and $19,612,600 for federal income tax purposes, respectively. The net operating loss carry-forwards are available to be utilized against future taxable income through fiscal year 2031, subject to the Tax Reform Act of 1986, which imposed substantial restrictions on the utilization of net operating losses and tax credits in the event of an “ownership change” as defined by the Internal Revenue Code. Federal and state net operating losses are subject to limitations as a result of these restrictions. Under such circumstances, the Company’s ability to utilize its net operating losses against future income may be reduced.
NOTE 13 – RELATED PARTIES
The Company is a related party to IBS Capital (“IBS”), an entity whose principal, David Taft, is a Company director. During the years ended December 31, 2010, the Company received $1,500,000 from IBS in exchange for convertible debt.
The Company is a related party to Material Advisors (“MA”), an entity with which the Company has a management agreement for executive services. The agreement has a term beginning on December 30, 2008 and ending on December 30, 2011 and calls for monthly management fees of $83,333 to be paid for services. In addition to management fees, MA was granted stock options equivalent to 6,583,278 shares of common stock. Such options vest equally over the life of the management agreement and may be exercised at a strike price of $0.70 per share.
Forbearance Agreement
The Company and certain of its former officers were defendants in a class action In Re Atlas Mining Company Securities Litigation (the “Class Action”), whose settlement has been approved by the court. As an accommodation to facilitate the settlement of the Class Action, the following persons (the “Forbearing Shareholders”) entered into a Forbearance Agreement whereby they agreed not to submit claims for damages relating to shares that they own or control and that would otherwise be eligible to participate in the settlement: David Taft; The IBS Turnaround (QP) Fund (A Limited Partnership), the IBS Turnaround Fund (A Limited Partnership), The IBS Opportunity Fund (BVI), Ltd. (the prior three hereafter collectively “IBS”); Andre Zeitoun (the Company’s CEO), Chris Carney (the Company’s Interim CFO), and Eric Basroon (an employee of Material Advisors LLC). The Forbearance Agreement provided that:
Prior to the time that the Forbearing Shareholders entered into the Forbearance Agreement, certain members of the Board of Directors, without taking formal action as a Board, acknowledged that the Forbearing Shareholders were accommodating the Company in a manner not required and should be compensated “as if” they had submitted claims as class members in the Settlement and this acknowledgement was communicated to the Forbearing Shareholders.
The Board subsequently appointed a committee of disinterested directors to determine whether compensation should be paid, the amount of any such compensation, and whether to pay compensation in cash or Common Stock. The committee consists of John Levy, Morris Weiss, and Evan Stone.
On March 29, 2010, the committee adopted resolutions designed to treat the Forbearing Shareholders as if they had participated in the settlement.
To achieve this goal, damages of each Forbearing Shareholder were computed using the formula for determining damages in the Class Action. Damages per share are lesser of $0.84 or the difference between the purchase price and $0.80. The damages for each Forbearing Shareholders are approximately as follows: Taft - $0; IBS - $3,564,657; Zeitoun - $479,411; Carney - $231,735; and Basroon - $89,250. The aggregate damages for all of the Forbearing Shareholders are approximately $4,365,053.
The amount payable as compensation to the Forbearing Shareholders in the aggregate will be an amount equal to the Net Settlement Fund in the Class Action (approximately $800,000) multiplied by the fraction in which the numerator is the aggregate damages of the Forbearing Shareholders and the denominator is the sum of (i) the aggregate damages of the Forbearing Shareholders and (ii) the dollar amount of claims actually submitted by shareholders against the Net Settlement Fund in the Class Action (this amount is different form the total damages of all shareholders other than the Forbearing Shareholders).
The deadline for submitting claims in the Class Action was May 6, 2010. The plaintiff’s counsel is currently evaluating all claims. The amount payable to the Forbearing Shareholders varies depending on the dollar amount of claims actually submitted in the Class Action, the higher the dollar amount of claims submitted in the Class Action, the lower the amount payable to the Forbearing Shareholders. By way of example, if no claims at all were submitted by shareholders in the Class Action, the amount payable to all of the Forbearing Shareholders would be $800,000; if $3,000,000 in claims are submitted in the Class Action, the amount payable to the Forbearing Shareholders would be $474,136.
F -21
APPLIED MINERALS, INC.
(An Exploration Stage Mining Company)
Notes to the Financial Statements
NOTE 13 – RELATED PARTIES (CONTINUED)
Forbearance Agreement (continued)
The committee of disinterested directors has determined that compensation to the Forbearing Shareholders will be paid in Common Stock of the Company. The shares will be valued at the market price of the Company’s Common Stock as of the closing price on the first date on which the distribution agent in the Class Action sends or delivers distributions from the Net Settlement Fund to shareholders who have submitted claims.
If the Forbearing Shareholders had not entered into the Forbearance Agreement, they believe that the Company may not have been able to settle the Class Action on the favorable terms that it did. The damages suffered by the Forbearing Shareholders, based on an estimate of total damages provided by counsel to the plaintiffs in the Class Action, represented a majority of the total damages of the class. The plaintiff’s counsel required a representation by the Company that any damages paid by the Company to the Forbearing Shareholders not exceed amounts granted to the class. The Forbearing Agreement had the effect of making the entire Net Settlement Fund available to other shareholders. The Forbearing Shareholders believe that if they did not enter into the Forbearance Agreement, plaintiffs would have insisted on a significantly higher settlement amount and this in all likelihood would have forced the Company to raise additional capital by selling stock at, what they believed to be, unfavorable terms at the time.
On November 22, 2010, the Company issued to Messrs. Taft, Zeitoun, Carney and Basroon, 349,286 shares, 46,975 shares, 22,707 shares and 8,745 shares, respectively as determined by the terms of the Forbearance Agreement.
NOTE 14 – COMMITMENTS AND CONTINGENCIES
ENVIRONMENTAL MATTERS
Expenditures for ongoing compliance with environmental regulations that relate to current operations are expensed or capitalized as appropriate. Expenditures resulting from the remediation of existing conditions caused by past operations that do not contribute to future revenue generations are expensed. Liabilities are recognized when environmental assessments indicate that remediation efforts are probable and the costs can be reasonably estimated.
Estimates of such liabilities are based upon currently available facts, existing technology and presently enacted laws and regulations taking into consideration the likely effects of inflation and other societal and economic factors, and include estimates of associated legal costs. These amounts also reflect prior experience in remediating contaminated sites, other companies’ clean-up experience and data released by The Environmental Protection Agency or other organizations. Such estimates are by their nature imprecise and can be expected to be revised over time because of changes in government regulations, operations, technology and inflation. Recoveries are evaluated separately from the liability and, when recovery is assured, the Company records and reports an asset separately from the associated liability.
Based upon management’s current assessment of its environmental responsibilities, the Company cannot reasonably estimate any reclamation or remediation liability that may occur in the future, if any.
LITIGATION
The Company records accruals for contingencies when it is probable that a liability had been incurred and the amount of loss can be reasonably estimated. In addition to the matters described herein, the Company is involved in or subject to, or may become involved in or subject to, routine litigation, claims, disputes, proceedings and investigations in the ordinary course of business, which in management’s opinion will not have a material adverse effect on the financial condition, cash flows or results of operations. Currently the Company has no lawsuits, claims, proceedings and investigations pending.
OTHER COMMITMENTS
Material Advisors LLC
On December 30, 2008, the Company entered into a Management Agreement with Material Advisors LLC, a management services company (“Manager”). The Management Agreement has a term ending on December 31, 2010 with automatic renewal for successive one-year periods unless either Manager or Company provides 90 days prior notice of cancellation to the other party or pursuant to the termination provisions of the Management Agreement. Under the Management Agreement Manager will perform or engage others, including Andre Zeitoun, a principal of Manager, Chris Carney and Eric Basroon (“Management Personnel”), to perform senior management services including such services as are customarily provided by a chief executive officer but not (unless otherwise agreed) services customarily provided by a chief financial officer. Pursuant to the Management Agreement, Andre Zeitoun will serve as Company’s Chief Executive Officer and will be appointed as a member of the Company’s Board of Directors.
The services provided by Manager include, without limitation, consulting with the Board of Directors and the Company’s management on business and financial matters. Manager will be paid an annual fee of $1,000,000 per year, payable in equal monthly installments of $83,333. Manager will be solely responsible for the compensation of the Management Personnel, including Mr. Zeitoun and the Management Personnel will not be entitled to any direct compensation or benefits from the Company (including, in the case of Mr. Zeitoun, for service on the Board). The Company granted Manager non-qualified stock options to purchase, for $0.70 per share, up to 6,583,277 shares of the Company’s stock. On February 8, 2011, the Company’s Board of Directors extended the Management Agreement for one additional year, thus extending the termination date of the agreement to December 31, 2012. As part of the extension of the Management Agreement, the Company’s board of Directors approved the issuance of 2,904,653 warrants to purchase shares of common stock of the Company at $0.83 per share. The warrants have a term of 5 years and vest equally on a monthly basis beginning January 2012.
F -22
APPLIED MINERALS, INC.
(An Exploration Stage Mining Company)
Notes to the Financial Statements
NOTE 15 – SUBSEQUENT EVENTS
During the month of March 2012 milling leases will automatically renew for $5,150 per month. This automatic renewal will be for a twelve-month term, and thereafter will renew for successive three-month terms until the equipment is delivered to lessor or equipment is purchased at fair market value. (See Note 5)
As of January 1, 2012, the Company’s management agreement with Material Advisors, LLC was amended (the “2012 Agreement”). The amendments included: (i) the Company is to be responsible for any employee benefits provided to the members of Material Advisors, LLC; and (ii) the Company is to be solely responsible for all travel, entertainment, office and marketing expenses and all other ordinary and necessary business expenses incurred by Material Advisors, LLC and its members in connection with the services provided under the 2012 Agreement.
On January 17, 2012 the Company’s Board of Directors unanimously agreed to pay a performance bonus of $750,000 to Material Advisors LLC, a management services company.
F -23
SIGNATURES
In accordance with Section 13 or 15(d) of the Exchange Act, the registrant has duly caused this report to be signed on its behalf by the undersigned, thereunto duly authorized on this 2 6 th day of April 2012.
|
APPLIED MINERALS, INC.
|
|||
|
By:
|
/s/ ANDRE ZEITOUN
|
||
|
Andre Zeitoun
|
|||
|
Chief Executive Officer
|
|||
|
By:
|
/s/ CHRISTOPHER T. CARNEY
|
||
|
Christopher T. Carney
|
|||
|
Interim Chief Financial Officer
|
In accordance with the Exchange Act, this report has been signed below by the following persons on behalf of the registrant and in the capacities and on the dates indicated.
|
Signature
|
Title
|
Date
|
|
/s/ JOHN F. LEVY
|
Director
|
April 26, 2012
|
|
John F. Levy
|
||
|
/s/ DAVID TAFT
|
Director
|
April 26, 2012
|
|
David Taft
|
||
|
/s/ ANDRE ZEITOUN
|
Director
|
April 26, 2012
|
|
Andre Zeitoun
|
||
|
/s/ EVAN STONE
|
Director
|
April 26, 2012
|
|
Evan Stone
|
F-