Attached files
Table of Contents
UNITED STATES
SECURITIES AND EXCHANGE COMMISSION
WASHINGTON, D.C. 20549
FORM 10-K
| x | ANNUAL REPORT PURSUANT TO SECTION 13 OR 15(d) OF THE SECURITIES EXCHANGE ACT OF 1934 |
For the fiscal year ended January 28, 2012
OR
| ¨ | TRANSITION REPORT PURSUANT TO SECTION 13 OR 15(d) OF THE SECURITIES EXCHANGE ACT OF 1934 |
COMMISSION FILE NO. 001-11679
Orchard Supply Hardware Stores Corporation
(Exact name of Registrant as specified in its charter)
| Delaware | 95-4214109 | |
| (State or other jurisdiction of incorporation or organization) |
(I.R.S. Employer Identification Number) | |
| 6450 Via Del Oro San Jose, California |
95119 | |
| (Address of principal executive offices) | (Zip Code) | |
Registrant’s telephone number, including area code: (408) 281-3500
Indicate by check mark if the registrant is a well-known seasoned issuer, as defined in Rule 405 of the Securities Act. Yes ¨ No x
Indicate by check mark if the registrant is not required to file reports pursuant to Section 13 or Section 15(d) of the Act. Yes ¨ No x
Indicate by check mark whether the registrant (1) has filed all reports required to be filed by Section 13 or 15(d) of the Securities Exchange Act of 1934 during the preceding 12 months and (2) has been subject to such filing requirements for the past 90 days. Yes x No ¨
Indicate by check mark whether the registrant has submitted electronically and posted on its corporate Web site, if any, every Interactive Data File required to be submitted and posted pursuant to Rule 405 S-T (232.405 of this chapter) during the preceding 12 months (or for such shorter period that the registrant was required to submit and post such files). Yes x No ¨
Indicate by check mark if disclosure of delinquent filers pursuant to Item 405 of Regulation S-K is not contained herein, and will not be contained, to the best of registrant’s knowledge, in definitive proxy or information statements incorporated by reference in Part III of this Form 10-K or any amendment to this Form 10-K. x
Indicate by check mark whether the registrant is a large accelerated filer, an accelerated filer, a non-accelerated filer, or a smaller reporting company. See definitions of “large accelerated filer,” “accelerated filer,” and “smaller reporting company” in Rule 12b-2 of the Exchange Act.
| Large accelerated filer | ¨ | Accelerated filer | ¨ | |||
| Non-accelerated filer | x | Smaller reporting company | ¨ | |||
Indicate by check mark whether the registrant is a shell company (as defined in Rule 12b-2 of the Exchange Act). Yes ¨ No x
As of July 30, 2011, the registrant’s public stock was not publicly traded, and the aggregate market value of voting stock held by non-affiliates cannot be calculated as of that date.
As of April 2, 2012, the registrant had 4,810,588 shares of Class A Common Stock, par value $0.01 per share, 8,644.06788 shares of Class B Common Stock, par value $0.01 per share, and 1,194,000 shares of Class C Common Stock, par value $0.01 per share, outstanding.
DOCUMENTS INCORPORATED BY REFERENCE
Portions of the Proxy Statement for the 2012 Annual Meeting of Stockholders (the “Proxy Statement”), to be filed within 120 days of the end of the fiscal year ended January 28, 2012, are incorporated by reference in Part III hereof. Except with respect to information specifically incorporated by reference in this Form 10-K, the Proxy Statement is not deemed to be filed as part hereof.
Table of Contents
ORCHARD SUPPLY HARDWARE STORES CORPORATION AND SUBSIDIARIES
2
Table of Contents
Special Note Regarding Forward-Looking Statements
We believe that some of the information in this document constitutes forward-looking statements. You can identify these statements by forward-looking words such as “outlook”, “believes”, “expects”, “appears”, “may”, “will”, “should”, “intend”, “target”, “projects”, “estimates”, “plans”, “forecast”, “is likely to”, “anticipates”, or the negative thereof or comparable terminology. Examples of such statements include references to revenue growth, new store openings and remodels, comparable store sales, demand for our products and services, the state of the California economy, inventory and in-stock positions, cash flow, and the like. You should read statements that contain these words carefully because they:
| • | discuss future expectations; |
| • | contain projections of future results of operations or financial condition; or |
| • | state other “forward-looking” information. |
We believe it is important to communicate our expectations to our stockholders. However, there may be events in the future that we are not able to accurately predict or over which we have no control. The risk factors and cautionary language discussed in this document outline examples of risks, uncertainties and events that may cause actual results to differ materially from the expectations described in the forward-looking statements, including among other things:
| • | our business strategy and financial performance; |
| • | our revenue and customer volatility based upon weather and general economic conditions; |
| • | fluctuations in various product costs; and |
| • | competition and other risks related to the retail home improvement business. |
You are cautioned not to place undue reliance on these forward-looking statements, which speak only as of the date of this document.
All forward-looking statements included herein are expressly qualified in their entirety by the cautionary statements contained or referred to in this section. Except to the extent required by applicable laws and regulations, we undertake no obligation to update these forward-looking statements to reflect events or circumstances after the date of this document or to reflect the occurrence of unanticipated events.
You should be aware that the occurrence of the events described in the “Risk Factors” portion of this annual report, the documents incorporated herein and our other SEC filings could have a material adverse effect on our business, prospects, financial condition or operating results.
3
Table of Contents
Part I
Background of Orchard Supply Hardware Stores Corporation
Orchard Supply Hardware Stores Corporation (“Orchard”) began as a farm supply purchasing cooperative created by a group of Santa Clara County, California farmers in 1931. These 30 orchardists were joined by more than 2,000 other farmers in the ’30s, ’40s, and ’50s as merchandise lines expanded from orchard supplies to a vast array of hardware, housewares and garden equipment. In the mid 1950s, the electronics industry moved into Santa Clara Valley and many orchards were replaced by subdivisions. The homeowners and industrial buyers soon discovered Orchard’s friendly service and wide selection. This new market filled the void left by the fast disappearing orchardists.
To continue doing business, Orchard adopted a Store Support Center structure and members of the farmers’ cooperative were issued shares of stock in the new corporation. In 1957, Orchard began expanding by opening a new store in downtown San Jose, California. Expansion continued, and in 1979 Orchard went through one of several ownership changes culminating in the 1996 purchase of Orchard by Sears, Roebuck and Co., (“Sears, Roebuck”), a subsidiary of Sears Holding Corporation (“Sears Holdings”). Subsequently, in 2005, Ares Corporate Opportunities Fund (“ACOF”) purchased approximately a 20% ownership interest in Orchard, leaving Sears, Roebuck owning approximately an 80% ownership interest. Orchard is a Delaware corporation that was incorporated on March 31, 1989 and is based in San Jose, California.
On December 30, 2011, Orchard became an independent, publicly traded company as a result of Sears Holdings distribution of its shares of Orchard to Sears Holdings’ stockholders (the “Spin-Off” or “Distribution”). Upon the Spin-Off, Sears Holdings’ stockholders of record as of the close of business on December 16, 2011 (the “Record Date”) received one share of Orchard’s Class A Common Stock and one share of Orchard’s Series A Preferred Stock for every 22.141777 shares of Sears Holdings’ common stock held as of the Record Date. Following the Spin-Off, since January 3, 2012, our Class A Common Stock has been listed and traded on NASDAQ under the symbol “OSH” and our Series A Preferred Stock has been quoted on the OTCQB under the symbol “OSHSP.”
At the time of the Spin-Off, Class A Common Stock owned by ACOF immediately prior to the Spin-Off was exchanged for Orchard’s Class C Common Stock. Orchard also has issued Class B Common Stock held by certain former employees of Orchard who acquired such shares of Class B Common Stock in connection with past equity compensation programs of Orchard.
Unless the context otherwise requires, Orchard Supply Hardware Stores Corporation, the registrant, together with Orchard Supply Hardware LLC, its wholly-owned operating company subsidiary, and its other directly or indirectly owned subsidiaries, are collectively referred to in this Annual Report on Form 10-K (“Form 10-K”) as the “Company”, “Orchard”, “we”, “us” and “our.” Information regarding the Company’s fiscal periods is included in Item 7, “Management’s Discussion and Analysis of Financial Condition and Results of Operations.”
Our Business
We are a California specialty retailer primarily focused on homeowners with repair, maintenance and improvement needs. Our stores are designed to appeal to convenience-oriented customers, whose purchase occasions are largely driven by their home repair, maintenance and improvement needs throughout the home, garden and outdoor living areas. We also serve the small professional customer whose purchases are largely motivated by a need for incremental supplies and tools to complete construction projects. As of January 28, 2012, we operated 87 full-service home improvement stores in California. Our stores average approximately 44,000 square feet of enclosed space, plus approximately 8,000 square feet of nursery and garden area.
4
Table of Contents
We operate in one reportable segment and provide a merchandise mix which consists of various product categories, including repair and maintenance, lawn and garden and in-home products. Our repair and maintenance category consists of plumbing, electrical, paint, tools, hardware, and industrial products. Our lawn and garden category consists of nursery, garden, outdoor power and seasonal products. Our in-home category consists mainly of our housewares and appliances products.
Industry
The U.S. home improvement industry is an estimated $270 billion market consisting of the consumer and professional segments. We compete primarily in the $198 billion consumer segment where, according to the Home Improvement Research Institute, sales during 2011 grew at a 1.6% average growth rate. The consumer segment of the U.S. home improvement industry is also expected to grow at a 5.6%, five-year average growth rate from 2011 through 2015.
Our Operating and Growth Strategy
We are dedicated to providing a superior customer experience through convenient store locations and formats with in-stock availability of a broad and differentiated selection of high-quality products at competitive prices, all delivered by friendly, motivated, and knowledgeable employees. We believe a great customer experience will help drive customer loyalty and satisfaction, thus increasing frequency of visits and market share. Success in these areas will also support our growth objectives. The key elements of this strategy are Merchandising and Marketing, Store Design, and Store Operations as described more fully below:
Merchandising and Marketing
A typical Orchard store offers a wide selection of repair and maintenance products comparable to larger warehouse competitors and carries more products than the typical smaller independent hardware store. We focus on offering the complete solution for customers to satisfy their home repair and maintenance, paint, seasonal, outdoor living, and lawn and garden needs. Our merchandising initiatives are focused on enhancing our product assortments, in-store merchandising and store layouts to drive incremental revenue and improve gross margin performance.
We offer our customers a broad selection of national brand products from well-known manufacturers such as 3M, American Standard, Benjamin Moore, Black and Decker, Bosch, Corona, Craftsman, Delta, DeWalt, Duracell, General Electric, Kohler, Leviton, Makita, Milwaukee, Moen, Quikrete, RainBird, Rubbermaid, Rustoleum, Scotts, Stanley, Toro and Weber. Our private label brands typically generate higher gross profit margins than third-party brands and include Aqua Vista, Orchard, Pacific Bay and Western Hawk; these private label brands also add to the distinctive nature of our product selection. For fiscal 2011, private label sales accounted for approximately 6.1% of our total net sales.
We believe that we have a good working relationship with over 800 merchandising suppliers. In fiscal 2011, our largest supplier accounted for 3.8% of our merchandise and our top ten suppliers accounted for approximately 23.1% of our total purchases. Most of our merchandise is available from multiple suppliers so we believe the loss of any single one would not materially impact our business.
Store Design
Our general store format was designed using lower profile shelving and higher visibility signage than is usually found in our warehouse home center competitors, which are typified by warehouse racking and over-stacked aisles. Customers can generally view the majority of our store upon entering, helping them to easily and quickly locate items. Related departments are generally located adjacent to each other, and most merchandise is displayed according to centrally developed floor plans that are designed to optimize space utilization. In
5
Table of Contents
addition, we strive to select store sites that are easily accessible, conveniently located and have ample parking capacity. These features are intended to provide customers with a comfortable and convenient shopping environment.
In addition, in furtherance of Orchard’s goal of providing the customer with value and selection within a neighborhood hardware store feel, we have developed a new store prototype implemented in our Princeton Plaza store located in San Jose, California, which combines an enhanced focus on our merchandising program with a new store format. This prototype features Orchard’s updated logo and branding, enhanced curb appeal, a prominent and conveniently located nursery and garden center, our new Workbench area that concentrates key hardware services into one convenient location, and a more engaging overall shopping experience.
A key component of our growth strategy is to implement this new store prototype, or aspects of it, throughout our store base. By the end of our fiscal 2012, we expect to have transitioned nearly 15% of our store base to this new format. In addition, we will be rebranding and repainting several of our existing stores during the year in an effort to strengthen our brand presence.
Store Operations
We strive to promote a strong company culture featuring a team approach to store operations. Our store associates work in a zone coverage in-store structure “armed” with radio communications devices to quickly contact each other in order to serve our customer. This approach has also allowed us to simplify and enhance the deployment of our associates to help them focus on store sales activities.
Our stores are generally open seven days per week. Our stores are operated by store managers, who report to one of four regional vice presidents. Our store managers are responsible for day-to-day store operations and subject to operating procedures established at our store support center. We believe our store-level management is one of the more stable and experienced groups in the industry with the average tenure of an Orchard store manager being approximately 14 years. We believe that our employees are the key to our success and support the development of a culture that fosters personal interaction, mutual respect, empowerment, enthusiasm, and commitment.
Competition
The home improvement industry in California is highly competitive. We are positioned between larger warehouse home center competitors and smaller independent hardware stores and consider The Home Depot, Lowe’s, Ace Hardware and True Value as our primary competitors. Based on publically-available information, we believe that in California each of The Home Depot, Lowe’s, Ace Hardware, and True Value currently have significantly more stores than we do. Discount retailers such as Walmart, Costco, Target and Kmart, and multi-line retailers such as Sears, Roebuck also compete with us in certain product areas. In addition, our garden centers compete against smaller local nurseries and Armstrong Garden Centers in Southern California. Online and catalog businesses, which handle similar lines of merchandise, also compete with us.
Seasonality
Our business is seasonal. Our highest sales volume typically occurs in our second fiscal quarter, and the lowest volume typically occurs during our fourth fiscal quarter.
Distribution and Systems Infrastructure
Our leased distribution center in Tracy, California, stocks the majority of products that are offered in our stores and cross-docks additional products to provide our stores with approximately 66% of our merchandise needs. The remainder of our merchandise, including all of our live goods, goes directly from our vendors or
6
Table of Contents
distributors to our stores. We operate a private fleet of leased trucks and owned and leased trailers to deliver merchandise to most of our Northern California stores. We contract with a third party common carrier to deliver our merchandise to selected coastal and more distant Northern California and Southern California stores.
Compliance with Environmental Laws
The Company’s compliance with the federal, state and local laws and regulations which have been enacted or adopted regulating the discharge of materials into the environment or otherwise related to the protection of the environment is not expected to have a material adverse effect upon the Company’s financial position or results of operations.
Trademarks and Patents
We have registered several service marks and trademarks with the United States Patent and Trademark Office, including our service marks “Orchard”, “Orchard Supply Hardware” and “Orchard Supply Hardware Est. 1931” and trademarks “Aqua Vista,” “Bridgewater,” “OSH”, and “Western Hawk”. We believe that these service marks and trademarks, are important components of our marketing and merchandising strategies.
Executive Officers
We have recruited an experienced executive management team with the objective of increasing our profitability and stimulating our growth. Our executive management team has an average of over 18 years of retail-related experience and an average of 8 years in the home improvement industry. The names of our executive officers, their respective ages and positions as of April 2, 2012 and descriptions of their business experience are set forth below. There are no family relationships among any of the executive officers named below.
Mark R. Baker, President and Chief Executive Officer, age 54
Mr. Baker has been President and Chief Executive Officer since March 2011. From 2008 to 2010, Mr. Baker served as President and Chief Operating Officer of The Scotts Miracle-Gro Co., a leading manufacturer and marketer of branded consumer lawn and garden products. From 2002 to 2008, Mr. Baker served as Chief Executive Officer and President of Gander Mountain Company, an outdoor retailer specializing in hunting, fishing and camping gear. From 1997 to 2001, Mr. Baker held various positions with The Home Depot, lastly serving as Chief Merchandising Officer and Executive Vice President of Merchandising.
Chris D. Newman, Executive Vice President, Chief Financial Officer and Treasurer, age 46
Mr. Newman has been Executive Vice President, Chief Financial Officer and Treasurer since November 2011. From 2006 to 2011, Mr. Newman was Chief Financial Officer, Senior Vice President and Secretary of Restoration Hardware, Inc., a chain of home furnishings, functional and decorative hardware, and related merchandise. From 2005 to 2006, Mr. Newman served as Vice President and Chief Financial Officer of Store Operations at Limited Brands, Inc.
Steven L. Mahurin, Executive Vice President, Merchandising, age 52
Mr. Mahurin has been Executive Vice President, Merchandising since May 2011. From 2008 to 2011, Mr. Mahurin was Executive Vice President of Merchandising for Office Depot. From 2004 to 2008, Mr. Mahurin was Senior Vice President, Chief Merchandising Officer for True Value Company, a hardware cooperative. From 2002 to 2004, Mr. Mahurin was Vice President of Merchandising and Marketing at Golf and Tennis Pro Shop, Inc. From 1989 to 2002, Mr. Mahurin held various positions with The Home Depot, lastly serving as Senior Vice President of Merchandising.
7
Table of Contents
David I. Bogage, Senior Vice President, Human Resources, age 57
Mr. Bogage has been Senior Vice President of Human Resources since April 2011. From 2009 to 2011, Mr. Bogage was Senior Vice President, Talent and Organizational Development of The Scotts Miracle-Gro Co., a leading manufacturer and marketer of branded consumer lawn and garden products. From 2003 to 2008, he was Senior Vice President, Human Resources and Organizational Development for The Haskell Company and from 1994 to 2003 he was Vice President, Human Resources at The Home Depot.
Mark A. Bussard, Senior Vice President, Operations, age 47
Mr. Bussard has been Senior Vice President, Operations since June 2011. From 1994 to 2010, Mr. Bussard held various positions with Gander Mountain Company, an outdoor retailer specializing in hunting, fishing and camping gear, lastly serving as Senior Vice President of Retail Sales.
Michael W. Fox, Senior Vice President, General Counsel and Secretary, age 53
Mr. Fox has been Senior Vice President, General Counsel and Secretary since October 2011. From 2005 to 2011, Mr. Fox held various positions with Jamba, Inc., a leading restaurant retailer of smoothies and other beverage and food offerings, lastly serving as Senior Vice President, General Counsel and Secretary.
Steve Olsen, Senior Vice President, Supply Chain, Information Technology and Chief Strategy Officer, age 40
Mr. Olsen has been the Senior Vice President, Supply Chain, Information Technology and Chief Strategy Officer since April 2011. Mr. Olsen joined the Company as Senior Vice President, Merchandising in June 2010. From 2004 to 2010, Mr. Olsen held various positions at Office Depot, Inc., lastly serving as Vice President of Merchandising, Supplies.
Employees
As of January 28, 2012, we employed 5,329 persons, 516 of whom were at our corporate offices, our distribution center, or part of our field operations. The remaining employees were store management and hourly store personnel, of which approximately 31% were full-time. Our employees are not covered by a collective bargaining agreement. We consider our employee relations to be good.
Available Information
Our Annual Reports on Form 10-K, Quarterly Reports on Form 10-Q, Current Reports on Form 8-K and amendments to reports filed or furnished pursuant to Sections 13(a) and 15(d) of the Securities Exchange Act of 1934, as amended, are available on our website at www.osh.com, after we electronically file such reports with the Securities and Exchange Commission (the “SEC”). The SEC also maintains an Internet site that contains reports, proxy and information statements, and other information that we file electronically with the SEC at http://www.sec.gov. Information on our website is not incorporated into this Form 10-K. Stockholders may request free copies of these documents from:
Corporate Secretary
Orchard Supply Hardware Stores Corporation
6450 Via Del Oro
San Jose, California 95119
(408) 281-3500
We included the certifications of the Chief Executive Officer and the Chief Financial Officer of Orchard relating to the quality of our public disclosure, as required by Section 302 of the Sarbanes-Oxley Act of 2002 and related rules, in this Form 10-K as Exhibits 31.1 and 31.2 hereto.
8
Table of Contents
Our business, prospects, financial condition, operating results and the trading price of our Class A Common Stock and Preferred Stock could be materially adversely affected by any of the following risks, as well as other risks not currently known to us or that we currently consider immaterial. In assessing the risks described below, you should also refer to the other information contained in this Annual Report on Form 10-K, including Part II, Item 7. Management’s Discussion and Analysis of Financial Condition and Results of Operations (MD&A) and the consolidated financial statements and the related notes in Part II, Item 8. Financial Statements and Supplementary Data of this Annual Report on Form 10-K. These risks and uncertainties could also cause our actual results to differ materially from the results contemplated by the forward-looking statements contained in this report, other filings with the SEC, news releases, reports, proxy statements, registration statements, and other written communications, as well as oral forward-looking statements made from time to time by representatives of the Company.
Risks Relating to Our Business
If we fail to offer merchandise and services that our customers want, our revenues may be limited, which would reduce our revenues and profits.
In order for our business to be successful, we must identify, obtain supplies of, and offer to our customers attractive, innovative and high-quality merchandise on a continuous basis. Our products and services must satisfy the desires of our customers, whose preferences may change in the future. If we misjudge either the demand for products and services we sell or our customers’ purchasing habits and tastes, we may be faced with excess inventories of some products and missed opportunities for products and services we chose not to offer. In addition, our revenues may decline or we may be required to sell the merchandise we have obtained at lower prices. This would have a negative effect on our business and results of operations.
The home improvement retail industry is highly competitive and we may be unable to compete effectively.
If we are unable to compete effectively in the highly competitive home improvement retail industry, our business and our results of operations could be materially adversely affected. The home improvement retail industry is highly competitive with few barriers to entry. We compete against a diverse group of retailers, both small and large, including warehouse home centers and local hardware stores. We consider The Home Depot, Lowe’s, Ace Hardware and True Value as our primary competitors. Based on publically available information, we believe that in California each of The Home Depot, Ace Hardware and True Value currently has between two to three times as many stores as we do and that Lowe’s has, by number of stores, over 20% more stores in the state than we do. Some of our competitors are actively engaged in new store expansion. Discount retailers such as Walmart, Target and Kmart, and multi-line retailers such as Sears, Roebuck, also compete with us in certain product areas. In addition, our garden centers compete against smaller local nurseries. Online and catalog businesses, which handle similar lines of merchandise, also compete with us. Many of our competitors have a larger number of stores, more products available online, substantially greater financial, distribution and marketing resources, larger market shares and a more widespread, national presence. Such factors may provide our competitors with greater financial resources to expand, grow and allow for stronger relationships and aggressive pricing with vendors and third-party suppliers. Furthermore, some of our competitors have been aggressively building new stores in locations with high concentrations of our stores and in locations we have targeted for expansion. We expect that as the home improvement retail industry market grows, new competitors will enter the market and competition from established companies will increase.
Our success depends on our ability to differentiate ourselves from our competitors and remain competitive with respect to shopping convenience, availability of merchandise in-stock and customer service. The performance of our competitors, as well as changes in their pricing policies, marketing activities, new store openings and other business strategies, could have a material adverse effect on our business, financial condition and results of operations.
9
Table of Contents
Our business has been and will continue to be affected by worldwide economic conditions and, in particular, California economic conditions; a failure of the economy to sustain its recovery, a renewed decline in consumer-spending levels and other conditions, including inflation, could lead to reduced revenues and gross margins, and negatively impact our liquidity.
Many economic and other factors are outside of our control, including consumer and commercial credit availability, consumer confidence and spending levels, inflation, employment levels, housing sales and remodels, consumer debt levels, fuel costs and other challenges currently affecting the global economy, the full impact of which on our business, results of operations and financial condition cannot be predicted with certainty. The California economy, in particular, has recently been susceptible to slowdowns and recessions. These economic conditions adversely affect the disposable income levels of, and the credit available to, our customers, which could lead to reduced demand for our merchandise. Also affected are our vendors, upon which we depend to provide us with financing on our purchases of inventory and services. Our vendors could seek to change either the availability of vendor credit to us or other terms under which they sell to us, or both, which could negatively impact our liquidity. In addition, the inability of vendors to access liquidity, or the insolvency of vendors, could lead to their failure to deliver inventory or other services. Certain of our vendors also are experiencing increases in the cost of various raw materials, such as copper, steel and resin, which could result in increases in the prices that we pay for merchandise, particularly in our plumbing, industrial and electrical categories.
In addition to credit terms from vendors, our liquidity needs are funded by our operating cash flows and, to the extent necessary, borrowings under our credit agreements. The availability of financing depends on numerous factors, including economic and market conditions, our credit ratings and financial performance, and lenders’ assessments of our prospects and the prospects of the retail industry in general. The lenders under our credit facilities may not be able to meet their commitments if they experience shortages of capital and liquidity and there can be no assurance that our ability to otherwise access the credit markets will not be adversely affected by changes in the financial markets and the global economy.
Continued high rates of unemployment, depressed home prices, reduced access to credit and the domestic and international political situation also adversely affect consumer confidence. Low consumer confidence and the threat, outbreak, or escalation of terrorism, military conflicts or other hostilities may lead to reduced consumer spending, particularly by our customers on many of the discretionary items we sell that relate to home and garden improvement projects. These factors could cause us to increase inventory markdowns and promotional expenses, thereby reducing our gross margins and operating results.
If we do not successfully manage our inventory levels, our operating results will be adversely affected.
We must maintain sufficient inventory levels to operate our business successfully. However, we also must guard against accumulating excess inventory as we seek to maintain in-stock levels and to minimize out-of-stock levels across all product categories. We obtain a portion of our inventory from vendors located outside the United States. Some of these vendors often require lengthy advance notice of our requirements in order to be able to supply products in the quantities we request. This usually requires us to order merchandise, and enter into purchase orders for the purchase and manufacture of such merchandise, well in advance of the time these products will be offered for sale. As a result, we may experience difficulty in responding to a changing retail environment. If we do not accurately anticipate the future demand for a particular product or the time it will take to obtain new inventory, our inventory levels will not be appropriate and our results of operations may be negatively impacted.
Adverse changes in economic factors specific to the home improvement industry may negatively impact the rate of growth of our revenues and comparable store sales.
Sales of many of our product categories and services are driven by housing turnover and activity level of home and garden improvement projects. Steep declines over recent years in home prices, the increasing number of households with negative equity, increasing mortgage delinquency and foreclosure rates, reduction in the
10
Table of Contents
availability of mortgage financing, fluctuations in interest rates on variable rate mortgages, fewer housing starts and significantly lower housing turnover have limited, and may continue to limit, consumers’ discretionary spending. The overall housing environment and related economic factors have diminished consumer confidence levels, which in turn has adversely affected consumer spending on home and garden improvement projects. The impact of these economic factors specific to the home and garden improvement industry is exacerbated by what is expected to be a gradual and prolonged period of economic recovery with slow employment growth.
Our revenues may fluctuate for a variety of reasons, which could adversely affect our results of operations.
Our business is sensitive to customers’ spending patterns, which in turn are subject to prevailing economic conditions. Our revenues and results of operations have fluctuated in the past, and we expect them to continue to fluctuate in the future. A variety of other factors affect our revenues and financial performance, including:
| • | actions by our competitors, including opening of new stores in our existing markets or changes to the way these competitors go to market online; |
| • | seasonal fluctuations due to weather conditions; |
| • | timing and concentration of new store openings and related pre-opening and other start-up costs; |
| • | changes in our merchandise strategy and mix; |
| • | changes in population and other demographics; and |
| • | timing and frequency of our promotional and discounting events. |
Accordingly, our results for any one quarter are not necessarily indicative of the results to be expected for any other quarter, and comparable store sales for any particular future period may increase or decrease. For more information on our results of operations, see “Management’s Discussion and Analysis of Financial Condition and Results of Operations.”
Extended cold or wet weather in California, particularly in the spring, can have an adverse effect on our operating results.
The sale of a substantial portion of our merchandise depends upon our customers undertaking repair, maintenance and improvement projects in their home and garden. We believe that our customers are more likely to begin such projects during periods of warm and dry weather. Accordingly, we have historically realized a significant portion of our revenues and earnings for the year in the spring selling season, which includes March, April, May and June. In fiscal 2011 and 2010, we generated 30% of our revenues in the second fiscal quarter. Wet, windy and/or cold weather conditions can reduce foot traffic in our stores. Extended cold or wet weather conditions in California, particularly during the spring months, can significantly reduce our revenues and have a material adverse effect on our results of operations and our liquidity. Furthermore, lower than anticipated revenues during the spring selling season may cause us to increase inventory markdowns and promotion expenses, thereby reducing our gross margins and operating results.
If our stores, our distribution center or our store support center experience catastrophic damage and loss due to natural disasters, our operations would be seriously harmed.
Each of our stores, our distribution center and our store support center are located in California in areas that are susceptible to earthquakes and other natural disasters, such as wildfires, floods and tsunamis. If any of our facilities, and in particular our distribution facility in Tracy, California, were to experience catastrophic damage and loss, it could disrupt our store operations, delay shipments of our merchandise, reduce our revenue and result in large expenses to repair or replace our facilities. The occurrence of any of these natural disasters could have a material adverse impact on our business, results of operations and financial condition.
11
Table of Contents
We currently rely on a single distribution center. The loss or disruption of operations at our centralized distribution center or our failure in the future to expand or add additional distribution facilities could have an adverse effect on our business, operations and operating results.
A majority of our inventory is shipped directly from our suppliers to a single centralized distribution center that we lease in Tracy, California, where the inventory is then received, sorted and shipped to our stores. Our operating results depend on the orderly operation of our receiving and distribution processes, which in turn depend upon our private fleet of leased tractors, leased and owned trailers, third-party common carriers and the effective management of our distribution facilities. We may not anticipate all the changing demands that our expanding operations will impose on our receiving and distribution system, and events beyond our control, such as disruptions in operations due to fire, earthquakes or other catastrophic events. In addition, shipping problems or labor disagreements may result in delays in the delivery of merchandise to our stores.
If we expand our retail store base, we may need to expand our distribution facilities, therefore we may need to acquire, construct or lease additional distribution facilities in other geographic locations to accommodate a planned expansion. An expansion of our distribution facilities will require significant capital investment, costs and time and could place increased demands on our financial, managerial and operational resources. We may also need to invest in additional information technology to achieve a unified receiving and distribution system.
While we maintain insurance, in the event our distribution center were to be shut down for any reason or if we were to incur higher costs and longer lead times in connection with a disruption at our distribution center, our insurance may not be sufficient, and insurance proceeds may not be timely paid to us.
We rely extensively on computer systems to process transactions, summarize results and manage our business. Disruptions in these systems could harm our ability to run our business.
Given the number of individual transactions we have each year, it is critical that we maintain uninterrupted operation of our computer and communications hardware and software systems. Our systems are subject to damage or interruption from power outages, computer and telecommunications failures, computer viruses, security breaches, including breaches of our transaction processing or other systems that result in the compromise of confidential customer data, catastrophic events such as fires, tornadoes and hurricanes, and usage errors by our employees. If our systems are breached, damaged or cease to function properly, we may have to make a significant investment to fix or replace them, we may suffer interruptions in our operations in the interim, we may face costly litigation, and our reputation with our customers may be harmed. Our ability to maintain sufficient inventory levels in our stores is critical to our success and largely depends upon the efficient and uninterrupted operation of our computer and communications hardware and software systems. Any material interruption in our computer operations may have a material adverse effect on our business or results of operations.
We rely on third parties to provide us with services in connection with the administration of certain aspects of our business.
We have entered into agreements with third-party service providers (both domestic and international) to provide processing and administrative functions over a range of areas, and we may continue to do so in the future. These areas include credit card processing, e-commerce services, payroll and product returns. Services provided by third parties could be interrupted as a result of many factors, such as acts of God or contract disputes. Any failure by third parties to provide us with these services on a timely basis or within our service level expectations and performance standards could result in a disruption of our business and have an adverse effect on our business and operating results.
We could incur charges due to impairment of intangible and long-lived assets.
As of January 28, 2012 we had intangible asset balances of $133.9 million, which are subject to testing for impairment annually or more frequently if events or changes in circumstances indicate that the asset might be
12
Table of Contents
impaired. Our intangible assets consist of $107.6 million of our trade names and $26.3 million of favorable leasehold rights. Failure to achieve sufficient levels of cash flows could result in impairment charges for our trade names. If the decline in our revenues continues, this could have a material effect on our trade name valuation and could result in an impairment charge. Our long-lived assets, primarily property and equipment at our stores and favorable leasehold rights, are also subject to testing for impairment. A significant amount of judgment is involved in our impairment assessment. Failure to achieve sufficient levels of cash flow could result in impairment charges for intangible assets or property and equipment, which could have a material adverse effect on our results of operations.
Our failure to retain our senior management team and to continue to attract qualified new personnel could adversely affect our results of operations.
We depend on the talents and continued efforts of our senior management team. We do not maintain key-man life insurance on any of our executives and our executives are employed on an “at will” basis. The loss of one or more of the members of our senior management team may disrupt our business and materially adversely affect our results of operations. In addition, although our senior management has many years of relevant experience, they have only worked together for a very short time and therefore there is not a significant track record as a team. Furthermore, our ability to manage our further expansion will require us to continue to train, motivate and manage our employees and to attract, motivate and retain additional qualified managerial and store personnel. We believe that having store personnel who are knowledgeable and experienced in home repair matters has been an important factor in our historical success and we believe it will continue to be important to growing our business. Competition for these types of personnel is intense, and we may not be successful in attracting, assimilating and retaining the personnel required to grow and operate our business profitably.
We may be subject to product liability claims if people or properties are harmed by the products we sell or the services we offer.
Some of the products we sell may expose us to product liability claims relating to personal injury, death, or property damage caused by such products, and may require us to take actions such as product recalls. We also provide various services, which could also give rise to such claims. Although we maintain liability insurance, we cannot be certain that our coverage will be adequate for liabilities actually incurred or that insurance will continue to be available to us on economically reasonable terms, or at all. Product liability claims can be expensive to defend and can divert the attention of management and other personnel for significant periods, regardless of the ultimate outcome. Claims of this nature, as well product recalls, could also have a negative impact on customer confidence in the products we stock and in our reputation, our business and our operating results.
We may be subject to periodic litigation and other regulatory proceedings. These proceedings may be affected by changes in laws and government regulations or changes in the enforcement thereof.
From time to time, we may be involved in lawsuits and regulatory actions relating to our business or products we sell or have sold. These proceedings may be in jurisdictions with reputations for aggressive applications of laws and procedures against corporate defendants. We are impacted by trends in litigation, including class-action allegations brought under various consumer protection and employment laws, including wage and hour laws. Due to the inherent uncertainties of litigation and regulatory proceedings, we cannot accurately predict the ultimate outcome of any such proceedings. An unfavorable outcome could have a material adverse impact on our business, financial condition and results of operations. In addition, regardless of the outcome of any litigation or regulatory proceedings, these proceedings could result in substantial costs and may require that we devote substantial resources to defend our Company and could affect the future premiums we would be required to pay on our insurance policies. Further, changes in governmental regulations could have adverse effects on our business and subject us to additional regulatory actions.
13
Table of Contents
We intend to open new stores at an increased rate compared to recent years, which could strain our resources and have a material adverse effect on our business and financial performance.
Our future growth depends in part on our ability to successfully open and operate new stores profitably. As of January 28, 2012, we operated 87 full-service home improvement stores in California. We opened four new stores in California within the past three years. We relocated one new store in 2011 and anticipate opening up to three additional new stores in 2012. Expanding our store base will require us to invest significant financial resources and place increased demands on our management, operational and administrative infrastructure. In addition, our planned expansion will require us to increase continually the number of people we employ, as well as to expand and upgrade our management information, inventory tracking and other systems. Successfully opening a new store is a significant operational and administrative challenge. It is possible that we may not foresee all of the problems that could arise during a store opening or realize the expected benefits of opening a particular store. An increased number of stores may also make it more difficult for us to maintain our customer service standards. If we fail to meet these increased demands and operating complexities, it could have a material adverse effect on our business, financial condition and results of operations. New stores opened outside of the Company’s existing markets may be less profitable than existing stores in our core markets, which could adversely affect the Company and our results of operations.
We are subject to regulations that impact our business and a failure to comply with such regulations could lead to lawsuits or regulatory actions against us.
Operating in California exposes us to a particularly challenging regulatory environment, with aggressive enforcement efforts by private litigators in several areas of law, including, without limitation, environmental laws, consumer protection laws, employment laws, anti-discrimination laws, and wage and hour regulations and laws. This strict regulatory and litigation environment requires the Company to maintain a heightened compliance effort and exposes us to defense costs, possible fines and penalties, and liability to private parties for monetary recoveries and attorneys’ fees, any of which could have an adverse effect on our business and results of operations.
California and federal employment and labor laws govern our relationship with our employees and affect our operating costs. These laws include minimum wage requirements, overtime pay, unemployment tax rates, workers’ compensation rates, citizenship requirements and sales taxes. We are currently, and from time to time in the past have been, the subject of lawsuits by certain of our employees alleging various violations of these regulations, including suits alleging that we wrongfully denied certain of our employees overtime wages or that we unlawfully deducted costs for workers compensation expenses. A determination that we do not comply with these laws or other related laws could harm our profitability or business reputation. Future government-imposed increases in minimum wages, overtime pay, paid leaves of absence or mandated health benefits could also materially and adversely affect us.
From time to time we are subject to claims of employment discrimination, unlawful employment practices and Americans with Disabilities Act claims.
If we do not maintain the security of our customer, associate or company information, we could damage our reputation, incur substantial additional costs and become subject to litigation.
Any significant compromise or breach of customer, associate or company data security either held and maintained by us or our third-party providers could significantly damage our reputation and result in additional costs, lost sales, fines and lawsuits. The regulatory environment related to information security and privacy is increasingly rigorous, with new and constantly changing requirements applicable to our business, and compliance with those requirements could result in additional costs. We may be subject to unauthorized access to secured data and there is no guarantee that the procedures we have implemented are adequate to safeguard against all data security breaches. If we cannot remediate security issues, we may experience a security data breach that could negatively impact our business and our results of operations.
14
Table of Contents
If we are unable to renew or enter into new leases on competitive terms our revenue or results of operations could be negatively impacted.
As of January 28, 2012, we leased 71 store locations, our distribution center, and our store support center under long-term agreements. If our cost of leasing increases, we may be unable to maintain our existing store locations, distribution center, and store support center as leases expire. Our profitability may decline if we fail to enter into new leases on competitive terms or at all, or we may not be able to locate suitable alternative stores or additional sites for our new store expansion in a timely manner. Furthermore, approximately 68 of our leases will expire within the next ten years and some do not grant us any rights to renew the lease. A failure to renew or enter into new leases could reduce our revenue and negatively impact our results of operations.
We are required to comply with increasingly stringent federal, state and local environmental laws and regulations, the cost of which is likely to increase and may adversely affect our results of operations, cash flow or financial condition.
Our operations, properties and the products we sell are subject to various federal, state and local environmental laws and regulations. These laws and regulations not only govern our current operations, properties and the products we sell, but also impose potential liability on us for our past operations. We expect environmental laws and regulations to impose increasingly stringent requirements upon our industry and us in the future. Our costs to comply with these laws and regulations may increase as these requirements become more stringent in the future, and these increased costs may adversely affect our results of operations, cash flow or financial condition.
If we fail to timely and effectively obtain shipments of product from our vendors and deliver merchandise to our customers, our operating results will be adversely affected.
We cannot control all of the various factors that might affect our timely and effective procurement of supplies of product from our vendors and delivery of merchandise to our customers. A majority of the products that we purchase, domestically or overseas, must be shipped to our distribution center in Tracy, California. Our utilization of foreign imports also makes us vulnerable to risks associated with products manufactured abroad, including, among other things, risks of damage, destruction or confiscation of products while in transit to our distribution center, work stoppages including as a result of events such as longshoremen strikes, transportation and other delays in shipments including as a result of heightened security screening and inspection processes or other port-of-entry limitations or restrictions in the United States, lack of freight availability and freight cost increases. In addition, if we experience a shortage of a popular item, we may be required to arrange for additional quantities of the item, if available, to be delivered to us through airfreight, which is significantly more expensive than standard shipping by sea. As a result, we may not be able to obtain sufficient freight capacity on a timely basis or at favorable shipping rates and, therefore, we may not be able to timely receive merchandise from our vendors or deliver our products to our customers.
We rely upon proprietary and third-party land-based carriers for merchandise shipments to our facility in Tracy, California and from this facility to our stores. Accordingly, we are subject to the risks, including labor disputes, union organizing activity, inclement weather and increased transportation costs, associated with such carriers’ ability to provide delivery services to meet our inbound and outbound shipping needs. In addition, if the cost of fuel continues to rise or remains at current levels, the cost to deliver merchandise from the distribution center to our stores may rise which could have an adverse impact on our profitability. Failure to procure and deliver merchandise either to us or to our customers in a timely, effective and economically viable manner could damage our reputation and adversely affect our business. In addition, any increase in distribution costs and expenses could adversely affect our future financial performance.
15
Table of Contents
We rely on foreign sources for merchandise, and our business may therefore be negatively affected by the risks associated with international trade.
Approximately 12.3% of our merchandise is purchased from foreign vendors, either directly by us or indirectly by our distributors who, in turn, sell this merchandise to us. We believe that in order to remain competitive we must maintain or increase the portion of merchandise purchased from such vendors. This reliance on foreign vendors results in our facing risks inherent in purchasing from foreign suppliers, including:
| • | economic and political instability in countries where these vendors are located; |
| • | increases in shipping costs; |
| • | transportation delays and interruptions; |
| • | adverse fluctuations in currency exchange rates; and |
| • | changes in U.S. and foreign laws affecting the importation and taxation of goods, including duties, tariffs and quotas, or changes in the enforcement of those laws. |
Any increase in cost to us of merchandise purchased from foreign vendors or restriction on the merchandise made available to us by such vendors could have an adverse effect on our business and operating results.
If our relationships with our vendors, including with Sears Holdings, were to be impaired, it could have a negative impact on our competitive position and our business and financial performance.
Most of our vendor arrangements are not long-term agreements, and, therefore, our success depends on maintaining good relations with our vendors. Our growth strategy depends to a significant extent on the willingness and ability of our vendors to supply us with sufficient inventory to stock our new stores. If we fail to strengthen our relations with our existing vendors or to enhance the quality of merchandise they supply us, or if we cannot maintain or acquire new vendors of favored brand name merchandise, our ability to obtain a sufficient amount and variety of merchandise at acceptable prices may be limited, which would have a negative impact on our competitive position. In addition, our inability to stock our stores with new and desired merchandise at attractive prices could result in lower revenues and decreased customer interest in our stores, which, in turn, would adversely affect our financial performance. In addition, we may not be able to develop relationships with new vendors, and products from alternative sources, if any, may be of a lesser quality and more expensive than those we currently purchase. During fiscal year 2011, branded products acquired under license from Sears Holdings, including Kenmore and Craftsman products, accounted for approximately 6.0% of total purchases of all inventory from all vendors. Merchandise supplied to stores by our top ten suppliers accounted for approximately 23.1% of our total purchases. The loss of or a reduction in the amount of merchandise made available to us by Sears Holdings or by these other key vendors could have an adverse effect on our business and operating results.
We expect to experience increased costs resulting from a decrease in the purchasing power we previously had as a result of being a subsidiary of Sears Holdings.
As a result of our separation from Sears Holdings, we will not have access to financial and other resources comparable to those available to us prior to the Distribution, and, as a result, we are no longer able to take advantage of Sears Holdings’ size and purchasing power in procuring products and services, including insurance, advertising, shipping and receiving, logistics, store maintenance contracts, employee benefit support, credit and debit card interchange fees and other services. As a company independent from Sears Holdings, we may be unable to obtain goods, technology and services at prices and on terms as favorable as those available to us prior to the Distribution, which could increase our costs and reduce our profitability.
16
Table of Contents
As a public company, we will have increased expenses and administrative burden, in particular to bring our Company into compliance with certain provisions of the Sarbanes-Oxley Act of 2002 and related laws and regulations.
As a public company, we will incur significant legal, accounting and other expenses that we did not incur as a private company. These increased costs and expenses may arise from various factors, including financial reporting, costs associated with complying with federal securities laws (including compliance with the Sarbanes-Oxley Act of 2002), tax administration, legal and human resources related functions. As a result of becoming a public company, we needed to create or revise the roles and duties of our Board committees, adopt additional internal controls and disclosure controls and procedures, retain a transfer agent and adopt corporate governance policies in compliance with our obligations under the securities laws.
In addition, changing laws, regulations and standards relating to corporate governance and public disclosure, including the Sarbanes-Oxley Act of 2002 and the Dodd-Frank Act, and related regulations implemented by the SEC and NASDAQ are creating uncertainty for public companies, increasing legal and financial compliance costs and making some activities more time consuming. We are currently evaluating and monitoring developments with respect to new and proposed rules and cannot predict or estimate the amount of the additional costs we may incur or the timing of such costs. These laws, regulations and standards are subject to varying interpretations, in many cases due to their lack of specificity, and, as a result, their application in practice may evolve over time as new guidance is provided by regulatory and governing bodies. This could result in continuing uncertainty regarding compliance matters and higher costs necessitated by ongoing revisions to disclosure and governance practices. Failure to comply with other existing and changing laws, regulations and standards could also adversely affect the Company and the results of our operations.
We intend to invest resources to comply with evolving laws, regulations and standards, and this investment may result in increased general and administrative expenses and a diversion of management’s time and attention from revenue-generating activities to compliance activities. If our efforts to comply with new laws, regulations and standards differ from the activities intended by regulatory or governing bodies due to ambiguities related to practice, regulatory authorities may initiate legal proceedings against us and our business may be harmed. The costs of compliance or our failure to comply with these laws, rules and regulations could adversely affect our reputation, financial condition, results of operations and the price of our Class A Common Stock and Preferred Stock.
Failure to achieve and maintain effective internal controls in accordance with Section 404 of Sarbanes-Oxley could lead to a loss of confidence by investors in the accuracy and completeness of our financial reports and have a material adverse effect on the market price of our Class A Common Stock and Preferred Stock.
As a public company, we will be required to maintain internal controls over financial reporting in order to satisfy the requirements of Section 404 of Sarbanes-Oxley, which will require annual management assessments of the effectiveness of our internal control over financial reporting, and a report by our independent registered public accounting firm that addresses the effectiveness of internal control over financial reporting beginning with our Form 10-K for the year ending February 2, 2013. During the course of our testing, we may identify deficiencies which we may not be able to remediate in time to meet our deadline for compliance with Section 404. Testing and maintaining internal controls can divert our management’s attention from other matters that are also important to the operation of our business. We also expect that the compliance with these regulations will increase our legal and financial administration costs and make some activities more difficult, time consuming and costly. We may not be able to conclude on an ongoing basis that we have effective internal control over financial reporting in accordance with Section 404. If our Chief Executive Officer, Chief Financial Officer or independent registered public accounting firm determine that our controls over financial reporting are not effective, as defined under Section 404, investor perceptions may be adversely affected and could cause a decline in the market price of our Class A Common Stock and Preferred Stock. It may also impair our ability to raise additional capital, or jeopardize our continued listing on the NASDAQ Capital Market or any other stock exchange on which our Class A Common Stock and Preferred Stock may be listed. Although we are not currently
17
Table of Contents
required to comply with Section 404, in connection with our year end financial statement audit we have identified certain matters involving our internal controls over financial reporting that would constitute material weaknesses under standards established by the Public Company Accounting Oversight Board. The material weakness identified by us results from inadequate technical accounting knowledge and inadequate written accounting policies and procedures. Failure to remediate such control deficiency may have an adverse affect on the Company’s stock price and results of our operations.
Risks Relating to Our Financing
If we are unable to comply with the terms of our Senior Secured Credit Facility, Senior Secured Term Loan or Real Estate Secured Term Loan, our business and financial condition would be negatively impacted.
As of January 28, 2012, we were in compliance with the financial covenants under our financing arrangements, and we currently believe that we will continue to be in compliance with these covenants through at least the end of fiscal 2012. Because of the need to comply with our financial covenants, we may be more vulnerable to economic downturns and adverse developments in our business. Our ability to satisfy our financial covenants will depend on our future performance, which will be affected by financial, business, economic, regulatory and other factors, many of which we are unable to control. Accordingly, we continue to examine a number of alternatives with respect to future financial covenant compliance and liquidity, including raising additional capital through permitted asset sales and/or sale-leaseback transactions or equity financing transactions. In addition, if necessary or advisable, we may seek to renegotiate our financing arrangements in order to remain in compliance while continuing to follow our current business plan, which includes plans for store expansion. There are no assurances that under such circumstances our financing arrangements could be renegotiated, or that alternative financing would be available on terms acceptable to us, if at all. In addition, any refinancing could be at higher interest rates and may require us to comply with more onerous covenants which could further restrict our business operations. In such case, if such renegotiations were necessary but unsuccessful, we would expect to modify our business plan in a manner that would allow us to remain in compliance. Such a modification could result in slower growth, a delay of new store openings and the potential for a decline in sales.
If we were unsuccessful in meeting our financial or other covenants in our financing arrangements, it would result in a default which could trigger acceleration of (or the right to accelerate) the related debt. Because of cross-default provisions in the agreements and instruments governing our indebtedness, a default under one agreement or instrument could result in a default under, and the acceleration of, our other indebtedness. In addition, our lenders would be entitled to proceed against the collateral securing the indebtedness. If any of our indebtedness were to be accelerated, it could adversely affect our ability to operate our business or we may be unable to repay such debt and, therefore, such acceleration could adversely affect our results of operations, financial condition and, consequently the price of our Class A Common Stock. For more information regarding our compliance with our financial covenants, see “Management’s Discussion and Analysis of Financial Condition and Results of Operations.”
We have substantial debt. Any failure to obtain suitable replacement financing upon the maturing of our existing financing arrangements would adversely affect our business and results of operations.
Our business and results of operations depend substantially on our ability to obtain financing for our operations. We currently have the following secured financing arrangements:
| • | a Senior Secured Credit Facility with a revolving availability up to $100 million, subject to a borrowing base, of which $34.0 million is outstanding as of January 28, 2012, expires on the earlier to occur of (i) 90 days prior to the maturity of Senior Secured Term Loan and (ii) December 21, 2013; |
| • | a $200 million Senior Secured Term Loan, of which $137.6 million is outstanding as of January 28, 2012, of which $59.5 million matures on December 21, 2013 and $78.1 million matures on December 21, 2015; and |
18
Table of Contents
| • | a $50 million Real Estate Secured Term Loan, of which $27.9 million is outstanding as of January 28, 2012, which matures on the earlier of (i) December 21, 2013 or (ii) 90 days prior to the maturity of the Senior Secured Term Loan. |
Current economic conditions have generally adversely impacted the availability, cost and terms of debt financing. There can be no assurance that we will be able to replace our existing financing upon the maturity of our Senior Secured Credit Facility, Senior Secured Term Loan and Real Estate Secured Term Loan on commercially acceptable terms, or at all. If we are not able to renew or replace our existing financial arrangements when they become due, our costs for borrowings will likely increase and our revenues may decrease, or we could be precluded from continuing our operations at current levels. If we are unable to refinance our Senior Secured Credit Facility, Senior Secured Term Loan and Real Estate Secured Term Loan prior to their respective maturity dates, we cannot guarantee that we will generate enough cash flow from operations or be able to obtain enough capital to repay our outstanding indebtedness on such dates. In such event, we may need to close or sell stores, sell assets, reduce the number and/or frequency of store openings and improvements, issue capital stock or securities convertible into capital stock or issue debt securities to repay our indebtedness. If implemented, these actions could negatively impact our business, operating results or dilute our capital stock.
We may not have sufficient cash to repay our debt obligations on the occurrence of an event of default resulting from a change in control trigger.
Our Senior Secured Credit Facility, Senior Secured Term Loan and Real Estate Secured Term Loan contain an event of default resulting from a change of control default, which includes the following: (i) certain mergers, consolidations, sales or transfers of all or substantially all of the assets of the Company to persons other than ACOF, ESL Investments, Inc. and affiliated entities (“ESL”) and Sears Holdings; (ii) adoption of a plan of liquidation of the Company; (iii) prior to an initial underwritten public offering of common stock of the Company, Sears Holdings, ESL and ACOF ceasing to collectively hold directly or indirectly at least 50% of the total voting power of all shares of our voting capital stock; (iv) following an initial underwritten public offering of common stock of the Company, a person or group, other than Sears Holdings, ESL and ACOF, collectively holding directly or indirectly at least 40% of the total voting power of all shares of our voting capital stock and Sears Holdings, ESL and ACOF collectively holding less than such person or group; and (v) our Board of Directors not consisting of continuing Directors (“Change in Control”).
As a result of, and following, the Distribution:
| • | Sears Holdings does not own any capital stock of the Company; |
| • | ESL beneficially owns approximately 61% of our outstanding shares of Class A Common Stock and approximately 49% of the general voting power of our capital stock; and |
| • | ACOF beneficially owns 100% of our outstanding shares of Class C Common Stock and approximately 20% of the general voting power of our capital stock. |
Neither ESL nor ACOF have agreed to maintain their shareholding in the Company following the Distribution. If one or both of ESL and ACOF dispose of all or part of their shareholding in the Company such that their combined total voting power drops below 50%, this may trigger a Change in Control event of default under the Senior Secured Credit Facility, Senior Secured Term Loan and Real Estate Secured Term Loan. An event of default could trigger certain acceleration clauses and cause those and our other obligations to become immediately due and payable and we may not have sufficient cash funds available to repay our debt obligations upon such a Change in Control.
19
Table of Contents
Unexpected costs or delays in the construction of tenant improvements in certain of our sale-leaseback stores could cause us to repurchase the property and affect our cash flows.
Under three of our leases covering properties subject to recent sale-leaseback transactions, we rely upon tenant improvement allowances for hiring contractors and performing work to refurbish or renovate the stores subject to such leases. Any delays or cost overruns which prevent us from completing the refurbishment or renovations within the anticipated budget and timeline could have an adverse affect upon our business. In particular, failure to complete the agreed upon tenant improvements under each of these leases within 12 months from lease signing could allow the landlord under the applicable lease to require us to purchase the property and improvements subject to the lease from the landlord in accordance with the repurchase terms specified in the applicable lease. Under such circumstances, we may not have sufficient available funds to purchase such property and improvement.
Increases in interest rates could adversely affect our operating results.
An increase in prevailing interest rates could adversely affect our operating results. At January 28, 2012, we had approximately $199.5 million aggregate principal amount of variable interest rate indebtedness under our Senior Secured Credit Facility, Senior Secured Term Loan and Real Estate Secured Term Loan. The variable interest rates applicable to this indebtedness are based on several interest rate indexes that fluctuate on a regular basis, including the London Interbank Offered Rate (“LIBOR”) and the prime rate as publicly announced by certain of our lenders and the U.S. federal funds rate. If interest rates increase, our debt service obligations on this variable rate indebtedness would increase even though the amount borrowed would remain the same, and our net income would decrease. As a protection against rising interest rates, we have entered into an interest rate cap agreement with respect to our Real Estate Secured Term Loan with a notional amount of $25 million, capping LIBOR at 4%. The cap agreement does not eliminate interest rate volatility for the remainder of our variable rate indebtedness. In the future, we may enter into interest rate swaps or additional cap contracts to reduce interest rate volatility. The terms of our cap agreement with respect to our Real Estate Secured Term Loan or such additional agreements as we may enter into to reduce interest rate volatility, may be unfavorable to us depending on rate movements and may not completely protect us from increased interest expense in particular situations.
Our substantial leverage may place us at a competitive disadvantage in our industry.
We are substantially leveraged and have significant debt service obligations. At January 28, 2012, our outstanding debt (excluding capital leases) was approximately $199.5 million. Our significant debt and debt service requirements could adversely affect our ability to operate our business and may limit our ability to take advantage of potential business opportunities. For example, our high level of debt presents the following risks:
| • | we are required to use a substantial portion of our cash flow from operations to pay principal and interest on our debt, thereby reducing the availability of our cash flow to fund working capital, capital expenditures, product development efforts, strategic acquisitions, investments and alliances and other general corporate requirements; |
| • | our interest expense could increase if prevailing interest rates increase, because a substantial portion of our debt bears interest at floating rates; |
| • | our substantial leverage increases our vulnerability to economic downturns and adverse competitive and industry conditions and could place us at a competitive disadvantage compared to those of our competitors that are less leveraged; |
| • | our debt service obligations could limit our flexibility in planning for, or reacting to, changes in our business and our industry and could limit our ability to pursue other business opportunities, borrow more money for operations or capital in the future and implement our business strategies; |
| • | our level of debt may restrict us from raising additional financing on satisfactory terms to fund working capital, capital expenditures, product development efforts, strategic acquisitions, investments and alliances, and other general corporate requirements; |
| • | covenant in the Senior Secured Term Loan limits the amount of capital expenditures we can make; and |
| • | covenants in our debt instruments limit our ability to pay dividends or make other restricted payments and investments. |
20
Table of Contents
Servicing our debt requires a significant amount of cash and our ability to generate cash may be affected by factors beyond our control.
We may be unable to generate sufficient cash flow from operations or to obtain future borrowings under our credit facilities or otherwise in an amount sufficient to enable us to pay our debt or to fund our other liquidity needs. Our ability to generate cash is subject to general economic, financial, competitive, legislative, regulatory and other factors that are beyond our control. If we do not have sufficient liquidity, we may need to refinance or restructure all or a portion of our debt on or before maturity, seek equity financing, sell assets, or borrow more money, which we may not be able to do on terms satisfactory to us or at all. In addition, any refinancing could be at higher interest rates and may require us to comply with more onerous covenants which could further restrict our business operations. We cannot assure you that our business will generate sufficient cash flow from operations or that future sources of funding will be available to us in amounts sufficient to enable us to fund our liquidity needs. If we are unable to meet our obligations with respect to our debt, we could be forced to restructure or refinance our debt, seek equity financing or sell assets.
Credit rating downgrades would increase our financing costs and negatively affect our access to capital.
Our credit ratings may affect our cost of financing and our ability to access financing sources. In June 2011, our credit ratings were downgraded by two nationally recognized statistical rating organizations. The Company’s credit rating has not changed since June 2011. Rating agencies revise their ratings for the companies that they follow from time to time and our ratings may be revised or withdrawn in their entirety at any time. Any further credit rating downgrade would increase our financing costs under a portion of our Senior Secured Term Loan and could limit our access to financing sources.
Risks Relating to the Spin-Off
If the Distribution or certain internal transactions undertaken as a result of the Spin-Off are determined to be taxable for U.S. federal income tax purposes, our stockholders could incur significant U.S. federal income tax liabilities.
Sears Holdings received an IRS Ruling substantially to the effect that, for U.S. federal income tax purposes, the Distribution, except to the extent of any cash received in lieu of fractional shares of our Class A Common Stock and Preferred Stock, will qualify as tax-free under Section 355 of the Internal Revenue Code of 1986, as amended (the “Code”). The IRS Ruling also provides that certain internal transactions undertaken in anticipation of the Distribution will qualify for nonrecognition tax treatment under the Code. The IRS Ruling is binding upon the Internal Revenue Service, but its continued validity is subject to factual representations that we and Sears Holdings made to the Internal Revenue Service concerning certain conditions that are necessary to obtain tax-free treatment under the Code have been satisfied. In addition, the Internal Revenue Service will not rule on whether a distribution satisfies certain requirements necessary to obtain tax-free treatment under Section 355 of the Code. Therefore, in addition to obtaining the IRS Ruling, Sears Holdings received an opinion from its tax counsel as to the satisfaction of these required qualifying conditions. An opinion of counsel is not binding on the Internal Revenue Service. Accordingly, the Internal Revenue Service may reach conclusions with respect to the Spin-Off that are different from the conclusions reached in the opinion. The opinion was based on certain facts and assumptions, and certain representations and undertakings, which, if incomplete, incorrect or not satisfied, could alter counsel’s conclusions.
If the Distribution ultimately is determined to be taxable, the Distribution could be treated as a taxable dividend or capital gain for U.S. federal income tax purposes to our stockholders who received stock in the Distribution, and these stockholders could incur significant U.S. federal income tax liabilities.
21
Table of Contents
Dispositions or redemptions of our Preferred Stock may have less favorable tax consequences than dispositions or redemptions of our Class A Common Stock.
Any Preferred Stock received by a Sears Holdings stockholder in the Distribution constitutes “Section 306 stock” for U.S. federal income tax purposes. As a result, any cash received by a Sears Holdings stockholder in lieu of fractional shares of Preferred Stock generally will be treated as ordinary dividend income.
Furthermore, subsequent dispositions or redemptions of our Preferred Stock generally will also be treated as ordinary dividend income, even if such proceeds would otherwise have resulted in capital gain or do not exceed such stockholder’s basis in our Preferred Stock, unless our Preferred Stock is disposed or redeemed in a transaction that terminates the stockholder’s entire interest in us (including any of our Class A Common Stock and taking into account certain constructive ownership rules).
The rules relating to Section 306 stock are complicated and stockholders are urged to consult their own tax advisors regarding the application of those rules.
We might not be able to engage in desirable strategic transactions and equity issuances following the Distribution because of restrictions relating to U.S. federal income tax requirements for tax-free distributions.
Our ability to engage in significant equity transactions are limited or restricted after the Distribution in order to preserve for U.S. federal income tax purposes the tax-free nature of the Distribution by Sears Holdings. Even if the Distribution otherwise qualifies for tax-free treatment under Section 355 of the Code, it may be taxable to Sears Holdings if 50% or more, by vote or value, of shares of our Class A Common Stock and Preferred Stock or Sears Holdings’ common stock are acquired or issued as part of a plan or series of related transactions that includes the Distribution. For this purpose, any acquisitions or issuances of Sears Holdings’ common stock within two years before the Distribution, and any acquisitions or issuances of our Class A Common Stock and Preferred Stock or Sears Holdings’ common stock within two years after the Distribution, generally are presumed to be part of such a plan, although we or Sears Holdings may be able to rebut that presumption.
Under the Distribution Agreement, there are restrictions on our ability to take actions that could cause the Distribution to fail to qualify for favorable treatment under the Code. These restrictions may prevent us from entering into transactions which might be advantageous to us or our stockholders.
Our historical consolidated financial information is not necessarily representative of the results we would have achieved as a publicly traded company independent from Sears Holdings and may not be a reliable indicator of our future results.
Our historical financial performance may not reflect what our results of operations, financial position and cash flows would have been had we been a publicly traded company independent from Sears Holdings during the periods presented, or what our results of operations, financial position and cash flows will be in the future now that we are independent from Sears Holdings. This is primarily because:
| • | our historical financial information reflects allocations for certain services and expenses historically provided to us by Sears Holdings that may not reflect the costs we will incur for similar services as a company independent from Sears Holdings; and |
| • | our historical financial information does not reflect changes that we experienced as a result of our Spin-Off from Sears Holdings, including changes in the cost structure, personnel needs, financing and operations of our business. |
Following the Spin-Off, we are responsible for the additional costs associated with being a publicly-traded company independent from Sears Holdings, including costs related to corporate governance and public reporting. Accordingly, there can be no assurance that our historical financial performance will be indicative of our future results.
22
Table of Contents
Risks Relating to Our Class A Common Stock and Preferred Stock and the Securities Market
We do not expect to pay dividends for the foreseeable future.
We do not expect to pay cash dividends on our Class A Common Stock or any other shares of our capital stock for the foreseeable future. In addition, the terms of the Preferred Stock do not entitle the holders thereof to any dividends. We currently intend to retain any future earnings for use in the business. Further, our current credit arrangements generally prohibit our paying of cash dividends. As a result, you may not receive any return on an investment in our capital stock in the form of dividends. The terms of the Preferred Stock provide that dividends and other distributions may not be paid on any shares of our capital stock until all outstanding shares of the Preferred Stock have been redeemed or repurchased unless such dividend or distribution (i) has been unanimously approved by our Board of Directors, (ii) relates to a “poison pill” stockholder rights plan or (iii) is a distribution of cash in lieu of fractional shares made in connection with the Distribution.
Our Class A Common Stock and Preferred Stock may have a low trading volume and limited liquidity, resulting from a lack of analyst coverage and institutional interest.
Our Class A Common Stock and Preferred Stock may receive limited attention from market analysts. Lack of up-to-date analyst coverage may make it difficult for potential investors to fully understand our operations and business fundamentals, which may limit our trading volume. In addition, if neither ESL nor ACOF is actively trading our Class A Common Stock, our trading volume may be limited. The Stockholders’ Agreement provides that during the period beginning on the date of the Spin-Off and ending on the date that is the earlier of (i) the date that ACOF completes the acquisition of an aggregate number of additional shares of common stock equal to 15% of the total shares of common stock outstanding as of such date and (ii) the date that is six months from the date on which the distribution agent has completed the electronic issuance of all of the shares of our Class A Common Stock in connection with the Spin-Off (with such period subject to extension upon certain circumstances detailed in the Stockholders’ Agreement), none of the Company, ESL, Edward S. Lampert or William C. Crowley, nor any of their affiliates will (i) acquire, directly or indirectly, any securities of ours or our subsidiaries or (ii) knowingly or intentionally hinder or inhibit ACOF from making any such purchases of our securities, subject to certain restrictions. Such limited liquidity may impede the development of institutional interest in our Class A Common Stock and Preferred Stock, and could limit the value of our Class A Common Stock and Preferred Stock. Additionally, low trading volumes and lack of analyst coverage may limit a stockholders’ ability to resell stock. Low trading volume may be particularly pronounced in the case of shares of our Preferred Stock because such shares will only be quoted on the OTCQB, where there is generally less liquid trading and less participation by market makers.
Our principal stockholders have substantial control over us and, among other things, they could delay or prevent a change in corporate control and may have interests different than yours.
We have four classes of capital stock:
| • | Class A Common Stock, which is entitled to one vote per share and which elects eight members of our Board of Directors; |
| • | Class B Common Stock, which is entitled to one-tenth of a vote per share and which, together with our Class C Common Stock, elects two members of our Board of Directors; |
| • | Class C Common Stock, which is entitled to one vote per share and which, together with our Class B Common Stock, elects two members of our Board of Directors; and |
| • | Preferred Stock, of which the Series A Preferred Stock is a series and which does not have voting rights. |
As of January 28, 2012, ESL owned approximately 61% of our outstanding Class A Common Stock, representing approximately 61% of Class A Common Stock voting power and approximately 49% of the general
23
Table of Contents
voting power of our outstanding capital stock, and owns approximately 61% of our outstanding Preferred Stock, which is our outstanding nonvoting capital stock. As of January 28, 2012, ACOF owned 100% of our outstanding Class C Common Stock, representing approximately 99% of the collective voting power of our Class B Common Stock and Class C Common Stock voting together and approximately 20% of the voting power of our outstanding capital stock. Pursuant to our Amended and Restated Certificate of Incorporation, at any time that ACOF owns a number of shares of our Class B Common Stock and Class C Common Stock representing in the aggregate a percentage of our outstanding common stock that is less than 10% but equal to or greater than 5% (calculated without reference to any shares of capital stock issued or issuable after the Distribution), then the Class C Common Stock, voting together with the Class B Common Stock as a single class, shall have the right to elect only one director. If at any time ACOF owns a number of shares of our Class B Common Stock and Class C Common Stock representing in the aggregate a percentage of our outstanding common stock that is less than 5% (calculated without reference to any shares of capital stock issued or issuable after the Distribution), then there shall no longer be separate classes of Directors and all classes of our capital stock entitled to vote for Directors would vote together as a single class.
As a result of their respective capital stock ownership, ESL and ACOF acting together have the ability to control the outcome of certain matters on which holders of all classes of our capital stock vote together as a single class, including, among other things, approving mergers or other business combinations and effecting certain amendments to our Amended and Restated Certificate of Incorporation. In addition, ESL holds a majority of the stock that votes in the election of those members of our Board of Directors elected by the holders of our Class A Common Stock and ACOF has the power to control the election of the two members of our Board of Directors elected by the Class B Common Stock and Class C Common Stock stockholders (the outstanding shares of our Class B Common Stock, following the Distribution, collectively have less than 0.5% of the voting power of our capital stock). This concentration of ownership might harm the market price of our Class A Common Stock and Preferred Stock by discouraging a potential acquirer from making a tender offer or otherwise attempting to obtain control of us. In addition, the interests of ESL and ACOF may differ from or be opposed to the interests of our other stockholders.
In addition, ACOF has preemptive rights over our issuance of certain debt pursuant to the Stockholders’ Agreement. Unless otherwise consented to by ACOF, such preemptive rights require us to notify ACOF of the terms of certain debt that we wish to issue and provide them the opportunity to purchase up to 100% of such debt, depending on the time such event occurs and on other circumstances. Complying with this process could hinder our ability to timely take advantage of favorable market conditions to obtain debt financing on advantageous terms.
Further, so long as ACOF, together with its affiliates and transferees, beneficially owns shares of Class B and/or C Common Stock that represent at least 15% of the total voting shares, the Stockholders’ Agreement provides our Class B/C Directors with consent rights over certain corporate activities, including any change in control, certain changes in the number of Directors constituting our Board of Directors, any redemption of our Series A Preferred Stock, certain changes to our Charter or By-laws, issuances by us of stock (other than in connection with stock plans or similar arrangements), rights offerings and any liquidation of our corporate assets. For so long as ESL holds more shares of our common stock than ACOF, the Stockholders’ Agreement also provides that a non-management Class A Director designated by a majority vote of our Class A Directors will have a consent right over certain corporate activities, including our issuance of any capital stock (other than in connection with stock plans or similar arrangements) and our engaging in any rights offering. These consent rights may limit our ability to enter into the corporate activities subject to such consent rights.
Our Class A Common Stock and Preferred Stock prices may decline if ESL or ACOF alter their strategy with respect to their ownership of our capital stock.
ESL and ACOF have advised us that they have not reached any decision regarding whether or for how long they will retain their stock ownership in us and what form, if any, the disposition or distribution of their stock in
24
Table of Contents
us will take. ESL and ACOF will, in their sole discretion, determine the timing and terms of any transactions with respect to their shares in us, taking into account business and market conditions and other factors that they deem relevant. Neither ESL nor ACOF are subject to any contractual obligation to maintain their ownership position in us, although they may be subject to certain transfer restrictions imposed by securities laws and the Stockholders’ Agreement. Consequently, we cannot assure you that either ESL or ACOF will maintain their ownership of our capital stock. Any announcement by ESL or ACOF that they have reached a determination regarding what to do with their shares of our capital stock, or the perception by the investment community that ESL or ACOF has reached such a determination, could have an adverse impact on the price of our Class A Common Stock and Preferred Stock.
An active trading market may not develop for our Class A Common Stock and Preferred Stock. If our share price fluctuates, investors could lose all or a significant part of their investment.
We cannot predict the prices at which our Class A Common Stock and Preferred Stock may trade in the future. The market price of our Class A Common Stock and Preferred Stock may fluctuate widely, depending on many factors, some of which may be beyond our control, including:
| • | our business profile and market capitalization may not fit the investment objectives of some Sears Holdings stockholders and, as a result, these Sears Holdings stockholders may sell our shares after the Distribution; |
| • | actual or anticipated fluctuations in our operating results due to factors related to our business; |
| • | success or failure of our business strategy; |
| • | actual or anticipated changes in the U.S. and California economies or the retailing environment; |
| • | our quarterly or annual earnings, or those of other companies in our industry; |
| • | our ability to obtain third-party financing as needed; |
| • | announcements by us or our competitors of significant acquisitions or dispositions; |
| • | the failure of securities analysts to cover our Class A Common Stock and Preferred Stock; |
| • | changes in earnings estimates by securities analysts or our ability to meet those estimates; |
| • | the operating and stock price performance of other comparable companies; |
| • | overall market fluctuations; |
| • | changes in laws and regulations affecting our business; |
| • | actual or anticipated sales or distributions of our capital stock by our officers, Directors or certain significant stockholders; |
| • | terrorist acts or wars; and |
| • | general economic conditions and other external factors. |
In addition, the stock market in general has experienced extreme price and volume fluctuations that have often been unrelated or disproportionate to the operating performance of companies like us. These broad market and industry factors may materially reduce the market price of the Class A Common Stock and Preferred Stock, regardless of our operating performance.
Substantial sales of Class A Common Stock and Preferred Stock may occur in the future, which could cause the price of our Class A Common Stock and Preferred Stock to decline.
Although we have no actual knowledge of any plan or intention on the part of any significant stockholder to sell our capital stock following the Spin-Off, it is likely that some stockholders, possibly including our significant stockholders, will sell shares of our capital stock if, for reasons such as our business profile or market
25
Table of Contents
capitalization as a company independent from Sears Holdings, we do not fit their investment objectives. In particular, Sears Holdings is a member of the S&P 500 Index, while we will not be and, accordingly, certain Sears Holdings’ stockholders may elect or be required to sell our shares following the Spin-Off due to such stockholders’ own investment guidelines or other reasons.
The Class A Common Stock and Preferred Stock held by ESL and our “affiliates,” the Class B Common Stock and the Class C Common Stock may be sold in the public market only if registered or if the holders thereof qualify for an exemption from registration under Rule 144 under the Securities Act. Individuals who may be considered our affiliates after the Spin-Off include individuals who control, are controlled by or are under common control with us, as those terms generally are interpreted for federal securities law purposes. These individuals may include some or all of our Directors and executive officers. Individuals who are our affiliates will be permitted to sell their shares of Class A Common Stock and Preferred Stock only pursuant to an effective Registration Statement under the Securities Act, or an exemption from the registration requirements of the Securities Act, such as the exemptions afforded by Section 4(1) of the Securities Act or Rule 144 thereunder. Pursuant to the new Stockholders’ Agreement we entered into with ESL and ACOF, we granted registration rights to ESL and ACOF.
Sales of a substantial number of shares of Class A Common Stock or Preferred Stock could adversely affect the market price of the Class A Common Stock and Preferred Stock and could impair our future ability to raise capital through an offering of our equity securities. In addition, our Class C Common Stock constitutes approximately 20% of the voting power of our capital stock, automatically converts to an equal number of shares of Class A Common Stock in the event ACOF transfers such shares to any person or entity that is not affiliated with ACOF or if at any time ACOF owns a number of shares of our Class B Common Stock and Class C Common Stock representing in the aggregate a percentage of our outstanding common stock that is less than 5% (calculated without reference to any shares of capital stock issued or issuable after the Distribution). As a result, sales of a substantial number of shares of Class C Common Stock by ACOF to an unaffiliated third party could also adversely affect the market price of shares of the Class A Common Stock. Additionally, the Class C Common Stock may be converted into Class A Common Stock on the basis of one share of Class A Common Stock for each share of Class C Common Stock upon the approval of our Board of Directors and subsequent approval of (i) our stockholders voting as a separate class and (ii) the holders of a majority of the voting power of the Class C Common Stock voting as a separate class.
Investors’ percentage ownership in us will be diluted in the future.
Investors’ percentage ownership in us will be diluted in the future because of additional equity awards that we expect will be granted to our Directors, officers and employees in the future. We have established our 2011 Equity Incentive Plan that provides for the grant of common stock-based equity awards to our Directors, officers and other employees. Further, shares of Class C Common Stock held by ACOF will automatically convert into an equal number of shares of Class A Common Stock in certain circumstances. In addition, we may issue equity in order to raise capital or in connection with future acquisitions and strategic investments, which would dilute your percentage ownership.
Provisions in our Amended and Restated Certificate of Incorporation and Amended and Restated Bylaws and of Delaware law may prevent or delay an acquisition of the Company, which could decrease the trading price of our Class A Common Stock and Preferred Stock.
Our Amended and Restated Certificate of Incorporation and Amended and Restated Bylaws and Delaware law contain provisions that are intended to deter coercive takeover practices and inadequate takeover bids by making such practices or bids unacceptably expensive to the raider and to encourage prospective acquirers to negotiate with our Board of Directors rather than to attempt a hostile takeover. These provisions include rules regarding how stockholders may present proposals or nominate Directors for election at stockholder meetings and the right of our Board to issue preferred stock without stockholder approval.
26
Table of Contents
We believe these provisions protect our stockholders from coercive or otherwise unfair takeover tactics by requiring potential acquirers to negotiate with our Board and by providing our Board with more time to assess any acquisition proposal. However, these provisions apply even if the offer may be considered beneficial by some stockholders and could delay or prevent an acquisition that our Board determines is not in the best interests of our company and our stockholders. Accordingly, in the event that our Board determines that a potential business combination transaction is not in the best interests of our Company and our stockholders but certain stockholders believe that such a transaction would be beneficial to the Company and its stockholders, such stockholders may elect to sell their shares in the Company and the trading price of our Class A Common Stock and Preferred Stock could decrease.
Similarly, until the market has fully evaluated our business, the price at which shares of our Class A Common Stock and Preferred Stock trade may fluctuate significantly.
Our Preferred Stock is quoted on the OTCQB rather than listed on a national securities exchange, there may be limited liquidity in our Preferred Stock and the quote of our Preferred Stock may be volatile, all of which could limit investors’ ability to sell their Preferred Shares.
Although our Class A Stock is listed on the NASDAQ Capital Market, our Preferred Stock is quoted on the OTCQB, and will not be listed on any national securities exchange, which may limit the trading volume of our Preferred Stock. There is a greater chance for market volatility for securities that are quoted on an OTC quotation system as opposed to a national securities exchange. This volatility may be caused by a variety of factors, including the lack of readily available quotations, the absence of consistent administrative supervision of “bid” and “ask” quotations, and generally lower trading volume. The OTC quotation system is a regulated quotation service that displays real-time quotes, last-sale prices and volume information for shares of stock that are not listed on a national securities exchange. Trades in OTC quotation system securities will be displayed only if the trade is processed by an institution acting as a market maker for those securities. Although there initially will be at least one institution acting as a market maker for our shares, that institution will not be obligated to continue making a market for any specific period of time. Thus, there can be no assurance that any institution will be acting as a market maker for our stock at any time. If there is no market maker for our shares and no trades in those shares are reported, it may be difficult for you to dispose of your Preferred Shares or even to obtain accurate quotations as to the market price of your shares. Moreover, because the order handling rules adopted by the SEC that apply to shares listed on a national securities exchange do not apply to OTC quotation system shares, no market maker will be required to maintain an orderly market in our shares. Accordingly, an order to sell our shares placed with a market maker may not be processed until a buyer for the shares is readily available, if at all, which may further limit your ability to sell your shares at prevailing market prices.
27
Table of Contents
Item 1B—Unresolved Staff Comments
None.
Our store support center is located at 6450 Via Del Oro, San Jose, California. This facility is occupied under a 15-year lease, for approximately 76,000 square feet. We operate one distribution center and warehouse located in Tracy, California. This facility is occupied under a 20-year lease, with three 5-year extensions, for approximately 517,000 square feet.
The following table reflects the aggregate square footage and number of (a) leased, (b) owned improvements, subject to ground lease, and (c) owned properties for our stores as of January 28, 2012:
| No. of Stores | Square Footage | |||||||
| Leased |
71 | 3,657,473 | ||||||
| Owned |
10 | 529,272 | ||||||
| Owned buildings, subject to ground lease |
6 | 318,954 | ||||||
|
|
|
|
|
|||||
| Total |
87 | 4,505,699 | ||||||
|
|
|
|
|
|||||
All of our stores are located within California. Our stores average approximately 44,000 square feet of enclosed retail space and approximately 8,000 square feet of exterior nursery and garden space. Our lease agreements generally range from fifteen to twenty year initial terms with three to four 5-year extension options. All of our owned stores and four of our owned buildings, subject to ground leases, are secured by our Real Estate Term Loan.
Three putative class action lawsuits, brought on behalf of current and former employees, are pending against the Company. One of these lawsuits was brought in 2010 and two were brought in 2011. These lawsuits allege that we failed to comply with various California labor laws, including misclassification of non-exempt employees as exempt employees, failure to pay regular, overtime, and final wages, failure to provide meal and/or rest breaks, and failure to provide accurate wage statements. We deny the allegations in the claims of these lawsuits and intend to vigorously defend against them. However, we cannot predict with assurance the outcome of these lawsuits and accordingly adverse developments, settlements, or resolutions may occur and negatively impact income in the quarter of such development, settlement, or resolution. However, based on the information currently available, we do not believe that any of these lawsuits would have a material adverse effect on the consolidated financial position or results of operations.
We are also a defendant in various other legal proceedings arising in the ordinary course of our business. Based on the information currently available, we are not currently a party to any legal proceeding that management believes would have a material adverse effect on our consolidated financial position or results of operations.
Item 4—Mine Safety Disclosures
Not applicable.
28
Table of Contents
Part II
Item 5—Market for Registrant’s Common Equity, Related Stockholder Matters and Issuer Purchases of Equity Securities
Our Class A Common Stock has been listed and traded on NASDAQ under the symbol “OSH” since January 3, 2012. As of April 2, 2012, there were 4,810,588 Class A stockholders of record, four Class B stockholders of record, and one Class C stockholder of record. Shares of our Class B Common Stock and Class C Common Stock are not publicly traded and there is no market for these securities. Our Class C Common Stock can be converted, on a share for share basis, into our Class A Common Stock. Our Series A Preferred Stock has been quoted on the OTCQB under the symbol “OSHSP” since January 3, 2012. As of April 2, 2012, there were 9,306 record holders of Series A Preferred Stock. Prior to January 3, 2012, there was no public market for our capital stock.
Equity Compensation Plan Information
Information regarding securities authorized for issuance under equity compensation plans is incorporated by reference to the information in our 2012 Proxy Statement to Stockholders to be filed pursuant to Regulation 14A under the Exchange Act no later than 120 days after the end of the Company’s 2011 fiscal year. See Note 9, “Stock-Based Compensation” of the Notes to our Consolidated Financial Statements for information regarding our equity compensation plans.
Dividend Policy
We do not expect to pay any dividends on our Class A Common Stock, Class B Common Stock, Class C Common Stock, or Series A Preferred Stock for the foreseeable future. The terms of the Series A Preferred Stock do not entitle the holders thereof to any dividends. In addition, our Series A Preferred Stock provides that dividends and other distributions may not be paid on any shares of our capital stock until all outstanding shares of the Series A Preferred Stock have been redeemed or repurchased unless such dividend or distribution (i) has been unanimously approved by our Board of Directors or (ii) relates to a “poison pill” stockholder rights plan. Furthermore, the terms of our debt agreements restrict us from paying dividends on our capital stock.
29
Table of Contents
Stock Performance Graph
The following graph compares the percentage change in the cumulative total stockholder return on our Class A Common Stock during the period beginning January 3, 2012 (the closing price of $23.53 on the first day of trading on the NASDAQ following our becoming an independent, publicly traded company as a result of Sears Holdings’ distribution of its shares of the Company to Sears Holdings’ stockholders on December 30, 2011) and ending on February 17, 2012, with (i) the NASDAQ Composite Index and (ii) the NASDAQ Retail Trade Index. The graph assumes that the value of the investment in the Class A Common Stock and each index (including reinvestment of dividends) was $100 on January 3, 2012 in the case of our Class A Common Stock and an investment in an index. The closing price as of January 27, 2012 (the closing price closest to our fiscal 2011 year end) was $17.90.
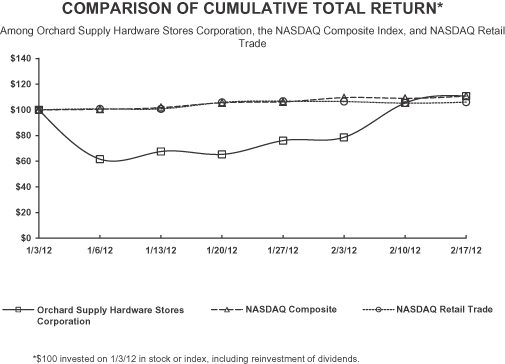
The stock price performance included in this graph is not necessarily indicative of future stock price performance.
This performance graph shall not be deemed “filed” for purposes of Section 18 of the Exchange Act or incorporated by reference into any of our filings, as amended, with the Securities and Exchange Commission, except as shall be expressly set forth by specific reference in such filing.
Unregistered Sales of Equity Securities
In December 2011, in connection with the Distribution, we issued 4,806,000 shares of Series A Preferred Stock, par value $0.00001 per share, to Sears, Roebuck. Sears, Roebuck is a subsidiary of Sears Holdings, and at the time of the issuance of the Preferred Stock, the Company was a majority-owned subsidiary of Sears Holdings. No solicitation was made and no underwriting discounts were given or paid in connection with the issuance of the Preferred Stock. The Company believes that the issuance of the Preferred Stock in connection with the Distribution was exempt from registration with the SEC pursuant to Section 4(2) of the Securities Act of 1933, as amended.
30
Table of Contents
Item 6.—Selected Financial Data
The following selected financial data are derived from the Consolidated Financial Statements of the Company. The selected historical consolidated financial and other financial data presented below should be read in conjunction with our consolidated financial statements and accompanying notes and the “Management’s Discussion and Analysis of Financial Condition and Results of Operations” included in this Form 10-K. The consolidated financial information may not be indicative of our future performance and does not necessarily reflect what our financial position and results of operations would have been had we operated as an unaffiliated publicly traded company independent from Sears Holdings during the periods presented, including changes that will occur in our operations and capitalization as a result of the Spin-off from Sears Holdings. See Note 1 “Basis of Presentation” and Note 11 “Related Party Agreements” of Notes to our consolidated financial statements for a further discussion.
| Fiscal Year | ||||||||||||||||||||
| 2011 | 2010 | 2009 | 2008 | 2007 | ||||||||||||||||
| (in millions, except per share) | ||||||||||||||||||||
| Consolidated Statement of Operations Data(1) |
||||||||||||||||||||
| Net sales |
$ | 660.5 | $ | 660.7 | $ | 682.4 | $ | 761.5 | $ | 834.7 | ||||||||||
| Net (loss) income(2) |
$ | (14.5 | ) | $ | 8.7 | $ | 19.3 | $ | (243.4 | ) | $ | 14.4 | ||||||||
| Basic and diluted (loss) income per share(3) |
$ | (2.40 | ) | $ | 1.45 | $ | 3.21 | $ | (40.47 | ) | $ | (0.36 | ) | |||||||
| Basic and diluted weighted average common shares outstanding(3) |
6.0 | 6.0 | 6.0 | 6.0 | 6.0 | |||||||||||||||
| Consolidated Balance Sheet Data: |
||||||||||||||||||||
| Total assets |
$ | 546.5 | $ | 630.0 | $ | 621.5 | $ | 636.2 | $ | 914.3 | ||||||||||
| Debt and capital lease obligations |
$ | 262.4 | $ | 338.2 | $ | 364.9 | $ | 375.3 | $ | 395.1 | ||||||||||
| Other long-term liabilities |
$ | 29.3 | $ | 16.3 | $ | 15.8 | $ | 14.9 | $ | 10.8 | ||||||||||
| Other Financial Data: |
||||||||||||||||||||
| Adjusted EBITDA(4) |
$ | 45.0 | $ | 69.4 | $ | 80.7 | $ | 84.8 | $ | 93.6 | ||||||||||
| Number of stores |
87 | 89 | 88 | 86 | 85 | |||||||||||||||
| Comparable stores sales decrease(5) |
(0.6 | )% | (4.4 | )% | (11.1 | )% | (9.1 | )% | (4.7 | )% | ||||||||||
| (1) | Our fiscal year end is the Saturday closest to January 31 each year. Accordingly, fiscal years 2011, 2010, 2009, 2008, and 2007 contained 52 fiscal week periods. |
| (2) | In fiscal year 2011 we recorded a $14.8 million non-cash loss from the sale-leasebacks of our distribution center and Hollywood, California store. In addition, we recorded a $2.1 million benefit related to the reversal of the Save Mart case accrual. In fiscal 2010, we recorded a $5.6 million legal liability pursuant to the Save Mart case. In fiscal year 2008, we recorded a goodwill impairment charge of $262.8 million. |
| (3) | We effected a 6-to-1 stock split on December 8, 2011. All share and per share information relating to our capital stock in this document reflects such 6-to-1 stock split. |
| (4) | Adjusted EBITDA is calculated as described below. |
In addition to our net (loss) income determined in accordance with GAAP, for purposes of evaluating operating performance, we use Adjusted Earnings Before Interest, Taxes, Depreciation and Amortization (“Adjusted EBITDA”), a non-GAAP financial measure, which is adjusted to exclude certain significant items as set forth below. Our management uses Adjusted EBITDA to evaluate the operating performance of our business, as well as executive compensation metrics, for comparable periods. Adjusted EBITDA should not be used by investors or other third parties as the sole basis for formulating investment decisions as it excludes a number of important cash and non-cash recurring items. Adjusted EBITDA should not be considered as a substitute for GAAP measurements.
While Adjusted EBITDA is a non-GAAP financial measurement, management believes that it is an important indicator of operating performance because:
| • | Adjusted EBITDA excludes the effects of financing and investing activities by eliminating the effects of interest and depreciation costs; |
31
Table of Contents
| • | Management considers gain/(loss) on the sale of assets and impairment to result from investing decisions rather than ongoing operations; and |
| • | Other significant items, while periodically affecting our results, may vary significantly from period to period and have a disproportionate effect in a given period, which affects comparability of results. |
The following table and the discussion that follows presents information related to the non-GAAP performance measure Adjusted EBITDA. Due to the fact that Adjusted EBITDA is a non-GAAP measure, we have also included a reconciliation from Adjusted EBITDA to net income/loss (in millions).
| Fiscal Year Ended | ||||||||||||||||||||
| 2011 | 2010 | 2009 | 2008 | 2007 | ||||||||||||||||
| Net (loss) income |
$ | (14.5 | ) | $ | 8.7 | $ | 19.3 | $ | (243.4 | ) | $ | 14.4 | ||||||||
| Interest expense, net |
23.4 | 17.4 | 16.8 | 22.9 | 30.1 | |||||||||||||||
| Income tax (benefit) expense |
(10.8 | ) | 5.6 | 12.7 | 10.3 | 12.5 | ||||||||||||||
| Depreciation and amortization |
29.4 | 31.2 | 29.9 | 31.4 | 35.3 | |||||||||||||||
| Goodwill impairment |
262.8 | |||||||||||||||||||
| Loss on sale and impairment of assets |
18.1 | 0.6 | 0.3 | (0.4 | ) | |||||||||||||||
| Stock-based compensation |
0.3 | 0.3 | 0.5 | 0.1 | 0.3 | |||||||||||||||
| Other significant items |
(0.9 | ) | 5.6 | 1.2 | 0.7 | 1.4 | ||||||||||||||
|
|
|
|
|
|
|
|
|
|
|
|||||||||||
| Adjusted EBITDA |
$ | 45.0 | $ | 69.4 | $ | 80.7 | $ | 84.8 | $ | 93.6 | ||||||||||
|
|
|
|
|
|
|
|
|
|
|
|||||||||||
| Adjusted EBITDA as a % of net sales |
6.8 | % | 10.5 | % | 11.8 | % | 11.1 | % | 11.2 | % | ||||||||||
Adjusted EBITDA is not the same as EBITDA as defined for our Senior Secured Term Loan and Real Estate Term Loans.
Other significant items include certain reserves and charges not in the normal course of our operations that periodically affect the comparability of our results. We recorded severance charges of $1.2 million, $1.3 million, and $0.7 million in fiscal 2011, 2009, and 2008, respectively, due to changes in our management structure and in connection with our cost cutting initiatives. In fiscal 2010, we recorded a $5.1 million liability judgment pursuant to the Save Mart Supermarkets legal case and $0.5 million in fees, which was settled in fiscal 2011 as described in Note 12, “Commitment and Contingencies” of the consolidated financial statements. As a result of the settlement, we recorded a $2.1 million reduction to this liability in fiscal 2011. In fiscal 2007, the Company recorded a $1.4 million accrual pursuant to the settlement of two class action wage and hour lawsuits that alleged certain violations of the California Labor Code.
| (5) | Comparable sales figures are defined as follows: |
| 1. | Comparable store sales. Measured by the increase or decrease in net sales year over year, excluding new and closed stores and E-commerce. Additionally, and because of an agreement the Company entered into with Sears Holdings (the “Appliances Agreement”) on October 26, 2011 whereby the Company now sells appliances on a consignment basis and receives commission income for sales of such appliances and related protection agreements, comparable store sales also exclude approximately $3.5 million of sales of Sears branded appliances in the fourth quarter of fiscal 2010 and approximately $0.3 million of commission income in the fourth quarter of fiscal 2011. |
| 2. | Comparable transaction volume. Derived from the increase or decrease in the number of transactions year over year, excluding new and closed stores, appliance sales, and E-commerce. |
| 3. | Average ticket comparables. Derived using net sales divided by the number of transactions year over year. |
A store is included in the calculation of comparable metrics above if it has been opened for at least 12 months, including relocated and remodeled stores. Comparable sales metrics discussed above are intended only as supplemental information and are not a substitute for information presented in accordance with generally accepted accounting principles.
32
Table of Contents
Item 7.—Management’s Discussion and Analysis of Financial Condition and Results of Operations
CAUTIONARY STATEMENT CONCERNING FORWARD-LOOKING STATEMENTS
You should read the following discussion and analysis in conjunction with Part II, Item 6 “Selected Financial Data” and our audited consolidated financial statements and the related notes thereto included in Item 8 “Financial Statements and Supplementary Data.” In addition to historical consolidated financial information, this discussion contains forward-looking statements that reflect our plans, estimates and beliefs. Actual results could differ from these expectations as a result of factors including those described under Item 1A, “Risk Factors,” “Special Note Regarding Forward-Looking Statements” and elsewhere in this Form 10-K.
ORCHARD SUPPLY HARDWARE STORES CORPORATION OVERVIEW
Orchard Supply Hardware Stores Corporation, through its wholly-owned subsidiary, Orchard Supply Hardware LLC, is a specialty retailer primarily focused on homeowners with repair, maintenance and improvement needs. Founded as a purchasing cooperative in San Jose, California in 1931, as of January 28, 2012, we operated 87 full-service home improvement stores in California. Our stores average approximately 44,000 square feet of enclosed space plus approximately 8,000 square feet of nursery and garden area, carrying a broad assortment of merchandise across three primary categories: repair and maintenance, lawn and garden and in-home products. The stores are easy to navigate and convenient to shop, designed to appeal to do-it-yourself customers for home repair and maintenance. We also serve the small professional customer whose purchases are largely motivated by a need for incremental supplies and tools to complete construction projects. We offer customers a unique value proposition comprised of service, selection and convenience.
On December 30, 2011, through the Spin-Off, we became an independent, publicly-traded company as a result of Sears Holdings’ distribution of its shares of Orchard to Sears Holdings’ stockholders where Sears Holdings’ stockholders of record as of the Record Date received one share of Orchard’s Class A Common Stock and one share of Orchard’s Series A Preferred Stock for every 22.141777 shares of Sears Holdings’ common stock held.
At the time of the Spin-Off, Class A Common Stock owned by Ares Corporate Opportunities Fund (“ACOF”) immediately prior to the Spin-Off was exchanged for Class C Common Stock. Class A and Class C Common Stock represent approximately 80% and 20% of the general voting power of Orchard’s outstanding capital stock, respectively. The outstanding shares of Preferred Stock represent 100% of Orchard’s outstanding nonvoting capital stock.
Following the Spin-Off, since January 3, 2012, our Class A Common Stock has been listed and traded on NASDAQ under the symbol “OSH” and our Series A Preferred Stock has been quoted on the OTCQB under the symbol “OSHSP.”
Fiscal Year
Our fiscal year end is the Saturday closest to January 31 each year. Fiscal 2011, 2010 and 2009 all consisted of 52 weeks. Each of our fiscal quarters consists of 13 weeks. Unless otherwise stated, references to years in this report relate to fiscal years rather than to calendar years. The following fiscal periods are presented in this report.
| Fiscal Year |
Ended | Weeks | ||||||
| 2011 |
January 28, 2012 | 52 | ||||||
| 2010 |
January 29, 2011 | 52 | ||||||
| 2009 |
January 30, 2010 | 52 | ||||||
33
Table of Contents
EXECUTIVE OVERVIEW
Key Overall Strategies
Fiscal 2011 was a year of transition for us. Mark Baker joined the Company in March 2011 as our Chief Executive Officer and President. Mr. Baker assessed the Company’s business organization and management structure, store model and format, and overall company strategy. Mr. Baker’s assessment resulted in management changes, a new focus on enhancing the store experience, a movement to introduce an improved merchandise assortment and improved inventory management, especially to ensure better store-level in-stock dependability, and the re-energizing of our store associates. The five key priorities initiated in 2011 which will be continued through 2012 are:
| • | Project a consistent and compelling brand identity; |
| • | Drive sales through merchandising and marketing initiatives; |
| • | Improve operational efficiencies; |
| • | Align resources and talent; and |
| • | Strengthen our financial position. |
Fiscal 2011 Financial Summary
| • | For fiscal 2011, net sales were $660.5 million, a decrease of $0.2 million as compared to net sales of $660.7 million for fiscal 2010. The decrease in net sales was primarily attributable to more rainfall during the 2011 spring season relative to the 2010 spring season, partially offset by positive comparable store sales in the third and fourth fiscal 2011 quarters. |
| • | Comparable store sales, as defined above, for fiscal 2011 decreased by 0.6%, primarily attributable to a decline in comparable transaction volume of 4.5%, partially offset by an increase in average ticket comparables of 3.9% for fiscal 2011 as compared to fiscal 2010. |
| • | Gross margin, defined as net sales, less cost of sales (excluding depreciation and amortization), decreased to $219.5 million, or 33.2% of net sales, for fiscal 2011, as compared to $228.9 million, or 34.6% of net sales for fiscal 2010. The decrease in gross margin was primarily due to higher occupancy costs, higher markdowns as a result of inventory reduction activities, and higher shrink expenses. |
| • | We recorded $14.5 million in net loss for fiscal 2011, as compared to $8.7 million in net income for fiscal 2010. The swing from net income to net loss was primarily due to the reduction of gross margin and a $18.1 million non-cash loss on sale of real property and impairment charges in fiscal 2011 as compared to a $0.6 million non-cash loss in fiscal 2010. |
| • | Merchandise inventory was $157.7 million at the end of fiscal 2011, a decrease of $14.4 million or 8.4% as compared to merchandise inventory of $172.1 million at the end of fiscal 2010. |
| • | During fiscal 2011, we generated $56.5 million in net proceeds from three different sale-leaseback transactions that included five properties. The proceeds were primarily used to pay down debt which allowed us to renegotiate and amend our financing agreements. We ended fiscal 2011 with $199.5 million of debt, or $72.0 million less debt than fiscal 2010. |
| • | Adjusted EBITDA was $45.0 million for fiscal 2011 as compared to Adjusted EBITDA of $69.4 million for fiscal 2010. Adjusted EBIDTA as presented above under “Selected Financial Data” is a supplemental measure of our operating performance that is not required by or presented in accordance with GAAP. Adjusted EBITDA should not be considered as an alternative to net income (loss) or any other performance measures derived in accordance with GAAP or as an alternative to cash flows from operating activities as a measure of our liquidity. The decrease in Adjusted EBITDA of $24.4 million was primarily due to the reduction in gross margin and increased spending on strategic initiatives and transition costs. |
34
Table of Contents
Challenges and Accomplishments in Fiscal 2011
Despite an improving economy in fiscal 2011, the home improvement industry in California continued to be challenged by high unemployment, declining home values, tight consumer credit, and modest growth in personal disposable income.
However, we are pleased with the many changes and strong progress we made in fiscal 2011 to lay the foundation to move us in a new direction. The progress we made includes more effective inventory management, more compelling merchandising, expansion of our corporate support infrastructure, and strengthening our financial position. As we continue through fiscal 2012, with solid execution, we intend to capitalize on our ability to provide the home improvement customer with unmatched service, selection, and convenience. While our key priorities address factors we can control, we can only mitigate the significant effect an adverse economic environment has on most retailers. Despite the economic uncertainty, we believe we are well positioned to take advantage of the markets we serve.
RESULTS OF OPERATIONS
The discussion that follows should be read in conjunction with the consolidated financial statements and notes thereto. Our consolidated results of operations for fiscal years 2011, 2010, and 2009 are summarized below (dollars and shares in millions except per share amounts).
| FISCAL YEAR | ||||||||||||||||||||||||
| 2011 | % of Net Sales |
2010 | % of Net Sales |
2009 | % of Net Sales |
|||||||||||||||||||
| NET SALES |
$ | 660.5 | 100 | % | $ | 660.7 | 100 | % | $ | 682.4 | 100 | % | ||||||||||||
| COST OF SALES AND EXPENSES: |
||||||||||||||||||||||||
| Cost of sales (excluding depreciation and amortization) |
441.0 | 66.8 | % | 431.8 | 65.4 | % | 438.1 | 64.2 | % | |||||||||||||||
| Gross margin |
219.5 | 33.2 | % | 228.9 | 34.6 | % | 244.3 | 35.8 | % | |||||||||||||||
| Selling and administrative |
177.2 | 26.8 | % | 166.0 | 25.1 | % | 165.6 | 24.3 | % | |||||||||||||||
| Depreciation and amortization |
29.4 | 4.5 | % | 31.2 | 4.7 | % | 29.9 | 4.4 | % | |||||||||||||||
| Loss on sale of real property |
14.8 | 2.2 | % | 0.0 | % | 0.0 | % | |||||||||||||||||
|
|
|
|
|
|
|
|||||||||||||||||||
| Total cost of sales and expenses |
662.4 | 100.3 | % | 629.0 | 95.2 | % | 633.6 | 92.8 | % | |||||||||||||||
|
|
|
|
|
|
|
|||||||||||||||||||
| OPERATING (LOSS) INCOME |
(1.9 | ) | (0.3 | )% | 31.7 | 4.8 | % | 48.8 | 7.2 | % | ||||||||||||||
| INTEREST EXPENSE, NET |
23.4 | 3.5 | % | 17.4 | 2.6 | % | 16.8 | 2.5 | % | |||||||||||||||
|
|
|
|
|
|
|
|||||||||||||||||||
| (LOSS) INCOME BEFORE INCOME TAXES |
(25.3 | ) | (3.8 | )% | 14.3 | 2.2 | % | 32.0 | 4.7 | % | ||||||||||||||
| INCOME TAX (BENEFIT) EXPENSE |
(10.8 | ) | (1.6 | )% | 5.6 | 0.8 | % | 12.7 | 1.9 | % | ||||||||||||||
|
|
|
|
|
|
|
|||||||||||||||||||
| NET (LOSS) INCOME |
$ | (14.5 | ) | (2.2 | )% | $ | 8.7 | 1.3 | % | $ | 19.3 | 2.8 | % | |||||||||||
|
|
|
|
|
|
|
|||||||||||||||||||
| Basic and diluted (loss) income per share |
$ | (2.40 | ) | $ | 1.45 | $ | 3.21 | |||||||||||||||||
| Basic and diluted weighted average common shares outstanding |
6.0 | 6.0 | 6.0 | |||||||||||||||||||||
| STORE COUNT |
87 | 89 | 88 | |||||||||||||||||||||
Fiscal 2011 Compared to Fiscal 2010
Net sales
| Increase (Decrease) | ||||||||||||||||
| 2011 | 2010 | $ | % | |||||||||||||
| Net sales |
$ | 660.5 | $ | 660.7 | $ | (0.2 | ) | 0.0 | % | |||||||
35
Table of Contents
Net sales decreased $0.2 million to $660.5 million for the fiscal year 2011, as compared to $660.7 million for the prior year. The change in net sales was driven by growth in our repair and maintenance category of approximately $1.3 million, primarily driven by the hardware business, offset by declines in our lawn and garden and in-home categories of approximately $1.5 million. The lawn and garden category was driven by declines during the first fiscal quarter where we experienced unseasonably wet weather. The in-home category was primarily driven by reduced demand for housewares. Our comparable store sales decreased by 0.6% for fiscal year 2011, attributable to a decrease in comparable transaction volume of 4.5%, partially offset by an increase of 3.9% in average ticket comparables as compared to the prior year.
Gross margin
| Increase (Decrease) | ||||||||||||||||
| 2011 | 2010 | $ | % | |||||||||||||
| Gross margin |
$ | 219.5 | $ | 228.9 | $ | (9.4 | ) | (4.1 | )% | |||||||
| Percent of net sales |
33.2 | % | 34.6 | % | ||||||||||||
Gross margin decreased $9.4 million to $219.5 million, or 33.2% of net sales, for fiscal 2011, as compared to $228.9 million, or 34.6% of net sales, for the prior year. The decrease of 140 basis points in gross margin was primarily due to: (a) higher occupancy costs of approximately 70 basis points as a result of paying rent on properties previously owned prior to sale-leaseback transactions, renegotiated leases, and increases in store maintenance expenses; (b) higher shrink expenses of approximately 50 basis points; and (c) lower vendor subsidies of approximately 20 basis points due to the elimination of certain promotional events.
Selling and administrative
| Increase (Decrease) | ||||||||||||||||
| 2011 | 2010 | $ | % | |||||||||||||
| Selling and administrative |
$ | 177.2 | $ | 166.0 | $ | 11.2 | 6.7 | % | ||||||||
| Percent of net sales |
26.8 | % | 25.1 | % | ||||||||||||
Selling and administrative expenses increased $11.2 million to $177.2 million, or 26.8% of net sales, for fiscal 2011, as compared to $166.0 million, or 25.1% of net sales, for the prior year. The increase in selling and administrative expenses is primarily due to (a) non-cash store impairment charges of approximately $3.5 million related to the write-down of store assets that were disposed of or determined to be impaired, (b) an accrual of future rent payments of $1.2 million on closed stores, (c) severance payments of approximately $1.2 million, (d) increased payroll and other expenses of approximately $3.0 million to improve store execution, (e) a $3.7 million increase in legal and professional expenses associated with becoming an independent public company, (f) a $4.9 million investment in enhanced capabilities, and (g) $1.5 million in higher insurance and other operating costs. This is partially offset by a net $7.8 million reduction in legal expenses compared to the prior year as a result of the Save Mart Supermarkets legal settlement. In fiscal 2010, we recorded a $5.6 million legal liability pursuant to the Save Mart case which was settled in fiscal 2011 as described in Note 12, “Commitments and Contingencies” of the consolidated financial statements. As a result of the settlement, we recorded a $2.1 million reduction to this liability in fiscal 2011.
Loss on sale of real property
| Increase (Decrease) | ||||||||||||||||
| 2011 | 2010 | $ | % | |||||||||||||
| Loss on sale of real property |
$ | 14.8 | $ | — | $ | 14.8 | — | |||||||||
During fiscal 2011, we recorded a non-cash loss of $14.8 million in connection with the sale-leaseback transactions involving our distribution center in Tracy, California and a store located in Hollywood, California. There was no sale of real property in the prior year.
36
Table of Contents
Depreciation and amortization
| Increase (Decrease) | ||||||||||||||||
| 2011 | 2010 | $ | % | |||||||||||||
| Depreciation and amortization |
$ | 29.4 | $ | 31.2 | $ | (1.8 | ) | (5.8 | )% | |||||||
Depreciation and amortization decreased $1.8 million to $29.4 million in fiscal 2011, or 5.8%, as compared to $31.2 million in the prior year. The decrease of depreciation and amortization expense was primarily due to an increase in fully depreciated assets, and the reduction to property and equipment due to the sale-leaseback transactions.
Interest expense, net
| Increase (Decrease) | ||||||||||||||||
| 2011 | 2010 | $ | % | |||||||||||||
| Interest expense, net |
$ | 23.4 | $ | 17.4 | $ | 6.0 | 34.5 | % | ||||||||
Interest expense increased $6.0 million to $23.4 million in fiscal 2011, or 34.5%, as compared to $17.4 million in the prior year. The $6.0 million increase in interest expense was primarily due to higher interest rates associated with the amendments to our Senior Secured Term Loan and Real Estate Secured Term Loan which together accounted for $4.3 million of the increase. In addition, the Company recorded $1.2 million higher amortization of deferred financing costs which increased during fiscal 2011 as a result of these amendments and $1.1 million due to higher capital lease assets.
Income tax (benefit) expense
| Increase (Decrease) | ||||||||||||||||
| 2011 | 2010 | $ | % | |||||||||||||
| Income tax (benefit) expense |
$ | (10.8 | ) | $ | 5.6 | $ | (16.4 | ) | (292.9 | )% | ||||||
| Effective tax rate |
42.9 | % | 39.0 | % | ||||||||||||
Income tax benefit was $10.8 million in fiscal 2011 as compared to an income tax expense of $5.6 million recorded in the prior year. The effective tax rate was 42.9% and 39.0% for fiscal 2011 and 2010, respectively. The change in our effective tax rate was primarily due to differences in tax credits applicable year over year.
Fiscal 2010 Compared to Fiscal 2009
Net sales
| Increase (Decrease) | ||||||||||||||||
| 2010 | 2009 | $ | % | |||||||||||||
| Net sales |
$ | 660.7 | $ | 682.4 | $ | (21.7 | ) | (3.2 | )% | |||||||
Net sales decreased $21.7 million, or 3.2%, to $660.7 million for fiscal 2010, as compared to $682.4 million in the prior year. The decrease in net sales was primarily attributable to a decrease in our repair and maintenance category primarily driven by declines in sales of plumbing, industrial, paint, and electrical products of approximately $20.6 million, and in our in-home category, which was primarily driven by reduced demand for housewares of approximately $0.8 million, partially offset by an improvement in appliance sales. Appliance sales increased as a result of the benefits attributable from U.S. government energy/green consumer subsidies and an increase in the number of stores offering appliances from 19 to 34.
37
Table of Contents
Our comparable store sales decreased by approximately 4.4% for fiscal 2010, which was driven by a decline in comparable transaction volume of 4.8%, partially offset by an increase of 0.4% in average ticket comparables. We believe that the decline in comparable transaction volume was primarily due to reduced consumer spending in California due to the continued adverse economic conditions.
Gross margin
| Increase (Decrease) | ||||||||||||||||
| 2010 | 2009 | $ | % | |||||||||||||
| Gross margin |
$ | 228.9 | $ | 244.3 | $ | (15.4 | ) | (6.3 | )% | |||||||
| Percent of net sales |
34.6 | % | 35.8 | % | ||||||||||||
Gross margin decreased $15.4 million to $228.9 million, or 34.6% of net sales, for fiscal 2010, as compared to $244.3 million, or 35.8% of net sales, in the prior year. The decrease of 117 basis points in gross margin was primarily due to an increase of 104 basis points in markdowns tied to increased clearance and promotional activities.
Selling and administrative
| Increase (Decrease) | ||||||||||||||||
| 2010 | 2009 | $ | % | |||||||||||||
| Selling and administrative |
$ | 166.0 | $ | 165.6 | $ | 0.4 | 0.2 | % | ||||||||
| Percent of net sales |
25.1 | % | 24.3 | % | ||||||||||||
Selling and administrative expenses increased by $0.4 million to $166.0 million, or 25.1% of net sales, for fiscal 2010, as compared to $165.6 million, or 24.3% of net sales in the prior year. The increase in selling and administrative expenses was primarily due to an increase in legal and administrative costs of approximately $7.3 million of which $5.6 million was an accrual in respect to the Save Mart Supermarkets legal case, and an increase in advertising costs of approximately $0.7 million, offset by a decrease in payroll costs of approximately $7.7 million, which was driven primarily by reduced store payroll costs as a part of management’s efforts to respond to the decline in sales and economic conditions.
Depreciation and amortization
| Increase (Decrease) | ||||||||||||||||
| 2010 | 2009 | $ | % | |||||||||||||
| Depreciation and amortization |
$ | 31.2 | $ | 29.9 | $ | 1.3 | 4.3 | % | ||||||||
Depreciation and amortization expense was $31.2 million in fiscal 2010, as compared to $29.9 million in the prior year. The increase in depreciation and amortization expense was primarily due to the increase in capital lease assets and capital expenditures during the year.
Interest expense, net
| Increase (Decrease) | ||||||||||||||||
| 2010 | 2009 | $ | % | |||||||||||||
| Interest expense, net |
$ | 17.4 | $ | 16.8 | $ | 0.6 | 3.6 | % | ||||||||
Interest expense increased by $0.6 million to $17.4 million in fiscal 2010, or 3.6%, as compared to $16.8 million in the prior year. The increase in interest expense was primarily due to an increase in commitment fees of $0.4 million on the Senior Secured Credit Facility and the increased interest rate associated with the Real Estate Secured Term Loan.
38
Table of Contents
Income taxes
| Increase (Decrease) | ||||||||||||||||
| 2010 | 2009 | $ | % | |||||||||||||
| Income tax expense |
$ | 5.6 | $ | 12.7 | $ | (7.1 | ) | (55.9 | )% | |||||||
| Effective tax rate |
39.0 | % | 39.8 | % | ||||||||||||
Income tax expense was $5.6 million in fiscal 2010 as compared to $12.7 million recorded in the prior year. The effective tax rate was 39.0% in fiscal 2010 and 39.8% in fiscal 2009. The change in our effective tax rate is primarily due to differences in tax credits applicable year over year.
LIQUIDITY AND CAPITAL RESOURCES
Cash Flow. Our cash flows for our fiscal years 2011, 2010 and 2009 were as follows (in millions):
| 2011 | 2010 | 2009 | ||||||||||
| Consolidated Statements of Cash Flows Data: |
||||||||||||
| Cash flows provided by operating activities |
$ | 31.9 | $ | 52.5 | $ | 25.9 | ||||||
| Cash flows provided by (used in) investing activities |
41.4 | (12.0 | ) | (11.5 | ) | |||||||
| Cash flows used in financing activities |
(80.7 | ) | (33.9 | ) | (18.2 | ) | ||||||
Cash Flows provided by operating activities
The primary source of our liquidity is our cash flows generated from our operating activities. Net cash provided by operating activities decreased by $20.6 million to $31.9 million in fiscal 2011 compared to fiscal 2010 primarily due to the decline in gross margins of approximately $9.4 million and higher selling and administrative cost including investments associated with becoming an independent public company. In addition, changes in our cash flows from working capital decreased by $7.7 million as compared to fiscal 2010 primarily due to the timing of our payables, offset by a decrease in inventory purchases.
Cash provided by operating activities was $52.5 million in fiscal 2010 as compared to $25.9 million in fiscal 2009. The increase in cash provided by operating activities was primarily due to the timing of our intercompany payments to Sears Holdings for goods and services received, as well as the timing of payments for our merchandise payables. Cash provided by the change in merchandise payables improved year over year as we were less aggressive in pursuing early payment discounts from vendors in fiscal 2010. The increase is partially offset by the ramping up of our merchandise inventories for purposes of improving our in-stock merchandise.
Cash Flows provided by (used in) investing activities
Net cash provided by investing activities increased by $53.4 million to $41.4 million in fiscal 2011 as compared to net cash used in investing activities in fiscal 2010 primarily due to $56.5 million in net proceeds from the two sale-leaseback transactions involving our distribution center and our Hollywood, California store and net proceeds received and held as deposits for three stores we expect to be consummated as sale-leaseback transactions for accounting purposes in fiscal 2012 as described in Note 3, “Sale-Leaseback Transactions and Lease Financing Obligations” of the consolidated financial statements. In fiscal 2011, we spent $15.5 million in cash to purchase property and equipment, allocated as follows: 53% for relocated and remodeled stores and other initiatives as well as our support center, 26% for store maintenance and improvements, 15% for core technology, and 6% for merchandising fixtures.
Cash used in investing activities was $12.0 million in fiscal 2010 as compared to $11.5 million in fiscal 2009. In fiscal 2010, we spent $11.5 million on capital expenditures, allocated as follows: 34% for new stores, 21% for store maintenance and improvements, 17% for core technology, 9% for merchandising fixtures and 19%
39
Table of Contents
for other initiatives. In fiscal 2010, we added one new store. We also set aside $0.6 million in restricted cash for property improvements in accordance with our new $50 million Real Estate Secured Term Loan.
Cash Flows used in financing activities
Net cash used in financing activities increased $46.8 million to $80.7 million in fiscal 2011 as compared to fiscal 2010 primarily due to the use of net proceeds from transactions involving our distribution center and four stores to pay down debt of $56.5 million offset by approximately $10.0 million of net lower other pay downs relative to fiscal 2010.
Net cash used in financing activities was $33.9 million in fiscal 2010 and $18.2 million in fiscal 2009. Cash used in financing activities in fiscal 2010 increased primarily due to the repayment of $120.0 million commercial mortgage-backed securities loan, offset by a $50.0 million borrowing on the Real Estate Secured Term Loan, and a $48.0 million net borrowing on our Senior Secured Credit Facility.
Liquidity
As of January 28, 2012, we had cash and cash equivalents of $8.1 million. Our liquidity is dependent upon our cash balance and the continued availability of borrowings under our current financing arrangements. Our cash requirements for the next twelve months consist primarily of (i) working capital, (ii) capital expenditures associated with new store openings, remodels, and upgrades, as well as, to a lesser extent, information technology and other infrastructure, and (ii) payment of principal and interest on borrowings under our credit facilities.
We believe that our existing cash and cash equivalents, cash flows from our operating activities, and available borrowings under our financing arrangements will be sufficient to fund our operations including working capital, general corporate needs, planned capital expenditures, and principal and interest payments for at least the next 12 months. In addition, as of January 28, 2012, we were in compliance with the leverage covenant under our financing arrangements, and management currently believes that the Company will continue to be in compliance with this covenant (and other covenants under our financing arrangements) for at least the next 12 months. Those covenants are described in “Financing Arrangements” below. However, any material decline in our expected operating results may adversely impact our prospective compliance with the financial covenants.
In the third and fourth quarters of fiscal 2011, we consummated three different sale-leaseback transactions with respect to our distribution center located in Tracy, California and four stores located in California which cumulatively generated $56.5 million in net proceeds. We used the proceeds to pay down $21.6 million of our Real Estate Term Loan and $34.4 million of our Senior Secured Term Loan. Although these actions were not necessary for us to remain in compliance with our financial covenants as of January 28, 2012, they reduced our leverage and allowed us to renegotiate our financing arrangements to extend a portion of our Senior Secured Term Loan and allow for a higher leverage financial covenant.
The Company seeks to remain in compliance with its financing arrangements and generate sufficient liquidity by executing its sales growth strategy by, among other things, making improvements to its stores and store operations and upgrading and differentiating its product assortment. However, the adequacy of our available funds will depend on many factors, including the macroeconomic environment, the operating performance of our stores, and continued compliance with the covenants under our financing arrangements. Notwithstanding our expectations, if there is a significant decline in our expected operating results, we may be unable to meet our financial covenants, and lenders could demand repayment of the amounts outstanding under our financing agreements. Accordingly, there are no assurances that our sources of liquidity will be sufficient to fund our needs.
As such, a priority for the near term will be to focus on ensuring continued compliance with the leverage covenant under our financing arrangements, which means we remain focused on generating sufficient cash and managing our expenditures (through, for example, the delay or reduction of new store openings and store
40
Table of Contents
remodels, a reduction in payroll and benefit costs, deferring certain maintenance and other expenditures). We will also continue to examine a number of alternatives with respect to future financial covenant compliance and liquidity, including raising additional capital through permitted asset sales and/or sale-leaseback transactions or equity financing transactions. In addition, if necessary or advisable, we may seek to renegotiate our financing arrangements in order to remain in compliance while continuing to follow our current business plan, which includes plans for store expansion. There are no assurances that under such circumstances our financing arrangements could be renegotiated, or that alternative financing would be available on terms acceptable to us, if at all. In addition, any refinancing could be at higher interest rates and may require us to comply with more onerous covenants which could further restrict our business operations. In such case, if such renegotiations were necessary but unsuccessful, we would expect to modify our business plan in a manner that would allow us to remain in compliance. Such a modification could result in slower growth, a delay of new store openings and the potential for a decline in sales.
If we were unsuccessful in meeting our financial or other covenants in our financing arrangements, it would result in a default which could trigger acceleration of (or the right to accelerate) the related debt. Because of cross-default provisions in the agreements and instruments governing our indebtedness, a default under one agreement or instrument could result in a default under, and the acceleration of, our other indebtedness. In addition, our lenders would be entitled to proceed against the collateral securing the indebtedness. If any of our indebtedness were to be accelerated, it could adversely affect our ability to operate our business or we may be unable to repay such debt and, therefore, such acceleration could adversely affect our results of operations, financial condition.
Financing Arrangements
Our debt and capital lease obligations as of January 28, 2012 and January 29, 2011 are as follows (in millions):
| 2011 | 2010 | |||||||
| Senior Secured Credit Facility |
$ | 34.0 | $ | 48.0 | ||||
| Real Estate Term Loan |
27.9 | 50.0 | ||||||
| Senior Secured Term Loan |
137.6 | 173.5 | ||||||
| Capital lease obligations |
62.9 | 66.7 | ||||||
|
|
|
|
|
|||||
| Total debt and capital lease obligations |
$ | 262.4 | $ | 338.2 | ||||
|
|
|
|
|
|||||
Our debt is comprised of the following credit facilities (see Note 5—“Debt” of the Notes to our Consolidated Financial Statements for additional information regarding our credit facilities):
Senior Secured Credit Facility—On January 29, 2010, we amended, restated and extended our senior secured revolving credit facility (the “Senior Secured Credit Facility”) by reducing the revolving commitment to $120.0 million (subject to borrowing base limits). The amendment and restatement split the facility into two tranches. The first tranche was for $20.0 million with lenders who elected not to extend, of which $8.0 million was outstanding at maturity in December 2011. The second tranche was for $100.0 million with lenders who elected to extend, of which $34.0 million was outstanding as of January 28, 2012, maturing on the earlier to occur of 90 days prior to the maturity of the Senior Secured Term Loan (described below) and December 21, 2013. The Senior Secured Credit Facility permits us to obtain letters of credit, provided that our obligations with respect to letters of credit issued under our Senior Secured Credit Facility cannot exceed $25.0 million. As of January 28, 2012, we had outstanding letters of credit of $7.8 million. The Senior Secured Credit Facility was amended again in December 2011 in connection with amending and restating the Senior Secured Term Loan. The amendment, among other things, requires the Company to satisfy a liquidity test in order to make voluntary prepayments of the Senior Secured Term Loan.
The Senior Secured Credit Facility is available for general corporate purposes. Borrowings under the Senior Secured Credit Facility, are either base rate (“BR”) loans or Eurodollar loans, at our discretion. BR loans owing
41
Table of Contents
to non-extending lenders bear interest at the greater of (a) the prime rate as publicly announced by Wells Fargo Bank, N.A., or (b) the federal funds rate plus 0.5%, plus the “BR applicable rate” which ranges between 0% to 0.75%. BR loans owing to each extending lender bear interest at the greatest of (a) the prime rate as publicly announced by Wells Fargo Bank, N.A., (b) the federal funds rate plus 0.5%, or (c) the one month London Inter-Bank Offered Rate (“LIBOR”) plus 1.0%, plus the “BR extended term applicable rate” which ranges between 1.50% and 2.25%. Eurodollar loans owing to each non-extending lender bear interest at LIBOR, plus the “Eurodollar applicable rate” which ranges between 1.0% and 1.75%. Eurodollar loans owing to each extending lender bear interest at LIBOR, plus the “Eurodollar extended term applicable rate” which ranges between 2.50% and 3.25%. The interest rate spreads applicable to our borrowings fluctuate based upon our performance as measured by our leverage ratio. In addition, we are required to pay unused commitment fees based on our leverage ratio; for the fiscal year ended January 28, 2012, such fees were approximately $53,000 with respect to non-extending lenders and $0.5 million with respect to extending lenders.
Availability under the Senior Secured Credit Facility is determined pursuant to a borrowing base formula based on inventory and accounts and credit card receivables, subject to certain limitations. The Senior Secured Credit Facility subjects us to certain restrictive covenants, including a fixed charge coverage ratio that is triggered when availability under the Senior Secured Credit Facility reaches a minimum threshold of 10% of the total availability for three consecutive days. The fixed charge coverage ratio requires us to maintain a minimum ratio of 1.1 to 1.0 EBITDAR (EBITDA plus rent expense) to certain fixed charges. As of January 28, 2012, there was $58.1 million available to borrow under the Senior Secured Credit Facility.
Senior Secured Term Loan—On December 22, 2011, we amended and restated our senior secured term loan agreement (the “Senior Secured Term Loan”). The amendment and restatement split the facility into two tranches and amended the leverage covenant ratio. The first tranche was for $59.5 million with lenders who elected not to extend the maturity beyond December 21, 2013, of which $59.5 million was outstanding as of January 28, 2012. The second tranche was for $78.1 million with lenders who elected to extend the maturity date to December 21, 2015, of which $78.1 million was outstanding as of January 28, 2012. The first tranche requires quarterly principal payments of $0.2 million, and the second tranche requires quarterly principal payments of $0.2 million.
In addition to the quarterly principal payments discussed above, in the event we have excess cash flows at the end of a fiscal year, we are required to apply between 25% and 100% of such excess cash flows (reduced by previous voluntary prepayments) to repay outstanding loans. The annual excess cash flow prepayment percentage rate is a percentage of our excess cash flows determined by our leverage ratio and ratings. We did not pay any excess cash flow prepayments in fiscal 2010 or 2011 and we do not anticipate making any prepayments in fiscal 2012. In addition, the Senior Secured Term Loan requires us to make certain mandatory repayments in connection with the transfer of or damage to property securing the loan, in connection with certain dispositions of property owned by the Company, or in the event we incur certain types of debt.
Borrowings under the Senior Secured Term Loan are either alternate base rate (“ABR”) loans or Eurodollar loans, at our discretion. ABR loans owing to non-extending lenders bear interest at the greater of (a) the prime rate as publicly announced by JPMorgan Chase Bank, and (b) the federal funds rate, plus 0.5% (the “Base Rate”), plus the “ABR applicable rate” which ranges between 3.50% and 3.75% for non-extended loans. ABR loans owing to extending lenders bear interest at the ABR (which shall be deemed to be equal to at least 2.25%) plus 4.75%. Eurodollar loans owing to non-extending lenders bear interest at LIBOR, plus the “Eurodollar applicable rate” which ranges between 4.50% and 4.75%. Eurodollar loans owing to extending lenders bear interest at LIBOR (which shall be deemed to be equal to at least 1.25%), plus 5.75%. The interest rate spreads applicable to our non-extended borrowings fluctuate based upon the Company’s performance as measured by our leverage ratio. In addition, our extended loans bear a pay-in-kind (“PIK”) interest due at the end of the term at a rate equal to 3.00% or 4.00% per annum, depending on our ratings, with such interest automatically increasing the principal amount of the extended term loans on an annual basis. At January 28, 2012 our PIK interest rate was 3% based on our credit ratings, which have not changed since June 2011.
42
Table of Contents
The Senior Secured Term Loan subjects us to certain restrictions, including a restriction on the amount of annual capital expenditures we can make and a maximum adjusted leverage ratio covenant. Capital expenditures (as defined in the Senior Secured Term Loan) cannot exceed $22.5 million, $25.0 million, $27.5 million and $30.0 million in fiscal years 2012, 2013, 2014 and 2015, respectively. Our fiscal 2012 capital budget is $18.3 million.
The maximum adjusted leverage ratio covenant (as defined in the Senior Secured Term Loan) is calculated on the last day of each fiscal quarter as (a) consolidated total funded debt on such date minus unrestricted cash over $3 million (as defined in the Senior Secured Term Loan) to (b) trailing four fiscal quarters adjusted EBITDA (as defined in the Senior Secured Term Loan). The following table provides our maximum leverage ratio during the remaining term of the Senior Secured Term Loan.
| Fiscal Year |
Quarter 1 | Quarter 2 | Quarter 3 | Quarter 4 | ||||||||||||
| 2011 |
6.00:1 | |||||||||||||||
| 2012 |
6.00:1 | 5.75:1 | 5.75:1 | 5.75:1 | ||||||||||||
| 2013 |
5.75:1 | 5.25:1 | 5.25:1 | 5.25:1 | ||||||||||||
| 2014 |
5.25:1 | 5.00:1 | 5.00:1 | 5.00:1 | ||||||||||||
| 2015 |
5.00:1 | 4.75:1 | 4.75:1 | |||||||||||||
We were in compliance with the Senior Secured Term Loan covenants, including the maximum leverage ratio, which, at January 28, 2012 and January 29, 2011 was 4.87:1 and 4.89:1, respectively. At January 28, 2012 and January 29, 2011, assuming our current level of consolidated total funded debt remains constant, we estimate that a 18.8% and 11.0% or greater decline in our trailing four fiscal quarters Adjusted EBITDA, respectively, would cause us to exceed our maximum leverage ratio covenant for that period.
Real Estate Secured Term Loan—On October 27, 2010, we entered into a $50.0 million real estate secured term loan (the “Real Estate Secured Term Loan”), of which $27.9 is outstanding as of January 28, 2012, and matures on the earlier to occur of 90 days prior to the maturity of the Senior Secured Term Loan and December 21, 2013. The proceeds from the Real Estate Secured Term Loan, together with $33.0 million of available cash and a $37.0 million borrowing on our Senior Secured Credit Facility, were used to repay our then existing $120.0 million commercial mortgage-backed securities loan in full on October 27, 2010. The Real Estate Secured Term Loan requires us to meet the leverage covenant set forth in our Senior Secured Term Loan, subject to certain maximum thresholds. On December 19, 2011, we entered into the first amendment to the Real Estate Secured Term Loan, which lowered the minimum principal amount required under the Real Estate Secured Term Loan and allowed us to conduct certain sale-leaseback transactions. On December 27, 2011, we entered into the second amendment to the Real Estate Secured Term Loan, in connection with amending and restating the Senior Secured Term Loan.
Interest on the Real Estate Secured Term Loan is based on LIBOR plus 5.75% per annum (6.045% and 4.511% at January 28, 2012 and January 29, 2011, respectively), and is payable in monthly installments. In addition, we are required to make quarterly amortization payments of $0.1 million. In connection with the Real Estate Secured Term Loan, we entered into an interest rate cap agreement, which establishes a maximum interest rate on the Real Estate Secured Term Loan for LIBOR at 4% with a $25.0 million optional amount.
The Real Estate Secured Term Loan is currently secured by a first lien mortgage on 14 properties, which includes 10 properties owned and 4 properties on ground leases. The Real Estate Secured Term Loan is subject to a prepayment premium (which lapses in April, 2012) and breakage costs in the event we elect to repay all or a portion of the loan early. We have the option of prepaying a portion of the Real Estate Secured Term Loan and releasing individual properties by prepaying 125% of the allocated loan amount for such property.
Restrictions—The Senior Secured Credit Facility, Senior Secured Term Loan and Real Estate Secured Term Loan each place various restrictions on the Company, the guarantors of the loans and certain of their
43
Table of Contents
respective subsidiaries, including, but not limited to, limitations on their ability to incur or guarantee additional debt, pay dividends, make distributions, repurchase the Company’s capital stock, sell assets, or make investments (including extending credit to others), enter into sale-leaseback transactions, incur liens, enter into transactions with affiliates, enter into swap agreements, make payments with respect to certain types of debt, enter into agreements that limit the ability of a subsidiary to pay dividends or distributions or make or repay loans or advances or to transfer assets between the subsidiaries of the Company, enter into agreements that limit the ability to incur liens on the property owned by the Company, amend certain material documents, make changes to accounting treatment and reporting practices, change the fiscal year, and use proceeds of credit extensions to purchase or carry margin stock.
Change in Control—The Senior Secured Credit Facility, Senior Secured Term Loan and Real Estate Secured Term Loan each contain an event of default resulting from a change of control, which includes the following: (i) certain mergers, consolidations, sales or transfers of all or substantially all of the assets of the Company to persons other than ACOF, ESL and Sears Holdings; (ii) adoption of a plan of liquidation of the Company; (iii) prior to an initial underwritten public offering of common stock of the Company, Sears Holdings, ESL and ACOF ceasing to collectively hold directly or indirectly at least 50% of the total voting power of all shares of the Company’s voting capital stock; (iv) following an initial underwritten public offering of common stock of the Company, a person or group, other than Sears Holdings, ESL and ACOF, collectively holding directly or indirectly at least 40% of the total voting power of all shares of the Company’s voting capital stock and Sears Holdings, ESL and ACOF collectively holding less than such person or group; and (v) the Company’s Board of Directors not consisting of continuing Directors (“Change in Control”).
If one or both of ESL and ACOF dispose of all or part of their shareholding in the Company such that their combined total voting power drops below 50% (or 40% after an initial underwritten public offering), this may trigger a Change in Control event of default under the Senior Secured Credit Facility, Senior Secured Term Loan and Real Estate Secured Term Loan. An event of default could trigger certain acceleration clauses and cause those and the Company’s other obligations to become immediately due and payable and the Company may not have sufficient cash funds available to repay its debt obligations upon such a Change in Control.
CONTRACTUAL OBLIGATIONS
The following table summarizes our contractual obligations as of January 28, 2012 (in millions).
| Total | Less than 1 Year |
2-3 Years |
4-5 Years |
After 5 Years |
||||||||||||||||
| Total debt |
$ | 199.5 | $ | 2.3 | $ | 121.6 | $ | 75.6 | $ | |||||||||||
| Capital lease obligations (includes interest) |
130.8 | 12.5 | 25.4 | 24.2 | 68.7 | |||||||||||||||
| Operating leases |
252.7 | 30.1 | 58.4 | 44.3 | 119.9 | |||||||||||||||
| Other lease obligations (includes interest)(1) |
71.7 | 4.0 | 8.1 | 8.4 | 51.2 | |||||||||||||||
| Purchase obligations(2) |
49.2 | 49.2 | ||||||||||||||||||
|
|
|
|
|
|
|
|
|
|
|
|||||||||||
| Total |
$ | 703.9 | $ | 98.1 | $ | 213.5 | $ | 152.5 | $ | 239.8 | ||||||||||
|
|
|
|
|
|
|
|
|
|
|
|||||||||||
| (1) | Other lease obligations include $16.6 million for financing obligations, see Note 3, “Sale-Leaseback Transactions and Lease Financing Obligations” of the consolidated financial statements; and $55.1 million for deposits from real property, see Note 7, “Leases” of the consolidated financial statements. |
| (2) | Purchase obligations primarily include merchandise purchase orders and non merchandise obligations. |
Certain reserves and contractual obligations were excluded from the table above due to the uncertainty in timing or amounts of such payments. These include $7.0 million of casualty insurance reserves, and variable interest on our long-term debt. If both interest rates and debt remain constant, we expect interest obligations to be $13.7 million within the next 12 months. A 25 basis points change in interest rates, assuming consistent borrowings, could result in a $0.5 million change in interest obligations annually. A $1.0 million change in debt,
44
Table of Contents
assuming consistent interest rates, could result in a $0.1 million change in interest obligations annually. In the past 12 months, we have experienced a 280 basis points change in interest rate and a $72.0 million change in debt. If we were to experience the same interest fluctuation in the following 12 months, it could potentially change our interest obligations by approximately $5.6 million or approximately 40.8% of the $13.7 million in expected interest obligations.
OFF-BALANCE SHEET ARRANGEMENTS
Other than in connection with executing operating leases and purchase commitments, we do not have any other off-balance sheet financing that has, or is reasonably likely to have, a material current or future effect on our financial condition, cash flows, results of operations, liquidity, capital expenditures or capital resources.
CRITICAL ACCOUNTING POLICIES AND ESTIMATES
In preparing the consolidated financial statements, certain accounting policies require considerable judgment to select the appropriate assumptions to calculate financial estimates. These estimates are complex and subject to an inherent degree of uncertainty. We base our estimates on historical experience, terms of existing contracts, evaluation of trends and other assumptions that we believe to be reasonable under the circumstances. We continually evaluate the information used to make these estimates as our business and the economic environment change. Although the use of estimates is pervasive throughout the consolidated financial statements, we consider an accounting estimate to be critical if:
| • | it requires assumptions to be made about matters that were highly uncertain at the time the estimate is made, and |
| • | changes in the estimate that are reasonably likely to occur from period to period or different estimates that could have been selected would have a material effect on our financial condition, cash flows or results of operations. |
We believe that the current assumptions and other considerations used to estimate amounts reflected in the consolidated financial statements are appropriate. However, if actual experience differs from the assumptions and the considerations used in estimating amounts, the resulting changes could have a material adverse effect on our consolidated results of operations, and in certain situations, could have a material adverse effect on our financial condition.
The following is a summary of our most Critical Accounting Policies and Estimates. See Note 1 “Basis of Presentation” and Note 2 “Summary of Significant Accounting Policies” of Notes to our Consolidated Financial Statements.
Merchandise Inventories
Our inventory is valued at the lower of cost or market, with cost determined primarily using the retail inventory method (“RIM”). RIM is an averaging method that is commonly used in the retail industry. To determine inventory cost under RIM, inventory at its retail selling value is segregated into groupings of merchandise having similar characteristics, which are then converted to a cost basis by applying specific average cost factors for each grouping of merchandise. Cost factors represent the average cost-to-retail ratio for each merchandise group based upon the year’s purchasing activity for each store location. Accordingly, a significant assumption under the retail method is that inventory in each group is similar in terms of its cost-to-retail relationship and has similar turnover rates. We monitor the content of merchandise in these groupings to prevent distortions that would have a material effect on inventory valuation.
Our housewares, hardware, and garden inventories are valued under the RIM using a last-in, first-out (“LIFO”) cost flow assumption. To estimate the effects of changing prices in inventory, we utilize external price indices determined by an outside source, the Bureau of Labor Statistics.
45
Table of Contents
Vendor Rebates and Allowances
We receive various vendor-funded rebates and allowances through a variety of programs and arrangements intended to offset our costs of promoting and selling certain vendor products. These vendor payments are recorded as a reduction to the cost of merchandise inventories when earned and, thereafter, as a reduction of cost of sales, as the merchandise is sold. Up-front consideration received from vendors linked to purchases or other commitments is deferred until performance of the specified activity is deemed to be complete. For fiscal 2011, 2010 and 2009, we earned vendor rebates and allowances of $29.5 million, $30.3 million and $29.2 million, respectively.
Trade Name Asset Impairment
We review indefinite-lived trade name assets for impairment annually or more frequently if events or changes in circumstances indicate that the asset might be impaired, by comparing the carrying amount of the assets to the sum of undiscounted cash flows expected to be generated by the assets. Potential impairment exists if the carrying amount of trade names is greater than their fair value, which is determined using the relief from royalty method. The impairment analysis for trade names is performed as of the last day of the Company’s November accounting period each year. We did not record any intangible trade name asset impairment charges in any period presented in this Form 10-K.
The use of different assumptions, estimates or judgments in our trade name asset impairment testing process, such as the estimated future cash flows of the asset, royalty rates, and the discount rate used to discount such cash flows, could significantly increase or decrease the estimated fair value of the assets, and therefore, impact the related impairment charge. At the 2011 annual impairment test date, the above-noted conclusion that no indication of intangible asset impairment existed at the test date would not have changed had the test been conducted assuming: (1) a 200 basis points increase in the discount rate used to discount the aggregate estimated cash flows of our assets to their net present value in determining their estimated fair values (without any change in the aggregate estimated cash flows of our reporting unit), (2) a 300 basis points decrease in the terminal period growth rate without a change in the discount rate of the reporting unit, or (3) a 40 basis points decrease in the royalty rate applied to the forecasted net sales stream of our assets. If the decline in our net sales continues, this could have a material effect on our trade names valuation and could result in an impairment charge.
Our trade name assets, OSH and Orchard Supply Hardware, are not subject to amortization, as management expects the trade names to generate cash flows indefinitely.
The impairment analysis for trade names is performed as of the last day of our November accounting period each year.
Impairment of Long-Lived Assets
Long-lived assets, primarily property and equipment, are reviewed for impairment whenever events or changes in circumstances indicate that the carrying amount of an asset may not be recoverable. If the carrying value of the asset exceeds the expected future cash flows expected to result from the use of the asset, on an undiscounted basis, an impairment loss is recognized. The impairment loss recognized is the excess of the carrying value of the asset over its fair value. The fair market value of these assets is determined using the income approach, which requires management to make estimates about future cash flows. We estimate the amount and timing of future cash flows based on historical experience and knowledge of the retail market in which each store operates. We do not believe there is a reasonable likelihood that there will be a material change in the estimates or assumptions we use to calculate impairment losses of long-lived assets. The Company recorded $1.1 million, $0.7 million, and $0.2 million of impairment charges in connection with store assets for fiscal years 2011, 2010 and 2009, respectively. The Company recorded impairment charges of $3.5 million in connection with its store asset impairment valuation in fiscal 2011. No impairment for favorable leases was recorded in fiscal 2010 and 2009. However, if actual results are not consistent with our estimates and assumptions used in the calculations, we may be exposed to more losses that could be material.
46
Table of Contents
Lease Accounting
The Company leases certain stores, office facilities, computers, and transportation equipment. The determination of operating and capital lease obligations is based upon the terms of the lease, estimated fair value of the leased assets, estimated useful life of the leased assets, and the contractual minimum lease payments as defined within the lease agreements. The Company may enter into sale-leaseback agreements to sell certain facilities and lease them back consistent with their current operational use. If the lease under a new agreement is determined to be a capital lease, any gain or loss on the sale would be amortized in proportion to the amortization of the leased asset over the life of the lease. If the new lease is an operating lease, any gain would be amortized in proportion to the gross rent charged to expense over the lease term and any loss on the sale of the asset would be recognized immediately.
We also must evaluate sales of our properties which occur in sale-leaseback transactions to determine the proper accounting for the proceeds of such sales either as a sale or a deposit. This evaluation requires certain judgments in determining whether or not clauses in the lease or any related agreements constitute continuing involvement. For those sale-leasebacks that are accounted for as financing transactions, we must estimate our incremental borrowing rate, or another rate in cases where the incremental borrowing rate is not appropriate to utilize, for purposes of determining interest expense and the resulting amortization of the lease financing obligation. Changes in the determination of the incremental borrowing rates or other rates utilized in connection with the accounting for lease financing transactions could have a significant effect on the interest expense and underlying balance of the lease financing obligations.
Casualty Insurance Reserves
We have historically participated in Sears Holdings’ insurance programs, which have provided us with comprehensive insurance coverage. On February 25, 2008, we entered into our own insurance contracts for exposures incurred after that date with third-party insurance companies for a number of risks including workers’ compensation and general liability claims. We record insurance reserves based on the expected ultimate settlement value of claims filed and claims incurred but not yet reported. Our estimated claim amounts are discounted using a risk-free rate based on the duration that approximates the expected period to settle such claims. The discount rate used was 4% in each of fiscal years 2011, 2010 and 2009. A 50 basis point change in the risk-free rate would change our reserve by approximately $0.1 million. In estimating this liability, we utilized loss trend factors based on company-specific data to project the future loss rate. Loss estimates are adjusted based upon actual claims settlements and reported claims. These projections are subject to a high degree of variability based upon future inflation rates, litigation trends, legal interpretations, benefit level changes, and claim settlement patterns.
Although we do not expect the amounts ultimately paid to differ significantly from our estimates, insurance reserves could be affected if future claim experience differs significantly from the historical trends and the actuarial assumptions.
Item 7A.—Quantitative and Qualitative Disclosures About Market Risk
We face market risk exposure in the form of interest rate risk. These market risks arise from our debt obligations. We have no international operations. Our exposure to foreign currency fluctuations is not significant to our financial condition or results of operations.
Interest Rate Risk
All interest-rate derivative instruments are considered non-trading. At January 28, 2012, 76.0% of our total debt portfolio, including capital leases, was variable rate. Based on the size of this variable rate debt portfolio at January 28, 2012, which totaled approximately $199.5 million, an immediate 100 basis points change in interest rates would have affected annual pretax funding costs by $2.0 million. If our credit ratings are further
47
Table of Contents
downgraded, it would increase our financing costs under a portion of our Senior Secured Term Loan from 3% to 4% and increase our annual interest expense by approximately $0.8 million.
We do not enter into derivative financial contracts for trading purposes. Derivative financial instruments embedded in our leases related to Consumer Price Index (“CPI”) are recorded at fair value. At January 28, 2012, the fair value of the derivative financial instruments embedded in our leases was $2.3 million. A 1% increase in CPI will increase interest expense by approximately $0.3 million.
New Accounting Pronouncements—In June 2011, the FASB issued an accounting standards update to revise the manner in which entities present comprehensive income in their financial statements. This new guidance will require entities to present each component of net income along with total net income, each component of other comprehensive income (“OCI”) along with a total for OCI, and a total amount for comprehensive income, either in a single continuous statement of comprehensive income or in two separate but consecutive statements. This accounting standards update is effective for fiscal years, and interim periods within those years, beginning after December 15, 2011. The Company will adopt the provisions of this accounting standards update in the first quarter of fiscal 2012. This amendment will change the manner in which the Company presents comprehensive income in its consolidated financial statements.
In May 2011, the FASB issued guidance to amend the accounting and disclosure requirements on fair value measurements. The new guidance limits the highest-and-best-use measure to nonfinancial assets, permits certain financial assets and liabilities with offsetting positions in market or counterparty credit risks to be measured at a net basis, and provides guidance on the applicability of premiums and discounts. Additionally, the new guidance expands the disclosures on Level 3 inputs by requiring quantitative disclosure of the unobservable inputs and assumptions, as well as description of the valuation processes and the sensitivity of the fair value to changes in unobservable inputs. The new guidance became effective for the Company beginning January 29, 2012. The Company does not anticipate a material impact on its financial statements upon adoption.
48
Table of Contents
REPORT OF INDEPENDENT REGISTERED PUBLIC ACCOUNTING FIRM
To the Board of Directors and Stockholders of
Orchard Supply Hardware Stores Corporation
San Jose, California
We have audited the accompanying consolidated balance sheets of Orchard Supply Hardware Stores Corporation and subsidiaries (the “Company”) as of January 28, 2012 and January 29, 2011, and the related consolidated statements of operations, stockholders’ equity and comprehensive income (loss), and cash flows for each of the three years in the period ended January 28, 2012. These consolidated financial statements are the responsibility of the Company’s management. Our responsibility is to express an opinion on these consolidated financial statements based on our audits.
We conducted our audits in accordance with the standards of the Public Company Accounting Oversight Board (United States). Those standards require that we plan and perform the audit to obtain reasonable assurance about whether the financial statements are free of material misstatement. The Company is not required to have, nor were we engaged to perform, an audit of its internal control over financial reporting. Our audits included consideration of internal control over financial reporting as a basis for designing audit procedures that are appropriate in the circumstances, but not for the purpose of expressing an opinion on the effectiveness of the Company’s internal control over financial reporting. Accordingly, we express no such opinion. An audit also includes examining, on a test basis, evidence supporting the amounts and disclosures in the financial statements, assessing the accounting principles used and significant estimates made by management, as well as evaluating the overall financial statement presentation. We believe that our audits provide a reasonable basis for our opinion.
In our opinion, such consolidated financial statements present fairly, in all material respects, the financial position of Orchard Supply Hardware Stores Corporation and subsidiaries as of January 28, 2012 and January 29, 2011, and the results of their operations and their cash flows for each of the three years in the period ended January 28, 2012, in conformity with accounting principles generally accepted in the United States of America.
As described in Note 1, prior to December 30, 2011, the Company was a subsidiary of Sears Holdings Corporation (“Sears Holdings”). The accompanying consolidated financial statements have been prepared from the separate records maintained by the Company and may not necessarily be indicative of the conditions that would have existed or the results of operations if the Company had been operated as an unaffiliated company. As more fully described in Notes 1 and 11, certain items included in the accompanying consolidated financial statements represent allocations from Sears Holdings applicable to the consolidated group as a whole.
/s/ DELOITTE & TOUCHE LLP
San Francisco, California
April 27, 2012
49
Table of Contents
Item 8.—Financial Statements and Supplemented Data
ORCHARD SUPPLY HARDWARE STORES CORPORATION AND SUBSIDIARIES
CONSOLIDATED BALANCE SHEETS
AS OF JANUARY 28, 2012 AND JANUARY 29, 2011
(In thousands, except shares and per share amounts)
| Fiscal Year | ||||||||
| 2011 | 2010 | |||||||
| ASSETS |
||||||||
| CURRENT ASSETS: |
||||||||
| Cash and cash equivalents |
$ | 8,148 | $ | 15,604 | ||||
| Restricted cash |
556 | 556 | ||||||
| Merchandise inventories |
157,671 | 172,050 | ||||||
| Deferred income taxes |
14,129 | 16,444 | ||||||
| Prepaid expenses and other current assets |
13,228 | 11,253 | ||||||
|
|
|
|
|
|||||
| Total current assets |
193,732 | 215,907 | ||||||
| PROPERTY AND EQUIPMENT, NET |
210,362 | 262,968 | ||||||
| INTANGIBLE ASSETS |
133,916 | 145,451 | ||||||
| DEFERRED FINANCING COSTS AND OTHER LONG-TERM ASSETS |
8,493 | 5,666 | ||||||
|
|
|
|
|
|||||
| TOTAL |
$ | 546,503 | $ | 629,992 | ||||
|
|
|
|
|
|||||
| LIABILITIES AND STOCKHOLDERS’ EQUITY |
||||||||
| CURRENT LIABILITIES |
||||||||
| Merchandise payables |
$ | 54,410 | $ | 55,325 | ||||
| Accrued expenses and other liabilities |
41,633 | 40,116 | ||||||
| Current portion of long-term debt and capital lease obligations |
8,269 | 19,292 | ||||||
| Payable to Sears |
2,875 | 12,458 | ||||||
| Deposits from sale of real property |
21,471 | |||||||
|
|
|
|
|
|||||
| Total current liabilities |
128,658 | 127,191 | ||||||
| LONG-TERM DEBT AND CAPITAL LEASE OBLIGATIONS |
254,152 | 318,928 | ||||||
| OTHER LONG-TERM LIABILITIES |
29,286 | 16,338 | ||||||
| DEFERRED INCOME TAXES |
48,108 | 69,503 | ||||||
| COMMITMENTS AND CONTINGENCIES (Note 12) |
||||||||
|
|
|
|
|
|||||
| Total liabilities |
460,204 | 531,960 | ||||||
|
|
|
|
|
|||||
| STOCKHOLDERS’ EQUITY |
||||||||
| Series A preferred stock ($0.00001 par value; 20,000,000 shares authorized, 4,806,000 shares issued and outstanding at January 28, 2012; 0 shares authorized, issued and outstanding at January 29, 2011) |
16,529 | |||||||
| Class A common stock ($0.01 par value; 15,000,000 shares authorized, 4,806,000 shares issued and outstanding at January 28, 2012; 6,294,000 shares authorized, 6,000,000 shares issued and outstanding at January 29, 2011) |
48 | 60 | ||||||
| Class B common stock ($0.01 par value; 3,000,000 shares authorized, 8,644 shares issued and outstanding at January 28, 2012; 6,294,000 shares authorized, 12,708 shares issued and outstanding at January 29, 2011) |
||||||||
| Class C common stock ($0.01 par value; 3,000,000 shares authorized, 1,194,000 shares issued and outstanding at January 28, 2012; 0 shares authorized, issued and outstanding at January 29, 2011) |
12 | |||||||
| Additional paid-in capital |
248,963 | 262,775 | ||||||
| Accumulated losses |
(179,253 | ) | (164,803 | ) | ||||
|
|
|
|
|
|||||
| Total stockholders’ equity |
86,299 | 98,032 | ||||||
|
|
|
|
|
|||||
| TOTAL |
$ | 546,503 | $ | 629,992 | ||||
|
|
|
|
|
|||||
See notes to consolidated financial statements.
50
Table of Contents
ORCHARD SUPPLY HARDWARE STORES CORPORATION AND SUBSIDIARIES
CONSOLIDATED STATEMENTS OF OPERATIONS
FOR THE FISCAL YEARS ENDED JANUARY 28, 2012, JANUARY 29, 2011 AND JANUARY 30, 2010
(In thousands, except per share amounts)
| Fiscal Year | ||||||||||||
| 2011 | 2010 | 2009 | ||||||||||
| Net sales |
$ | 660,472 | $ | 660,701 | $ | 682,393 | ||||||
|
|
|
|
|
|
|
|||||||
| Cost of sales and expenses: |
||||||||||||
| Cost of sales (excluding depreciation and amortization) |
441,031 | 431,839 | 438,060 | |||||||||
| Selling and administrative |
177,184 | 165,993 | 165,639 | |||||||||
| Depreciation and amortization |
29,390 | 31,187 | 29,870 | |||||||||
| Loss on sale of real property |
14,780 | |||||||||||
|
|
|
|
|
|
|
|||||||
| Total cost of sales and expenses |
662,385 | 629,019 | 633,569 | |||||||||
|
|
|
|
|
|
|
|||||||
| Operating (loss) income |
(1,913 | ) | 31,682 | 48,824 | ||||||||
| Interest expense, net |
23,362 | 17,392 | 16,770 | |||||||||
|
|
|
|
|
|
|
|||||||
| (Loss) income before income taxes |
(25,275 | ) | 14,290 | 32,054 | ||||||||
| Income tax (benefit) expense |
(10,825 | ) | 5,573 | 12,749 | ||||||||
|
|
|
|
|
|
|
|||||||
| Net (loss) income |
$ | (14,450 | ) | $ | 8,717 | $ | 19,305 | |||||
|
|
|
|
|
|
|
|||||||
| (Loss) income per common share attributable to stockholders: |
||||||||||||
| Basic and diluted (loss) income per share |
$ | (2.40 | ) | $ | 1.45 | $ | 3.21 | |||||
|
|
|
|
|
|
|
|||||||
| Basic and diluted weighted average common shares outstanding |
6,010 | 6,013 | 6,013 | |||||||||
|
|
|
|
|
|
|
|||||||
See notes to consolidated financial statements.
51
Table of Contents
ORCHARD SUPPLY HARDWARE STORES CORPORATION AND SUBSIDIARIES
CONSOLIDATED STATEMENTS OF STOCKHOLDERS’ EQUITY AND COMPREHENSIVE INCOME (LOSS)
FOR THE FISCAL YEARS ENDED JANUARY 28, 2012, JANUARY 29, 2011 AND JANUARY 30, 2010
(In thousands, except share amounts)
| Class A Common Stock |
Class B Common Stock |
Class C Common Stock |
Series A Preferred Stock |
Additional Paid-in Capital |
Accumulated Losses |
Total | Comprehensive Income (Loss) |
|||||||||||||||||||||||||||||||||||||||||
| Shares | Amount | Shares | Amount | Shares | Amount | Shares | Amount | |||||||||||||||||||||||||||||||||||||||||
| Balance January 31, 2009 |
6,000,000 | $ | 60 | 12,708 | $ | — | — | $ | — | — | $ | — | $ | 261,951 | $ | (192,825 | ) | $ | 69,186 | |||||||||||||||||||||||||||||
| Stock-based compensation expense |
495 | 495 | ||||||||||||||||||||||||||||||||||||||||||||||
| Net income |
19,305 | 19,305 | $ | 19,305 | ||||||||||||||||||||||||||||||||||||||||||||
|
|
|
|
|
|
|
|
|
|
|
|
|
|
|
|
|
|
|
|
|
|
|
|
|
|||||||||||||||||||||||||
| Balance January 30, 2010 |
6,000,000 | 60 | 12,708 | — | — | — | — | — | 262,446 | (173,520 | ) | 88,986 | ||||||||||||||||||||||||||||||||||||
| Stock-based compensation expense |
329 | 329 | ||||||||||||||||||||||||||||||||||||||||||||||
| Net income |
8,717 | 8,717 | $ | 8,717 | ||||||||||||||||||||||||||||||||||||||||||||
|
|
|
|
|
|
|
|
|
|
|
|
|
|
|
|
|
|
|
|
|
|
|
|
|
|||||||||||||||||||||||||
| Balance January 29, 2011 |
6,000,000 | 60 | 12,708 | — | — | — | — | — | 262,775 | (164,803 | ) | 98,032 | ||||||||||||||||||||||||||||||||||||
| Stock-based compensation expense |
328 | 328 | ||||||||||||||||||||||||||||||||||||||||||||||
| Conversion of Class A common stock to Class C common stock |
(1,194,000 | ) | (12 | ) | 1,194,000 | 12 | ||||||||||||||||||||||||||||||||||||||||||
| Stock repurchase |
(4,064 | ) | (54 | ) | (54 | ) | ||||||||||||||||||||||||||||||||||||||||||
| Issuance of preferred stock |
4,806,000 | 16,529 | (16,529 | ) | — | |||||||||||||||||||||||||||||||||||||||||||
| Transfer of state net-operating loss, net of federal tax expense |
2,443 | 2,443 | ||||||||||||||||||||||||||||||||||||||||||||||
| Net loss |
(14,450 | ) | (14,450 | ) | $ | (14,450 | ) | |||||||||||||||||||||||||||||||||||||||||
|
|
|
|
|
|
|
|
|
|
|
|
|
|
|
|
|
|
|
|
|
|
|
|
|
|||||||||||||||||||||||||
| Balance January 28, 2012 |
4,806,000 | $ | 48 | 8,644 | $ | — | 1,194,000 | $ | 12 | 4,806,000 | $ | 16,529 | $ | 248,963 | $ | (179,253 | ) | $ | 86,299 | |||||||||||||||||||||||||||||
|
|
|
|
|
|
|
|
|
|
|
|
|
|
|
|
|
|
|
|
|
|
|
|||||||||||||||||||||||||||
See notes to consolidated financial statements.
52
Table of Contents
ORCHARD SUPPLY HARDWARE STORES CORPORATION AND SUBSIDIARIES
CONSOLIDATED STATEMENTS OF CASH FLOWS
FOR THE FISCAL YEARS ENDED JANUARY 28, 2012, JANUARY 29, 2011 AND JANUARY 30, 2010
(In thousands)
| Fiscal Year | ||||||||||||
| 2011 | 2010 | 2009 | ||||||||||
| Cash flows from operating activities: |
||||||||||||
| Net (loss) income |
$ | (14,450 | ) | $ | 8,717 | $ | 19,305 | |||||
| Adjustments to reconcile net (loss) income to net cash provided by operating activities: |
||||||||||||
| Depreciation and amortization |
29,390 | 31,187 | 29,870 | |||||||||
| Amortization of deferred financing costs |
2,332 | 1,170 | 1,006 | |||||||||
| Loss on sale of real property and impairment of assets |
18,093 | 633 | 275 | |||||||||
| Stock-based compensation |
328 | 329 | 495 | |||||||||
| Deferred income taxes |
(17,350 | ) | (6,721 | ) | (4,572 | ) | ||||||
| Deferred rent |
2,036 | (1,302 | ) | 529 | ||||||||
| Change in operating assets and liabilities: |
||||||||||||
| Merchandise inventories |
14,379 | (10,785 | ) | (2,682 | ) | |||||||
| Prepaid expenses and other current assets |
(95 | ) | 902 | 713 | ||||||||
| Merchandise payables |
(915 | ) | 19,046 | (14,721 | ) | |||||||
| Payable to Sears |
(9,583 | ) | 7,559 | (1,139 | ) | |||||||
| Accrued expenses and other liabilities |
7,728 | 1,813 | (3,187 | ) | ||||||||
|
|
|
|
|
|
|
|||||||
| Net cash provided by operating activities |
31,893 | 52,548 | 25,892 | |||||||||
|
|
|
|
|
|
|
|||||||
| Cash flows from investing activities: |
||||||||||||
| Restricted cash |
(556 | ) | ||||||||||
| Purchases of property and equipment |
(15,460 | ) | (11,486 | ) | (11,462 | ) | ||||||
| Proceeds from sale of property and equipment |
35,350 | |||||||||||
| Deposits from sale of real property |
21,471 | |||||||||||
|
|
|
|
|
|
|
|||||||
| Net cash provided by (used in) investing activities |
41,361 | (12,042 | ) | (11,462 | ) | |||||||
|
|
|
|
|
|
|
|||||||
| Cash flows from financing activities: |
||||||||||||
| Borrowings on Senior Secured Credit Facility |
58,650 | 48,300 | 7,585 | |||||||||
| Repayments on Senior Secured Credit Facility |
(72,650 | ) | (300 | ) | (7,585 | ) | ||||||
| Principal payments on Real Estate Term Loan |
(22,122 | ) | ||||||||||
| Borrowings from Real Estate Term Loan |
50,000 | |||||||||||
| Principal payments on Commercial Mortgage-backed Loan |
(120,000 | ) | ||||||||||
| Principal payments on Senior Secured Term Loan |
(35,900 | ) | (2,000 | ) | (13,000 | ) | ||||||
| Payment for shares repurchased |
(54 | ) | ||||||||||
| Payment of deferred financing costs |
(3,482 | ) | (4,152 | ) | (1,331 | ) | ||||||
| Payments of capital and financing lease obligations |
(5,152 | ) | (5,711 | ) | (3,917 | ) | ||||||
|
|
|
|
|
|
|
|||||||
| Net cash used in financing activities |
(80,710 | ) | (33,863 | ) | (18,248 | ) | ||||||
|
|
|
|
|
|
|
|||||||
| Net (decrease) increase in cash and cash equivalents |
(7,456 | ) | 6,643 | (3,818 | ) | |||||||
| Cash and cash equivalents at beginning of period |
15,604 | 8,961 | 12,779 | |||||||||
|
|
|
|
|
|
|
|||||||
| Cash and cash equivalents at end of period |
$ | 8,148 | $ | 15,604 | $ | 8,961 | ||||||
|
|
|
|
|
|
|
|||||||
| Supplemental disclosures of cash flows information: |
||||||||||||
| Cash paid for interest |
$ | 20,000 | $ | 16,421 | $ | 15,703 | ||||||
|
|
|
|
|
|
|
|||||||
| Cash paid for income taxes |
$ | 9,293 | $ | 16,651 | $ | 16,984 | ||||||
|
|
|
|
|
|
|
|||||||
| Noncash investing and financing activities: |
||||||||||||
| Noncash property and equipment purchases |
$ | 1,699 | $ | 1,137 | $ | 1,620 | ||||||
|
|
|
|
|
|
|
|||||||
| Assets acquired through capital leases and financing lease obligations |
$ | 6,691 | $ | 3,073 | $ | 6,477 | ||||||
|
|
|
|
|
|
|
|||||||
See notes to consolidated financial statements.
53
Table of Contents
ORCHARD SUPPLY HARDWARE STORES CORPORATION AND SUBSIDIARIES
NOTES TO CONSOLIDATED FINANCIAL STATEMENTS
FOR THE FISCAL YEARS ENDED JANUARY 28, 2012, JANUARY 29, 2011 AND JANUARY 30, 2010
1. BASIS OF PRESENTATION
Orchard Supply Hardware Stores Corporation (the “Company”) is a specialty retailer primarily focused on homeowners with repair, maintenance and improvement needs. The Company was originally founded as a purchasing cooperative in San Jose, California in 1931. As of January 28, 2012, the Company operated 87 full-service home improvement stores in California.
The consolidated financial statements have been prepared from the records of the Company and its subsidiaries, Orchard Supply Hardware LLC and OSH Properties LLC. Unless otherwise specified, all references to the “Company” refer to Orchard Supply Hardware Stores Corporation and subsidiaries. All intercompany amounts and transactions have been eliminated in consolidation.
Spin-Off from Sears Holdings—The distribution by Sears Holdings Corporation (“Sears Holdings”) to its stockholders (“Spin-Off” or “Distribution”) of all the shares of Class A Common Stock of the Company, par value $0.01 per share (the “Class A Common Stock”), and Series A Preferred Stock of the Company, par value $0.00001 per share (the “Preferred Stock”), became effective as of 11:59 p.m., New York City Time on December 30, 2011, which the Company refers to as the “Distribution Date.”
On December 19, 2011, the Company entered into a distribution agreement (the “Distribution Agreement”) with Sears Holdings, which set forth the principal actions to be taken in connection with the Spin-Off. The Distribution Agreement governed certain aspects of the Company’s ongoing relationship with Sears Holdings following the Spin-Off. In accordance with the Distribution Agreement the following occurred prior to the Spin-Off:
| • | A wholly owned subsidiary of the Company merged with and into the Company, and, through that merger, the Company’s Amended and Restated Certificate of Incorporation became effective; |
| • | The Company caused to become effective its Amended and Restated Bylaws; |
| • | An Affiliate of Ares Corporate Opportunities Fund (“ACOF”) exchanged 1,194,000 shares of Class A Common Stock for an equal number of shares of Class C Common Stock; |
| • | The Company filed a Certificate of Designation to create, and subsequently issued to Sears, Roebuck, the Preferred Stock; and |
| • | Sears, Roebuck distributed to Sears Holdings all of the Company’s Class A Common Stock and Preferred Stock that Sears, Roebuck owns. |
All agreements, arrangements, commitments and understandings between the Company and its subsidiaries and other affiliates, on the one hand, and Sears Holdings and its other subsidiaries and other affiliates, on the other hand, terminated effective as of the Spin-Off, except certain agreements and arrangements between the Company and Sears Holdings. See Note 11 for the related-party agreements.
Transition Service Arrangements—Effective with the Spin-Off, the Company entered into a transition service agreement (the “Transition Services Agreement”) whereby Sears Holdings continues to provide to the Company the same services provided prior to the Spin-Off and which enables the Company to retain access to various other third-party services until the Company is able to set up its stand-alone corporate functions and/or contract with third-party service providers. The services provided under the Transition Services Agreement are individually terminable upon 60 days notification by the Company. All services to be provided under the Transition Services Agreement will terminate upon the first anniversary of the effective date of the Transition Services Agreement. In December 2011, the Company has completed its transition of payroll and legal functions from Sears Holdings. The remaining miscellaneous accounting and tax support services are expected to be transitioned in fiscal 2012.
54
Table of Contents
ORCHARD SUPPLY HARDWARE STORES CORPORATION AND SUBSIDIARIES
NOTES TO CONSOLIDATED FINANCIAL STATEMENTS—(Continued)
FOR THE FISCAL YEARS ENDED JANUARY 28, 2012, JANUARY 29, 2011 AND JANUARY 30, 2010
Prior to the Spin-Off, the Company entered into a series of annual shared services agreements (the “Services Agreement”) to provide the Company with certain corporate support services while the Company built its own stand-alone corporate support functions for legal, tax, and certain other corporate support functions. The costs and allocations charged to the Company by Sears Holdings may not necessarily have reflected the costs of obtaining the services from unaffiliated third parties, or if the Company had performed the applicable services itself. The methods by which Sears Holdings allocated its costs were based on a prorated estimate of costs expected to be incurred by Sears Holdings. The consolidated financial statements contained herein may not be indicative of the Company’s consolidated financial position, operating results and cash flows in the future, or what they would have been if it had been a stand-alone company during all periods presented. The Company has not included an estimate of what these costs would have been on a stand-alone basis because it is not practicable to do so. The Company does not expect the allocated expenses for these functions on a stand-alone basis to be materially different than what is reflected in its historical financial statements.
Stock Split—On December 8, 2011, the Company completed a 6-for-1 stock split of its common stock and stock options to purchase common stock. The stock split increased the number of shares of the Company’s common stock issued and outstanding from approximately 1.0 million to approximately 6.0 million. All share and per share amounts herein are presented on a post-stock split basis.
Use of Estimates—The preparation of consolidated financial statements in conformity with accounting principles generally accepted in the United States of America (GAAP) requires management to make estimates, judgments and assumptions that affect the reported amounts of assets and liabilities and disclosure of contingent assets and liabilities at the date of the consolidated financial statements, and reported amounts of net sales and expenses during the reporting period. Actual results may differ from these estimates. Significant estimates are required as part of inventory valuation, reserves for sales returns and allowances, recoverability of long-lived assets, intangible asset valuation, lease accounting, valuation of lease derivatives, and accruals for casualty insurance reserves.
Fiscal Year—The Company’s fiscal year ends on the Saturday nearest to January 31. The fiscal years ended January 28, 2012 (“fiscal 2011”), January 29, 2011 (“fiscal 2010”) and January 30, 2010 (“fiscal 2009”), all consisted of 52 weeks.
Segment Reporting—The Company has one reportable segment. The Company’s operations include activities related to its stores, which are all located in California.
The following table presents the Company’s net sales by product categories for fiscal years 2011, 2010 and 2009 (in millions).
| 2011 | 2010 | 2009 | ||||||||||
| Repair and maintenance |
$ | 330.0 | $ | 328.7 | $ | 349.2 | ||||||
| Lawn and garden |
251.5 | 252.6 | 252.9 | |||||||||
| In-home |
79.0 | 79.4 | 80.3 | |||||||||
|
|
|
|
|
|
|
|||||||
| Total |
$ | 660.5 | $ | 660.7 | $ | 682.4 | ||||||
|
|
|
|
|
|
|
|||||||
55
Table of Contents
ORCHARD SUPPLY HARDWARE STORES CORPORATION AND SUBSIDIARIES
NOTES TO CONSOLIDATED FINANCIAL STATEMENTS—(Continued)
FOR THE FISCAL YEARS ENDED JANUARY 28, 2012, JANUARY 29, 2011 AND JANUARY 30, 2010
2. SUMMARY OF SIGNIFICANT ACCOUNTING POLICIES
Cash and Cash Equivalents—Cash and cash equivalents consist of cash on hand and in banks as well as all highly liquid investments with a maturity date at purchase of three months or less. The Company also includes within cash equivalents deposits in transit from banks for payments related to third-party credit card and debit card transactions. Due to their short-term nature, the carrying value of the Company’s cash and cash equivalents approximate their fair value.
Restricted Cash—As of January 28, 2012 and January 29, 2011, the Company had restricted cash of $0.6 million to pay for maintenance costs related to owned properties. This cash was set up in connection with the Real Estate Term Loan (see Note 5).
Merchandise Inventories—The Company’s inventory is valued at the lower of cost or market, with cost determined primarily using the retail inventory method (“RIM”). RIM is an averaging method that is commonly used in the retail industry. To determine inventory cost under RIM, inventory at its retail selling value is segregated into groupings of merchandise having similar characteristics, which are then converted to a cost basis by applying specific average cost factors for each grouping of merchandise. Cost factors represent the average cost-to-retail ratio for each merchandise group based upon the year’s purchasing activity for each store location. Accordingly, a significant assumption under the retail method is that inventory in each group is similar in terms of its cost-to-retail relationship and has similar turnover rates. The Company monitors the content of merchandise in these groupings to prevent distortions that would have a material effect on inventory valuation.
The Company’s housewares, hardware, and garden inventory are valued under the RIM using a last-in, first-out (“LIFO”) cost flow assumption. To estimate the effects of changing prices in inventory, we utilize external price indices determined by an outside source, the Bureau of Labor Statistics. At January 28, 2012 and January 29, 2011, approximately $47.3 million and $47.3 million, respectively, of the Company’s merchandise inventories were valued under LIFO. If the first-in, first-out method of inventory valuation had been used instead of the LIFO method, merchandise inventories would have been $4.0 million and $1.8 million lower at January 28, 2012 and January 29, 2011, respectively. There were no liquidations of the LIFO layers during the three years reported.
Vendor Rebates and Allowances—The Company receives various vendor-funded rebates and allowances through a variety of programs and arrangements intended to offset the Company’s costs of promoting and selling certain vendor products. These vendor payments are recorded as a reduction to the cost of merchandise inventories when earned and, thereafter, as a reduction of cost of sales, as the merchandise is sold. Up-front consideration received from vendors linked to purchases or other commitments is deferred until performance of the specified activity is deemed to be complete. The Company earned vendor rebates and allowances of $29.5 million, $30.3 million and $29.2 million in fiscal 2011, 2010 and 2009, respectively. Vendor rebates and allowances deferred at January 28, 2012 and January 29, 2011 were $10.9 million and $11.8 million, respectively, and are included as a reduction to merchandise inventories in the consolidated balance sheets.
Assets Available for Sale—Assets that have met the criteria to be classified as held for sale are recorded at fair value within prepaid expenses and other current assets within the consolidated balance sheets. Assets held for sale are recorded at market value based on estimated selling price. The Company had $1.9 million and $0 of assets held for sale at fiscal year end 2011 and 2010, respectively. During fiscal year 2011, the Company recognized a $0.8 million loss in selling and administrative expenses in the consolidated statements of operations as a result of change in market value of assets held for sale.
56
Table of Contents
ORCHARD SUPPLY HARDWARE STORES CORPORATION AND SUBSIDIARIES
NOTES TO CONSOLIDATED FINANCIAL STATEMENTS—(Continued)
FOR THE FISCAL YEARS ENDED JANUARY 28, 2012, JANUARY 29, 2011 AND JANUARY 30, 2010
Property and Equipment—Property and equipment is stated at cost, less accumulated depreciation and amortization. Additions and substantial improvements are capitalized and include expenditures that materially extend the useful lives of existing facilities and equipment. Maintenance and repairs that do not materially improve or extend the lives of the respective assets are expensed as incurred. Certain real properties of the Company, including 10 owned store locations, and four owned buildings, subject to ground lease, are collateral for a portion of the Company’s outstanding debts (see Note 5).
The Company’s property and equipment at January 28, 2012 and January 29, 2011, consist of the following (in millions):
| 2011 | 2010 | |||||||
| Land |
$ | 64.2 | $ | 96.0 | ||||
| Buildings and improvements |
126.3 | 146.1 | ||||||
| Furniture, fixtures and equipment |
79.3 | 74.5 | ||||||
| Construction in progress |
4.4 | 2.3 | ||||||
| Capitalized leases |
66.7 | 67.1 | ||||||
|
|
|
|
|
|||||
| Total property and equipment |
340.9 | 386.0 | ||||||
| Less accumulated depreciation and amortization |
(130.5 | ) | (123.0 | ) | ||||
|
|
|
|
|
|||||
| Total property and equipment, net |
$ | 210.4 | $ | 263.0 | ||||
|
|
|
|
|
|||||
Depreciation and amortization is recorded using the straight-line method over the estimated useful lives of the related assets, which is generally between 3 to 10 years for furniture, fixtures, and equipment, and 15 to 50 years for buildings and improvements. Leasehold improvements are amortized over the shorter of the original lease term or estimated useful life of the improvement, which is between 1 and 21 years. Capital lease assets are amortized over the lesser of the term of the lease or the useful lives of the asset. Accumulated amortization of capitalized lease assets was $24.0 million and $23.9 million at January 28, 2012 and January 29, 2011, respectively.
Long-lived assets are reviewed for impairment whenever events or changes in circumstances indicate that the carrying amount of the asset or asset group may not be recoverable. If the carrying value of the asset or asset group exceeds the expected future cash flows expected to result from the use of the asset, on an undiscounted basis, an impairment loss is recognized. The impairment loss recognized is the excess of the carrying value of the asset or asset group over its fair value. The fair market value of these asset or asset group is determined using the income approach and Level 3 inputs, which require management to make estimates about future cash flows. The Company estimates the amount and timing of future cash flows based on historical experience and knowledge of the retail market in which each store operates. The Company does not believe there is a reasonable likelihood that there will be a material change in the estimates or assumptions the Company used to calculate impairment losses of long-lived assets. The Company recorded $3.5 million, $0.7 million and $0.2 million of asset impairment charges in connection with store assets for fiscal years 2011, 2010 and 2009, respectively. The impairment charges are included in the selling and administrative expenses in the consolidated statements of operations.
Intangible Assets—Intangible assets with “indefinite” useful lives are required to be tested for impairment and intangible assets with “definite” useful lives are amortized over their useful lives. Included in other intangible assets in the consolidated balance sheets are indefinite-lived trade names and definite-lived favorable leasehold rights. The Company’s trade name assets, OSH and Orchard Supply Hardware, are not subject to
57
Table of Contents
ORCHARD SUPPLY HARDWARE STORES CORPORATION AND SUBSIDIARIES
NOTES TO CONSOLIDATED FINANCIAL STATEMENTS—(Continued)
FOR THE FISCAL YEARS ENDED JANUARY 28, 2012, JANUARY 29, 2011 AND JANUARY 30, 2010
amortization, as management expects the trade names to generate cash flows indefinitely. The Company’s trade names are tested for impairment annually or more frequently if events or changes in circumstances indicate that the asset might be impaired. Potential impairment exists if the carrying amount of trade names is greater than their fair value, which is based on the relief from royalty method. The Company performed its test for impairment on trade names by comparing the fair value of the trade names to their carrying amounts. The impairment analysis for trade names is performed as of the last day of the Company’s November accounting period each year. No impairment charges related to trade names were recorded in any period presented.
Other intangible assets as of January 28, 2012 and January 29, 2011, include the following (in millions):
| January 28, 2012 | January 29, 2011 | |||||||||||||||||||||||||||
| Gross Carrying Amount |
Accumulated Amortization |
Impairment Charge |
Net Carrying Amount |
Gross Carrying Amount |
Accumulated Amortization |
Net Carrying Amount |
||||||||||||||||||||||
| Indefinite-lived trade names |
$ | 107.6 | $ | — | $ | — | $ | 107.6 | $ | 107.6 | $ | — | $ | 107.6 | ||||||||||||||
| Favorable leases |
94.9 | (65.9 | ) | (2.7 | ) | 26.3 | 94.9 | (57.0 | ) | 37.9 | ||||||||||||||||||
|
|
|
|
|
|
|
|
|
|
|
|
|
|
|
|||||||||||||||
| Total |
$ | 202.5 | $ | (65.9 | ) | $ | (2.7 | ) | $ | 133.9 | $ | 202.5 | $ | (57.0 | ) | $ | 145.5 | |||||||||||
|
|
|
|
|
|
|
|
|
|
|
|
|
|
|
|||||||||||||||
The Company’s favorable leasehold rights are included in the store asset group for impairment testing purposes described above. The Company recorded favorable lease impairment charges of $2.7 million in fiscal 2011. No impairment for favorable leases was recorded in fiscal 2010 and 2009.
The Company recorded intangible amortization expense of $8.8 million, $8.6 million and $8.8 million in the consolidated statements of operations during fiscal 2011, fiscal 2010 and fiscal 2009, respectively. Intangible amortization expense for the next five fiscal years based on the intangible asset balances as of January 28, 2012, is expected to be $6.0 million, $5.4 million, $4.6 million, $2.8 million, and $2.1 million.
Leases Accounting—The Company leases its distribution center, certain stores, store support center, computers, and transportation equipment. The determination of operating and capital lease obligations is based upon the terms of the lease, estimated fair value of the leased assets, estimated life of the leased assets, and the contractual minimum lease payments as defined within the lease agreements. For certain store leases, amounts in excess of these minimum lease payments are payable based upon specified percentages of sales. Contingent rent is accrued during the period it becomes probable that a particular store will achieve a specified sales level thereby triggering a contingent rental obligation. Certain leases also include escalation clauses and renewal option clauses calling for increased rents. Where a lease contains an escalation clause or concession such as a rent holiday, rent expense is recognized using the straight-line method over the term of the lease.
Lease Financing Obligations—In certain lease arrangements the Company is involved with the construction of the building (generally on land owned by the landlord). If the Company concludes that it has substantively all of the risks of ownership during construction of a leased property and therefore is deemed the owner of the project for accounting purposes, it records an asset and related financing obligation for the amount of total project costs related to construction-in-progress and the pre-existing building. Once construction is complete, the Company considers the requirements for sale-leaseback treatment, including the transfer back of all risks of ownership and whether the Company has any continuing involvement in the leased property. If the arrangement does not qualify for sale-leaseback treatment, the building assets subject to these obligations remain on the Company’s consolidated balance sheet at their historical costs and such assets continue to be depreciated over their remaining useful lives. The proceeds received by the Company from these transactions are recorded as lease financing obligations in other long-term liabilities and the lease payments are applied as payments of
58
Table of Contents
ORCHARD SUPPLY HARDWARE STORES CORPORATION AND SUBSIDIARIES
NOTES TO CONSOLIDATED FINANCIAL STATEMENTS—(Continued)
FOR THE FISCAL YEARS ENDED JANUARY 28, 2012, JANUARY 29, 2011 AND JANUARY 30, 2010
principal and interest. The selection of the interest rate on lease financing obligations is evaluated at inception of the lease based on the Company’s incremental borrowing rate adjusted to the rate required to prevent recognition of a non-cash loss or negative amortization of the obligation through the end of the primary lease term. At January 28, 2012, the Company has recorded $5.3 million in other long term liabilities for lease financing obligations.
Sale-leaseback Accounting—The Company has entered into sale-leaseback agreements to sell certain facilities owned by the Company and leased them back for use consistent with their current operational use. If the lease under a new agreement is determined to be a capital lease, any gain or loss on the sale is amortized in proportion to the amortization of the leased asset over the life of the lease. If the new lease is an operating lease, any gain is amortized in proportion to the gross rent charged to expense over the lease term and any loss on the sale of the asset would be recognized immediately.
The Company evaluates sales of properties which occur in sale-leaseback transactions to determine the proper accounting for the proceeds of such sale transactions either as a sale or a deposit. This evaluation requires certain judgments in determining whether all considerations have been exchanged and whether there is continuing involvement with respect to the property. For transactions that have not yet met the sale criteria, the Company accounts for the proceeds as deposits and offsets rent payments against these deposits. Once all conditions of the sale have been met, the property will be evaluated for sale-leaseback accounting. As of January 28, 2012, the Company had $21.5 million of deposits from sale of real property in the consolidated balance sheet, and no amounts were recorded in fiscal 2010.
Casualty Claim Reserves—The Company has historically participated in Sears Holdings insurance programs, which has provided the Company with comprehensive insurance coverage. On February 25, 2008, the Company entered into its own insurance contracts for exposures incurred after that date with third-party insurance companies for a number of risks including workers’ compensation and general liability claims. The Company records reserves for uninsured claims based on the expected ultimate settlement value of claims filed and claims incurred but not yet reported. The Company’s estimated claim amounts are discounted using a risk-free rate based on the duration that approximates the expected period to settle such claims. The discount rate used was 4% in each of fiscal 2011, 2010 and 2009. In estimating this liability, the Company utilized loss trend factors based on Company-specific data to project the future loss rate. Loss estimates are adjusted based upon actual claims settlements and reported claims. In estimating this liability, the Company utilized loss trend factors based on company-specific data to project the future loss rate. These projections are subject to a high degree of variability based upon future inflation rates, litigation trends, legal interpretations, benefit level changes, and claim settlement patterns. Changes in the Company’s insurance reserves for fiscal 2011, 2010, and 2009 are as follows (in millions):
| 2011 | 2010 | 2009 | ||||||||||
| Self insurance reserves—beginning of period |
$ | 5.9 | $ | 4.7 | $ | 3.0 | ||||||
| Claim expenses |
3.2 | 2.3 | 2.7 | |||||||||
| Claim payments |
(2.1 | ) | (1.1 | ) | (1.0 | ) | ||||||
|
|
|
|
|
|
|
|||||||
| Self insurance reserves—end of period |
$ | 7.0 | $ | 5.9 | $ | 4.7 | ||||||
|
|
|
|
|
|
|
|||||||
| Total undiscounted self insurance reserves—end of period |
$ | 8.1 | $ | 6.8 | $ | 5.4 | ||||||
|
|
|
|
|
|
|
|||||||
The Company’s casualty insurance reserves reflected in other current liabilities and other long-term liabilities in the consolidated balance sheets represent an estimate of the ultimate cost of claims incurred as of the
59
Table of Contents
ORCHARD SUPPLY HARDWARE STORES CORPORATION AND SUBSIDIARIES
NOTES TO CONSOLIDATED FINANCIAL STATEMENTS—(Continued)
FOR THE FISCAL YEARS ENDED JANUARY 28, 2012, JANUARY 29, 2011 AND JANUARY 30, 2010
consolidated balance sheet date. Although the Company does not expect the amounts ultimately paid to differ significantly from its estimates, insurance reserves could be affected if future claim experience differs significantly from the historical trends and the actuarial assumptions.
Derivatives—Derivative financial instruments embedded in leases are recorded at fair value in the consolidated balance sheets as capital lease asset if the lease is a capital lease or as other long-term assets if the lease is an operating lease. The assets are amortized over the life of the lease to depreciation and amortization expense. In addition, they are recorded in other long- term liabilities at fair value and any gain or loss on the derivative financial instruments is recorded in selling and administrative expense in the consolidated statements of operations. At January 28, 2012, the fair value of the derivative financial instruments embedded in its leases was $2.3 million. At January 29, 2011 the Company did not have any derivative financial instruments embedded in its leases.
Revenue Recognition—The Company recognizes revenues from merchandise sales at the later of point of sale or delivery of goods to customers, including merchandise sales commission income and delivery income. Merchandise sales are reported net of estimated returns and allowances, and customer rebates, and exclude sales taxes. The reserve for returns and allowances is calculated as a percentage of sales based on historical return percentages. Net sales are presented net of any taxes collected from customers and remitted to governmental authorities. The Company also records deferred revenue for the sale of gift cards and recognizes this revenue upon the redemption of the gift cards.
Reserve for Sales Returns and Allowances—The Company calculates a reserve for returns and allowances as a percentage of sales based on historical return percentages, which is included in accrued expenses in the consolidated balance sheets. The reserve for sales returns and allowances consists of the following (in millions):
| Year ended: |
Beginning Balance |
Additions | Returns | Ending Balance |
||||||||||||
| January 28, 2012 |
$ | 0.6 | $ | 24.6 | $ | (24.6 | ) | $ | 0.6 | |||||||
| January 29, 2011 |
0.6 | 24.1 | (24.1 | ) | 0.6 | |||||||||||
| January 30, 2010 |
0.7 | 25.0 | (25.1 | ) | 0.6 | |||||||||||
Cost of Sales—Cost of sales includes the merchandise cost as well as, distribution, warehousing, delivery and store occupancy costs, offset by vendor allowances and rebates received by the Company. The Company’s cost of sales exclude depreciation and amortization of leased properties and the distribution center.
Selling and Administrative Expenses—Selling and administrative expenses primarily include selling and support payroll, advertising, and other administrative expenses.
Pre-Opening Costs—Store pre-opening costs are expensed in the period in which they occur.
Advertising—Costs for newspaper, television, radio, and other media advertising are expensed in the period the advertising occurs. The cost of advertising charged to selling and administrative expenses was $21.7 million, $22.9 million and $21.7 million for fiscal 2011, 2010 and 2009, respectively.
Rent Expense—Minimum rental expense is recognized over the term of the lease. The Company recognizes minimum rent starting when possession of the property is taken from the landlord, which normally includes a construction period prior to store opening. When a lease contains a predetermined fixed escalation of the minimum rent, the Company recognizes the related rent expense on a straight-line basis and records the difference between the recognized rental expense and the amounts payable under the lease as a deferred rent liability. The Company also receives tenant allowances, which are amortized as a reduction to rent expense in the consolidated statements of operations over the term of the lease.
60
Table of Contents
ORCHARD SUPPLY HARDWARE STORES CORPORATION AND SUBSIDIARIES
NOTES TO CONSOLIDATED FINANCIAL STATEMENTS—(Continued)
FOR THE FISCAL YEARS ENDED JANUARY 28, 2012, JANUARY 29, 2011 AND JANUARY 30, 2010
Certain leases provide for contingent rents that are not measurable at inception. These contingent rents are primarily based on a percentage of sales that are in excess of a predetermined level. These amounts are excluded from minimum rent and are included in the determination of rent expense when it is probable that the expense has been incurred and the amount is reasonably estimable (see Note 7).
Interest Expense—Interest expense includes interest on our borrowings, amortization of deferred financing costs, commitment fees and other debt related costs, interest on capital leases and other miscellaneous interest incurred.
Deferred Financing Costs—The Company amortizes deferred financing costs using the straight-line method, which approximates the effective interest method, over the life of the associated financing agreements. Amortization of deferred financing costs was $2.3 million, $1.2 million and $1.0 million for fiscal 2011, 2010 and 2009, respectively.
Income Taxes—The Company records deferred income tax assets and liabilities based on the estimated future tax effects of differences between the financial and tax bases of assets and liabilities based on currently enacted tax laws. The tax balances and income tax expense recognized by the Company are based on management’s interpretation of the tax laws of multiple jurisdictions. Income tax expense also reflects the Company’s best estimates and assumptions regarding, among other things, the level of future taxable income, interpretation of the tax laws, and tax planning. Future changes in tax laws, changes in projected levels of taxable income, and tax planning could affect the effective tax rate and tax balances recorded by the Company.
Tax positions are recognized when they are more likely than not to be sustained upon examination. The amount recognized is measured as the largest amount of benefit that is more likely than not of being realized upon settlement. The Company is subject to periodic audits by the Internal Revenue Service and other state and local taxing authorities. These audits may challenge certain of the Company’s tax positions such as the timing and amount of income and deductions and the allocation of taxable income to various tax jurisdictions. The Company evaluates its tax positions and establishes liabilities in accordance with the applicable accounting guidance on uncertainty in income taxes. These tax uncertainties are reviewed as facts and circumstances change and are adjusted accordingly. This requires significant management judgment in estimating final outcomes. Actual results could materially differ from these estimates and could significantly affect the Company’s effective tax rate and cash flows in future years. Interest and penalties are classified as income tax expense in the consolidated statements of operations (see note 10).
Comprehensive Income (Loss)—Comprehensive income (loss) encompasses all changes in equity other than those arising from transactions with stockholders. Comprehensive income (loss) was equal to net income (loss) for all periods presented.
Earnings Per Share (“EPS”)—The Company computes and reports both basic EPS and diluted EPS. Basic EPS is computed by dividing net earnings by the weighted average number of common shares outstanding for the period. Diluted EPS is computed by dividing net earnings by the sum of the weighted average number of common shares and dilutive common stock equivalents outstanding during the period. Diluted EPS reflects the total potential dilution that could occur from outstanding equity plan awards, including unexercised stock options.
There are no dilutive common stock equivalents, and therefore basic and dilutive EPS are the same for all periods presented.
61
Table of Contents
ORCHARD SUPPLY HARDWARE STORES CORPORATION AND SUBSIDIARIES
NOTES TO CONSOLIDATED FINANCIAL STATEMENTS—(Continued)
FOR THE FISCAL YEARS ENDED JANUARY 28, 2012, JANUARY 29, 2011 AND JANUARY 30, 2010
Fair Value of Financial Instruments—Financial Accounting Standards Board (FASB) Accounting Standards Codification (ASC) 820, Fair Value Measurements and Disclosures, (“ASC 820”) defines fair value, establishes a framework for measuring fair value in GAAP and requires certain disclosures about fair value measurements. Under ASC 820, fair value is considered to be the exchange price in an orderly transaction between market participants to sell an asset or transfer a liability at the measurement date. ASC 820 also establishes a fair value hierarchy which requires an entity to maximize the use of observable inputs and minimize the use of unobservable inputs when measuring fair value. The standard describes three levels of inputs that may be used to measure fair value:
Level 1—Quoted prices in active markets for identical assets or liabilities;
Level 2—Inputs other than quoted prices included within Level 1 that are either directly or indirectly observable; and
Level 3—Unobservable inputs that are supported by little or no market activity, therefore requiring an entity to develop its own assumptions about the assumptions that market participants would use in pricing.
Due to their short-term nature, the carrying value of the Company’s cash and cash equivalents, restricted cash, other current assets, merchandise payables, accrued expenses, and other current liabilities approximate their fair value. Included in cash and cash equivalents are money market funds of $3.0 million and $13.7 million at January 28, 2012 and January 29, 2011, respectively, which fair value was determined using Level 1 inputs. The fair value of the Senior Secured Term Loan is $100.7 million and $162.2 million based on the trading value as of January 28, 2012 and January 29, 2011, respectively, which was determined using Level 1 inputs. The carry value of the Senior Secured Term Loan was $137.6 million and $173.5 million as of January 28, 2012 and January 29, 2011, respectively. Based on borrowing rates available to the Company, which are considered Level 2 inputs, the carrying value of the Company’s debt obligations with respect to the Senior Secured Credit Facility and Real Estate Term Loan approximated their fair value at January 28, 2012 and January 29, 2011.
In connection with the Company’s evaluation of long-lived assets for impairment, certain long-lived assets were measured at fair value on a non-recurring basis using Level 3 inputs. In the determination of impairment for operating stores, the Company determined the fair values of individual operating stores using an income approach, which required discounting projected future cash flows. When determining the projected future cash flows associated with an individual operating store, management made assumptions, incorporating local market conditions, about key store variables, including sales growth rates, gross margin and controllable expenses such as store payroll and occupancy expense. In order to calculate the present value of those future cash flows, the Company discounted cash flow estimates at a rate commensurate with the risk used as the cost of its capital. The Company recorded $3.5 million and $0.7 million of asset impairment in connection with store assets for fiscal years 2011 and 2010, respectively. The impairment charges in fiscal 2011 and 2010 reduced the then carrying value to the fair value for the long-lived asset group from $5.6 million to $2.1 million and $0.7 million to $0, respectively.
The Company measures store lease derivatives using Level 3 inputs. Three of our store leases have future rent increases that are tied to an index of annual changes in the Consumer Price Index (“CPI”). The fair value of the derivate is computed using the historical increases in CPI and the value calculated using the maximum rent escalation rate cap as defined by the leases. In the determination of the impairment for assets held for sale, which consists of a real property associated with a relocation, the fair value was determined using a Level 2 quoted market price. The Company determined the estimated selling price by obtaining broker information on the specific property.
The Company was not required to measure any other significant non-financial assets and liabilities at fair value on a non-recurring basis as of January 28, 2012 and January 29, 2011.
62
Table of Contents
ORCHARD SUPPLY HARDWARE STORES CORPORATION AND SUBSIDIARIES
NOTES TO CONSOLIDATED FINANCIAL STATEMENTS—(Continued)
FOR THE FISCAL YEARS ENDED JANUARY 28, 2012, JANUARY 29, 2011 AND JANUARY 30, 2010
Stock-Based Compensation—The Company recognizes as expense the fair value of all stock-based compensation awards, including stock options, and reports tax benefits associated with stock-based compensation deductions as cash from financing activities rather than cash from operating activities. The Company recognizes compensation expense as awards vest on a straight-line basis over the requisite service period of the award. The Company accounts for stock-based compensation using the fair value method. The Company recognized $0.3 million, $0.3 million and $0.5 million of total stock-based compensation expense for fiscal 2011, 2010 and 2009, respectively, in the consolidated statements of operations.
New Accounting Pronouncements—In June 2011, the FASB issued an accounting standards update to revise the manner in which entities present comprehensive income in their financial statements. This new guidance will require entities to present each component of net income along with total net income, each component of other comprehensive income (“OCI”) along with a total for OCI, and a total amount for comprehensive income, either in a single continuous statement of comprehensive income or in two separate but consecutive statements. This accounting standards update is effective for fiscal years, and interim periods within those years, beginning after December 15, 2011. The Company will adopt the provisions of this accounting standards update in the first quarter of fiscal 2012. This amendment will change the manner in which the Company presents comprehensive income in its consolidated financial statements.
In May 2011, the FASB issued guidance to amend the accounting and disclosure requirements on fair value measurements. The new guidance limits the highest-and-best-use measure to nonfinancial assets, permits certain financial assets and liabilities with offsetting positions in market or counterparty credit risks to be measured at a net basis, and provides guidance on the applicability of premiums and discounts. Additionally, the new guidance expands the disclosures on Level 3 inputs by requiring quantitative disclosure of the unobservable inputs and assumptions, as well as description of the valuation processes and the sensitivity of the fair value to changes in unobservable inputs. The new guidance became effective for the Company beginning January 29, 2012. The Company does not anticipate a material impact on its financial statements upon adoption.
3. SALE-LEASEBACK TRANSACTIONS AND LEASE FINANCING OBLIGATIONS
In the third quarter of fiscal 2011, the Company sold for $21.3 million, all of its interest in its distribution center located in Tracy, California and entered into a leaseback agreement with respect to the sale. The commencement date of the lease was October 28, 2011. The lease is a 20-year lease and provides for three five-year extension options. The initial base rent under the lease is $1.7 million per year with 10% increases every five years.
In the fourth quarter of fiscal 2011, the Company sold all of its interest in four store properties located in Hollywood, Pismo Beach, and San Jose, California and entered into leaseback agreements with respect to all four stores. The term of the Hollywood lease is from December 12, 2011 to June 30, 2014 and may be terminated earlier on January 1, 2014, upon six months notice by the Company. The lease may also terminate upon two months notice from the landlord at any time except during February through June of each year. The term of the Pismo Beach store lease is 16 years, and the two stores in San Jose are 18 years, beginning on December 20, 2011 and include renewal option periods. The Company expects to continue to operate the facilities consistent with their existing use throughout their lease terms, with the exception of the Hollywood store, where we seek to relocate. The Company expects to pay $3.2 million of additional rent annually with respect to the four leases.
The Company evaluates sales of properties which occur in sale-leaseback transactions to determine the proper accounting for the proceeds of such sales transaction either as a sale or a deposit. This evaluation requires certain judgments in determining whether all considerations have been exchanged and whether there is
63
Table of Contents
ORCHARD SUPPLY HARDWARE STORES CORPORATION AND SUBSIDIARIES
NOTES TO CONSOLIDATED FINANCIAL STATEMENTS—(Continued)
FOR THE FISCAL YEARS ENDED JANUARY 28, 2012, JANUARY 29, 2011 AND JANUARY 30, 2010
continuing involvement with respect to the property. For transactions that have not yet met the sale criteria, the Company accounts for the proceeds as deposits and offsets rent payments against the deposit. Once all conditions of the sale have been met, the property will be evaluated for sale-leaseback accounting.
The aggregate gross purchase price received from these five properties, net of fees, was approximately $56.5 million. In connection with the transactions, the Company repaid $21.6 million of the Real Estate Secured Term Loan and removed the properties from the loan collateral. For accounting purposes, the sale of the distribution center and the Hollywood store were consummated and the Company recorded a $14.8 million loss on the transaction in fiscal 2011.
The leaseback agreements of the remaining three stores include provisions for the remodeling of the stores for which the landlord will reimburse the Company for the costs of Tenant Improvements (“TI”) up to an agreed upon amount. Due to the Company’s continuing involvement during the remodeling period, as the leases provide for the Company to assume substantially all of the construction period risk, the sale-leaseback will not be consummated until the TI’s are complete, and amounts spent are fully reimbursed to the Company by the landlord. Accordingly the sales of the three stores did not qualify for a sale-leaseback accounting treatment. The carrying value of these properties of approximately $25.4 million remained on our consolidated balance sheet at January 28, 2012 and no sales were recognized. Instead, the net cash received from the sale of these properties of $21.5 million was recorded as a deposit from real property in the consolidated balance sheet. The Company recorded an impairment charge of $1.0 million related to the sale of these properties in the consolidated statement of operations for the fiscal year ended 2011. Upon completion of the TI’s, within the defined terms of the agreement, and when the sales transactions are determined to be consummated, the Company expects to account for these transactions as a sale-leaseback. Failure to complete the agreed upon improvements could allow the landlord to require us to repurchase the property and improvements in accordance with the repurchase terms specified in the lease.
In certain lease arrangements the Company is involved with the construction of the building (generally on land owned by the landlord). If the Company concludes that it has substantively all of the risks of ownership during construction of a leased property and therefore is deemed the owner of the project for accounting purposes, it records an asset and related financing obligation for the amount of total project costs related to construction-in-progress and the pre-existing building. Once construction is complete, the Company considers the requirements for sale-leaseback treatment, including the transfer back of all risks of ownership and whether the Company has any continuing involvement in the leased property. If the arrangement does not qualify for sale-leaseback treatment, the building assets subject to these obligations remain on the Company’s consolidated balance sheet at their historical costs and such assets continue to be depreciated over their remaining useful lives. The proceeds received by the Company from these transactions are recorded as lease financing obligations and are included in other long-term liabilities in the consolidated balance sheet, and the lease payments are applied against these lease financing obligations as payments of principal and interest. The selection of the interest rate on the lease financing obligations is evaluated at inception of the lease based on the Company’s incremental borrowing rate adjusted to the rate required to prevent recognition of a non-cash loss or negative amortization of the obligation through the end of the primary lease term. Two of the Company’s stores are being accounted for under this method. Payments under these leases are applied as payments of imputed interest and deemed principal on the underlying financing obligations.
64
Table of Contents
ORCHARD SUPPLY HARDWARE STORES CORPORATION AND SUBSIDIARIES
NOTES TO CONSOLIDATED FINANCIAL STATEMENTS—(Continued)
FOR THE FISCAL YEARS ENDED JANUARY 28, 2012, JANUARY 29, 2011 AND JANUARY 30, 2010
At January 28, 2012, future payments required on lease financing obligations were as follows (in millions):
| Fiscal Year |
Financing Obligation |
|||
| 2012 |
$ | 1.1 | ||
| 2013 |
1.1 | |||
| 2014 |
1.1 | |||
| 2015 |
1.2 | |||
| 2016 |
1.2 | |||
| Thereafter |
10.9 | |||
|
|
|
|||
| Total minimum payments |
$ | 16.6 | ||
| Less: imputed interest |
(11.3 | ) | ||
|
|
|
|||
| Total lease financing obligations |
$ | 5.3 | ||
|
|
|
|||
4. ACCRUED EXPENSES AND OTHER LIABILITIES
Accrued expenses and other liabilities at January 28, 2012 and January 29, 2011, consist of the following (in millions):
| 2011 | 2010 | |||||||
| Accrued expenses |
$ | 12.3 | $ | 10.6 | ||||
| Sales and other taxes |
10.4 | 11.6 | ||||||
| Non-merchandise payable |
7.2 | 2.9 | ||||||
| Payroll and related items |
8.5 | 6.8 | ||||||
| Self insurance reserves |
2.4 | 1.8 | ||||||
| Income tax payable |
0.8 | 0.8 | ||||||
| Legal judgment (Note 12) |
5.6 | |||||||
|
|
|
|
|
|||||
| Total |
$ | 41.6 | $ | 40.1 | ||||
|
|
|
|
|
|||||
5. DEBT AND CAPITAL LEASE OBLIGATIONS
The components of the Company’s debt and capital lease obligations as of January 28, 2012 and January 29, 2011 are as follows (in millions):
| 2011 | 2010 | |||||||
| Senior Secured Credit Facility |
$ | 34.0 | $ | 48.0 | ||||
| Real Estate Term Loan |
27.9 | 50.0 | ||||||
| Senior Secured Term Loan |
137.6 | 173.5 | ||||||
| Capital lease obligations |
62.9 | 66.7 | ||||||
|
|
|
|
|
|||||
| Total debt and capital lease obligations |
262.4 | 338.2 | ||||||
| Less portion to be paid within one year: |
||||||||
| Senior Secured Credit Facility |
— | (11.0 | ) | |||||
| Real Estate Term Loan |
(0.5 | ) | (0.5 | ) | ||||
| Senior Secured Term Loan |
(1.8 | ) | (2.0 | ) | ||||
| Capital lease obligations |
(5.9 | ) | (5.8 | ) | ||||
|
|
|
|
|
|||||
| Total long-term debt and capital lease obligations |
$ | 254.2 | $ | 318.9 | ||||
|
|
|
|
|
|||||
65
Table of Contents
ORCHARD SUPPLY HARDWARE STORES CORPORATION AND SUBSIDIARIES
NOTES TO CONSOLIDATED FINANCIAL STATEMENTS—(Continued)
FOR THE FISCAL YEARS ENDED JANUARY 28, 2012, JANUARY 29, 2011 AND JANUARY 30, 2010
As of January 28, 2012, debt maturities (excluding capitalized lease obligations) for the next four years are as follows (in millions):
| Fiscal Years |
Amounts | |||
| 2012 |
$ | 2.3 | ||
| 2013 |
120.8 | |||
| 2014 |
0.8 | |||
| 2015 |
75.6 | |||
|
|
|
|||
| Total |
$ | 199.5 | ||
|
|
|
|||
Senior Secured Credit Facility—On December 21, 2006, the Company entered into an Amended and Restated Senior Secured Credit Agreement (the “Replaced Revolving Facility”) with a syndicate of lenders. The Replaced Revolving Facility provided revolving availability of up to $130 million (subject to borrowing base limits) for a period of five years, maturing on December 21, 2011. On January 29, 2010, the Company amended, restated and extended the Replaced Revolving Facility (such replacement facility, the “Senior Secured Credit Facility”) and reduced the revolving availability down to $120.0 million (subject to borrowing base limits). The amendment and restatement split the facility into a $20.0 million tranche maturing December 21, 2011 with lenders who elected not to extend and a $100.0 million tranche maturing on the earlier to occur of 90 days prior to the maturity of the Senior Secured Term Loan and December 21, 2013 with lenders who elected to extend. As of January 28, 2012, $34.0 million was outstanding under the facility. The Company drew funds from extending lenders to repay $5.3 million due to non-extending lenders in December 2011. The Senior Secured Credit Facility was amended again in December 2011 in connection with amending and restating the Senior Secured Term Loan.
Borrowings under the Senior Secured Credit Facility are either base rate (“BR”) loans or Eurodollar loans, at our discretion. BR loans owing to each extending lender bear interest at the greatest of (a) the prime rate as publicly announced by Wells Fargo Bank, N.A., (b) the federal funds rate plus 0.5%, or (c) the one month London Inter-Bank Offered Rate (“LIBOR”) plus 1.0%, plus the “BR extended term applicable rate” which ranges between 1.50% and 2.25%. Eurodollar loans owing to each extending lender bear interest at LIBOR, plus the “Eurodollar extended term applicable rate” which ranges between 2.50% and 3.25%. At January 28, 2012, the Company’s interest rate was 3.54%. The interest rate spreads applicable to the Company’s borrowings fluctuate based upon its performance as measured by its leverage ratio. In addition, the Company is required to pay unused commitment fees based on our leverage ratio.
The Senior Secured Credit Facility provides the Company with the ability to obtain letters of credit. As of January 28, 2012 and January 29, 2011, there were $7.8 million and $7.3 million of outstanding letters of credit, respectively.
Borrowings under the Senior Secured Credit Facility are subject to a borrowing base consisting of the sum of (i) 90% of eligible credit card accounts receivable plus (ii) 80% of other eligible accounts receivable plus (iii) the lesser of (x) 70% of eligible inventory (valued at the lower of cost, on a first in first out basis, or market value) or (y) 85% of the appraised net ordinary liquidation value of eligible inventory. The Company must deliver borrowing base certificates and reports at least monthly. The borrowing base also may be subject to certain other adjustments and reserves to be determined by the agent. As of January 28, 2012, there was $58.1 million available to borrow under the Senior Secured Credit Facility.
The Senior Secured Credit Facility also requires the Company to comply with a fixed charge coverage ratio that is triggered when availability under the Senior Secured Credit Facility reaches a minimum threshold of 10%
66
Table of Contents
ORCHARD SUPPLY HARDWARE STORES CORPORATION AND SUBSIDIARIES
NOTES TO CONSOLIDATED FINANCIAL STATEMENTS—(Continued)
FOR THE FISCAL YEARS ENDED JANUARY 28, 2012, JANUARY 29, 2011 AND JANUARY 30, 2010
of the total availability for three consecutive days. The fixed charge coverage ratio requires the Company to maintain a minimum ratio of 1.1 to 1.0 EBITDAR (EBITDA plus rent expense) to certain fixed charges. The fixed charge coverage ratio covenant was not triggered during fiscal 2011, 2010, and 2009.
Real Estate Secured Term Loan—In October 2010, the Company entered into a $50.0 million real estate secured loan (the “Real Estate Secured Term Loan”) with a group of lenders, of which $27.9 million is outstanding as of January 28, 2012, and matures on the earlier to occur of (i) 90 days prior to the maturity of the Senior Secured Term Loan or (ii) December 21, 2013. The Real Estate Secured Term Loan requires the Company to meet the leverage covenant set forth in its Senior Secured Term Loan, subject to certain maximum thresholds (as described below). On December 19, 2011, the Company entered into the first amendment to the Real Estate Secured Term Loan, which lowered the minimum principal amount required under the Real Estate Secured Term Loan and allowed it to conduct certain sale-leaseback transactions, described in note 3. On the closing date, the Company was required to place $0.6 million in a deferred maintenance account for future maintenance on the collateral properties, which the Company classified as restricted cash on the consolidated balance sheet.
The Real Estate Secured Term Loan requires the Company, as the tenant or subtenant at each of the properties, to comply with a maximum adjusted leverage ratio covenant. The maximum adjusted leverage ratio is calculated in the same manner, and subject to the same ratios as those established in the Senior Secured Term Loan described above. The Company was in compliance with these covenants during fiscal 2011 and fiscal 2010.
Interest on the Real Estate Secured Term Loan is based on LIBOR plus 5.75% per annum. At January 28, 2012 the Company’s interest rate was 6.045%. In addition, we are required to make quarterly principal payments of $0.1 million. In connection with the Real Estate Secured Term Loan, we entered into an interest rate cap agreement, which establishes a maximum interest rate on the Real Estate Secured Term Loan for LIBOR at 4% with a $25.0 million notional amount.
The Real Estate Secured Term Loan is currently secured by a first lien mortgage on 14 properties, which includes 10 owned properties and 4 owned buildings subject to ground leases. The Real Estate Secured Term Loan is subject to a prepayment premium (which lapses in April, 2012) and breakage costs in the event the Company elects to repay all or a portion of the loan early. The Company has the option of prepaying a portion of the Real Estate Secured Term Loan and releasing individual properties by prepaying 125% of the allocated loan amount for such property.
Senior Secured Term Loan—On December 21, 2006, the Company entered into a $200 million senior secured term loan agreement (the “Replaced Term Facility”). On December 22, 2011, the Company amended, restated and extended the Replaced Term Facility (the replacement facility, the “Senior Secured Term Loan”). The amendment and restatement split the facility into two tranches. The first tranche was for $59.5 million with lenders who elected not to extend the maturity beyond December 21, 2013, of which $59.5 million was outstanding as of January 28, 2012. The second tranche was for $78.1 million with lenders who elected to extend the maturity date to December 21, 2015, of which $78.1 million was outstanding as of January 28, 2012. The first and second tranches each require quarterly principal payments of $0.2 million.
Borrowings under the Senior Secured Term Loan are either alternate base rate (“ABR”) loans or Eurodollar loans, at the Company’s discretion. ABR loans owing to non-extending lenders bear interest at the greater of (a) the prime rate as publicly announced by JPMorgan Chase Bank, and (b) the federal funds rate, plus 0.5% (the “Base Rate”), plus the “ABR applicable rate” which ranges between 3.50% and 3.75% for non-extended loans. ABR loans owing to extending lenders bear interest at the ABR (which shall be deemed to be equal to at least
67
Table of Contents
ORCHARD SUPPLY HARDWARE STORES CORPORATION AND SUBSIDIARIES
NOTES TO CONSOLIDATED FINANCIAL STATEMENTS—(Continued)
FOR THE FISCAL YEARS ENDED JANUARY 28, 2012, JANUARY 29, 2011 AND JANUARY 30, 2010
2.25%) plus 4.75%. At January 28, 2012 the Company’s interest rate for non-extending loans was 5.06%. Eurodollar loans owing to non-extending lenders bear interest at LIBOR, plus the “Eurodollar applicable rate” which ranges between 4.50% and 4.75%. Eurodollar loans owing to extending lenders bear interest at LIBOR (which shall be deemed to be equal to at least 1.25%), plus 5.75%. At January 28, 2012 the Company’s interest rate for extended loans was 7.00%. In addition, the Company’s extended loans bear a pay-in-kind (“PIK”) interest due at the end of the term at a rate equal to 3.00% or 4.00% per annum, depending on our ratings, with such interest automatically increasing the principal amount of the extended term loans on an annual basis. At January 28, 2012 the Company’s PIK interest rate was 3.00% based on its credit rating. The Company’s credit rating has not changed since June 2011.
In addition to the quarterly principal payments, the Company is required to make annual repayments on the Senior Secured Term Loan equal to a defined percentage rate (determined based on the Company’s leverage ratio and ratings) of excess cash flows, which ranges between 25% and 100%. The Company did not make any prepayments pursuant to this requirement in fiscal 2011 or fiscal 2010 and does not anticipate making any prepayments under this requirement in fiscal 2012. The Senior Secured Term Loan also requires the Company to make certain mandatory repayments in connection with the transfer of or damage to property securing the loan, in connection with certain dispositions of property owned by the Company, or in the event of the incurrence of certain types of debt.
Capital expenditures (as defined in the Senior Secured Term Loan) cannot exceed $22.5 million, $25.0 million, $27.5 million and $30.0 million in fiscal years 2012, 2013, 2014 and 2015, respectively.
The Senior Secured Term Loan also requires the Company to comply with a maximum adjusted leverage ratio covenant. The maximum adjusted leverage ratio covenant (as defined in the Senior Secured Term Loan) is calculated on the last day of each fiscal quarter as (a) consolidated total funded debt on such date minus unrestricted cash over $3.0 million (as defined in the Senior Secured Term Loan) to (b) trailing four fiscal quarters adjusted EBITDA (as defined in the Senior Secured Term Loan). The following table provides the maximum leverage ratio during the remaining term of the Senior Secured Term Loan.
| Fiscal Year |
Quarter 1 | Quarter 2 | Quarter 3 | Quarter 4 | ||||||||||||
| 2011 |
6.00:1 | |||||||||||||||
| 2012 |
6.00:1 | 5.75:1 | 5.75:1 | 5.75:1 | ||||||||||||
| 2013 |
5.75:1 | 5.25:1 | 5.25:1 | 5.25:1 | ||||||||||||
| 2014 |
5.25:1 | 5.00:1 | 5.00:1 | 5.00:1 | ||||||||||||
| 2015 |
5 00:1 | 4 75:1 | 4 75:1 | |||||||||||||
As of January 28, 2012, the Company was in compliance with the maximum leverage ratio covenant, which, at January 28, 2012 was 4.87:1.
Restrictions—The Senior Secured Credit Facility, Senior Secured Term Loan and Real Estate Secured Term Loan each place various restrictions on the Company, the guarantors of the loans and certain of their respective subsidiaries, including, but not limited to, limitations on their ability to incur or guarantee additional debt, pay dividends, make distributions, repurchase the Company’s capital stock, sell assets, or make investments (including extending credit to others), enter into sale-leaseback transactions, incur liens, enter into transactions with affiliates, enter into swap agreements, make payments with respect to certain types of debt, enter into agreements that limit the ability of a subsidiary to pay dividends or distributions or make or repay loans or advances or to transfer assets to the Company or guarantee debt of the Company, enter into agreements that limit
68
Table of Contents
ORCHARD SUPPLY HARDWARE STORES CORPORATION AND SUBSIDIARIES
NOTES TO CONSOLIDATED FINANCIAL STATEMENTS—(Continued)
FOR THE FISCAL YEARS ENDED JANUARY 28, 2012, JANUARY 29, 2011 AND JANUARY 30, 2010
the ability to incur liens on the properties of the Company and the guarantors, amend certain material documents, make changes to accounting treatment and reporting practices, change the fiscal year, and use proceeds of credit extensions to purchase or carry margin stock.
Change in Control—The Senior Secured Credit Facility, Senior Secured Term Loan and Real Estate Secured Term Loan each contain an event of default resulting from a change of control, which includes the following: (i) certain mergers, consolidations, sales or transfers of all or substantially all of the assets of the Company and subsidiaries to persons other than ACOF, ESL Investments, Inc. (“ESL”) and Sears Holdings; (ii) adoption of a plan of liquidation of the Company; (iii) prior to an initial underwritten public offering of common stock of the Company, Sears Holdings, ESL and ACOF ceasing to collectively hold directly or indirectly at least 50% of the total voting power of all shares of the Company’s voting capital stock; (iv) following an initial underwritten public offering of common stock of the Company, a person or group, other than Sears Holdings, ESL and ACOF, collectively holding directly or indirectly at least 40% of the total voting power of all shares of the Company’s voting capital stock and Sears Holdings, ESL and ACOF collectively holding less than such person or group; and (v) the Company’s Board of Directors not consisting of continuing Directors (“Change in Control”).
If one or both of ESL and ACOF dispose of all or part of their shareholding in the Company such that their combined total voting power drops below 50% (or 40% after an initual underwritten public offering), this may trigger a Change in Control event of default under the Senior Secured Credit Facility, Senior Secured Term Loan and Real Estate Secured Term Loan. An event of default could trigger certain acceleration clauses and cause those and the Company’s other obligations to become immediately due and payable and the Company may not have sufficient cash funds available to repay its debt obligations upon such a Change in Control.
6. LIQUIDITY
As of January 28, 2012, the Company had cash and cash equivalents of $8.1 million. The Company’s liquidity is dependent upon its cash balance and the continued availability of borrowings under its current financing arrangements. The Company believes that its existing cash and cash equivalents, cash flows from operating activities, and available borrowings under its financing arrangements will be sufficient to fund its operations including working capital, general corporate needs, planned capital expenditures, and principal and interest payments for at least the next 12 months. In addition, as of January 28, 2012, the Company was in compliance with the leverage ratio covenant under its financing arrangements, and management believes that the Company will continue to be in compliance with this covenant (and other covenants under its financing arrangements) for at least the next 12 months. Any significant decline in the Company’s expected operating results may adversely impact its prospective compliance with the financial covenants.
However, the decline in the Company’s operating results in fiscal 2011, coupled with continued economic weakness in the markets in which the Company operates, may adversely impact its prospective compliance with the financial covenants under the Company’s financial arrangements. In fiscal 2011, the Company entered into five sale-leaseback transactions with respect to our distribution center located in Tracy, California and four stores located in California which generated $56.5 million in net proceeds. The Company used the proceeds to pay down $21.6 million of its Real Estate Term Loan and $34.4 million of its Senior Secured Term Loan. Although these actions were not necessary for the Company to remain in compliance with its financial covenants as of January 28, 2012, they reduced the Company’s leverage.
69
Table of Contents
ORCHARD SUPPLY HARDWARE STORES CORPORATION AND SUBSIDIARIES
NOTES TO CONSOLIDATED FINANCIAL STATEMENTS—(Continued)
FOR THE FISCAL YEARS ENDED JANUARY 28, 2012, JANUARY 29, 2011 AND JANUARY 30, 2010
The Company seeks to remain in compliance with its financing arrangements and generate sufficient liquidity by executing its sales growth strategy by, among other things, making improvements to its stores and store operations and upgrading and differentiating its product assortment. However, the adequacy of the Company’s available funds will depend on many factors, including the macroeconomic environment, the operating performance of our stores, and continued compliance with the covenants under its financing arrangements. Notwithstanding our expectations, if there is a significant decline in our expected operating results, we may be unable to meet our financial covenants, and lenders could demand repayment of the amounts outstanding under our financing agreements. Accordingly, there can be no assurance that our sources of liquidity will be sufficient to fund our needs.
As such, a priority for the near term will be to focus on maintaining continued compliance with the leverage covenant under the Company’s financing arrangements, which means the Company remains focused on generating sufficient cash and managing expenditures (through, for example, the delay or reduction of new store openings and store remodels, a reduction in payroll and benefit costs, deferring certain maintenance and other expenditures). The Company will also continue to examine a number of alternatives with respect to future financial covenant compliance and liquidity, including raising additional capital through permitted asset sales and/or sale-leaseback transactions or equity financing transactions. In addition, if necessary or advisable, the Company may seek to renegotiate its financing arrangements in order to remain in compliance while continuing to follow the current business plan, which includes plans for store expansion. There are no assurances that under such circumstances the Company’s financing arrangements could be renegotiated, or that alternative financing would be available on terms acceptable to the Company, if at all. In addition, any refinancing could be at higher interest rates and may require the Company to comply with more onerous covenants which could further restrict business operations. In such case, if such renegotiations were necessary but unsuccessful, the Company would expect to modify its business plan in a manner that would allow it to remain in compliance. Such a modification could result in slower growth, a delay of new store openings and the potential for a decline in sales.
If the Company were unsuccessful in meeting its financial or other covenants in its financing arrangements, it would result in a default which could trigger acceleration of (or the right to accelerate) the related debt. Because of cross-default provisions in the agreements and instruments governing our indebtedness, a default under one agreement or instrument could result in a default under, and the acceleration of, the Company’s other indebtedness. In addition, the Company’s lenders would be entitled to proceed against the collateral securing the indebtedness. If any of the Company’s indebtedness were to be accelerated, it could adversely affect the Company’s ability to operate its business or the Company may be unable to repay such debt and, therefore, such acceleration could adversely affect the Company’s results of operations and financial condition.
7. LEASES
Operating lease rental expense was $34.2 million, $30.3 million and $30.2 million during fiscal 2011, 2010 and 2009, respectively, which included contingent rentals of approximately $0.6 million, $0.3 million and $0.1 million, respectively.
Lease payments with respect to sale-leaseback agreements that have not met the criteria for sale-leaseback accounting reduces deposits received for the sale.
70
Table of Contents
ORCHARD SUPPLY HARDWARE STORES CORPORATION AND SUBSIDIARIES
NOTES TO CONSOLIDATED FINANCIAL STATEMENTS—(Continued)
FOR THE FISCAL YEARS ENDED JANUARY 28, 2012, JANUARY 29, 2011 AND JANUARY 30, 2010
Minimum lease obligations for capital leases, operating leases, and deposits received on sale-leaseback transactions, excluding taxes, insurance, and other expenses payable directly by the Company, for non-cancelable leases in effect as of January 28, 2012, are as follows (in millions):
| Fiscal Year |
Capital Leases | Operating Leases | Payments against Deposits from Real Property |
|||||||||
| 2012 |
$ | 12.5 | $ | 30.1 | $ | 2.9 | ||||||
| 2013 |
12.8 | 30.6 | 2.9 | |||||||||
| 2014 |
12.6 | 27.8 | 3.0 | |||||||||
| 2015 |
12.3 | 23.7 | 3.0 | |||||||||
| 2016 |
11.9 | 20.6 | 3.0 | |||||||||
| Thereafter |
68.7 | 119.9 | 40.3 | |||||||||
|
|
|
|
|
|
|
|||||||
| Total minimum payments |
130.8 | $ | 252.7 | $ | 55.1 | |||||||
|
|
|
|
|
|||||||||
| Less: imputed interest |
(67.9 | ) | ||||||||||
|
|
|
|||||||||||
| Present value of minimum lease payments |
62.9 | |||||||||||
| Less current portion of capital lease obligations |
(5.9 | ) | ||||||||||
|
|
|
|||||||||||
| Long-term capital lease obligations |
$ | 57.0 | ||||||||||
|
|
|
|||||||||||
8. STOCKHOLDERS’ EQUITY
In November 2005, the Company completed a series of recapitalization transactions (the “Recapitalization”), whereby, an affiliate of Ares Management LLC (“Ares”) invested $58.7 million in cash in exchange for 19.9% of the Company’s outstanding voting stock and a three-year option to acquire additional shares in the Company (the “Ares Option”). In January 2008, the Ares Option was amended to allow the Company to create and issue to Sears, Roebuck shares of nonconvertible and nonvoting preferred stock in the event the option expires without exercise. During fiscal 2007, the Company recorded a $16.5 million increase to additional paid in capital and a corresponding decrease from retained earnings to reflect the fair value of the contingent forward to issue the Preferred Stock. On November 23, 2008, the Ares Option was not exercised and expired. As a result, in December 2011, the Company created and issued 4,806,000 shares of Preferred Stock by recording an increase in Series A Preferred Stock and a corresponding decrease in retained earnings.
Pursuant to the Spin-Off ACOF, exchanged 1,194,000 shares of Class A Common Stock for an equal number of shares of Class C Common Stock. The following is a summary of our common and preferred stock:
| At January 28, 2012 | ||||||||||||||||
| Shares | Par Value | |||||||||||||||
| Authorized | Issued | Outstanding | ||||||||||||||
| Common Stock |
||||||||||||||||
| Class A |
15,000,000 | 4,806,000 | 4,806,000 | $ | 0.01 | |||||||||||
| Class B |
3,000,000 | 8,644 | 8,644 | $ | 0.01 | |||||||||||
| Class C |
3,000,000 | 1,194,000 | 1,194,000 | $ | 0.01 | |||||||||||
| Preferred Stock |
||||||||||||||||
| Series A |
20,000,000 | 4,806,000 | 4,806,000 | $ | 0.00001 | |||||||||||
71
Table of Contents
ORCHARD SUPPLY HARDWARE STORES CORPORATION AND SUBSIDIARIES
NOTES TO CONSOLIDATED FINANCIAL STATEMENTS—(Continued)
FOR THE FISCAL YEARS ENDED JANUARY 28, 2012, JANUARY 29, 2011 AND JANUARY 30, 2010
Common Stock
Voting Rights—Subject to the discussions below with respect to the election of Directors, holders of Class A Common Stock are entitled to one vote per share, holders of Class B Common Stock are entitled to one-tenth of one vote per share and holders of Class C Common Stock are entitled to one vote per share. All actions submitted to a vote of shareholders are voted on by holders of the Common Stock voting together as a separate class with any one or more classes or series of capital stock of the Company entitled to vote thereon, except for the election of Directors, certain amendments to the terms of the Preferred Stock and as otherwise required by law. Our Amended and Restated Certificate of Incorporation does not provide for cumulative voting.
Conversion—The Class A Common Stock has no conversion features. The Class B Common Stock may be converted into Class A Common Stock on the basis of one share of Class A Common Stock for each share of Class B Common Stock only upon the approval of the Company’s Board of Directors and subsequent approval of the Company’s shareholders voting together as a single class although there currently is no proposal to do so. The Class C Common Stock may be converted into Class A Common Stock on the basis of one share of Class A Common Stock for each share of Class C Common Stock upon the approval of the Company’s Board of Directors and subsequent approval of (i) the Company’s shareholders voting as a separate class and (ii) the holders of a majority of the voting power of the Class C Common Stock voting as a separate class, although there currently is no proposal to do so. In addition, shares of Class C Common Stock are automatically converted on the basis of one share of Class A Common Stock for each share of Class C Common Stock upon the occurrence of (i) a transfer of such shares of Class C Common Stock to any person or entity other than to certain permitted transferees of ACOF or (ii) ACOF owning a number of shares of Class B Common Stock and Class C Common Stock representing in the aggregate a percentage of the Company’s outstanding common stock that is less than 5%.
Dividends—The Certificate of Designation of the Preferred Stock (“Certificate of Designation”) provides that dividends and other distributions may not be paid on all or substantially all of the shares of the Company’s capital stock until all outstanding shares of the Preferred Stock have been redeemed in accordance with the terms of the Certificate of Designation or otherwise repurchased unless such dividend or distribution (i) has been unanimously approved by the Company’s Board of Directors, (ii) relates to a “poison pill” stockholder rights plan or (iii) is a distribution of cash in lieu of fractional shares made in connection with this Spin-Off. After all outstanding shares of the Preferred Stock have been repurchased or redeemed in accordance with the terms of the Certificate of Designation, dividends and other distributions may be declared and paid on the Common Stock as and when determined by the Company’s Board of Directors and subject to any preferential dividend or other rights of any then outstanding preferred stock. Without the affirmative vote of the holders of a majority of the outstanding Class A Common Stock, voting as a separate class, Class B Common Stock, voting as a separate class and Class C Common Stock, voting as a separate class, the Company may not declare or pay any dividends or other distributions with respect to any class of Common Stock unless (i) at the same time the Company makes ratable, equal and substantially identical dividend or distribution with respect to each outstanding share of Common Stock, regardless of class or (ii) such dividend or distribution is pursuant to a “poison pill” stockholder rights plan. The Company does not expect to pay dividends on any shares of the Company’s capital stock for the foreseeable future as our current debt precludes dividends.
Redemption—The Certificate of Designation provides that no shares of the Company’s capital stock, other than the Company’s Preferred Stock, may be redeemed, repurchased or otherwise acquired until all outstanding shares of the Preferred Stock have been redeemed in accordance with the terms of the Certificate of Designation or otherwise repurchased unless such redemption or repurchase (i) is made in connection with an employee incentive or benefit plan or other compensatory arrangement, (ii) has been unanimously approved by the
72
Table of Contents
ORCHARD SUPPLY HARDWARE STORES CORPORATION AND SUBSIDIARIES
NOTES TO CONSOLIDATED FINANCIAL STATEMENTS—(Continued)
FOR THE FISCAL YEARS ENDED JANUARY 28, 2012, JANUARY 29, 2011 AND JANUARY 30, 2010
Company’s Board of Directors, (iii) relates to a “poison pill” stockholder rights plan or (iv) is a distribution of cash in lieu of fractional shares made in connection with the Spin-Off.
Liquidation—Upon the dissolution or liquidation of the Company, whether voluntary or involuntary, holders of Common Stock will be entitled to share ratably, and receive equal and substantially identical distributions of, all assets of the Company available for distribution to its stockholders, subject to any preferential or other rights of any then outstanding preferred stock, including the Preferred Stock.
Preemption—Other than as set forth in the Stockholders’ Agreement (see note 11 below), no holders of the Company’s capital stock will have preemptive rights or preferential rights to subscribe for shares of the Company’s capital stock pursuant to the Company’s Amended and Restated Certificate of Incorporation and Amended and Restated Bylaws.
Preferred Stock
The Company’s Amended and Restated Certificate of Incorporation authorized the Company’s Board of Directors to designate and issue from time to time one or more series of preferred stock without shareholder approval. The Company’s Board of Directors may fix and determine the preferences, limitations and relative rights of each series of preferred stock. There are no present plans to issue any shares of preferred stock other than the Preferred Stock that was distributed in the Spin-Off.
Voting Rights—Preferred Stock are nonvoting.
Conversion—The Preferred Stock is not convertible into shares of Common Stock or any other security of Orchard.
Dividends—The terms of the Preferred Stock do not entitle the holders thereof to any dividends.
Redemption—All, but not less than all, of the then-outstanding shares of Preferred Stock may be redeemed at a redemption price per share of Preferred Stock in cash equal to the Preferred Stock Per Share Liquidation Preference upon a date and time, or the happening of an event, determined by the affirmative vote of a majority of the Company’s Board of Directors and, (i) for so long as ACOF, together with its affiliates and permitted transferees, holds shares of Class B Common Stock and Class C Common Stock representing at least 15% of the Company’s total common stock outstanding (calculated without reference to any shares of the Company’s capital stock issued after the Spin-Off), such vote must include the vote of at least Class B/C Director and, (ii) for so long as ESL holds more shares of the Company’s common stock than ACOF, such vote must include at least one non-management Class A Director designated by the majority vote of the Class A Directors.
Liquidation—In the event of any liquidation, dissolution or winding up of the Company, whether voluntary or involuntary, before any payment or distribution of the Company’s assets (whether capital or surplus) shall be made to or set apart for the holders of Common Stock, but after any payments or distributions are made on, or set apart for, any of the Company’s indebtedness and to holders of any stock then outstanding that ranks senior to the Preferred Stock, holders of the Preferred Stock shall be entitled to receive an amount per share equal to the Preferred Stock Per Share Liquidation Preference but shall not be entitled to any further payment or other participation in any distribution of the assets of Orchard.
Preemption—No holders of the Company’s capital stock will have preemptive rights or preferential rights to subscribe for shares of the Company’s preferred stock pursuant to the Company’s Amended and Restated Certificate of Incorporation and Amended and Restated Bylaws.
73
Table of Contents
ORCHARD SUPPLY HARDWARE STORES CORPORATION AND SUBSIDIARIES
NOTES TO CONSOLIDATED FINANCIAL STATEMENTS—(Continued)
FOR THE FISCAL YEARS ENDED JANUARY 28, 2012, JANUARY 29, 2011 AND JANUARY 30, 2010
Blank Check Preferred Stock—The Company’s Amended and Restated Certificate of Incorporation permits the Company to issue, without any further vote or action by the shareholders, up to 20,000,000 shares of preferred stock (or 15,194,000 shares of preferred stock after taking into account the 4,806,000 shares of Preferred Stock that was issued in connection with the Spin-Off) in one or more series and, with respect to each such series, to fix the number of shares constituting the series and the designation, powers, preferences and rights, and any qualifications, limitations or restrictions thereof, of the shares of such series.
9. STOCK-BASED COMPENSATION
Stock Incentive Plan—The Board of Directors originally adopted the Orchard Stock Incentive Plan (the “2005 Plan”) during fiscal 2005. The 2005 Plan provided for grant options, restricted stock, performance awards, or any combination of the foregoing (the “Awards”) to selected nonemployee Directors, officers, consultants, and employees of the Company. The aggregate number of shares of the Company’s common stock that could have been issued under the 2005 Plan for Awards was 282,720 shares.
In May 2010, the Board of Directors approved the 2010 Stock Incentive Plan (the “2010 Plan”). The 2010 Plan provides for grants of stock awards, incentive stock options, nonqualified stock options, restricted stock, performance awards, or any combination of the forgoing (the “Awards”) to selected nonemployee Directors, officers, consultants, and employees of the Company. The aggregate number of shares of the Company’s common stock which may be issued under the 2010 Plan for Awards is 668,082 shares.
In May 2010, the Company canceled the 2005 Plan and all outstanding Awards thereunder in connection with its adoption of the 2010 Plan and issued new option grants under the 2010 Plan in consideration for the cancellation of the Awards previously issued under the 2005 Plan.
Recipients of stock options are eligible to purchase the Company’s common stock at exercise prices that may not be less than 100% of the fair market value of such stock on the date of grant, except in the case of grants of an incentive stock option to a recipient that possesses more than 10% of the voting power of the Company’s common stock, in which case, the exercise price may not be less than 110% of the fair market value of such stock on the date of grant. The maximum term of options granted under the 2010 Plan is 10 years, except in the case of the grant of an incentive stock option to a recipient who possesses more than 10% of the voting power of the Company’s common stock, where the maximum term is five years. The Company may grant options that are exercisable immediately regardless of the vesting status of the option.
No grants were made in fiscal 2011 or 2009. The following table presents the weighted average assumptions used in the option pricing model for the stock options granted in fiscal 2010 under the 2010 plan:
| 2010 | ||||
| Expected dividend rate |
0.0 | % | ||
| Volatility |
75.0 | % | ||
| Risk-free interest rate |
2.4 | % | ||
| Expected life (in years) |
6.25 | |||
The Company recorded $0.3 million, $0.3 million, and $0.5 million in stock-based compensation expense for fiscal 2011, 2010 and 2009, respectively, which is included in selling and administrative expenses in the consolidated statements of operations. As of January 28, 2012, the unrecognized stock-based compensation balance related to non-vested awards was $0.6 million and is expected to be recognized over the next three years.
74
Table of Contents
ORCHARD SUPPLY HARDWARE STORES CORPORATION AND SUBSIDIARIES
NOTES TO CONSOLIDATED FINANCIAL STATEMENTS—(Continued)
FOR THE FISCAL YEARS ENDED JANUARY 28, 2012, JANUARY 29, 2011 AND JANUARY 30, 2010
A summary of the information about stock options outstanding at January 28, 2012 is as follows:
| Exercise Price |
Number Outstanding |
Weighted Average Remaining Contractual Life (in years) |
Weighted Average Exercise Price |
|||||||||
| $16.67 |
69,012 | 8.5 | $ | 16.67 | ||||||||
| $33.33 |
68,958 | 8.5 | $ | 33.33 | ||||||||
| $50.00 |
68,958 | 8.5 | $ | 50.00 | ||||||||
|
|
|
|||||||||||
| $33.33 |
206,928 | 8.5 | $ | 33.33 | ||||||||
|
|
|
|||||||||||
As of January 28, 2012, 206,928 nonqualified stock options were issued and outstanding under the 2010 Plan. These options generally vest and become exercisable in equal annual installments over a four-year period, and have a term of 10 years. At January 28, 2012, 461,154 shares were available for grant under the 2010 Plan.
| Shares | Weighted Average Exercise Price |
Remaining Contractual Life (in years) |
Weighted Average Grant Date Fair Value |
Aggregate Intrinsic Value (in millions) |
||||||||||||||||
| Balance at January 29, 2011 |
319,170 | $ | 33.33 | 9.44 | $ | 2.6 | ||||||||||||||
| Forfeited/expired during fiscal 2011 |
(112,242 | ) | $ | 33.33 | 9.07 | |||||||||||||||
|
|
|
|||||||||||||||||||
| Balance at January 28, 2012 |
206,928 | $ | 33.33 | 8.50 | $ | 0.1 | ||||||||||||||
|
|
|
|||||||||||||||||||
| Options vested and exercisable, January 28, 2012 |
47,850 | $ | 33.33 | 8.32 | $ | 47.06 | $ | 0.01 | ||||||||||||
| Options vested and expected to vest, January 28, 2012 |
116,034 | $ | 33.33 | 8.50 | $ | 7.84 | $ | 0.05 | ||||||||||||
2011 Equity Incentive Plan—In December 2011 the Company’s Board of Directors and stockholders approved the adoption of the 2011 Equity Incentive Plan (the “2011 Plan”) and forms of Restricted Stock Agreement and Time-Based Option Agreement for use under the 2011 Plan. The 2011 Plan provides for the issuance of a maximum of one million shares of our Class A Common Stock in connection with the grant of stock options, stock appreciation rights, restricted stock awards, restricted stock units, stock bonus awards, dividend equivalents, performance compensation awards (including cash bonus awards) or any combination of the foregoing. No participant may be granted awards of options and stock appreciation rights with respect to more than 250,000 shares of our Class A Common Stock in any one year. No more than 250,000 shares of our Class A Common Stock may be granted under our 2011 Plan to any participant during any single year with respect to performance compensation awards in any one performance period. The 2011 Plan has a term of ten years and no further awards may be granted under the 2011 Plan after the expiration of the term. No awards were granted in fiscal 2011 under the 2011 plan.
10. INCOME TAXES
Prior to the Recapitalization in 2005, the Company’s operating results were included in the federal and state consolidated income tax returns of Sears Holdings. Thereafter, the Company has filed its own federal consolidated tax returns separate from Sears Holdings. For California franchise tax purposes, the Company continued to be a member of the Sears Holdings combined filing group (the “Combined Group”) until the Spin-Off. For the one month period following the Spin-Off and fiscal years thereafter, the Company will file its own
75
Table of Contents
ORCHARD SUPPLY HARDWARE STORES CORPORATION AND SUBSIDIARIES
NOTES TO CONSOLIDATED FINANCIAL STATEMENTS—(Continued)
FOR THE FISCAL YEARS ENDED JANUARY 28, 2012, JANUARY 29, 2011 AND JANUARY 30, 2010
California franchise tax return. Prior to the Spin-Off, the Company was allocated a share of the Combined Group annual state tax liability, which was based on stand-alone California taxable income and adjusted for any tax credits.
As part of the Recapitalization, the Company entered into a tax-sharing agreement (the “Tax Agreement”) with Sears, which governs the rights and obligations of the parties with respect to tax matters for periods in which the Company is or was a member of any Sears consolidated or combined income tax return group. Under the Tax Agreement, Sears is responsible for any federal or state income tax liability relating to tax periods ending on or before the Recapitalization. For all periods after the Recapitalization and prior to the Spin-Off, the Company is responsible for any federal or state tax liability, regardless of whether the Company was required to file as part of the Combined Group. Current income taxes payable for any federal or state income tax returns is reported in the period incurred. As of January 28, 2012 and January 29, 2011, $2.4 million and $4.3 million, respectively, of state income tax payables are recorded in Payable to Sears in the consolidated balance sheets.
The provision for income tax (benefit) expense for fiscal 2011, 2010 and 2009, consists of the following (in millions):
| 2011 | 2010 | 2009 | ||||||||||
| Current: |
||||||||||||
| Federal |
$ | 4.9 | $ | 9.5 | $ | 13.0 | ||||||
| State |
1.6 | 2.8 | 3.9 | |||||||||
|
|
|
|
|
|
|
|||||||
| Total |
6.5 | 12.3 | 16.9 | |||||||||
|
|
|
|
|
|
|
|||||||
| Deferred: |
||||||||||||
| Federal |
(13.0 | ) | (5.2 | ) | (3.3 | ) | ||||||
| State |
(4.3 | ) | (1.5 | ) | (0.9 | ) | ||||||
|
|
|
|
|
|
|
|||||||
| Total |
(17.3 | ) | (6.7 | ) | (4.2 | ) | ||||||
|
|
|
|
|
|
|
|||||||
| Income tax (benefit) expense |
$ | (10.8 | ) | $ | 5.6 | $ | 12.7 | |||||
|
|
|
|
|
|
|
|||||||
The provision for income taxes for financial reporting purposes is different from the tax provision computed by applying the statutory federal income tax rate. Differences for fiscal 2011, 2010 and 2009 are as follows:
| 2011 | 2010 | 2009 | ||||||||||
| Federal tax rate |
35.0 | % | 35.0 | % | 35.0 | % | ||||||
| State income tax (net of federal benefit) |
5.5 | 7.5 | 6.6 | |||||||||
| Tax credits |
0.5 | (1.8 | ) | (0.3 | ) | |||||||
| Other |
1.9 | (1.7 | ) | (1.5 | ) | |||||||
|
|
|
|
|
|
|
|||||||
| Effective tax rate |
42.9 | % | 39.0 | % | 39.8 | % | ||||||
|
|
|
|
|
|
|
|||||||
76
Table of Contents
ORCHARD SUPPLY HARDWARE STORES CORPORATION AND SUBSIDIARIES
NOTES TO CONSOLIDATED FINANCIAL STATEMENTS—(Continued)
FOR THE FISCAL YEARS ENDED JANUARY 28, 2012, JANUARY 29, 2011 AND JANUARY 30, 2010
The major components of deferred tax assets and liabilities as of January 28, 2012 and January 29, 2011 are as follows (in millions):
| 2012 | 2011 | |||||||
| Deferred tax assets: |
||||||||
| Inventory |
$ | 3.1 | $ | 5.8 | ||||
| State income taxes |
2.8 | 5.2 | ||||||
| Capital leases |
10.2 | 10.3 | ||||||
| Employee compensation |
0.1 | |||||||
| Rent equalization |
3.7 | 2.9 | ||||||
| Insurance reserves |
3.1 | 2.6 | ||||||
| California net operating loss transferred to the Company |
4.6 | |||||||
| Other |
5.3 | 6.5 | ||||||
|
|
|
|
|
|||||
| Total deferred tax assets |
32.8 | 33.4 | ||||||
|
|
|
|
|
|||||
| Deferred tax liabilities: |
||||||||
| Property and equipment |
(4.7 | ) | (22.7 | ) | ||||
| Favorable leasehold rights |
(13.3 | ) | (16.6 | ) | ||||
| Intangibles |
(47.2 | ) | (47.2 | ) | ||||
| Federal benefit of state net operating loss |
(1.6 | ) | ||||||
|
|
|
|
|
|||||
| Total deferred tax liabilities |
(66.8 | ) | (86.5 | ) | ||||
|
|
|
|
|
|||||
| Total deferred income taxes, net |
$ | (34.0 | ) | $ | (53.1 | ) | ||
|
|
|
|
|
|||||
Management believes that the Company will generate sufficient taxable income in future periods to fully realize deferred tax assets. Accordingly, no valuation reserve has been provided. During fiscal 2011, the California net operating loss was transferred to the Company as part of the Spin-Off, and the Company recorded a $2.4 million, net of federal tax expense, as an increase to additional paid in capital in fiscal 2011. The California net operating loss will begin expiring after the year 2031.
The activity related to the Company’s unrecognized tax benefits is as follows (in millions):
| Total Unrecognized Tax Benefits |
||||
| Balance at January 31, 2009 |
$ | 1.3 | ||
| Increase in tax positions |
0.4 | |||
|
|
|
|||
| Balance at January 30, 2010 |
1.7 | |||
| Changes in tax positions |
— | |||
|
|
|
|||
| Balance at January 29, 2011 |
1.7 | |||
| Reduction in tax positions |
(1.7 | ) | ||
|
|
|
|||
| Balance at January 28, 2012 |
$ | — | ||
|
|
|
|||
There were no interest and penalties recognized in the consolidated statements of operations in fiscal 2011 and 2010, and $0.4 million for fiscal 2009. As of January 28, 2012 and January 29, 2011, the total amount of interest recognized in the consolidated balance sheet was $0 and $0.1 million, respectively. The unrecognized tax benefits included various federal issues dealing with the timing of when the Company should claim a deduction or recognize a component of income. The reduction in tax positions in fiscal 2011 represents the Company’s
77
Table of Contents
ORCHARD SUPPLY HARDWARE STORES CORPORATION AND SUBSIDIARIES
NOTES TO CONSOLIDATED FINANCIAL STATEMENTS—(Continued)
FOR THE FISCAL YEARS ENDED JANUARY 28, 2012, JANUARY 29, 2011 AND JANUARY 30, 2010
anticipation to change of accounting method within its fiscal 2011 federal income tax return. The Company’s open tax years are fiscal 2008 through fiscal 2011 for federal and fiscal 2003 through fiscal 2011 for state income tax returns.
11. RELATED-PARTY AGREEMENTS
The Company purchases Sears’ brands such as Craftsman, Kenmore, Easy Living, and Weatherbeater directly from Sears Holdings and outside vendors. Purchases of these exclusive brands for fiscal 2011, fiscal 2010 and fiscal 2009 are as follows (in millions):
| 2011 | 2010 | 2009 | ||||||||||
| Craftsman |
$ | 11.6 | $ | 14.4 | $ | 11.7 | ||||||
| Kenmore |
8.3 | 7.7 | 10.0 | |||||||||
| Easy Living |
1.7 | 1.6 | 2.5 | |||||||||
| Weatherbeater |
1.2 | 1.0 | 1.3 | |||||||||
|
|
|
|
|
|
|
|||||||
| Total |
$ | 22.8 | $ | 24.7 | $ | 25.5 | ||||||
|
|
|
|
|
|
|
|||||||
For fiscal 2011, 2010, and 2009 the Company purchased approximately $11.1 million, $12.2 million, and $6.1 million respectively of merchandise directly from Sears Holdings.
Concurrent with the Recapitalization, the Company and Sears Holdings entered into various agreements, including an appliance sales agreement (the “Appliance Sales Agreement”) and a brand sales agreement (the “Brand Sales Agreement”) (collectively, the “Agreements”). These agreements between the Company and Sears Holdings, effective November 23, 2005, are as follows:
Appliance Sales Agreement—In 2005, the Company entered into an Appliances Sales Agreement with Sears Holdings that granted the Company the right to purchase from Sears Holdings and to sell certain major branded appliances, including major Kenmore-branded appliances (the “Products”). The Company was permitted to sell the Products at currently identified retail locations and if approved by Sears Holdings, at additional retail locations (the “Appliance Stores”). The price paid by the Company for Products purchased from Sears Holdings equals Sears Holdings’ cost for such Products. In addition, the Company was required to pay a monthly monitoring fee per Appliance Store to Sears Holdings, which is approximately $0.1 million per year.
In accordance with Sears Holdings’ policy, the Company was entitled to receive from Sears Holdings an allocation of vendor subsidies earned from the purchase of appliances made on behalf of the Company. These vendor subsidies were based on contractual relationships established between Sears Holdings and the vendor and were applicable only to purchases made by Sears Holdings. For fiscal 2011, 2010 and 2009, the Company recognized approximately $0.5 million, $0.5 million and $0.6 million, respectively, in vendor subsidies.
The Appliance Sales Agreement from 2005 was terminated on October 26, 2011, when the Company entered into a new appliances agreement (the “Appliances Agreement”) with a subsidiary of Sears Holdings pursuant to which Sears Holdings has authorized the Company to sell the Products and related protection agreements on a consignment basis as a distributor through its designated retail locations on a commissions basis. Commissions for Products varies by Product category and Sears Holdings may in its sole discretion modify from time to time the commission rate for each category of Product as defined in the agreement. The products include specified categories of Kenmore, Bosch, Electrolux, GE, LG, Samsung and Whirlpool branded appliances. The agreement generally incorporates arm’s length terms and conditions, including market-based pricing and term of duration.
78
Table of Contents
ORCHARD SUPPLY HARDWARE STORES CORPORATION AND SUBSIDIARIES
NOTES TO CONSOLIDATED FINANCIAL STATEMENTS—(Continued)
FOR THE FISCAL YEARS ENDED JANUARY 28, 2012, JANUARY 29, 2011 AND JANUARY 30, 2010
Under the Appliances Agreement, the Company transferred to Sears Holdings its entire inventory of major appliances purchased from Sears Holdings for $1.9 million in cash on October 27, 2011, which approximated the Company’s cost of the purchased appliances.
The Appliances Agreement was amended on March 22, 2012. Under the Appliances Agreement, as amended, the Company may close up to 14 Appliance Stores at specified times through August 2013 and close the remaining 13 Appliance Stores on January 31, 2015. Subject to the immediately preceding sentence, the Appliances Agreement has a term of five years. On April 10, 2012, the Company exercised its right to close 5 Appliance Stores. The Company may terminate the Appliances Agreement if Sears Holdings fails to comply with any of its material obligations in the Appliances Agreement and the failure remains uncured for 30 days or more following notice. Sears Holdings may terminate the Appliances Agreement early for its convenience by delivering six months’ prior written notice to the Company after the first anniversary of the effective date of the Appliances Agreement or if (a) with respect to a Sears Holdings’ fiscal quarter, the Company sales of Products during the fiscal quarter are not at least 70% of the Company sales of Products during the same fiscal quarter in the prior year or (b) the Company fails to comply with any of its material obligations in the Agreement and the failure remains uncured for 30 days or more following notice. The Appliances Agreement provides that during the term of the Appliances Agreement, the Company will not be able to operate in California other businesses that sell merchandise similar to the Products. The Appliances Agreement also provides that for two years following the end of the term, the Company will not be able to operate a business that competes with Sears Holdings Businesses at, or within ten miles of, its retail locations that sold Products at any time during the term.
Brand Sales Agreement—In 2005, Sears Holdings granted the Company the right to purchase from Sears Holdings and its approved vendors, as well as to sell certain additional products, which include products marketed under Sears Holdings’ exclusive brands, such as Craftsman, Easy Living and Weatherbeater (the “Additional Products”). The price paid by the Company for the Additional Products purchased from Sears Holdings equals Sears Holdings’ cost for such Products. The agreement from 2005 was terminated on the Distribution Date, when the Company entered into new brands license agreements (the “Brands Agreements”) with a subsidiary of Sears Holdings pursuant to which Sears Holdings allowed the Company to purchase a limited assortment of Craftsman products, Easy Living and Weatherbeater paints, Kenmore-branded water heaters and consumer household products directly from vendors. Under the Brands Agreements, the Company pays specified license fees to Sears Holdings. The Brands Agreements generally incorporates arm’s length terms and conditions, including market-based pricing and term of duration. Each of the Brands Agreements has a three-year term and may be extended subject to the mutual agreement of the parties. If the aggregate of the Company’s Craftsman product sales over any 12-month period falls by more than 25% below the preceding 12-month period following the second anniversary of the Distribution, Sears Holdings will be permitted to terminate that Brands Agreement in its sole discretion with 60 days’ notice.
License fees for fiscal 2011, 2010 and 2009, was approximately $1.1 million, $1.2 million and $0.4 million, respectively.
Allocated Costs—In fiscal 2011, fiscal 2010 and fiscal 2009, the Company participated in various benefit programs of Sears Holdings and utilized Sears Holdings’ shared service organization for certain corporate support functions, including finance, legal, human resources, information technology, and other shared services. Costs allocated to the Company for shared services by Sears Holdings were $0.6 million, $0.5 million, and $0.4 million for fiscal 2011, 2010 and 2009, respectively. These cost allocations may not necessarily be indicative of the costs that the Company would have incurred had it operated as an unaffiliated company, and are determined as follows:
Benefits—Qualifying Company employees are eligible to become participants in the Sears Holdings 401(k) savings plan (the “401(k)”). Under the terms of the 401(k), employees may make contributions to the plan
79
Table of Contents
ORCHARD SUPPLY HARDWARE STORES CORPORATION AND SUBSIDIARIES
NOTES TO CONSOLIDATED FINANCIAL STATEMENTS—(Continued)
FOR THE FISCAL YEARS ENDED JANUARY 28, 2012, JANUARY 29, 2011 AND JANUARY 30, 2010
up to maximum limits allowable under the Internal Revenue Code. In accordance with the 401(k), the Company may elect to match in cash all or a portion of employees’ contributions under a predetermined formula. There were no matching contributions in fiscal 2011, fiscal 2010 or fiscal 2009. The Company is currently under its own 401(k) plan.
Transaction and Transition Services—Sears Holdings provides the Company with certain shared services including corporate administrative and support services in accordance with a Services Agreement and Transition Services Agreement.
The Company has a payable to Sears of $2.9 million and $12.5 million, as of January 28, 2012 and January 29, 2011, respectively. This includes amounts for goods and services described above and state income tax, described in note 10.
Stockholders’ Agreement—On November 23, 2005, the Company entered into a stockholders’ agreement with Sears, Roebuck and ACOF that was amended and restated as of January 8, 2008 (the “Prior Stockholders’ Agreement”). Pursuant to the terms of the Prior Stockholders’ Agreement, certain Company preferred stock was issuable to Sears, Roebuck. The Company, Sears, Roebuck and ACOF agreed that this preferred stock be issued to Sears, Roebuck in the form of the Series A Preferred Stock, and that Sears Holdings thereafter distribute such Preferred Stock to its shareholders in the Spin-Off. The Prior Stockholders’ Agreement also provided for certain transfer restrictions, governance provisions, registration rights and other matters.
In connection with the Spin-Off, the Company, ESL Investments, Inc. and related entities (“ESL”), Edward S. Lampert, William C. Crowley and ACOF I LLC (“ACOF”) amended and restated the Prior Stockholders’ Agreement (as amended and restated, the “Stockholders’ Agreement”), and Sears, Roebuck ceased to be a party to the Stockholders’ Agreement. The Prior Stockholders’ Agreement terminated and was superseded by the provisions of the Stockholders’ Agreement. The Stockholders’ Agreement was effective immediately following the Spin-Off and provides certain rights and obligations to the parties thereto. The Stockholders’ Agreement includes the following:
Consent Rights. The Stockholders’ Agreement provides the Class B/C Directors with consent rights, so long as ACOF, together with its affiliates and permitted transferees, beneficially owns shares of Class B Common Stock and/or Class C Common Stock representing at least 15% of the total Class A Common Stock, Class B Common Stock and Class C Common Stock (together, the “Common Stock”) (calculated without reference to any shares of capital stock issued or issuable after the Spin-Off) over certain corporate activities, including any change in control of the Company, certain changes in the number of Directors constituting the Company’s Board of Directors, the consummation of the first public offering after the Spin-Off, any redemption of our Series A Preferred Stock, certain changes to the Company’s Amended and Restated Certificate of Incorporation or the Company’s Amended and Restated Bylaws, entry into certain affiliate arrangements, the taking of any action that would not be consistent with certain Company representations made in connection with the IRS Ruling, the issuance by the Company of any capital stock (other than in connection with stock plans or similar arrangements), and the Company’s engaging in any rights offering and any liquidation of corporate assets.
The Stockholders’ Agreement provides that for so long as ESL holds more shares of our common stock than ACOF, that a non-management Class A Director designated by a majority vote of our Class A Directors will have a consent right over certain corporate activities, including any redemption of our Series A Preferred Stock, the taking of any action that would not be consistent with certain Company representations made in connection with the IRS Ruling, the issuance by the Company of any capital stock (other than in connection with stock plans or similar arrangements) and the Company’s engaging in any rights offering.
80
Table of Contents
ORCHARD SUPPLY HARDWARE STORES CORPORATION AND SUBSIDIARIES
NOTES TO CONSOLIDATED FINANCIAL STATEMENTS—(Continued)
FOR THE FISCAL YEARS ENDED JANUARY 28, 2012, JANUARY 29, 2011 AND JANUARY 30, 2010
Voting Rights. The Stockholders’ Agreement grants certain stockholders certain rights with respect to the election of Directors to the Company’s Board of Directors.
Transfers. The Stockholders’ Agreement includes certain transfer restrictions and provides tag-along rights and drag-along rights in certain circumstances. In addition, each of ACOF, ESL, Edward S. Lampert (“Lampert”) and William C. Crowley (“Crowley” and, such parties collectively, the “Named Stockholders”) are granted a right of first offer on shares of Common Stock that any party to the Stockholders’ Agreement proposes to transfer to a third party that are not a permitted transferee.
Preemptive Rights. The Stockholders’ Agreement provides that prior to any issuance by the Company or any of our subsidiaries of any securities or certain debt (other than issuances (i) in an underwritten public offering registered under the Securities Act; (ii) pursuant to any stock option, stock purchase plan or agreement or other benefit plans approved by the Company’s Board of Directors; (iii) in connection with a recapitalization of the Company; (iv) in a rights offering; or (v) in connection with any acquisition that has been approved by the unanimous consent of the Company’s Board of Directors), the Company will give written notice (the “Preemptive Notice”) to ACOF and ACOF will be entitled to elect to purchase up to ACOF’s preemptive portion (with such preemptive portion being a fraction, the numerator of which is the number of shares of our common stock owned by ACOF and the denominator of which is the number of shares of the Company’s common stock owned by ACOF, ESL, Lampert and Crowley) of the securities proposed to be issued by the Company or any of the Company’s subsidiaries (the “Preemptive Securities”). Notwithstanding the foregoing, during the period beginning on the date of the Spin-Off and ending on the date that is the earlier of (i) the date that ACOF completes the acquisition of an aggregate number of additional shares of our common stock equal to 15% of the total shares of our common stock outstanding as of such date and (ii) the date that is six months from the date on which the distribution agent has completed the electronic issuance of all of the shares of the Company’s Class A Common Stock in connection with the Spin-Off (such period, subject to extension upon certain circumstances detailed in the Stockholders’ Agreement, the “Standstill Period”), with respect to any proposed issuance of Preemptive Securities, for a period of ten business days following the delivery of the Preemptive Notice, ACOF shall have the sole right to elect to purchase all or a portion of the Preemptive Securities on the terms set forth in the Preemptive Notice.
Registration Rights. Pursuant to the Stockholders’ Agreement the Company agreed to prepare and file a shelf registration statement under the Securities Act to effect the registration under the Securities Act of resales to be made, on a delayed or continuous basis, of all shares of Class A Common Stock issuable upon conversion of the Class C Common Stock, promptly upon obtaining eligibility for use of Form S-3. The Stockholders’ Agreement also provides to each of ACOF and ESL four “demand” registrations at any time, unless the Company is eligible to register the Company’s shares using Form S-3 (or any successor to Form S-3), then each of ACOF and ESL may make an unlimited number of “demand” registrations (an “S-3 Demand Registration”), provided that the Company will not be required to effect an S-3 Demand Registration more than twice in any 12-month period. In addition, parties to the Stockholders’ Agreement also have customary “piggyback” registration rights in the event of registration of any of the Company’s Common Stock, subject to certain limitations, including as determined by the underwriters. In connection with such registration of the Company’s securities pursuant to the terms of the Stockholders’ Agreement, the Company will indemnify the stockholders party thereto, their affiliates and each of their respective Directors, officers, employees, members, partners and control persons.
Purchase of Shares. The Stockholders’ Agreement also provides that during the Standstill Period ACOF may purchase the Company’s securities by any means, subject to applicable laws. Furthermore, pursuant to the Stockholders’ Agreement, during the Standstill Period, none of the Company, ESL, Lampert or Crowley, nor any
81
Table of Contents
ORCHARD SUPPLY HARDWARE STORES CORPORATION AND SUBSIDIARIES
NOTES TO CONSOLIDATED FINANCIAL STATEMENTS—(Continued)
FOR THE FISCAL YEARS ENDED JANUARY 28, 2012, JANUARY 29, 2011 AND JANUARY 30, 2010
of their affiliates (collectively, the “Restricted Parties”), will (i) acquire, directly or indirectly, any securities of the Company’s subsidiaries or (ii) knowingly or intentionally hinder or inhibit ACOF from making any such purchases of the Company’s securities, subject to certain restrictions. Following the Standstill Period, if either (a) ESL, Lampert or Crowley (collectively, the “ESL Parties”) or (b) ACOF desires to consummate the purchase of any of the Company securities, then such party must first offer ACOF or the ESL Parties, as applicable, the opportunity to participate in such purchase for up to 50% of such securities.
12. COMMITMENTS AND CONTINGENCIES
On April 1, 2011, a judgment for $5.1 million by the California Superior Court was entered against the Company in favor of Save Mart Supermarkets (“Save Mart”). The Company recorded a $5.6 million liability and expense in selling and administrative expenses in the consolidated statement of operations for the year ended January 29, 2011, including a $0.5 million legal fee accrual. The Company reversed the $0.5 million fee accrual in fiscal 2011 as the court ruled that the Company was not liable for the fees. On August 24, 2011, the Company entered into a settlement agreement with Save Mart (the “Settlement Agreement”) to satisfy the $5.1 million judgment, release the Company of all liabilities, and waive all rights of appeals by both parties. The Settlement includes three parts: 1) a $0.5 million cash payment to Save Mart, 2) the amendment and extension of an existing lease between Save Mart and the Company, and 3) the lease of a new property to the Company. Pursuant to the Settlement Agreement during fiscal 2011, the Company paid the $0.5 million and recorded a $1.6 million reduction to this liability, which is classified as a reduction to selling and administrative expense in the consolidated statements of operations.
Three putative class action lawsuits, brought on behalf of current and former employees, are pending against the Company. One of these lawsuits was brought in 2010 and two were brought in 2011. These lawsuits allege the Company failed to comply with various California labor laws, including misclassification of non-exempt employees as exempt employees, failure to pay regular, overtime, and final wages, failure to provide meal and/or rest breaks, and failure to provide accurate wage statements. The Company denies the allegations in the claims of these lawsuits and intends to vigorously defend itself against them. However, the Company cannot predict with assurance the outcome of these lawsuits and accordingly adverse developments, settlements, or resolutions may occur and negatively impact income in the quarter of such development, settlement, or resolution. Based on the information currently available, the Company does not believe that any of these lawsuits would have a material adverse effect on the consolidated financial position or results of operations of the Company.
The Company is a defendant in various other legal proceedings arising in the ordinary course of our business. Based on the information currently available, the Company is not currently a party to any legal proceeding that management believes would have a material adverse effect on the Company’s our consolidated financial position or results of operations.
At January 28, 2012 and January 29, 2011 the Company had non-cancelable commitments of $0.4 million and $0.2 million, respectively. In addition, at January 28, 2012, the Company had merchandise purchase obligations of $48.8 million.
82
Table of Contents
ORCHARD SUPPLY HARDWARE STORES CORPORATION AND SUBSIDIARIES
NOTES TO CONSOLIDATED FINANCIAL STATEMENTS—(Continued)
FOR THE FISCAL YEARS ENDED JANUARY 28, 2012, JANUARY 29, 2011 AND JANUARY 30, 2010
13. QUARTERLY FINANCIAL DATA (UNAUDITED)
The following table contains selected unaudited quarterly financial data for fiscal years 2011 and 2010. In the opinion of management, this unaudited information has been prepared on the same basis as the audited information and includes all adjustments, consisting only of normal and recurring adjustments necessary to state fairly the information set forth therein (in millions, except per share amounts).
| 13 Weeks Ended | ||||||||||||||||
| April 30, 2011 |
July 30, 2011 |
October 29, 2011 |
January 28, 2012 |
|||||||||||||
| NET SALES |
$ | 163.8 | $ | 196.4 | $ | 158.7 | $ | 141.6 | ||||||||
| COST OF SALES AND EXPENSES: |
||||||||||||||||
| Cost of sales (excluding depreciation and amortization) |
108.6 | 130.6 | 107.2 | 94.6 | ||||||||||||
| Selling and administrative |
44.0 | 46.2 | 40.8 | 46.1 | ||||||||||||
| Loss on sale of real property |
14.3 | 0.5 | ||||||||||||||
| Depreciation and amortization |
7.2 | 7.5 | 7.7 | 7.0 | ||||||||||||
|
|
|
|
|
|
|
|
|
|||||||||
| Total costs of sales and expenses |
159.8 | 184.3 | 170.0 | 148.2 | ||||||||||||
| OPERATING INCOME (LOSS) |
4.0 | 12.1 | (11.3 | ) | (6.6 | ) | ||||||||||
| INTEREST EXPENSE, NET |
5.6 | 5.5 | 5.7 | 6.6 | ||||||||||||
| INCOME TAX (BENEFIT) EXPENSE |
(0.6 | ) | 2.7 | (6.9 | ) | (5.9 | ) | |||||||||
|
|
|
|
|
|
|
|
|
|||||||||
| NET (LOSS) INCOME |
$ | (1.0 | ) | $ | 3.9 | $ | (10.1 | ) | $ | (7.3 | ) | |||||
|
|
|
|
|
|
|
|
|
|||||||||
| NET (LOSS) INCOME PER COMMON SHARE: |
||||||||||||||||
| Basic and diluted (loss) per share |
$ | (0.17 | ) | $ | 0.65 | $ | (1.68 | ) | $ | (1.21 | ) | |||||
| Basic and diluted weighted average common shares outstanding |
6.0 | 6.0 | 6.0 | 6.0 | ||||||||||||
| 13 Weeks Ended | ||||||||||||||||
| May 1, 2010 |
July 31, 2010 |
October 30, 2010 |
January 29, 2011 |
|||||||||||||
| NET SALES | $169.7 | $195.0 | $154.5 | $141.5 | ||||||||||||
| COST OF SALES AND EXPENSES: | ||||||||||||||||
| Cost of sales (excluding depreciation and amortization) |
108.1 | 127.1 | 102.8 | 93.8 | ||||||||||||
| Selling and administrative |
41.9 | 43.2 | 40.3 | 40.6 | ||||||||||||
| Depreciation and amortization |
8.1 | 7.2 | 7.8 | 8.1 | ||||||||||||
|
|
|
|
|
|
|
|
|
|||||||||
| Total costs of sales and expenses |
158.1 | 177.5 | 150.9 | 142.5 | ||||||||||||
| OPERATING INCOME (LOSS) |
11.6 | 17.5 | 3.6 | (1.0 | ) | |||||||||||
| INTEREST EXPENSE, NET |
4.3 | 4.2 | 4.3 | 4.6 | ||||||||||||
| INCOME TAX EXPENSE (BENEFIT) |
2.9 | 5.2 | (0.3 | ) | (2.2 | ) | ||||||||||
|
|
|
|
|
|
|
|
|
|||||||||
| NET INCOME (LOSS) |
$ | 4.4 | $ | 8.1 | $ | (0.4 | ) | $ | (3.4 | ) | ||||||
|
|
|
|
|
|
|
|
|
|||||||||
| NET INCOME (LOSS) PER COMMON SHARE: |
||||||||||||||||
| Basic and diluted (loss) per share |
$ | 0.73 | $ | 1.35 | $ | (0.07 | ) | $ | (0.57 | ) | ||||||
| Basic and diluted weighted average common shares outstanding |
6.0 | 6.0 | 6.0 | 6.0 | ||||||||||||
During the 13 weeks ended January 28, 2012 we recorded a $3.5 million non-cash store impairment charge. During the 13 weeks ended January 29, 2011, we recorded a $5.6 million legal liability pursuant to the Save Mart case. During the 13 weeks ended April 30, 2011, we recorded $2.1 million benefit related to the reversal of the Save Mart case accrual.
83
Table of Contents
Item 9.—Changes in and Disagreements with Accountants on Accounting and Financial Disclosures
None.
Item 9A.—Controls and Procedures
Evaluation of Disclosure Controls and Procedures.
Our management has carried out, under the supervision of our Chief Executive Officer and Chief Financial Officer, an evaluation of the effectiveness of the design and operation of our disclosure controls and procedures (as such term is defined in Rules 13a-15(e) and 15d-15(e) under the Securities Exchange Act of 1934, as amended (the “Exchange Act”)) as of January 28, 2012. Based on such evaluation, our Chief Executive Officer and Chief Financial Officer have concluded that, as of the end of such period, our disclosure controls and procedures were not effective because of the material weakness identified as of such date discussed below. Notwithstanding the existence of the material weakness described below, management has concluded that the consolidated financial statements in this Form 10-K fairly present, in all material respects, the Company’s financial position, results of operations and cash flows for all periods and dates presented.
Material Weakness in Internal Control over Financial Reporting.
Pursuant to rules of the Securities and Exchange Commission that provide a transition period for newly public companies, this Form 10-K does not include a report of management’s assessment of internal control over financial reporting or an attestation report of our independent registered public accounting firm regarding internal control over financial reporting. Although we are not currently required to comply with Section 404 of the Sarbanes-Oxley Act of 2002, we have identified certain matters involving our internal controls over financial reporting that would constitute material weaknesses under standards established by the Public Company Accounting Oversight Board (United States) (“PCAOB”).
The PCAOB defines a material weakness as a deficiency, or a combination of deficiencies, in internal control over financial reporting such that there is a reasonable possibility that a material misstatement of our annual or interim financial statements will not be prevented or detected on a timely basis. A significant deficiency is a deficiency, or a combination of deficiencies, in internal control over financial reporting that is less severe than a material weakness, yet important enough to merit attention by those responsible for oversight of our financial reporting.
A control deficiency exists when the design or operation of a control does not allow management or employees, in the normal course of performing their assigned functions, to prevent or detect misstatements on a timely basis. A deficiency in design exists when a control necessary to meet the control objective is missing or when an existing control is not properly designed such that, even if the control operates as designed, the control objective is not always met. A deficiency in operation exists when a properly designed control does not operate as designed, or when the person performing the control does not possess the necessary authority or qualifications to perform the control effectively.
The material weaknesses identified by us results from inadequate technical accounting knowledge and inadequate written accounting policies and procedures. Specifically, the following items were identified:
| • | insufficient complement of external financial reporting, technical accounting and tax staff commensurate to the nature of the Company’s operations and financial reporting requirements; and |
| • | incomplete documentation of the policies and procedures to be used for external financial reporting, accounting and income tax purposes. |
84
Table of Contents
We have and we will continue to address the material weaknesses identified as follows:
Personnel
We have hired a new Chief Financial Officer and are in the process of hiring personnel for all key open finance positions, including a Controller and external reporting resource, as well as hiring an external provider of tax services; we will continue to augment our accounting staff as needed.
Accounting and Internal Control Policies and Procedures
We are in the process of documenting key policies and internal control procedures for significant accounting areas with an emphasis on implementing additional procedures to identify and properly account for complex routine and non-routine recurring transactions. We expect to complete this effort during the 2012 fiscal year.
Controls
We have also engaged an independent consulting firm to assist us with our efforts to comply with Section 404 of the Sarbanes-Oxley Act of 2002 by the end of this fiscal year. Through the remediation activities that are in progress, we expect to remediate the material weaknesses in fiscal year 2012.
Changes in Internal Control over Financial Reporting
Except as described above, there have been no changes in our internal control over financial reporting (as such term is defined in Rules 13a-15(f) and 15d-15(f) under the Exchange Act) during the fiscal quarter ended January 28, 2012, that have materially affected, or are reasonably likely to materially affect, our internal control over financial reporting.
None.
85
Table of Contents
PART III
Item 10.—Directors, Executive Officers and Corporate Governance
Information regarding the Directors of the Company is incorporated herein by reference from the Company’s 2012 Proxy Statement to Stockholders to be filed pursuant to Regulation 14A under the Exchange Act no later than 120 days after the end of the Company’s 2011 fiscal year.
Information regarding the Executive Officers of the Company is contained in Part I of this Form 10-K.
Item 11.—Executive Compensation
The information required by Item 11 is incorporated herein by reference from the Company’s 2012 Proxy Statement to Stockholders to be filed pursuant to Regulation 14A under the Exchange Act no later than 120 days after the end of the Company’s 2011 fiscal year.
Item 12.—Security Ownership of Certain Beneficial Owners and Management and Related Stockholder Matters
The information required by Item 12 is incorporated herein by reference from the Company’s 2012 Proxy Statement to Stockholders to be filed pursuant to Regulation 14A under the Exchange Act no later than 120 days after the end of the Company’s 2011 fiscal year.
Item 13.—Certain Relationships and Related Transactions, and Director Independence
The information required by Item 13 is incorporated herein by reference from the Company’s 2012 Proxy Statement to Stockholders to be filed pursuant to Regulation 14A under the Exchange Act no later than 120 days after the end of the Company’s 2011 fiscal year.
Item 14.—Principal Accounting Fees and Services
The information required by Item 14 is incorporated herein by reference from the Company’s 2012 Proxy Statement to Stockholders to be filed pursuant to Regulation 14A under the Exchange Act no later than 120 days after the end of the Company’s 2011 fiscal year.
Item 15.—Exhibits, Financial Statement Schedules
Documents filed as part of this report:
(1) List of Financial Statements
The following consolidated financial statements are included herein in Part II, Item 8 of this Form 10-K:
Report of Independent Registered Public Accounting Firm;
Consolidated Balance Sheets at January 28, 2012 and January 29, 2011;
Consolidated Statements of Operations for the Years Ended January 28, 2012, January 29, 2011, and January 30, 2010;
Consolidated Statements of Stockholders’ Equity and Comprehensive Income (Loss) for the Years Ended January 28, 2012, January 29, 2011, and January 30, 2010;
Consolidated Statements of Cash Flows for the Years Ended January 28, 2012, January 29, 2011, and January 30, 2010; and
Notes to Consolidated Financial Statements
86
Table of Contents
(2) Schedules to Financial Statements:
All financial statement schedules have been omitted because they are either inapplicable or the information required is provided in the Company’s Consolidated Financial Statements and Notes thereto or included in Part II, Item 8 of this Form 10-K.
(3) List of Exhibits
Incorporated herein by reference is a list of the Exhibits contained in the Exhibit Index.
87
Table of Contents
Pursuant to the requirements of Section 13 or 15(d) of the Securities Exchange Act of 1934, the registrant has duly caused this report to be signed on its behalf by the undersigned, thereunto duly authorized, in the City of San Jose, State of California, on the 27th day of April 2012.
| ORCHARD SUPPLY HARDWARE STORES CORPORATION | ||
| By: | /s/ MARK R. BAKER | |
| Mark R. Baker | ||
| Chief Executive Officer and President | ||
POWER OF ATTORNEY
We the undersigned officers and Directors of Orchard Supply Hardware Stores Corporation hereby severally constitute and appoint Mark R. Baker and Chris D. Newman, or either of them, his or her attorneys-in-fact, for such person in any and all capacities, to sign any amendments to this report and to file the same, with exhibits thereto, and other documents in connection therewith, with the Securities and Exchange Commission, hereby ratifying and confirming all that either of said attorneys-in-fact, or substitute or substitutes, may do or cause to be done by virtue hereof.
Pursuant to the requirements of the Securities Exchange Act of 1934, this report has been signed below by the following persons on behalf of the registrant and in the capacities and on the dates indicated.
| Signature |
Title |
Date | ||
| /s/ MARK R. BAKER Mark R. Baker |
President, Chief Executive Officer and Director (Principal Executive Officer) | April 27, 2012 | ||
| /s/ CHRIS D. NEWMAN Chris D. Newman |
Executive Vice President, Chief Financial Officer and Treasurer (Principal Financial Officer and Principal Accounting Officer) | April 27, 2012 | ||
| /s/ WILLIAM C. CROWLEY William C. Crowley |
Chairman of the Board | April 27, 2012 | ||
| /s/ MATTHEW D. CWIERTNIA Matthew D. Cwiertnia |
Director | April 27, 2012 | ||
| /s/ KEVIN R. CZINGER Kevin R. Czinger |
Director | April 27, 2012 | ||
| /s/ SUSAN L. HEALY Susan L. Healy |
Director | April 27, 2012 | ||
| /s/ DAVID B. KAPLAN David B. Kaplan |
Director | April 27, 2012 | ||
| /s/ KAREN M. ROSE Karen M. Rose |
Director | April 27, 2012 | ||
88
Table of Contents
| Signature |
Title |
Date | ||
| /s/ BRYANT W. SCOTT Bryant W. Scott |
Director | April 27, 2012 | ||
| /s/ STEVEN L. MAHURIN Steven L. Mahurin |
Director | April 27, 2012 | ||
| /s/ MARK A. BUSSARD Mark A. Bussard |
Director | April 27, 2012 | ||
89
Table of Contents
INDEX TO EXHIBITS
| Exhibit |
Description |
Form |
File No. |
Exhibit |
Filing Date |
Filed | ||||||||||
| 2.1 | Distribution Agreement between Sears Holdings Corporation and Orchard Supply Hardware Stores Corporation, dated December 19, 2011. | 10-Q | 001-11679 | 2.1 | December 22, 2011 | |||||||||||
| 3.1(a) | Amended and Restated Certificate of Incorporation of Orchard Supply Hardware Stores Corporation. | 8-K | 001-11679 | 3.1 | January 5, 2012 | |||||||||||
| 3.1(b) | Amended and Restated Bylaws of Orchard Supply Hardware Stores Corporation. | 8-K | 001-11679 | 3.2 | January 5, 2012 | |||||||||||
| 3.2 | Certificate of Designation for the Series A Preferred Stock of Orchard Supply Hardware Stores Corporation. | 8-K | 001-11679 | 4.2 | January 5, 2012 | |||||||||||
| 4.1 | Second Amended and Restated Stockholders’ Agreement among ESL Investments, Inc., Edward S. Lampert, William C. Crowley, ACOF I LLC and Orchard Supply Hardware Stores Corporation. | 8-K | 001-11679 | 4.1 | January 5, 2012 | |||||||||||
| 4.2 | Specimen Class A Common Stock Certificate of Orchard Supply Hardware Stores Corporation. | S-1/A | 333-175105 | 4.2 | December 5, 2011 | |||||||||||
| 10.1 | Form of Transition Services Agreement between Sears Holdings Management Corporation and Orchard Supply Hardware Stores Corporation. | S-1/A | 333-175105 | 10.1 | December 5, 2011 | |||||||||||
| 10.2 | Tax Sharing Agreement between Sears Holdings Corporation and Orchard Supply Hardware Stores Corporation, dated November 23, 2005. | S-1 | 333-175105 | 10.2 | June 23, 2011 | |||||||||||
| 10.3 | Second Amended and Restated Senior Secured Credit Agreement, dated as of January 29, 2010, among Orchard Supply Hardware LLC, as Borrower, Orchard Supply Hardware Stores Corporation, those certain Subsidiaries of the Borrower parties thereto, the Lenders from time to time party thereto, Wells Fargo Retail Finance, LLC, as ABL Administrative Agent and Collateral Agent for the Lenders. | S-1/A | 333-175105 | 10.3 | November 17, 2011 | |||||||||||
Table of Contents
| Exhibit |
Description |
Form |
File No. |
Exhibit |
Filing Date |
Filed | ||||||||||
| 10.4(a) | Senior Secured Term Loan Agreement, dated as of December 21, 2006, by and among Orchard Supply Hardware LLC, as Borrower, Orchard Supply Hardware Stores Corporation, certain other Subsidiaries of Orchard Supply Hardware Stores Corporation, the Lenders from time to time party thereto, JPMorgan Chase Bank, N.A., as Administrative Agent and Collateral Agent for the Term Lenders. | S-1/A | 333-175105 | 10.4 | (a) | November 17, 2011 | ||||||||||
| 10.4(b) | Amendment No. 1, dated as of January 28, 2011, to the Senior Secured Term Loan Agreement, dated as of December 21, 2006, by and among Orchard Supply Hardware LLC, as Borrower, Orchard Supply Hardware Stores Corporation, certain other Subsidiaries of Orchard Supply Hardware Stores Corporation, the Lenders party thereto, JPMorgan Chase Bank, N.A., as Administrative Agent and Collateral Agent for the Term Lenders. | S-1/A | 333-175105 | 10.4 | (b) | September 9, 2011 | ||||||||||
| 10.5 | Loan Agreement, dated as of October 27, 2010, among OSH Properties LLC, each Lender from time to time party thereto, and Wells Fargo Bank, N.A., as Administrative Agent for the Lenders thereunder. | S-1/A | 333-175105 | 10.5 | September 9, 2011 | |||||||||||
| 10.6† | Offer Letter by and between Orchard Supply Hardware Stores Corporation and Mark R. Baker, dated March 7, 2011. | S-1/A | 333-175105 | 10.6 | September 9, 2011 | |||||||||||
| 10.7† | Offer Letter by and between Orchard Supply Hardware Stores Corporation and William C. Robertson, dated February 1, 2007. | S-1/A | 333-175105 | 10.7 | September 9, 2011 | |||||||||||
| 10.8† | Revised Offer Letter by and between Orchard Supply Hardware Stores Corporation and Thomas J. Carey, dated May 30, 2007. | S-1/A | 333-175105 | 10.8 | September 9, 2011 | |||||||||||
Table of Contents
| Exhibit |
Description |
Form |
File No. |
Exhibit |
Filing Date |
Filed | ||||||||||
| 10.9† | Offer Letter by and between Orchard Supply Hardware Stores Corporation and Stephen W. Olsen, dated May 21, 2010. | S-1/A | 333-175105 | 10.9 | September 9, 2011 | |||||||||||
| 10.10† | Offer Letter by and between Orchard Supply Hardware Stores Corporation and Steven L. Mahurin, dated April 15, 2011. | S-1/A | 333-175105 | 10.10 | September 9, 2011 | |||||||||||
| 10.11† | Offer Letter by and between Orchard Supply Hardware Stores Corporation and Mark Bussard, dated June 1, 2011. | S-1/A | 333-175105 | 10.11 | September 9, 2011 | |||||||||||
| 10.12† | Offer Letter by and between Orchard Supply Hardware Stores Corporation and David I. Bogage, dated April 4, 2011. | S-1/A | 333-175105 | 10.12 | September 9, 2011 | |||||||||||
| 10.13† | Offer Letter by and between Orchard Supply Hardware Stores Corporation and Roger L. Smith, dated September 24, 2007. | S-1/A | 333-175105 | 10.13 | September 9, 2011 | |||||||||||
| 10.14† | Offer Letter by and between Orchard Supply Hardware Stores Corporation and Michael W. Fox, dated September 9, 2011. | S-1/A | 333-175105 | 10.14 | November 17, 2011 | |||||||||||
| 10.15† | Offer Letter by and between Orchard Supply Hardware Stores Corporation and Chris D. Newman, dated December 19, 2011. | 10-Q | 001-11679 | 10.15 | December 22, 2011 | |||||||||||
| 10.16† | Severance Agreement by and between Orchard Supply Hardware Stores Corporation and Mark R. Baker, dated March 7, 2011. | S-1/A | 333-175105 | 10.14 | September 9, 2011 | |||||||||||
| 10.17† | Severance Agreement by and between Orchard Supply Hardware Stores Corporation and William C. Robertson, dated January 8, 2009. | S-1/A | 333-175105 | 10.15 | September 9, 2011 | |||||||||||
| 10.18† | Severance Agreement by and between Orchard Supply Hardware Stores Corporation and Steven L. Mahurin, dated November 3, 2011. | S-1/A | 333-175105 | 10.18 | November 17, 2011 | |||||||||||
| 10.19† | Severance Agreement by and between Orchard Supply Hardware Stores Corporation and Stephen W. Olsen, dated July 16, 2010. | S-1/A | 333-175105 | 10.17 | September 9, 2011 | |||||||||||
Table of Contents
| Exhibit |
Description |
Form |
File No. |
Exhibit |
Filing Date |
Filed | ||||||||||
| 10.20† | Severance Agreement by and between Orchard Supply Hardware Stores Corporation and Thomas J. Carey, dated July 23, 2007. | S-1/A | 333-175105 | 10.18 | September 9, 2011 | |||||||||||
| 10.21† | Severance Agreement by and between Orchard Supply Hardware Stores Corporation and David I. Bogage, dated April 11, 2011. | S-1/A | 333-175105 | 10.19 | September 9, 2011 | |||||||||||
| 10.22† | Severance Agreement by and between Orchard Supply Hardware Stores Corporation and Mark A. Bussard, dated June 13, 2011. | S-1/A | 333-175105 | 10.22 | November 17, 2011 | |||||||||||
| 10.23† | Severance Agreement by and between Orchard Supply Hardware Stores Corporation and Roger L. Smith, dated January 8, 2009. | S-1/A | 333-175105 | 10.21 | September 9, 2011 | |||||||||||
| 10.24† | Severance Agreement by and between Orchard Supply Hardware Stores Corporation and Michael W. Fox, dated October 3, 2011. | S-1/A | 333-175105 | 10.24 | November 17, 2011 | |||||||||||
| 10.25(a)† | Employment Agreement by and between Orchard Supply Hardware, LLC, Orchard Supply Hardware Stores Corporation and Robert M. Lynch, dated November 23, 2005. | S-1/A | 333-175105 | 10.22 | (a) | September 9, 2011 | ||||||||||
| 10.25(b)† | Amendment No. 1 to the Employment Agreement by and between Orchard Supply Hardware, LLC, Orchard Supply Hardware Stores Corporation and Robert M. Lynch, dated March 20, 2007. | S-1/A | 333-175105 | 10.22 | (b) | September 9, 2011 | ||||||||||
| 10.25(c)† | Amendment No. 2 to the Employment Agreement by and between Orchard Supply Hardware, LLC, Orchard Supply Hardware Stores Corporation and Robert M. Lynch, dated February 1, 2009. | S-1/A | 333-175105 | 10.22 | (c) | September 9, 2011 | ||||||||||
| 10.26† | Severance Agreement by and between Orchard Supply Hardware Stores Corporation and Allen R. Ravas, dated February 7, 2011. | S-1/A | 333-175105 | 10.23 | September 9, 2011 | |||||||||||
Table of Contents
| Exhibit |
Description |
Form |
File No. |
Exhibit |
Filing Date |
Filed | ||||||||||
| 10.27† | Severance Agreement by and between Orchard Supply Hardware Stores Corporation and John S. Beasley, III, dated January 8, 2009. | S-1/A | 333-175105 | 10.24 | September 9, 2011 | |||||||||||
| 10.28† | 2010 Stock Incentive Plan of Orchard Supply Hardware Stores Corporation and related agreements. | S-1/A | 333-175105 | 10.25 | September 9, 2011 | |||||||||||
| 10.29† | Non-Employee Director Compensation Policy of Orchard Supply Hardware Stores Corporation. | S-1/A | 333-175105 | 10.29 | December 9, 2011 | |||||||||||
| 10.30† | Form of Indemnification Agreement between Orchard Supply Hardware Stores Corporation and certain officers and Directors. | S-1/A | 333-175105 | 10.30 | November 17, 2011 | |||||||||||
| 10.31 | Purchase and Sale Agreement between OSH Properties LLC and LBA Realty LLC, dated October 24, 2011. | S-1/A | 333-175105 | 10.31 | November 17, 2011 | |||||||||||
| 10.32 | Single-Tenant Commercial/Industrial Lease by and between LBA RIV-Company XVII, LLC and Orchard Supply Hardware LLC, dated October 28, 2011. | S-1/A | 333-175105 | 10.32 | November 17, 2011 | |||||||||||
| 10.33† | 2011 Equity Incentive Plan of Orchard Supply Hardware Stores Corporation and related agreements. | 10-Q | 001-11679 | 10.33 | December 22, 2011 | |||||||||||
| 10.34† | Severance Agreement by and between Orchard Supply Hardware Stores Corporation and Chris D. Newman, dated December 19, 2011. | 10-Q | 001-11679 | 10.34 | December 22, 2011 | |||||||||||
| 10.35 | Amendment No. 1 to Loan Agreement dated as of December 19, 2011 by and among OSH PROPERTIES LLC, a Delaware limited liability company, each Lender referenced thereto and WELLS FARGO BANK, N.A., a national banking association, as administrative agent for Lenders. | 10-Q | 001-11679 | 10.35 | December 22, 2011 | |||||||||||
Table of Contents
| Exhibit |
Description |
Form |
File No. |
Exhibit |
Filing Date |
Filed | ||||||||||
| 10.36 | Amendment and Restatement Agreement, to the Senior Secured Term Loan Agreement, dated as of December 21, 2006 and amended as of January 28, 2011, by and among Orchard Supply Hardware LLC, as Borrower, Orchard Supply Hardware Stores Corporation, as Holdings, certain other Subsidiaries of Holdings, the Term Lenders from time to time party thereto and JPMorgan Chase Bank, N.A., as Term Administrative Agent for the Term Lenders, dated as of December 22, 2011. | 8-K | 001-11679 | 10.1 | December 29, 2011 | |||||||||||
| 10.37 | Consent and First Amendment to Second Amended and Restated Credit Agreement, dated as of January 29, 2010, among Orchard Supply Hardware LLC, as Borrower, Orchard Supply Hardware Stores Corporation, those certain Subsidiaries of the Borrower parties thereto, the Lenders from time to time party thereto and Wells Fargo Retail Finance, LLC, as ABL Administrative Agent and Collateral Agent for the Lenders, effective as of December 22, 2011. | 8-K | 001-11679 | 10.2 | December 29, 2011 | |||||||||||
| 10.38 | Amendment No. 2 to Loan Agreement, dated as of October 27, 2010, as amended on December 19, 2011, among OSH Properties LLC, each Lender from time to time party thereto, and Wells Fargo Bank, N.A., as Administrative Agent for the Lenders thereunder, dated as of December 27, 2011. | 8-K | 001-11679 | 10.3 | December 29, 2011 | |||||||||||
| 10.39 | Lease, dated as of October 27, 2010, as amended on February 17, 2011, among OSH Properties LLC, as Landlord, and Orchard Supply Hardware LLC, as Tenant. | 8-K | 001-11679 | 10.4 | December 29, 2011 | |||||||||||
| 10.40 | Amendment No. 2 to Lease, dated as of October 27, 2010, as amended on February 17, 2011, among OSH Properties LLC, as Landlord, and Orchard Supply Hardware LLC, as Tenant, dated as of December 27, 2011. | 8-K | 001-11679 | 10.5 | December 29, 2011 | |||||||||||
Table of Contents
| Exhibit |
Description |
Form |
File No. |
Exhibit |
Filing Date |
Filed |
||||||||||||
| 10.41† | Severance Agreement and General Release dated January 30, 2012 between Orchard Supply Hardware LLC and Thomas J. Carey. | 8-K | 001-11679 | 10.1 | January 31, 2012 | |||||||||||||
| 21.1 | List of Subsidiaries of Orchard Supply Hardware Stores Corporation. | X | ||||||||||||||||
| 23.1 | Consent of Independent Registered Public Accounting Firm. | X | ||||||||||||||||
| 31.1 | Certification of Chief Executive Officer pursuant to Rule 13a-14(a) and Rule 15d-14(a) of the Securities Exchange Act of 1934, as amended. | X | ||||||||||||||||
| 31.2 | Certification of Chief Financial Officer pursuant to Rule 13a-14(a) and Rule 15d-14(a) of the Securities Exchange Act of 1934, as amended. | X | ||||||||||||||||
| 32.1 | Certification of Chief Executive Officer pursuant to 18 U.S.C., Section 1350, as adopted pursuant to Section 906 of the Sarbanes-Oxley Act of 2002. | X | ||||||||||||||||
| 32.2 | Certification of Chief Financial Officer pursuant to 18 U.S.C., Section 1350, as adopted pursuant to Section 906 of the Sarbanes-Oxley Act of 2002. | X | ||||||||||||||||
| 101.INS* | XBRL Instance Document | |||||||||||||||||
| 101.SCH* | XBRL Taxonomy Extension Schema Document | |||||||||||||||||
| 101.CAL* | XBRL Taxonomy Extension Calculation Linkbase Document | |||||||||||||||||
| 101.DEF* | XBRL Taxonomy Extension Definition Linkbase Document | |||||||||||||||||
| 101.LAB* | XBRL Taxonomy Extension Label Linkbase Document | |||||||||||||||||
| 101.PRE* | XBRL Taxonomy Extension Presentation Linkbase Document | |||||||||||||||||
| † | Management contract, or compensatory plan or arrangement. |
| * | XBRL (eXtensible Business Reporting Language) information is furnished and not filed or a part of a registration statement or prospectus for purposes of sections 11 or 12 of the Securities Act of 1933, is deemed not filed for purposes of section 18 of the Securities Exchange Act of 1934, and otherwise is not subject to liability under these sections. |