Attached files
| file | filename |
|---|---|
| 8-K - FORM 8-K - Lazard Ltd | d344430d8k.htm |
Exhibit 99.1

|
April 27, 2012 |
Dear Shareholder,
Lazard is a unique franchise, built over 160 years. Our model is simple and powerful. We operate in the two most attractive businesses in financial services: Financial Advisory and Asset Management. We compete on equal footing with firms many times our size, without the inherent risks and conflicts that come with the use of capital.
Lazard’s purpose is to serve our clients. When we do that well, we create value for our clients, shareholders and employees. Our deep roots in business centers around the world form a global network of relationships with key decision-makers in corporations, governments and investing institutions. This network is both a competitive strength and a powerful resource for our clients.
As a firm that competes on the quality of our advice, we have two fundamental assets: our people and our reputation. Therefore it is critical that we manage our business to attract and retain the best people, and to uphold our reputation for providing the best advice and solutions to our clients.
Following our leadership transition two years ago, the executive management team of Lazard, in consultation with our Board of Directors, began an intensive review of the firm’s businesses. We set several key objectives, including revenue growth, greater cost discipline and more efficient use of capital, all of which are intended to drive shareholder value. We also committed the firm to high standards of corporate governance, disclosure and alignment of employees’ interests with those of public shareholders.
We have been addressing these priorities, while continuing to serve our clients with unwavering focus. Despite the difficult operating environment, the changes we have instituted are yielding results.
We regularly meet with our largest shareholders, who are not shy in expressing their views about Lazard’s progress. It has become clear that we need to communicate more effectively the initiatives we have put in place. We are also cognizant of cynicism regarding the alignment of interests between employees and shareholders in financial service firms. As large shareholders ourselves, our objectives and interests are aligned with those of our public shareholders and we are equally motivated to increase total shareholder return.
To provide greater clarity and to foster a better understanding of Lazard’s business, we have prepared a comprehensive set of questions and answers with supporting data regarding our business model, our financial goals, our corporate governance, and the metrics we use to manage the firm. We are confident that the actions we are taking will significantly benefit our long-term shareholders.
2
What goals did management set for Lazard?
| • | Deliver outstanding advice and innovative solutions to our clients |
| • | Strengthen Lazard’s position as the leading independent advisor to corporations, governments and investing institutions around the world |
| • | Attract and retain the best people in the businesses in which we operate |
| • | Drive high-quality revenue and earnings growth |
| • | Better align the interests of employees and shareholders |
| • | Generate attractive returns for the firm’s long-term shareholders |
What operational changes were made in the way Lazard is managed?
| • | Invest for high-quality revenue growth |
| • | Hold compensation growth at a lower rate than revenue growth |
| • | Create operating leverage |
| • | Focus on and manage real costs, which are not always apparent in our industry under GAAP |
| • | Increase balance sheet efficiency |
| • | Neutralize shareholder dilution from share-based compensation |
| • | Return surplus cash to shareholders |
What are the challenges of managing a business like Lazard?
We operate in highly cyclical businesses across multiple geographies, industries and asset classes. Ensuring stability is crucial to the success of our franchise. Because we compete on intellectual capital, our franchise requires that we have outstanding and experienced people serving our clients. As the stewards of long-term shareholder value, we must attract and retain the best people in our industry, while controlling expenses through business cycles.
What financial metrics do you use to manage your business?
Given the cyclical nature of our businesses, we are focused on delivering strong revenue and profit growth through the business cycle.
To manage compensation costs, we focus on annual “awarded compensation.” Awarded compensation includes the cost of all pay, including deferrals, in the year with respect to which it is awarded to the employee. Moreover, the cost of new hires generally is reflected in awarded compensation expense in the year in which they are hired.
3
We believe awarded compensation is the most appropriate measure to assess the actual costs of compensation. In the financial services industry, where deferring compensation is standard, management has considerable discretion under GAAP to affect current earnings by changing deferral rates and vesting periods. Therefore, it is difficult under GAAP to compare the operating performance of firms that have different deferral rates and vesting periods, particularly when these policies vary from year to year.
We understand the investment community measures our performance based on GAAP, but we believe that providing awarded compensation information provides greater insight into the quality of our earnings.
In a cyclical business like ours, measuring average results through cycles is more meaningful than measuring on a point to point basis. Other characteristics of our business, such as the variability of transaction closings in Financial Advisory and market appreciation in Asset Management, make quarter-to-quarter comparisons difficult.
What are Lazard’s financial targets?
Based on our initiatives, a similar mix of revenues from our businesses as today, gradual improvement in the macroeconomic environment and a recovery in the M&A cycle, our financial targets are as follows:
| • | An operating margin based on GAAP and awarded compensation of at least 25% by 2014 |
| • | Awarded compensation ratio in the mid-to-high-50s percentage range |
| • | Non-compensation expense ratio of 16% to 20% |
| • | Deploy $200 million of existing surplus cash toward dividends, share repurchases or debt repurchases by 2013 |
| • | Share repurchases to exceed restricted stock unit (RSU) grants |
| • | Deploy future excess cash generated from operations toward additional dividends, share repurchases or debt repurchases |
| • | Generate superior total shareholder return |
4
What are your accomplishments so far?
Over the 2010-2011 period as compared to the prior four-year period, we have achieved the following:
| • | Operating revenue and awarded compensation - Average annual operating revenue increased by over $200 million, while average awarded compensation remained flat |
| • | Operating margin - Average operating margin based on awarded compensation rose to 18% from 12% |
| • | Awarded EPS - Average earnings per share based on awarded compensation rose to $1.55 from $0.62 |
| • | Allocation of revenues between shareholders and employees - In 2010, our most recent growth year, employees received 37% of the revenue growth. In contrast, when revenues grew from 2005 to 2007, employees received approximately 82% of the revenue growth. In 2011, when revenues declined, employees bore 57% of the decline |
| • | Capital return to shareholders - Average annual return of capital to shareholders doubled, as we increased dividends by 60% per share and increased share repurchases |
| • | Neutralizing shareholder dilution - Share repurchases have more than offset RSU grants, unlike the prior period |
(See slides 1-4)
Can you comment on shareholder returns?
We are disappointed. Since March 1, 2010, following the filing of Lazard’s 2009 full-year results, our stock’s total return has been negative 23% (as of April 26, 2012), in the middle of a select group of comparable companies. This return reflects challenging market conditions for our industry, negative investor sentiments with respect to financial services in general, and our own performance.
We are confident the changes we are making will build shareholder value and total return over the long term.
(See slide 5)
5
What is your outlook for 2012?
Macroeconomic conditions are still uncertain, especially with respect to Europe, but generally the environment appears better than it did last autumn. Rising confidence should boost both M&A and equity markets, barring any severe economic shocks. In Asset Management, our business is in excellent position for growth, with a strong pattern of performance in multiple strategies and significant capacity in our investment platforms.
Our firm has been strengthened by the tests of the last several years. The global competitive landscape has changed dramatically, and Lazard has changed as well. We believe the firm and its shareholders are better positioned than ever to capitalize on the growth opportunities ahead.
6
Additional Questions and Answers
Achieving Our Margin Goals
| 1. | How did you choose 25% as an operating margin by 2014? |
Based on the implementation of our initiatives, a similar mix of revenues from our businesses as today, gradual improvement in the macroeconomic environment and a recovery in the M&A cycle, we believe we can achieve an awarded compensation ratio of 55% to 59% and a non-compensation expense ratio of 16% to 20%. Therefore we are confident we can achieve a 25% operating margin target.
| 2. | How are you managing Lazard to achieve a 25% operating margin? |
We are making progress, but there is still work to do.
In the 2010-2011 period, our operating margin based on awarded compensation was 18%, up from 12% in the 2006-2009 period.
Compensation costs are the largest component of our expenses. Our goal is for awarded compensation costs to rise at a slower rate than revenue growth, and if revenues decline, awarded compensation costs should also decline. We have achieved this over the last two years. We have also initiated reductions of non-compensation costs.
As the business cycle improves, we expect our results will reflect both the investments we have been making as well as the restructuring of our cost base.
| 3. | Is a 25% margin the highest you expect? |
No. We believe that with our significant operating leverage, a stronger cycle should result in higher operating margins.
| 4. | Will there be a difference between your operating margin using the two different measures? |
Over time, given a consistent deferral rate, awarded compensation ratios and GAAP compensation ratios should converge, and we expect that by 2014, our operating margin will be approximately the same by either measure. In a cyclical business there will always be some divergence between the two.
7
| 5. | In order to achieve a 25% operating margin, are you assuming that you will accomplish this with revenue growth alone? |
No. We are taking additional measures regarding expenses, independent of the revenue environment. For the first quarter of 2012, we have accrued awarded compensation at a 60% ratio, which does not reflect the implementation of these additional measures.
| 6. | Will expense reductions result in additional charges? |
Yes. Expense reductions generally result in charges against GAAP earnings due to the acceleration of unvested deferred compensation and related non-compensation costs. These actions would lower the firm’s awarded compensation expenses for the year, because the deferred compensation was expensed at the time it was granted.
| 7. | What are the components of your compensation target range? |
Assuming our current revenue mix and our objective to attract and retain the best people in the industry, we have targeted an awarded compensation ratio of 55% to 59%. While we are not there yet, we have made progress: the average awarded compensation ratio has decreased from the 2006-2009 period to the 2010-2011 period, from 69% to 62%.
Underlying our target compensation range are compensation ratios of 55% to 60% for Financial Advisory, 42% to 46% for Asset Management, and 6% to 7% for corporate/support.
(See slide 6)
| 8. | Your compensation costs are still significantly above your targets. Are you overpaying your people or do you have too many people? |
To confirm individual pay levels, we annually employ independent compensation consultants to review our compensation practices and levels. Their analyses confirm that individual compensation levels at Lazard are consistent with market levels.
Our average awarded compensation per employee in Financial Advisory is in line with our peers. In Asset Management, because of our institutional business model, we believe we have a significantly higher percentage of investment professionals in our employee base and therefore benchmark at the higher end of the peer group.
We are currently staffed for an improving macroeconomic environment and an upturn in the M&A cycle. Lazard’s diverse mix of businesses and global footprint create multiple levers for growth. With our high operating leverage, a relatively small improvement in macro trends can have an outsized impact on our returns, as we experienced in 2010.
(See slide 7)
8
| 9. | You have mentioned a compensation “tailwind” before. Shouldn’t the industry environment allow you to drive down compensation costs further? |
In setting our targets, we have assumed an environment similar to 2011, in which there was a tailwind on compensation, particularly in the financial advisory business. To the extent this tailwind increases, we should have more flexibility in managing compensation expense.
| 10. | Has the recent economic environment in Europe affected your margins? |
Yes. Over the last two years, Financial Advisory market activity in Europe has been at historic lows and our business is scaled for higher activity levels. We have an extraordinarily talented group of people in Europe, so we have reallocated efforts to new and more active areas, such as Restructuring, Capital Markets Advisory, Sovereign Advisory and the emerging markets. In Asset Management, the euro zone crisis has had limited impact on our business.
| 11. | In aggregate, what percentage of GAAP and awarded compensation is variable at year end? |
In 2010-2011, the average variable component of the firm’s GAAP and awarded compensation expense was approximately 28% and 48%, respectively.
| 12. | Can you reduce corporate/support costs? |
Our corporate/support expense structure reflects our firm’s history of separate operating entities and the regulated nature of our businesses. Over the last year, we have implemented initiatives to reduce these costs. As part of our 25% operating margin target we assume that corporate support costs decrease from approximately 13% to approximately 10% of total revenues.
9
| 13. | What are the operating margins based on awarded compensation and targets for 2014 in Financial Advisory and Asset Management? |
In 2010-2011, our average operating margin based on awarded compensation, before allocation of corporate/support costs, for Financial Advisory was 24%, and for Asset Management was 40%.
We are targeting an operating margin based on awarded compensation, before allocation of corporate/support costs, for Financial Advisory of 29 % to 31%, and for Asset Management of 41% to 43%.
These targets, assuming our current mix of business and a 10% ratio of corporate/support costs, result in our targeted margin of at least 25%.
(See slides 8-10)
10
Revenue Growth Strategy
| 14. | How do you generate revenue growth? |
The Lazard franchise is powerful and our global footprint in both Financial Advisory and Asset Management is well-established. We intend to leverage our existing infrastructure to capitalize on the global macroeconomic recovery, an upturn in the M&A cycle, and continued momentum in the global equity markets.
We generate growth by:
| • | Investing in our existing businesses |
| • | Remaining adequately staffed through cycles to fully capitalize on the upturn |
| • | Monetizing the intellectual capital at Lazard into new revenue streams |
In Financial Advisory, we are focused on increasing our share of revenues across our business. We believe we are well-positioned to gain share from our largest competitors, as they shift their business models as a result of regulatory changes and the financial environment. We also believe we are better positioned to serve clients than the advisory boutiques are, because of the scale of our global platform and broad range of services.
In Asset Management, we have significant capacity in our current investment platforms on a regional and global basis. We have strong patterns of performance in most of our investment platforms. For longer term growth, we are continually developing and seeding new investment strategies that extend our existing platforms. We expect new strategies to contribute to our growth as they have in the past.
| 15. | What are your best markets for growth in the Financial Advisory business? |
In the near- to mid-term, the U.S. macroeconomic environment is the strongest of the developed economies. Recent legal decisions in the U.S. reinforce the importance of independent advice. In Europe, our Restructuring, Sovereign Advisory and Capital Markets Advisory businesses have all grown recently. Our businesses throughout the emerging markets, Japan and Australia position us for growth in these markets, while strengthening and distinguishing our relationships with clients in developed economies.
11
| 16. | What are your best markets for growth in the Asset Management business? |
In the short to intermediate term, we expect most of our growth will come from defined benefit and defined contribution plans in the developed economies (U.S., Europe, Japan and Australia), because of their sheer scope and size. Over the longer term, we expect an increasing share of our assets under management to come from the developing economies in Asia, Latin America, and the Middle East, as their retirement systems evolve and individual wealth is increasingly deployed in the financial markets. Our global footprint is already well established in the developed economies and we expect our business in the developing economies will continue to expand. Examples of successful revenue growth initiatives include: Emerging Market Debt, Latin America Equity, Core Emerging Markets, Real Estate and Global Trend.
Capital Management
| 17. | What has happened to your share count since 2010? |
In the last two years, we have repurchased more shares than have been granted in that period. We intend to offset all new grants of RSUs with buybacks.
(See slides 11 and 12)
| 18. | Is your balance sheet overcapitalized? |
Yes. While our capital structure served us well during the global financial crisis, with the improvement in the macroeconomic environment we are redeploying surplus cash.
In 2011, we repurchased $150 million of our subordinated debt at a discount. Our ability to buy back additional debt is limited by the substantial premium at which it currently trades. We also repurchased $206 million of Lazard common stock.
As of year-end 2011, we had approximately $1,080 million of cash at Lazard. After reserving approximately $380 million for accrued compensation and $500 million for cash required in the business for regulatory, tax, and related purposes, we had approximately $200 million of surplus cash. We plan to either return this cash to shareholders or use it to repurchase debt.
(See slide 13)
12
| 19. | How do you plan to deploy cash from operations? |
Our financial model has a high cash conversion rate, typically in excess of net income after repurchasing shares to offset RSU grants. Aside from seed capital, any surplus cash is available to return to shareholders or pay down debt.
(See slide 14)
Taxes
| 20. | What could change in the accounting of your deferred tax assets? |
Lazard currently has a significant valuation allowance recorded against its deferred tax assets. As the profitability of the company increases, some or all of this valuation allowance could be reversed. Should this occur, we would have a negative tax rate in the period of the reversal and potentially a higher rate in the future.
| 21. | What could be your effective and cash tax rate going forward? |
Lazard’s effective tax rate in the first quarter of 2012 was 25.7%.
Many factors could affect our future effective tax rate, including changes in the level or geographical mix of our profitability, changes in our estimates of the probability of realizing deferred tax assets and potential tax policy reforms in the U.S. and abroad.
A change in the level of the valuation allowance that relates to our deferred tax assets could increase our effective tax rate in future periods. A potentially higher effective tax rate due to this change should not affect the cash payments that relate to our taxes.
13
General Compensation Policies
| 22. | What is your deferred pay policy? |
For the senior and more highly compensated members of the firm, deferrals comprise as much as 60% of total compensation. In aggregate, approximately 25% of employee year-end compensation is deferred. Our policy is to be disciplined regarding deferrals.
| 23. | What form does deferred compensation take? |
In 2011, deferred compensation was in the form of RSUs and Asset Management (AM) units. AM units are Lazard Fund Interests that allow our employees to invest in certain Lazard-managed funds in lieu of RSUs. AM units have the same covenants as RSUs. We believe AM units serve multiple benefits, including the reduction of potential dilution of Lazard common stock, and the alignment of interests of our employees with our portfolios, which is viewed positively by consultants and clients. AM units were introduced in our Asset Management business in 2010 and expanded to the entire firm in 2011. Overall, AM units totaled $74 million of our $280 million of deferrals for the 2011 compensation cycle.
| 24. | How much Lazard stock do employees own? |
In aggregate, Lazard employees own approximately 25% of Lazard’s outstanding common stock, RSUs and exchangeable interests.
14
Benchmarking Against Competitors
| 25. | For benchmarking purposes, what are comparable companies to Lazard? |
There is not a good set of comparable companies for Lazard as a whole or for either of its primary businesses. No other publicly traded financial service firms have the same mix of businesses as Lazard.
In Financial Advisory, potential comparable companies include large integrated banks and “boutique” advisory firms.
| • | Large integrated banks rely on their capital intensive businesses to support their financial advisory practices; have cost structures that are very different from ours; and disclose only limited financial information regarding their advisory businesses on a stand-alone basis. |
| • | Boutique financial advisors lack the operating history, breadth and scale of our business. |
In Asset Management, potential comparable companies include public and private traditional asset managers.
| • | Public traditional asset managers are either significantly smaller, larger, more retail-focused or have a different product offering. |
| • | Privately held traditional asset managers are relatively comparable to our business, but the lack of public data makes comparisons difficult. |
For the sake of benchmarking our financial performance, we have selected a few publicly traded companies in each business. For Financial Advisory: Greenhill and Evercore. And for Asset Management: Affiliated Managers Group, AllianceBernstein, Artio, Invesco, Legg Mason and T. Rowe Price.
(See slides 15-18)
| 26. | Why do you use awarded compensation and awarded operating margins for benchmarking purposes? |
It is difficult under GAAP to compare the operating performance of firms that have different deferral and vesting policies, and firms that change policies from year to year. Measuring compensation ratios and operating margins based on awarded compensation is a more appropriate way to benchmark costs across our industry on a comparable basis.
15
| 27. | How does your operating margin based on awarded compensation compare to benchmark firms? |
Average operating margins based on awarded compensation for 2010-2011 and including corporate/support expenses, compare as follows:
Advisory boutiques: 15%
Asset managers: 32%
Weighted average: 22%
Lazard Current: 18%
Lazard Target by 2014: 25%
(See slide 19)
| 28. | How does your awarded compensation ratio compare to benchmark firms? |
Average awarded compensation ratios for 2010-2011, including corporate/support expenses, compare as follows:
Advisory boutiques: 65%
Asset managers: 45%
Weighted average: 56%
Lazard Current: 62%
Lazard Target Range: 55% to 59%
(See slide 20)
| 29. | How does your non-compensation ratio compare to benchmark firms? |
Average non-compensation ratios for 2010-2011, including corporate/support expenses, compare as follows:
Advisory boutiques: 21%
Asset managers: 23%
Weighted average: 22%
Lazard Current: 20%
Lazard Target Range: 16% to 20%
(See slide 21)
16
Corporate Governance
| 30. | Are you considering adding additional independent directors? |
Yes, a search is currently underway for two independent directors, who we expect will be in place by year-end.
| 31. | Will Lazard adopt a majority voting policy? |
We intend to propose for adoption at next year’s annual general meeting of shareholders a majority voting policy with respect to elections of directors. Under the policy we intend to propose, any director who receives less than a majority of votes cast in any uncontested election would be required to promptly tender his or her resignation to our Board of Directors. The Board would have the authority to either accept or reject such offer to resign.
| 32. | Why do you have inside directors? |
We believe that having inside directors on our Board serves as an important resource to the Board. Through their day-to-day involvement in Lazard’s various business segments, our inside directors are able to directly provide valuable insight to our independent directors regarding the dynamics and trends operating across our business and the industry.
| 33. | What is the role of the lead director? |
The role of the lead director is to provide objective leadership to the Board and, among other responsibilities, provide oversight and advice to our CEO, other executive management members of the Board, and independent members of the Board.
| 34. | Why do you combine the Chairman and CEO roles at Lazard? |
The Board has determined that the most effective leadership structure for the Company is for Mr. Jacobs to serve as both Chairman and CEO. In this case, the combined role unifies leadership and provides the Board and the Company with vision and direction. It allows for a single focus for the chain of command to execute the Company’s goals, strategies, objectives and business plans. The Board’s decision is influenced by, among others, the role of the Lead Director, who also provides objective leadership to the Board, the composition of the Board (including that the majority of its members, and all committee members, are independent) and the Board’s actual experience working with our Chairman and CEO.
17
| 35. | Why do you maintain a classified board? |
We believe that a classified board currently is in the best interests of our business, our clients and our shareholders. Our business is based on long-term client relationships in both Financial Advisory and Asset Management. In our view, a classified board ensures that there will not be a sudden change or interruption to our business, and thereby our clients, without the full consideration of the Board.
Executive Compensation
| 36. | What has happened with executive management compensation in recent years? |
Each of our named executive officers (NEOs) experienced a substantial decline in incentive compensation awarded for 2011. Our CEO’s total incentive compensation (i.e., cash bonus and long-term incentive awards) with respect to 2011 declined by approximately 42% from the level received for 2010, greater than the decline in our share price, our awarded operating income and our awarded net income.
Incentive compensation paid to our other NEOs who served in the same positions during 2010 and 2011 declined substantially from 2010 levels, in amounts ranging from approximately 27% to 31% of 2010 compensation levels.
In aggregate, compensation for Lazard NEOs declined by approximately 60% from the 2006-2008 period to the 2009-2011 period.
| 37. | NEO compensation was described in two ways in your proxy. What’s the difference and which is more relevant? |
Consistent with many other firms, we report NEO compensation on both an awarded and GAAP basis. The GAAP compensation disclosure refers partly to deferred awards made in prior years. For the purpose of looking at compensation awarded for 2011, we believe that awarded compensation better reflects current compensation.
18
| 38. | What type of performance-based compensation do the executive officers have? |
The Board of Directors determines bonuses for executive officers. In the past, bonuses were in the form of cash and RSUs. Approximately 80% of executive officer compensation is discretionary and determined by the Compensation Committee of the Board. Prior to this year, approximately 50% of executive officers’ compensation was in RSUs. In 2012, about 50% of deferred compensation will be awarded under a new incentive compensation program called the Long Term Incentive Plan (LTIP).
| 39. | How does the LTIP plan work? |
LTIPs are a contingent compensation mechanism paid in Lazard shares. The plan is designed to reinforce the link between pay and long-term performance for senior management. The plan is based on clearly defined performance measures not subject to management discretion. These include: revenue growth compared to stock market performance and that of our benchmark firms, improvements in cost management and the return of cash to shareholders.
LTIPs for the 2012 compensation cycle are expected to be granted in early 2013 and will relate to the firm’s performance over the three-year period beginning on January 1, 2012 and ending on December 31, 2014, and are also subject to time vesting.
| 40. | Why did you institute the LTIP program? |
The Compensation Committee adopted the LTIP program to better align management compensation with the long-term creation of shareholder value. They did so after considering: the interests of shareholders; discussions with shareholders relating to Lazard’s 2011 shareholder advisory vote regarding executive compensation; the advice of a global independent compensation consulting firm; and the views of the CEO.
We believe the LTIP program furthers our goal of implementing transparent compensation practices. LTIP awards must satisfy specific performance metrics in order to vest, and the performance metrics are tied to factors that we consider critical measures of our success and our ability to return value to our shareholders.
19
Cautionary Note Regarding Forward-Looking Statements
This document contains “forward-looking statements.” In some cases, you can identify these statements by forward-looking words such as “may”, “might”, “will”, “should”, “expect”, “plan”, “anticipate”, “believe”, “estimate”, “predict”, “potential” or “continue”, and the negative of these terms and other comparable terminology. These forward-looking statements are not historical facts but instead represent only our belief regarding future results, many of which, by their nature, are inherently uncertain and outside of our control. There are important factors that could cause our actual results, level of activity, performance or achievements to differ materially from the results, level of activity, performance or achievements expressed or implied by these forward-looking statements.
These factors include, but are not limited to, those discussed in our Annual Report on Form 10-K under Item 1A “Risk Factors,” and also disclosed from time to time in our reports on Forms 10-Q and 8-K, including the following:
| • | a decline in general economic conditions or the global financial markets, |
| • | losses caused by financial or other problems experienced by third parties, |
| • | losses due to unidentified or unanticipated risks, |
| • | a lack of liquidity, i.e., ready access to funds, for use in our businesses, and |
| • | competitive pressure on our businesses and on our ability to retain our employees. |
Although we believe the expectations reflected in the forward-looking statements are reasonable, we cannot guarantee the accuracy of our estimated targets, future results, level of activity, performance or achievements. Moreover, neither we nor any other person assumes responsibility for the accuracy or completeness of any of these forward-looking statements. You should not rely upon forward-looking statements as predictions of future events. We are under no duty to update any of these forward-looking statements to conform our prior statements to actual results or revised expectations and we do not intend to do so.
Forward-looking statements include, but are not limited to, statements about any of the following:
| • | our financial targets, including operating margin, awarded compensation ratio and non-compensation expense ratio, |
| • | our ability to reduce surplus cash through dividends and share repurchases or repurchasing debt, |
| • | our ability to offset dilution through share repurchases, |
| • | our strategies and investment policies, |
| • | our financing plans and the availability of short-term borrowing, |
| • | our competitive position, |
| • | future acquisitions, including the consideration to be paid and the timing of consummation, |
20
| • | potential growth opportunities available to our businesses, |
| • | recruitment and retention of our Managing Directors and employees, |
| • | potential levels of compensation expense, |
| • | our potential operating performance, achievements, productivity improvements, efficiency and cost reduction efforts, |
| • | likelihood of success and impact of litigation, |
| • | expected tax rates, |
| • | changes in interest and tax rates, |
| • | expectations with respect to the economy, securities markets, the market for mergers, acquisitions and strategic advisory and restructuring activity, the market for asset management activity and other industry trends, |
| • | effects of competition on our business, and |
| • | impact of future legislation and regulation on our business. |
We are committed to providing timely and accurate information to the investing public, consistent with our legal and regulatory obligations. To that end, we and our operating companies use our websites to convey information about their businesses, including the anticipated release of quarterly financial results, quarterly financial, statistical and business-related information, and the posting of updates of assets under management in various hedge funds and mutual funds and other investment products managed by Lazard Asset Management LLC and its subsidiaries. Investors can link to our company website through www.lazard.com.
Non-U.S. GAAP Measures
This document includes non-U.S. GAAP (“non-GAAP”) measures. Our non-GAAP measures are not meant to be considered in isolation or as a substitute for comparable U.S. GAAP measures and should be read only in conjunction with our consolidated financial statements prepared in accordance with U.S. GAAP. Such consolidated financial statements are available in certain of our current reports and our annual and quarterly reports previously filed with the Securities and Exchange Commission (the “SEC”).
We believe that presenting our results on an adjusted basis, in addition to the U.S. GAAP results, is the most meaningful and useful way to compare our operating results across periods. Particularly, we believe that “awarded compensation and benefits expense” and the ratio of “awarded compensation and benefits expense” to “operating revenue,” both non-U.S. GAAP measures, provide the most meaningful basis for comparison of compensation and benefits expense between present, historical and future years. “Awarded compensation and benefits expense” for a given year is calculated using “adjusted compensation and benefits expense,” as modified by the following items:
| • | We deduct amortization expense recorded for U.S. GAAP purposes in each fiscal year associated with the vesting of deferred incentive compensation awards, |
21
| • | We add (i) the grant date fair value of the deferred incentive compensation awards granted applicable to the relevant year-end compensation process (e.g., grant date fair value of deferred incentive awards granted in 2012, 2011 and 2010 related to the 2011, 2010 and 2009 year-end compensation processes, respectively) and (ii) investments in people (e.g., “sign-on” bonuses) and other special deferred incentive awards granted throughout the applicable year, with such amounts in (i) and (ii) reduced by an estimate of future forfeitures of such awards, and |
| • | We adjust for year-end foreign exchange fluctuations. |
Over time, all else being equal, awarded compensation and U.S. GAAP compensation should converge. These non-GAAP measures are fully described and reconciled in our annual report on Form 10-K for the period ended December 31, 2011. Additionally, certain comparable GAAP measures and reconciliations are included in the Exhibits attached to this Q&A.
Additional Information
We file current, annual and quarterly reports, proxy statements and other information required by the Exchange Act with the SEC. You may read and copy any document the company files at the SEC’s public reference room located at 100 F Street, N.E., Washington, D.C. 20549, U.S.A. Please call the SEC at 1-800-SEC-0330 for further information on the public reference room. Our SEC filings are also available to the public from the SEC’s internet site at http://www.sec.gov. Copies of these reports, proxy statements and other information can also be inspected at the offices of the New York Stock Exchange, Inc., 20 Broad Street, New York, New York 10005, U.S.A.
Our public internet site is http://www.lazard.com and the investor relations SEC filings section of our public internet site is located at http://www.lazard.com/InvestorRelations/SEC-Filings.aspx. We will make available free of charge, on or through the investor relations section of our internet site, our annual reports on Form 10-K, quarterly reports on Form 10-Q, current reports on Form 8-K, proxy statements and Forms 3, 4 and 5 filed on behalf of directors and executive officers and any amendments to those reports filed or furnished pursuant to the Exchange Act as soon as reasonably practicable after we electronically file such material with, or furnish it to, the SEC.
22
Lazard U.S. GAAP Selected Financial Information
($ in millions)
| 2006 | 2007 | 2008 | 2009 | 2010 | 2011 | |||||||||||||||||||
| Net Revenue |
$ | 1,494 | $ | 1,918 | $ | 1,557 | $ | 1,531 | $ | 1,905 | $ | 1,830 | ||||||||||||
| % Growth |
15 | % | 28 | % | (19 | %) | (2 | %) | 24 | % | (4 | %) | ||||||||||||
| Compensation |
891 | 1,123 | 1,128 | 1,309 | 1,194 | 1,169 | ||||||||||||||||||
| % of Net Revenue |
60 | % | 59 | % | 72 | % | 86 | % | 63 | % | 64 | % | ||||||||||||
| Non-Compensation |
275 | 376 | 404 | 404 | 468 | 425 | ||||||||||||||||||
| % of Net Revenue |
18 | % | 20 | % | 26 | % | 26 | % | 25 | % | 23 | % | ||||||||||||
|
|
|
|
|
|
|
|
|
|
|
|
|
|||||||||||||
| Operating Income |
$ | 327 | $ | 418 | $ | 25 | ($ | 182 | ) | $ | 244 | $ | 235 | |||||||||||
| % of Net Revenue |
22 | % | 22 | % | 2 | % | (12 | %) | 13 | % | 13 | % | ||||||||||||
| GAAP Diluted EPS |
$ | 2.31 | $ | 2.79 | $ | 0.06 | ($ | 1.68 | ) | $ | 1.36 | $ | 1.36 | |||||||||||
23
Reconciliation of U.S. GAAP Net Revenue to Operating Revenue
($ in millions)
| 2006 | 2007 | 2008 | 2009 | 2010 | 2011 | |||||||||||||||||||
| Net Revenue – U.S. GAAP Basis |
$ | 1,494 | $ | 1,918 | $ | 1,557 | $ | 1,531 | $ | 1,905 | $ | 1,830 | ||||||||||||
| Adjustments: |
||||||||||||||||||||||||
| Gain on repurchase of subordinated debt |
— | — | — | — | — | (18 | ) | |||||||||||||||||
| Revenue related to noncontrolling interests |
(5 | ) | (5 | ) | 13 | (7 | ) | (16 | ) | (17 | ) | |||||||||||||
| (Gain)/loss related to Lazard Fund Interests |
— | — | — | — | — | 3 | ||||||||||||||||||
| Other interest expense |
83 | 102 | 105 | 94 | 89 | 86 | ||||||||||||||||||
|
|
|
|
|
|
|
|
|
|
|
|
|
|||||||||||||
| Operating revenue, as adjusted |
$ | 1,571 | $ | 2,015 | $ | 1,675 | $ | 1,618 | $ | 1,979 | $ | 1,884 | ||||||||||||
24
Reconciliation of Compensation: U.S. GAAP to Awarded Basis
($ in millions)
| 2006 | 2007 | 2008 | 2009 | 2010 | 2011 | |||||||||||||||||||
| U.S. GAAP compensation and benefits expense |
$ | 891 | $ | 1,123 | $ | 1,128 | $ | 1,309 | $ | 1,194 | $ | 1,169 | ||||||||||||
| Deduct: |
||||||||||||||||||||||||
| 2010 and 2009 special items |
— | — | — | (147 | ) | (25 | ) | — | ||||||||||||||||
| Noncontrolling interests(a) |
— | — | — | (2 | ) | (3 | ) | (4 | ) | |||||||||||||||
| Impact of LAM Merger |
— | — | (198 | ) | — | — | — | |||||||||||||||||
| Changes in fair value pertaining to Lazard Fund Interests(b) |
— | — | — | — | — | 3 | ||||||||||||||||||
|
|
|
|
|
|
|
|
|
|
|
|
|
|||||||||||||
| Adjusted compensation and benefits expense |
891 | 1,123 | 931 | 1,161 | 1,166 | 1,168 | ||||||||||||||||||
| Deduct - Amortization of incentive compensation awards |
(23 | ) | (105 | ) | (238 | ) | (333 | ) | (241 | ) | (289 | ) | ||||||||||||
|
|
|
|
|
|
|
|
|
|
|
|
|
|||||||||||||
| Total cash compensation and benefits expense(c) |
868 | 1,018 | 692 | 827 | 926 | 879 | ||||||||||||||||||
| Add: |
||||||||||||||||||||||||
| Year-end deferred incentive compensation awards(d) |
204 | 337 | 352 | 239 | 293 | 281 | ||||||||||||||||||
| Sign-on and other special incentive awards(e) |
13 | 88 | 180 | 39 | 27 | 40 | ||||||||||||||||||
| Deduct - Adjustment for estimated forfeitures(f) |
(24 | ) | (36 | ) | (29 | ) | (28 | ) | (32 | ) | (32 | ) | ||||||||||||
| Other adjustments(g) |
7 | 7 | (10 | ) | 6 | 3 | (5 | ) | ||||||||||||||||
|
|
|
|
|
|
|
|
|
|
|
|
|
|||||||||||||
| Awarded compensation and benefits expense |
$ | 1,068 | $ | 1,414 | $ | 1,185 | $ | 1,083 | $ | 1,217 | $ | 1,163 | ||||||||||||
| (a) | Expenses related to the consolidation of noncontrolling interests are excluded because, as is the case with operating revenue, Lazard has no economic interest in such amounts. |
| (b) | Changes in fair value of the derivative compensation liability recorded in connection with Lazard Fund Interests and other similar deferred compensation arrangements are excluded from compensation and benefits expense because such amounts are equally offset by a corresponding change in the fair value of the underlying investments excluded from operating revenue. |
| (c) | Includes base salaries and benefits of $506 million, $453 million, $423 million, $471 million, $459 million and $398 million for 2011, 2010, 2009, 2008, 2007 and 2006, respectively, and cash incentive compensation of $372 million, $473 million, $405 million, $222 million, $559 million and $470 million for the respective years. |
| (d) | Grant date fair value of deferred incentive compensation awards granted applicable to the relevant year-end compensation process (e.g. grant date fair value of deferred incentive awards granted in 2012, 2011 and 2010 related to the 2011, 2010 and 2009 year-end compensation processes, respectively). |
| (e) | Represents deferred incentive compensation awards that are granted outside the year-end compensation process, and includes investments in people (e.g. “sign-on” bonuses). |
| (f) | An estimate, based on historical experience and future expectations, for future forfeitures of the deferred portion of such awards in order to present awarded compensation and benefits expense on a similar basis to that under U.S. GAAP, which also considers estimated forfeitures. Amounts for 2006 and 2007 represent actual forfeiture experience, the 2008 amount represents actual forfeiture experience for certain deferred compensation that has previously vested and an estimate of future forfeitures for unvested deferred compensation. The 2009-2011 amounts represent estimated forfeitures. |
| (g) | Represents an adjustment to the year-end foreign exchange “spot” rate from the full year average rate for year-end incentive compensation awards. |
25
Reconciliation of Non-Compensation: U.S. GAAP to Adjusted Basis
($ in millions)
| 2006 | 2007 | 2008 | 2009 | 2010 | 2011 | |||||||||||||||||||
| U.S. GAAP other operating expenses |
$ | 275 | $ | 376 | $ | 404 | $ | 404 | $ | 468 | $ | 425 | ||||||||||||
| Deduct: |
||||||||||||||||||||||||
| Write-off of Lazard Alternative Investment Holdings option prepayment |
— | — | — | — | — | (6 | ) | |||||||||||||||||
| Provision for onerous lease contract for UK facility |
— | — | — | — | — | (6 | ) | |||||||||||||||||
| Provision for counterparty defaults |
— | — | (12 | ) | — | — | — | |||||||||||||||||
| LAM equity charge |
— | — | (2 | ) | — | — | — | |||||||||||||||||
| Restructuring expense |
— | — | — | (63 | ) | (87 | ) | — | ||||||||||||||||
| Provision pursuant to tax receivable agreement |
(6 | ) | (17 | ) | (17 | ) | 1 | (2 | ) | (0 | ) | |||||||||||||
| Amortization of intangible assets related to acquisitions |
— | (22 | ) | (5 | ) | (5 | ) | (8 | ) | (12 | ) | |||||||||||||
| Non-compensation related to noncontrolling interests |
— | — | — | — | (2 | ) | (2 | ) | ||||||||||||||||
|
|
|
|
|
|
|
|
|
|
|
|
|
|||||||||||||
| Non-compensation expense as adjusted |
$ | 269 | $ | 338 | $ | 368 | $ | 337 | $ | 368 | $ | 400 | ||||||||||||
26
 April 27, 2012
Questions and Answers
Questions and Answers
Exhibits
Exhibits |
 1
Lazard Operating Income Based on Awarded Compensation
Lazard Operating Income Based on Awarded Compensation
($ in millions, except per share data)
($ in millions, except per share data)
Average
(a)
2006
2007
2008
2009
2010
2011
2006-2009
2010-2011
Operating Revenue
(b)
$1,571
$2,015
$1,675
$1,618
$1,979
$1,884
% Growth
16%
28%
(17%)
(3%)
22%
(5%)
4%
8%
Awarded Compensation
(c)
1,068
1,414
1,185
1,083
1,217
1,163
% of Operating Revenue
68%
70%
71%
67%
62%
62%
69%
62%
Non-Compensation
(d)
269
338
368
337
368
400
% of Operating Revenue
17%
17%
22%
21%
19%
21%
19%
20%
Awarded Operating Income
$234
$263
$122
$197
$393
$321
$204
$357
% of Operating Revenue
15%
13%
7%
12%
20%
17%
12%
18%
Awarded EPS
(e)
$1.04
$0.92
$0.12
$0.40
$1.76
$1.34
$0.62
$1.55
Memo:
Reported EPS as Adjusted
(f)
$2.24
$2.77
$1.72
$0.09
$2.06
$1.31
Non-GAAP
Non-GAAP |
 2
Lazard Operating Revenue and Awarded Compensation
Lazard Operating Revenue and Awarded Compensation
($ in millions)
($ in millions)
Average
2006-2009
2010-2011
Change
Operating Revenue
$1,720
$1,931
$212
Awarded Compensation
1,188
1,190
2
Awarded Operating Income
$204
$357
$153
Non-GAAP
Non-GAAP |
 3
Lazard Historical Compensation Evolution
Lazard Historical Compensation Evolution
($ in millions)
($ in millions)
2009
2010
2011
Operating Revenue
$1,618
$1,979
$1,884
% Growth
(3%)
22%
(5%)
Awarded Compensation
$1,083
$1,217
$1,163
% of Operating Revenue
67%
62%
62%
% Increase/(Decrease) in Awarded
Compensation per $ of Revenue
37%
(57%)
Non-GAAP
Non-GAAP |
 4
Return of Capital to Lazard Shareholders
Return of Capital to Lazard Shareholders
($ in millions)
($ in millions)
Average
2006-2009
2010-2011
Dividends
$42
$68
Share Repurchases
(a)
$114
$257
Total Capital Returned to Shareholders
$156
$325 |
 5
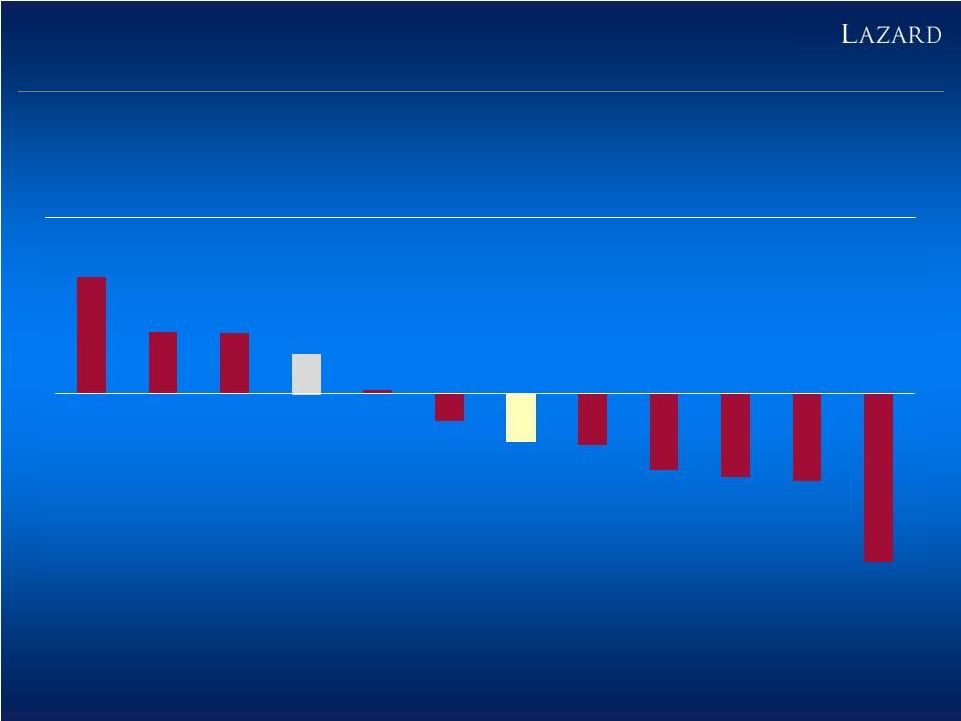
Total Shareholder Return
Total Shareholder Return
Since March 1, 2010
Source: FactSet.
Note: as of April 26, 2012 assuming dividend reinvestment.
58%
30%
30%
20%
2%
(13%)
(23%)
(25%)
(38%)
(41%)
(43%)
(83%)
Affiliated
Managers
Group
Invesco
T. Rowe
Price
MSCI
World
Legg Mason
Evercore
Lazard
Goldman
Sachs
Morgan
Stanley
Alliance
Bernstein
Greenhill
Artio |
 6
Lazard Awarded Compensation Target Ratios
Lazard Awarded Compensation Target Ratios
% Revenue Mix
Segment Base
Awarded Ratio
Awarded
Compensation
/Firm Revenue
Business Segments:
Financial Advisory
40-60%
55-60%
22-36%
Asset Management
40-60%
42-46%
17-28%
Corporate
6-7%
Awarded Compensation Ratio Range
53-61%
Awarded Compensation Ratio Target
55-59%
Non-GAAP
Non-GAAP |
 7
Average
2010-2011
$0.57 -
$0.60
$0.18 -
$0.57
$0.39 -
$0.59
Lazard
$0.50
Source: Based on public filings and estimated average share prices for grants
where actual prices were not disclosed. Note: Excludes non-recurring
items. Assumes 10% forfeiture rate on deferred compensation for peers and estimated average share prices for grants where actual prices were not disclosed.
Non-GAAP
Non-GAAP
Financial Advisory Peer Range
(a)
Asset Management Peer Range
(a) (b)
Weighted Average
(c)
Awarded Compensation Per Employee Benchmarking: 2010-2011
($ in millions) |
 8
Lazard Awarded Operating Income: Financial Advisory
Lazard Awarded Operating Income: Financial Advisory
($ in millions)
($ in millions)
Average
2006-2009
2010
2011
Average
2010-2011
Operating Revenue
% Growth
Awarded Compensation
% of Operating Revenue
Non-Compensation
(a)
% of Operating Revenue
Operating Income
% of Operating Revenue
Note: Excludes corporate allocations.
Non-GAAP
Non-GAAP
$1,057
696
66%
127
234
22%
$1,121
678
60%
136
12%
307
27%
$992
(11%)
629
63%
152
15%
211
62%
14%
24%
21%
12%
13% |
 9
Lazard Awarded Operating Income: Asset Management
Lazard Awarded Operating Income: Asset Management
($ in millions)
($ in millions)
Average
2006-2009
2010
2011
Average
2010-2011
Operating Revenue
% Growth
40%
Awarded Compensation
% of Operating Revenue
Non-Compensation
(a)
% of Operating Revenue
17%
Operating Income
% of Operating Revenue
Note: Excludes corporate allocations.
Non-GAAP
Non-GAAP
$623
312
50%
107
203
33%
$835
378
45%
130
16%
328
39%
$883
6%
382
43%
145
16%
355
44%
16%
40%
40% |
 10
Lazard Awarded Operating Income: Corporate/Support
Lazard Awarded Operating Income: Corporate/Support
($ in millions)
($ in millions)
Average
2006-2009
2010
2011
Average
2010-2011
Total Operating Revenue
Compensation
% of Total Operating Revenue
Non-Compensation
(a)
% of Total Operating Revenue
Non-GAAP
Non-GAAP
(5%)
$1,720
180
10%
94
5%
$1,979
22%
162
8%
103
5%
$1,884
151
8%
102
5%
8%
5% |
 11
Lazard RSU Grants/Issuances vs. Share Repurchases
Lazard RSU Grants/Issuances vs. Share Repurchases
($ in millions)
($ in millions)
2006-2009
2010-2011
$ Value
Shares
$ Value
Shares
Net RSU Grants and
Primary
Issuances
$1,003
24.7
Net RSU Grants
$354
9.0
Share Repurchases
$437
13.6
Share
Repurchases
$363
11.1
Net Issuance / (Repurchase)
$566
11.1
($9)
(2.1)
Memo:
Acquisitions
$331
10.6
ESUs
$438
14.6
Note: Includes special grants. Excludes Restricted Stock Units
(“RSUs”) relating to dividend participation and Director Stock Units (“DSUs”).
(a)
(b)
(b)
(a)
(c) |
 12
Lazard Share Count Evolution
Lazard Share Count Evolution
(Shares in millions)
(Shares in millions) |
 13
Lazard Surplus Cash Estimate as of December 31, 2011
Lazard Surplus Cash Estimate as of December 31, 2011
($ in millions)
($ in millions)
~$1,080
~($380)
~$700
~($500)
~$200
Cash and Liquid
Investments
Comp. Accruals
Net Liquidity
Minimum Cash Required
for Operations and
Regulatory Purposes
Surplus Cash |
 14
Lazard 2010-2011 Summary Operating Cash Flow as Adjusted
Lazard 2010-2011 Summary Operating Cash Flow as Adjusted
($ in millions)
($ in millions)
Net Income
$385
Amortization & Depreciation
684
Other Noncash Items
6
(Increase) / Decrease in Operating Assets
(a)
(84)
Increase / (Decrease) in Operating Liabilities
(a)
(194)
Estimated Share Repurchases to Offset Year-End RSU Grants
(b)
(382)
Operating Cash Flow as Adjusted
$414
% of Net Income
108%
Non-GAAP
Non-GAAP
2010-
2011 |
 15
Lazard Public Comparable Companies
Financial Advisory
Asset Management
Bank of
America Merrill Lynch
Credit Suisse
Citigroup
Evercore
Goldman Sachs
Greenhill
Jefferies
JP Morgan
Morgan Stanley
UBS
Affiliated Managers
AllianceBernstein
Artio
BlackRock
Brandes
Calamos
Capital Guardian
Cohen & Steers
Dodge & Cox
Eaton Vance
Federated Investors
Franklin Templeton
Gabelli Funds
GMO
Invesco
Janus
Legg Mason
MFS
Perpetual
Pzena
T. Rowe Price
Waddell & Reed
Note: Companies in bold used for ratio benchmarking.
|
 16
Financial Advisory Comparable Companies: Selected Metrics
Financial Advisory Comparable Companies: Selected Metrics
($ in millions)
($ in millions)
Average
Lazard
Peer Average
(a)
2006-2009
2010-2011
2006-2009
2010-2011
Difference Between Awarded and
Reported
Adjusted
Compensation
Ratios
(b)
9%
1%
8%
7%
Unamortized
Compensation
as
%
of
Revenue
(c)
16%
13%
22%
32%
Financial
Advisory
Productivity/MD
(d)
$8
$8
$6
$4
%
Headcount
in
Europe
(e)
39%
41%
22%
19%
Source: Based on public filings. |
     17
Asset Management Comparable Companies: Selection Process
Asset Management Comparable Companies: Selection Process
Selected Public and Private
Traditional Asset Managers
Affiliated Managers, AllianceBernstein, Artio, BlackRock,
Brandes, Calamos, Capital Guardian, Cohen & Steers,
Dodge & Cox, Eaton Vance, Federated Investors, Franklin
Templeton, Gabelli Funds, GMO, Invesco, Janus, Legg Mason,
MFS, Perpetual, Pzena, T. Rowe Price, Waddell & Reed
Excluded due to:
Lack of public data
Brandes, Capital Guardian, Dodge & Cox, GMO, MFS, Perpetual
% Non-Institutional AUM
Calamos, Eaton Vance, Federated Investors,
Franklin Templeton, Janus, Waddell & Reed
Size
BlackRock, Pzena, Gabelli Funds
Product Mix
Cohen & Steers
Asset Managers Used for
Benchmarking
Affiliated Managers, AllianceBernstein,
Artio, Invesco, Legg Mason, T. Rowe Price |
 18
Asset Management Comparable Companies: AUM Breakdown
Asset Management Comparable Companies: AUM Breakdown
($ in billions)
($ in billions)
Total AUM
Headquarters
AUM
% Inst’l
% Equities
% Fixed
Income
% Alternatives/
Other
(a)
Lazard AM
New York
$141
90%
82%
13%
5%
Affiliated Managers
Prides Crossing
328
63%
63%
25%
12%
AllianceBernstein
New York
406
55%
30%
54%
16%
(b)
Artio
New York
30
56%
68%
32%
0%
BlackRock
New York
3,513
(c)
72%
47%
39%
14%
Calamos
Naperville
33
24%
57%
36%
7%
Cohen & Steers
New York
41
61%
100%
0%
0%
Eaton Vance
Boston
188
20%
58%
36%
6%
Federated Investors
Pittsburgh
370
17%
8%
12%
80%
Franklin Templeton
San Mateo
660
(c)
20%
46%
53%
1%
Gabelli Funds
Rye
34
40%
95%
5%
0%
Invesco
Atlanta
625
(c)
37%
47%
27%
26%
Janus
Denver
148
25%
85%
14%
1%
Legg Mason
Baltimore
627
64%
25%
56%
19%
Pzena
New York
14
84%
100%
0%
0%
T. Rowe Price
Baltimore
490
42%
72%
28%
0%
Waddell & Reed
(d)
Overland Park
83
13%
84%
14%
2%
Source: Based on most recent 10-K, except institutional percentage for T.
Rowe Price and Franklin Templeton, which are from eVestment. |
 19
Average
2006-2009
2010
2011
Average
2010-2011
Financial Advisory Peer Average
20%
12%
18%
15%
Asset Management Peer Average
(a)
34%
32%
32%
32%
Weighted Average
(b)
25%
20%
24%
22%
Lazard
12%
20%
17%
18%
Lazard 2014 Target:
25%
Awarded Operating Margin Benchmarking: 2006-2011
Awarded Operating Margin Benchmarking: 2006-2011
Source: Based on public filings and estimated average share prices for grants
where actual prices were not disclosed. Note: Excludes non-recurring
items. Assumes 10% forfeiture rate on deferred compensation for peers and estimated average share prices for grants where actual prices were not disclosed.
Non-GAAP
Non-GAAP |
 20
Average
2006-2009
2010
2011
Average
2010-2011
Financial Advisory Peer Average
63%
67%
62%
65%
Asset
Management
Peer
Average
(a)
45%
46%
44%
45%
Weighted
Average
(b)
56%
58%
54%
56%
Lazard
69%
62%
62%
62%
Lazard Target:
55-59%
Awarded Compensation Benchmarking: 2006-2011
Awarded Compensation Benchmarking: 2006-2011
Non-GAAP
Non-GAAP
Source: Based on public filings and estimated average share prices for grants
where actual prices were not disclosed.
Note: Excludes non-recurring items. Assumes 10% forfeiture rate on deferred
compensation for peers and estimated average share prices for grants where actual prices were not disclosed. |
 21
Average
2006-2009
2010
2011
Average
2010-2011
Financial Advisory Peer Average
17%
21%
20%
21%
Asset Management Peer Average
(a)
21%
22%
24%
23%
Weighted Average
(b)
18%
22%
22%
22%
Lazard
19%
19%
21%
20%
Lazard Target:
16-20%
Non-Compensation Benchmarking: 2006-2011
Non-Compensation Benchmarking: 2006-2011
Source: Based on public filings.
Note: Excludes non-recurring items and amortization of intangibles.
Non-GAAP
Non-GAAP |
 22
Lazard U.S. GAAP Selected Financial Information
Lazard U.S. GAAP Selected Financial Information
($ in millions)
($ in millions)
2006
2007
2008
2009
2010
2011
Net Revenue
$1,494
$1,918
$1,557
$1,531
$1,905
$1,830
% Growth
15%
28%
(19%)
(2%)
24%
(4%)
Compensation
891
1,123
1,128
1,309
1,194
1,169
% of Net Revenue
60%
59%
72%
86%
63%
64%
Non-Compensation
275
376
404
404
468
425
% of Net Revenue
18%
20%
26%
26%
25%
23%
Operating Income
$327
$418
$25
($182)
$244
$235
% of Net Revenue
22%
22%
2%
(12%)
13%
13%
GAAP Diluted EPS
$2.31
$2.79
$0.06
($1.68)
$1.36
$1.36 |
 23
Reconciliation of U.S. GAAP Net Revenue to Operating Revenue
($ in millions)
2006
2007
2008
2009
2010
2011
Net
Revenue
–
U.S.
GAAP Basis
$1,494
$1,918
$1,557
$1,531
$1,905
$1,830
Adjustments:
Gain on repurchase of
subordinated debt
–
–
–
–
–
(18)
Revenue related to noncontrolling
interests
(5)
(5)
13
(7)
(16)
(17)
(Gain)/loss related to Lazard Fund
Interests
–
–
–
–
–
3
Other interest expense
83
102
105
94
89
86
Operating revenue, as adjusted
$1,571
$2,015
$1,675
$1,618
$1,979
$1,884 |
 24
Reconciliation of Compensation: U.S. GAAP to Awarded Basis
Reconciliation of Compensation: U.S. GAAP to Awarded Basis
($ in millions)
($ in millions)
2006
2007
2008
2009
2010
2011
U.S. GAAP compensation and benefits expense
$891
$1,123
$1,128
$1,309
$1,194
$1,169
Deduct:
2010 and 2009 special items
–
–
–
(147)
(25)
–
Noncontrolling interests
(a)
–
–
–
(2)
(3)
(4)
Impact of LAM Merger
–
–
(198)
–
–
–
Changes in fair value pertaining to Lazard Fund
Interests
(b)
–
–
–
–
–
3
Adjusted compensation and benefits expense
891
1,123
931
1,161
1,166
1,168
Deduct -
Amortization of incentive compensation awards
(23)
(105)
(238)
(333)
(241)
(289)
Total cash compensation and benefits expense
(c)
868
1,018
692
827
926
879
Add:
Year-end deferred incentive compensation awards
(d)
204
337
352
239
293
281
Sign-on and other special incentive awards
(e)
13
88
180
39
27
40
Deduct -
Adjustment for estimated forfeitures
(f)
(24)
(36)
(29)
(28)
(32)
(32)
Other adjustments
(g)
7
7
(10)
6
3
(5)
Awarded compensation and benefits expense
$1,068
$1,414
$1,185
$1,083
$1,217
$1,163 |
 25
Reconciliation of Non-Compensation: U.S. GAAP to Adjusted Basis
Reconciliation of Non-Compensation: U.S. GAAP to Adjusted
Basis ($ in millions)
($ in millions)
2006
2007
2008
2009
2010
2011
U.S. GAAP other operating expenses
$275
$376
$404
$404
$468
$425
Deduct:
Write-off of Lazard Alternative Investment Holdings
option prepayment
–
–
–
–
–
(6)
Provision for onerous lease contract for UK facility
–
–
–
–
–
(6)
Provision for counterparty defaults
–
–
(12)
–
–
–
LAM equity charge
–
–
(2)
–
–
–
Restructuring expense
–
–
–
(63)
(87)
–
Provision pursuant to tax receivable agreement
(6)
(17)
(17)
1
(2)
(0)
Amortization of intangible assets related to acquisitions
–
(22)
(5)
(5)
(8)
(12)
Non-compensation related to noncontrolling interests
–
–
–
–
(2)
(2)
Non-compensation expense as adjusted
$269
$338
$368
$337
$368
$400 |
 26
Footnotes
Footnotes
Slide 1:
(a) Operating revenue growth is compound annual growth rate.
(b) Operating revenue is defined as net revenue excluding (i) interest
expense, (ii) revenues related to non-controlling interests, (iii) gain on the repurchase of
subordinated promissory note and (iv) gains/losses related to the changes in
the fair value of investments held in connection with Lazard Fund Interests for
which a corresponding equal amount is excluded from compensation &
benefits. Operating revenue is a non-GAAP measure; a reconciliation of net revenue
to operating revenue is provided on slide 23.
(c) Awarded compensation is defined as adjusted compensation and benefits
expense, as modified by the following items: (i) the deduction of amortization
expense recorded for U.S. GAAP purposes in each fiscal year associated with the
vesting of deferred incentive compensation awards, (ii) the addition of (x)
the grant date fair value of the deferred incentive compensation awards granted
applicable to the relevant year-end compensation process (e.g. grant date fair
value of deferred incentive awards granted in 2012, 2011 and 2010 related to
the 2011, 2010 and 2009 year-end compensation processes, respectively) and (y)
investments in people (e.g. “sign-on” bonuses) and other
special deferred incentive awards granted throughout the applicable year, with such amounts in (x)
and (y) reduced by an estimate of future forfeitures of such awards, and (iii)
adjustments for year-end foreign exchange fluctuations. Awarded compensation
is a non-GAAP measure; a reconciliation of total compensation to awarded
compensation is provided on slide 24.
(d) Excludes provision for tax receivable agreement and amortization of
intangible assets. 2011 pro forma for provision for UK lease and LAIH write-off. 2008
pro forma for LAM equity charge and provision for counterparty defaults.
Non-compensation expense is a non-GAAP measure; a reconciliation of other
operating expenses to non-compensation expense is provided on slide 25.
(e) Calculated using the same methodology as Reported EPS as
Adjusted, but substitutes awarded compensation for GAAP compensation. Uses the same tax
rate as Reported EPS as Adjusted.
(f) 2011 pro forma for provision for UK lease, LAIH write-off, 2010
pro forma for accelerated vesting of RSUs related to retirement policy change and charge
for staff reductions. 2009 pro forma for Bruce Wasserstein RSU acceleration,
deferred cash acceleration and charge for staff reductions. 2008 pro forma for
LAM equity charge and provision for counterparty defaults.
Slide 4:
(a) Includes settlement of vested share-based incentive
compensation.
Slide 7:
(a) Financial Advisory peers include Greenhill and Evercore. Asset
Management peers include Affiliated Managers, AllianceBernstein, Artio, Invesco, Legg
Mason and T. Rowe Price.
(b) Excludes distribution and servicing fees.
(c) Average financial advisory and asset management values weighted by
Lazard’s financial advisory and asset management revenue mix.
Slide 8-10:
(a) Excludes provision for tax receivable agreement, amortization of
intangible assets and non-recurring items.
Slide 11:
(a) Assumes 37% tax withholding and forfeitures for RSUs.
(b) Excludes settlement of vested share-based incentive
compensation
(c) Based at the time of the acquisition, assuming all earnouts are
achieved.
Slide 14:
(a) Excludes changes in operating assets associated with deposits with
banks and cash deposited with clearing organizations and other segregated cash.
Excludes
changes in operating liabilities associated with deposits and other payables.
(b) Total RSUs granted, excluding special grants, RSUs relating to
dividend participation and DSUs, net of 10% estimated forfeitures, multiplied by average
annual share price.
|
 27
Footnotes (cont’d)
Footnotes (cont’d)
Slide 16:
(a)
Includes Greenhill and Evercore.
(b)
Assumes 10% forfeiture rate on deferrals for Greenhill and Evercore and average
share prices for grants where actual prices were not disclosed. Lazard
reported compensation as adjusted and awarded compensation per 2011
earnings release. Evercore reported compensation ratios as adjusted based on
“Adjusted Pro Forma”
figures and Greenhill excludes $7 million of amortization in 2011.
(c)
Evercore 2007 excluded due to lack of data.
(d)
Greenhill excludes an estimated 3 merchant banking managing directors in prior
to 2008. Evercore includes senior MDs and MDs. Evercore MDs in
2006-2010 estimated based on current ratio of MDs to senior MDs.
(e)
Lazard based on Financial Advisory headcount. Evercore Q3 2011 data used for
year end 2011 due to lack of data for Q4 2011. Slide 18:
(a)
Includes money market assets.
(b)
Includes index, structured, asset allocation services and certain other
alternative investments. (c)
Assumes multi-asset class AUM split 50/50 equities/fixed income.
(d)
Percentages for product mix based on average AUM of $87 billion.
Slide 19-21:
(a)
Excludes distribution and servicing fees.
(b)
Average financial advisory and asset management values weighted by
Lazard’s financial advisory and asset management revenue mix. Slide
24: (a)
Expenses related to the consolidation of noncontrolling interests are excluded
because, as is the case with operating revenue, Lazard has no economic
interest in such amounts.
(b)
Changes in fair value of the derivative compensation liability recorded in
connection with Lazard Fund Interests and other similar deferred compensation
arrangements are excluded from compensation and benefits expense
because such amounts are equally offset by a corresponding change in the fair
value of the underlying investments excluded from operating
revenue. (c)
Includes base salaries and benefits of $506 million, $453 million, $423
million, $471 million, $459 million and $398 million for 2011, 2010,
2009, 2008, 2007 and 2006, respectively, and cash incentive compensation
of $372 million, $473 million, $405 million, $222 million, $559 million and $470 million for
the respective years.
(d)
Grant date fair value of deferred incentive compensation awards granted
applicable to the relevant year-end compensation process (e.g. grant date fair
value of deferred incentive awards granted in 2012, 2011 and 2010 related to
the 2011, 2010 and 2009 year-end compensation processes, respectively).
(e)
Represents deferred incentive compensation awards that are granted outside the
year-end compensation process, and includes investments in people (e.g.
“sign-on”
bonuses).
(f)
An estimate, based on historical experience and future expectations, for future
forfeitures of the deferred portion of such awards in order to present
awarded compensation and benefits expense on a similar basis to that under U.S.
GAAP, which also considers estimated forfeitures. Amounts for 2006 and
2007 represent actual forfeiture experience, the 2008 amount represents
actual forfeiture experience for certain deferred compensation that has
previously vested and an estimate of future forfeitures for unvested deferred
compensation. The 2009-2011 amounts represent estimated forfeitures.
(g)
Represents an adjustment to the year-end foreign exchange
“spot” rate from the full year average rate for year-end
incentive compensation awards. |
 28
Cautionary Note Regarding Forward-Looking Statements
This document contains “forward-looking statements.”
In some cases, you can identify these statements by forward-looking words
such as “may”, “might”, “will”, “should”, “expect”,
“plan”, “anticipate”, “believe”,
“estimate”, “predict”, “potential” or
“continue”, and the negative of these terms and other comparable terminology. These forward-looking statements
are not historical facts but instead represent only our belief regarding future
results, many of which, by their nature, are inherently uncertain and outside of our control. There are
important factors that could cause our actual results, level of activity,
performance or achievements to differ materially from the results, level of activity, performance or achievements
expressed or implied by these forward-looking statements.
These factors include, but are not limited to, those discussed in our Annual
Report on Form 10-K under Item 1A “Risk Factors,” and also
disclosed from time to time in our reports on Forms 10-Q and 8-K,
including the following: •
a decline in general economic conditions or the global financial markets,
•
losses caused by financial or other problems experienced by third parties,
•
losses due to unidentified or unanticipated risks,
•
a lack of liquidity, i.e., ready access to funds, for use in
our businesses, and
•
competitive pressure on our businesses and on our ability to
retain our employees.
Although we believe the expectations reflected in the forward-looking
statements are reasonable, we cannot guarantee the accuracy of our estimated targets, future results, level of
activity, performance or achievements. Moreover, neither we nor any other person
assumes responsibility for the accuracy or completeness of any of these forward-looking statements.
You should not rely upon forward-looking statements as predictions of future
events. We are under no duty to update any of these forward-looking
statements to conform our prior statements to actual results or revised
expectations and we do not intend to do so. Forward-looking statements
include, but are not limited to, statements about any of the following:
•
our financial targets, including operating margin, awarded compensation ratio
and non-compensation expense ratio, •
our ability to reduce surplus cash through dividends and share repurchases or
repurchasing debt, •
our ability to offset dilution through share repurchases,
•
our strategies and investment policies,
•
our financing plans and the availability of short-term borrowing,
•
our competitive position,
•
future acquisitions, including the consideration to be paid and the timing of
consummation, •
potential growth opportunities available to our businesses,
•
recruitment and retention of our managing directors and employees,
•
potential levels of compensation expense,
•
our potential operating performance, achievements, productivity improvements,
efficiency and cost reduction efforts, •
likelihood of success and impact of litigation,
•
expected tax rates,
•
changes in interest and tax rates,
•
expectations with respect to the economy, securities markets, the market for
mergers, acquisitions and strategic advisory and restructuring activity, the market for asset management
activity and other industry trends,
•
effects of competition on our business, and
•
impact of future legislation and regulation on our business.
|
 29
We are committed to providing timely and accurate information to the investing
public, consistent with our legal and regulatory obligations. To that end, we and our operating
companies use our websites to convey information about their businesses,
including the anticipated release of quarterly financial results, quarterly financial, statistical and
business-related information, and the posting of updates of assets under
management in various hedge funds and mutual funds and other investment products managed by
Lazard Asset Management LLC and its subsidiaries. Investors can link to
our company website through www.lazard.com.
Non-U.S. GAAP Measures
This document includes non-U.S. GAAP (“non-GAAP”) measures.
Our non-GAAP measures are not meant to be considered in isolation or as a substitute for comparable
U.S. GAAP measures and should be read only in conjunction with our consolidated
financial statements prepared in accordance with U.S. GAAP. Such consolidated financial
statements are available in certain of our current reports and our annual and
quarterly reports previously filed with the Securities and Exchange Commission (the “SEC”).
We believe that presenting our results on an adjusted basis, in addition to the
U.S. GAAP results, is the most meaningful and useful way to compare our operating results across
periods. Particularly, we believe that “awarded compensation and
benefits expense” and the ratio of “awarded compensation and benefits expense” to “operating revenue,”
both non-U.S. GAAP measures, provide the most meaningful basis for
comparison of compensation and benefits expense between present, historical and future years.
“Awarded compensation and benefits expense” for a given year is
calculated using “adjusted compensation and benefits expense,” as modified by the following items:
•
We deduct amortization expense recorded for U.S. GAAP purposes in each fiscal
year associated with the vesting of deferred incentive compensation awards,
•
We add (i) the grant date fair value of the deferred incentive compensation
awards granted applicable to the relevant year-end compensation process (e.g., grant date fair
value of deferred incentive awards granted in 2012, 2011 and 2010 related to the
2011, 2010 and 2009 year-end compensation processes, respectively) and (ii) investments
in people (e.g., “sign-on” bonuses) and other special deferred
incentive awards granted throughout the applicable year, with such amounts in (i) and (ii) reduced by an
estimate of future forfeitures of such awards, and •
We adjust for year-end foreign exchange fluctuations. Over
time, all else being equal, awarded compensation and U.S. GAAP compensation should converge. These non-GAAP measures are fully described and reconciled in our
annual report on Form 10-K for the period ended December 31, 2011.
Additionally, certain comparable GAAP measures and reconciliations are included in the Exhibits
attached to this Q&A.
Additional Information
We file current, annual and quarterly reports, proxy statements and other
information required by the Exchange Act with the SEC. You may read and copy any document the
company files at the SEC’s public reference room located at 100 F Street,
N.E., Washington, D.C. 20549, U.S.A. Please call the SEC at 1-800-SEC-0330 for further
information on the public reference room. Our SEC filings are also
available to the public from the SEC’s internet site at http://www.sec.gov. Copies of these reports, proxy
statements and other information can also be inspected at the offices of the New
York Stock Exchange, Inc., 20 Broad Street, New York, New York 10005, U.S.A.
Our public internet site is http://www.lazard.com. and the investor relations
SEC filings section of our public internet site is located at
http://www.lazard.com/InvestorRelations/SEC-Filings.aspx. We will make
available free of charge, on or through the investor relations section of our internet site, our annual
reports on Form 10-K, quarterly reports on Form 10-Q, current reports on
Form 8-K, proxy statements and Forms 3, 4 and 5 filed on behalf of directors and executive officers
and any amendments to those reports filed or furnished pursuant to the Exchange
Act as soon as reasonably practicable after we electronically file such material with, or furnish
it to, the SEC.
|
 |