Attached files
| file | filename |
|---|---|
| 8-K - 8-K - Federal Home Loan Bank of Boston | a12-10540_18k.htm |
| EX-99.1 - EX-99.1 - Federal Home Loan Bank of Boston | a12-10540_1ex99d1.htm |
Exhibit 99.2
|
|
79th Annual Shareholders Meeting April 27, 2012 |
|
|
2 2 Today’s Agenda Jan Miller: Welcome and Introduction Ed Hjerpe: State of the Bank Paul DePodesta: Moneyball: The Art of Winning an Unfair Game For your convenience, a copy of this presentation is available at fhlbboston.com |
|
|
79th Annual Shareholders Meeting April 27, 2012 |
|
|
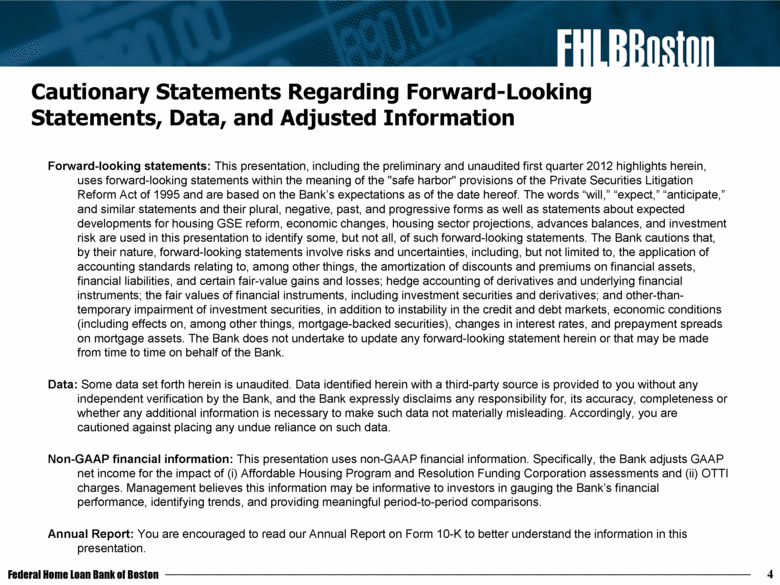
4 Cautionary Statements Regarding Forward-Looking Statements, Data, and Adjusted Information Forward-looking statements: This presentation, including the preliminary and unaudited first quarter 2012 highlights herein, uses forward-looking statements within the meaning of the "safe harbor" provisions of the Private Securities Litigation Reform Act of 1995 and are based on the Bank’s expectations as of the date hereof. The words “will,” “expect,” “anticipate,” and similar statements and their plural, negative, past, and progressive forms as well as statements about expected developments for housing GSE reform, economic changes, housing sector projections, advances balances, and investment risk are used in this presentation to identify some, but not all, of such forward-looking statements. The Bank cautions that, by their nature, forward-looking statements involve risks and uncertainties, including, but not limited to, the application of accounting standards relating to, among other things, the amortization of discounts and premiums on financial assets, financial liabilities, and certain fair-value gains and losses; hedge accounting of derivatives and underlying financial instruments; the fair values of financial instruments, including investment securities and derivatives; and other-than-temporary impairment of investment securities, in addition to instability in the credit and debt markets, economic conditions (including effects on, among other things, mortgage-backed securities), changes in interest rates, and prepayment spreads on mortgage assets. The Bank does not undertake to update any forward-looking statement herein or that may be made from time to time on behalf of the Bank. Data: Some data set forth herein is unaudited. Data identified herein with a third-party source is provided to you without any independent verification by the Bank, and the Bank expressly disclaims any responsibility for, its accuracy, completeness or whether any additional information is necessary to make such data not materially misleading. Accordingly, you are cautioned against placing any undue reliance on such data. Non-GAAP financial information: This presentation uses non-GAAP financial information. Specifically, the Bank adjusts GAAP net income for the impact of (i) Affordable Housing Program and Resolution Funding Corporation assessments and (ii) OTTI charges. Management believes this information may be informative to investors in gauging the Bank’s financial performance, identifying trends, and providing meaningful period-to-period comparisons. Annual Report: You are encouraged to read our Annual Report on Form 10-K to better understand the information in this presentation. |
|
|
5 5 State of the Bank 2011 and Early 2012 Accomplishments and Solutions Financial Results Current Business Issues Industry and Economic Outlook |
|
|
2011 and Early 2012 Accomplishments and Solutions 6 |
|
|
2011 Accomplishments Entered 2011 committed to continuing to strengthen our balance sheet, preserve capital, and achieve consistent profitability Earned $159.6 million in net income Grew retained earnings by 60 percent to $398.1 million Declared dividends in each quarter equal to approximate daily average three-month LIBOR yield Awarded over $9.5 million in AHP funds to 32 initiatives for 555 housing units, and accrued $17.8 million to fund AHP in 2012 Continued to provide reliable liquidity, develop new products and services, and enhance value of membership Relocated Bank and data center, achieving operational enhancements and cost savings 7 7 |
|
|
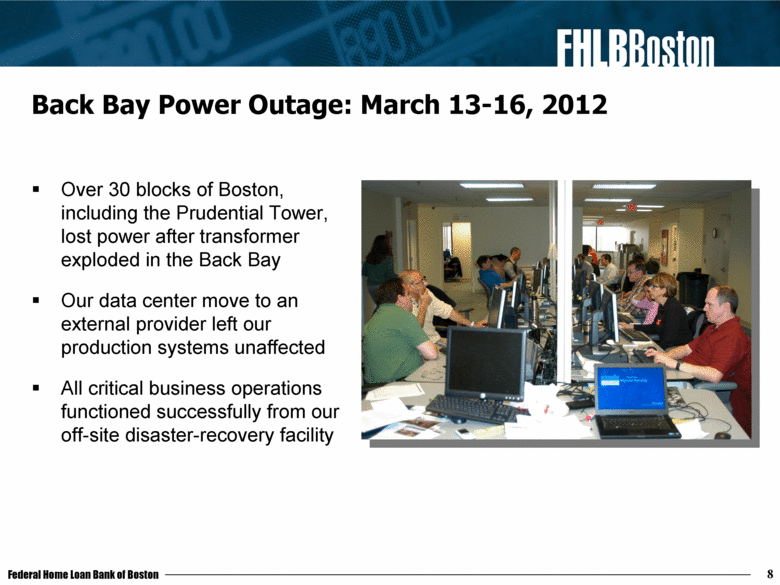
Back Bay Power Outage: March 13-16, 2012 Over 30 blocks of Boston, including the Prudential Tower, lost power after transformer exploded in the Back Bay Our data center move to an external provider left our production systems unaffected All critical business operations functioned successfully from our off-site disaster-recovery facility 8 |
|
|
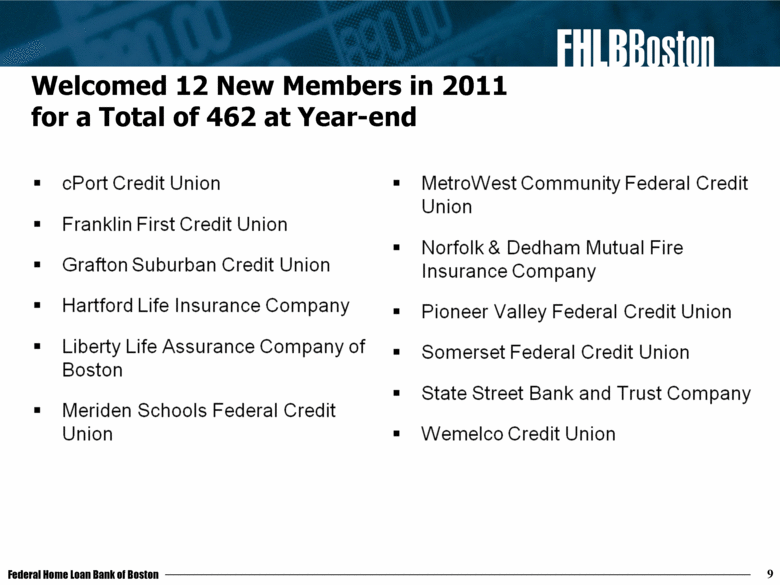
Welcomed 12 New Members in 2011 for a Total of 462 at Year-end 9 cPort Credit Union Franklin First Credit Union Grafton Suburban Credit Union Hartford Life Insurance Company Liberty Life Assurance Company of Boston Meriden Schools Federal Credit Union Metro West Community Federal Credit Union Norfolk& Dedham Mutual Fire Insurance Company Pioneer Valley Federal Credit Union Somerset Federal Credit Union State Street Bank and Trust Company Wemelco Credit Union 9 |
|
|
Solutions to Meet Evolving Member Needs 2011 33 members utilized excess stock pool for eligible advances Advances restructure solution $494.2 million in 2011, $1.5 billion since 2009 Redesigned Community Development advance program into two separate categories 2011 disbursements: $505 million in CDA and $396 million in CDA Extra Affordable Housing Program Multiplier Study analyzed the catalytic effect of AHP funding on the region’s housing (14.2 x) and economy (27.6 x) $196 million of AHP funds have led to $2.8 billion in housing and $5.4 billion of economic activity Implemented many Member Advisory Panel recommendations regarding collateral, new advances solutions, and member communications among others 10 10 |
|
|
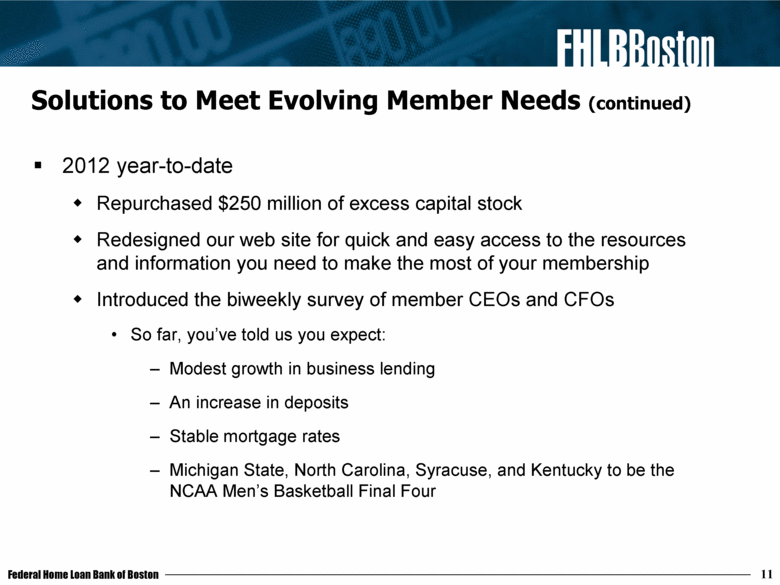
Solutions to Meet Evolving Member Needs (continued) 2012 year-to-date Repurchased $250 million of excess capital stock Redesigned our web site for quick and easy access to the resources and information you need to make the most of your membership Introduced the biweekly survey of member CEOs and CFOs So far, you’ve told us you expect: Modest growth in business lending An increase in deposits Stable mortgage rates Michigan State, North Carolina, Syracuse, and Kentucky to be the NCAA Men’s Basketball Final Four 11 |
|
|
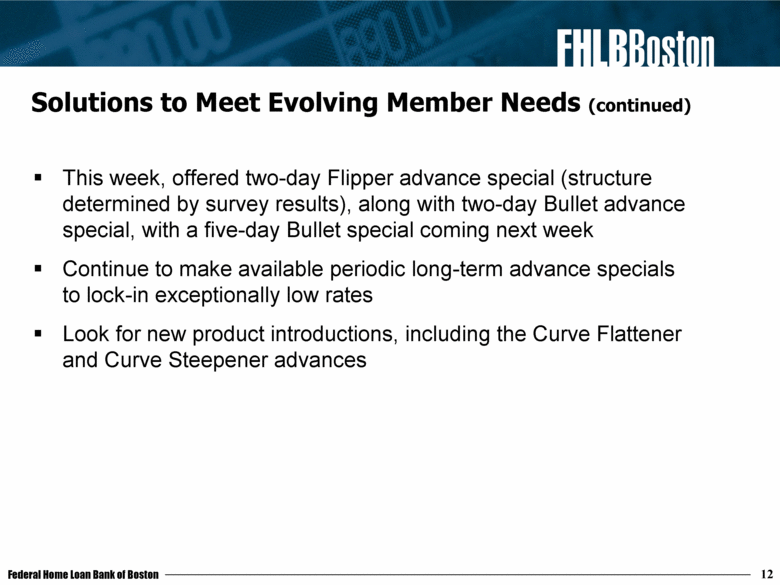
Solutions to Meet Evolving Member Needs (continued) This week, offered two-day Flipper advance special (structure determined by survey results), along with two-day Bullet advance special, with a five-day Bullet special coming next week Continue to make available periodic long-term advance specials to lock-in exceptionally low rates Look for new product introductions, including the Curve Flattener and Curve Steepener advances 12 |
|
|
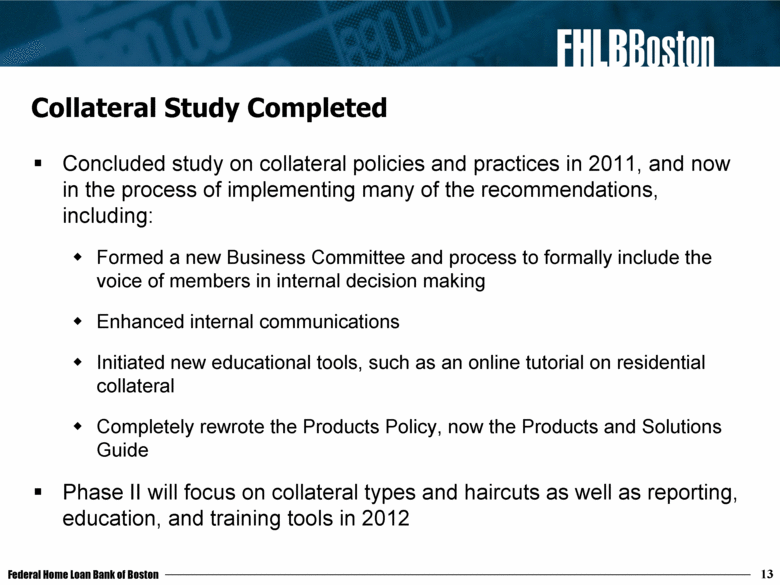
Collateral Study Completed Concluded study on collateral policies and practices in 2011, and now in the process of implementing many of the recommendations, including: Formed a new Business Committee and process to formally include the voice of members in internal decision making Enhanced internal communications Initiated new educational tools, such as an online tutorial on residential collateral Completely rewrote the Products Policy, now the Products and Solutions Guide Phase II will focus on collateral types and haircuts as well as reporting, education, and training tools in 2012 13 |
|
|
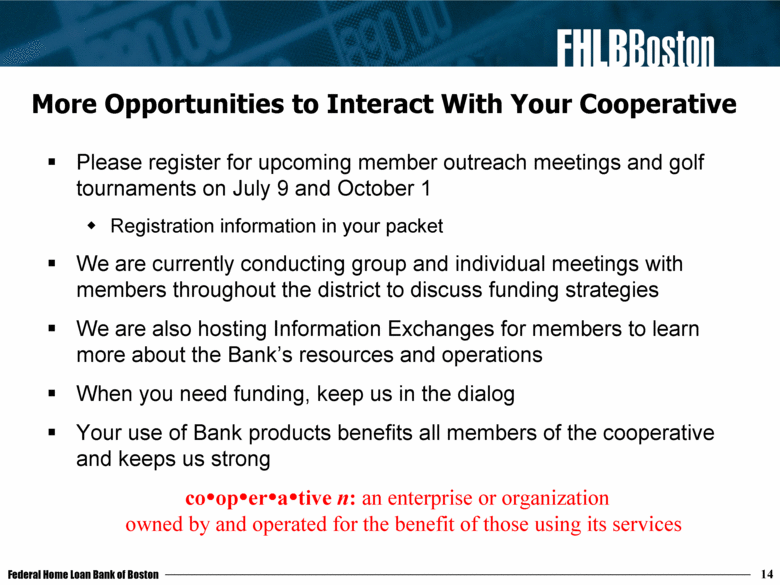
More Opportunities to Interact With Your Cooperative Please register for upcoming member outreach meetings and golf tournaments on July 9 and October 1 Registration information in your packet We are currently conducting group and individual meetings with members throughout the district to discuss funding strategies We are also hosting Information Exchanges for members to learn more about the Bank’s resources and operations When you need funding, keep us in the dialog Your use of Bank products benefits all members of the cooperative and keeps us strong cooperative n: an enterprise or organization owned by and operated for the benefit of those using its services 14 |
|
|
Financial Results 15 |
|
|
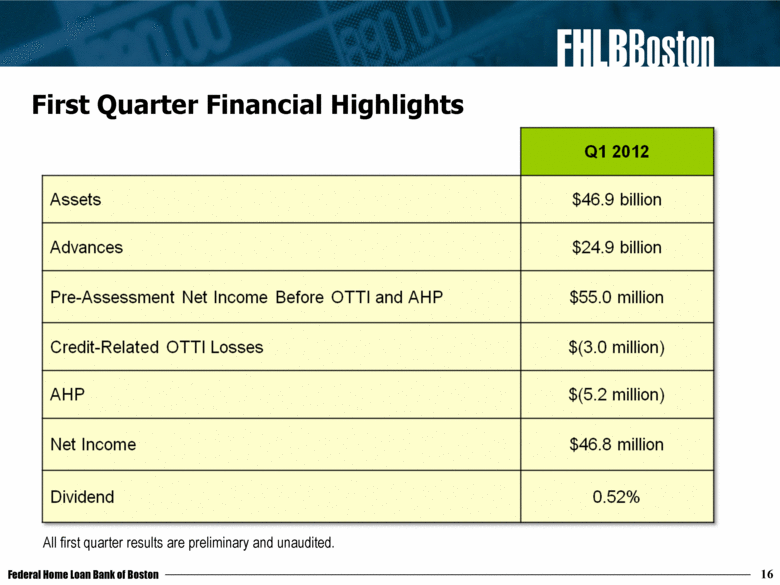
First Quarter Financial Highlights 16 All first quarter results are preliminary and unaudited. |
|
|
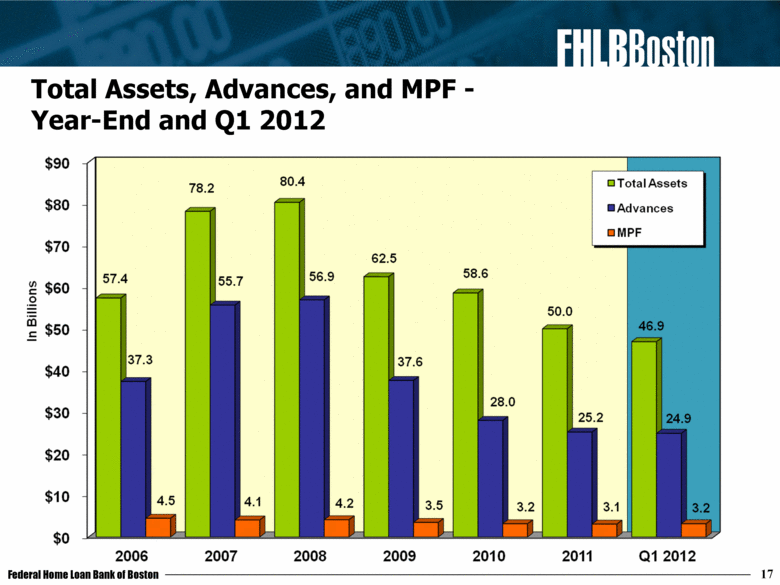
17 Total Assets, Advances, and MPF - Year-End and Q1 2012 |
|
|
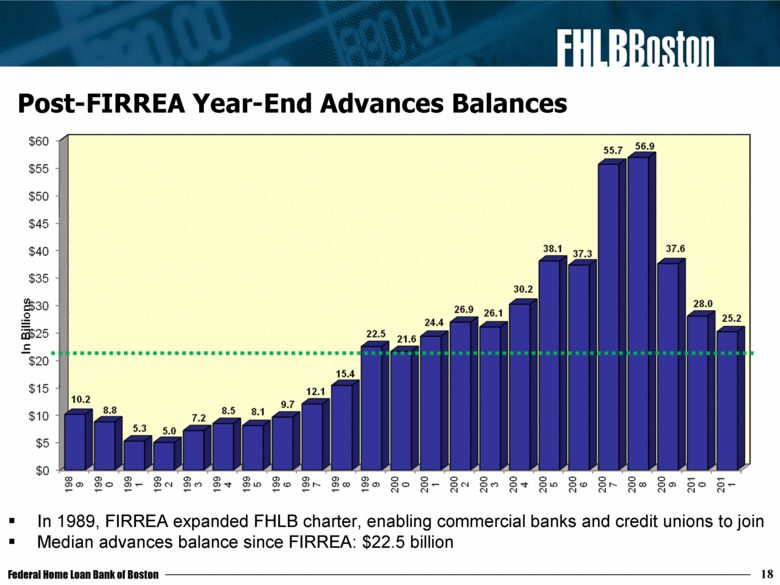
Post-FIRREA Year-End Advances Balances In 1989, FIRREA expanded FHLB charter, enabling commercial banks and credit unions to join Median advances balance since FIRREA: $22.5 billion 18 |
|
|
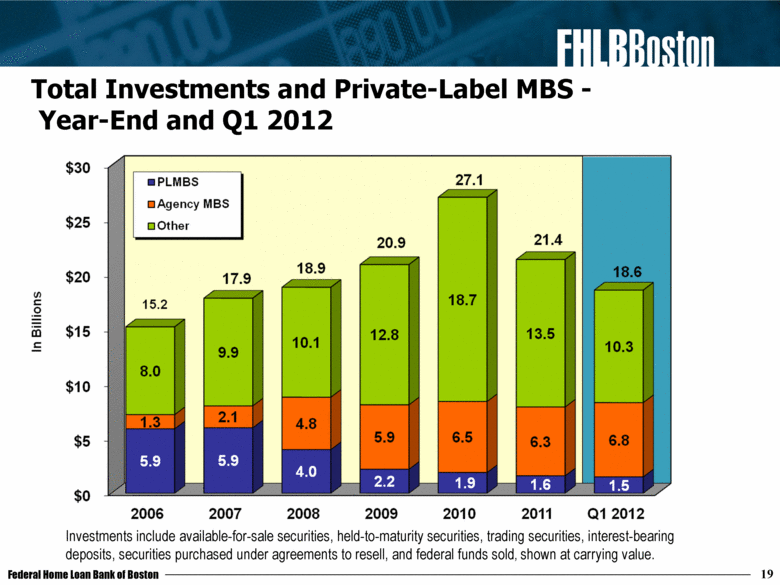
19 Total Investments and Private-Label MBS - Year-End and Q1 2012 Investments include available-for-sale securities, held-to-maturity securities, trading securities, interest-bearing deposits, securities purchased under agreements to resell, and federal funds sold, shown at carrying value. |
|
|
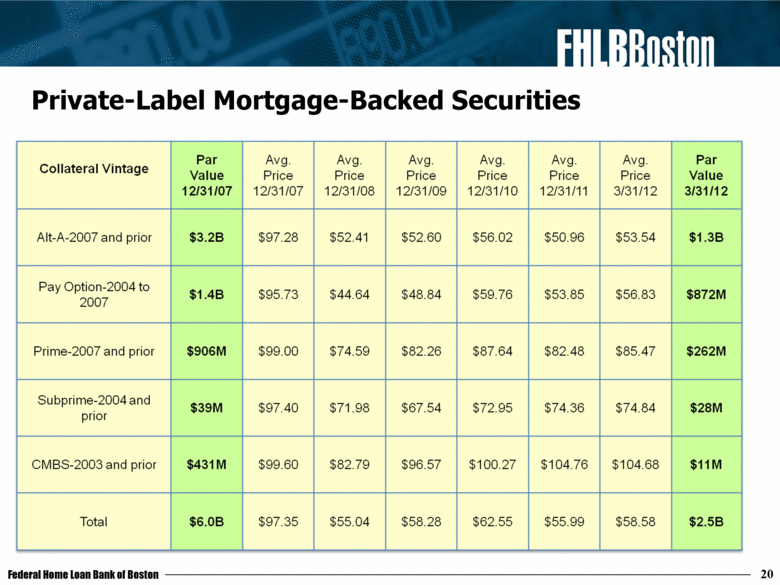
20 Private-Label Mortgage-Backed Securities |
|
|
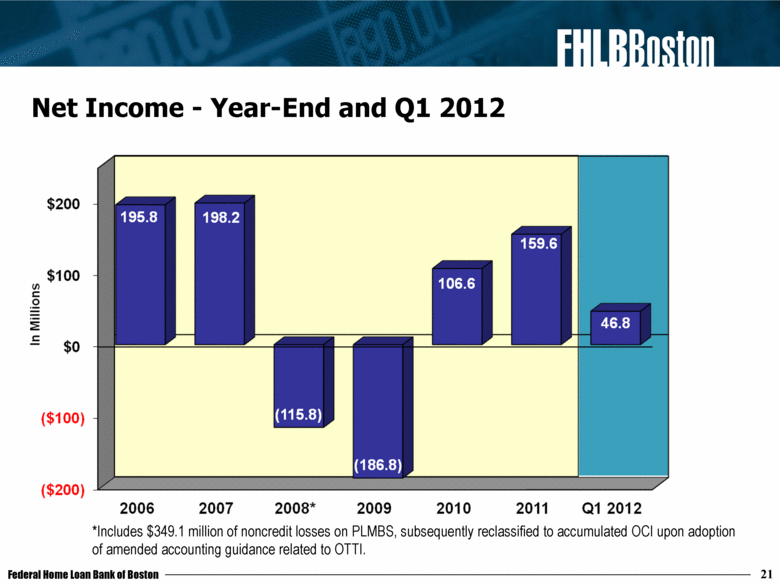
21 Net Income - Year-End and Q1 2012 *Includes $349.1 million of noncredit losses on PLMBS, subsequently reclassified to accumulated OCI upon adoption of amended accounting guidance related to OTTI. |
|
|
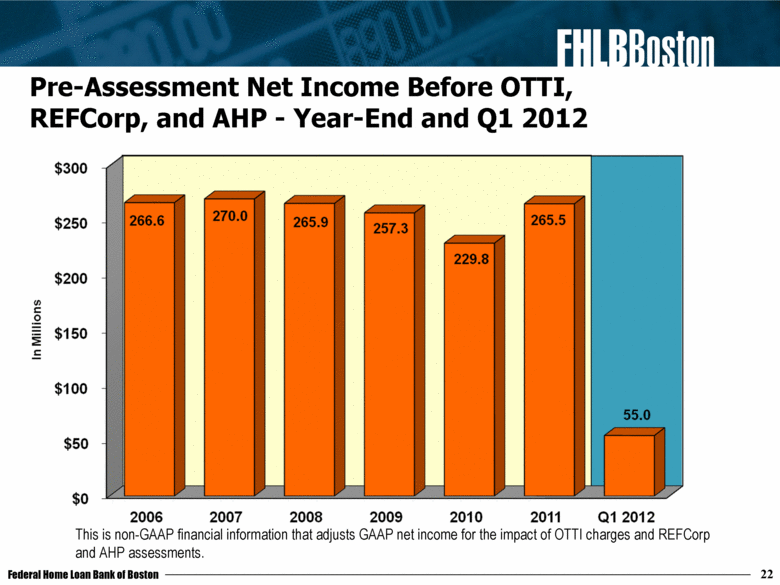
22 Pre-Assessment Net Income Before OTTI, REFCorp, and AHP - Year-End and Q1 2012 This is non-GAAP financial information that adjusts GAAP net income for the impact of OTTI charges and REFCorp and AHP assessments. |
|
|
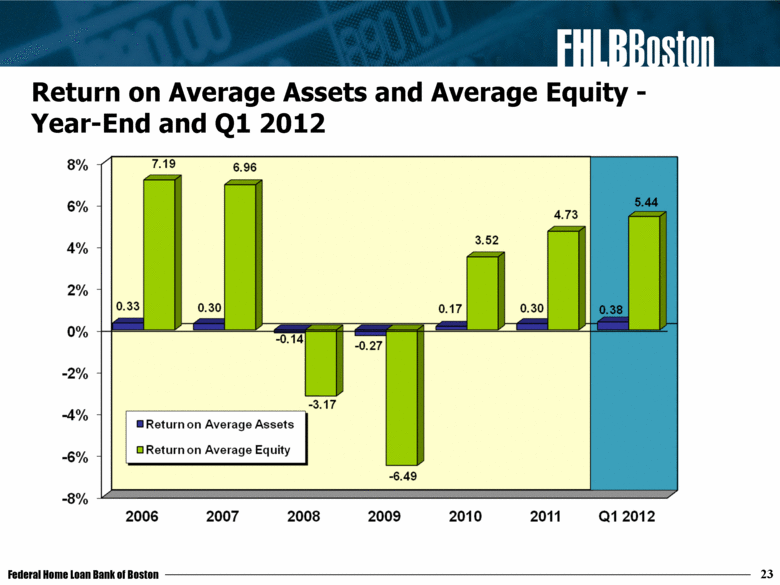
23 Return on Average Assets and Average Equity - Year-End and Q1 2012 |
|
|
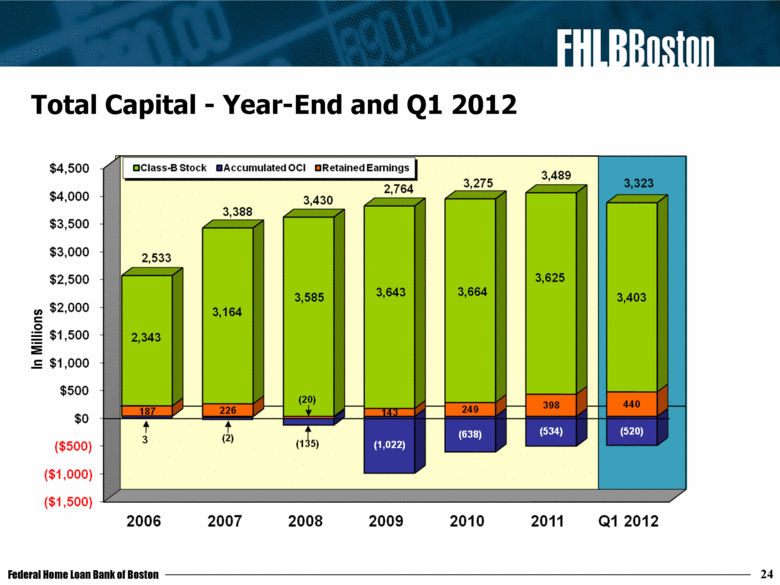
24 Total Capital - Year-End and Q1 2012 In Millions |
|
|
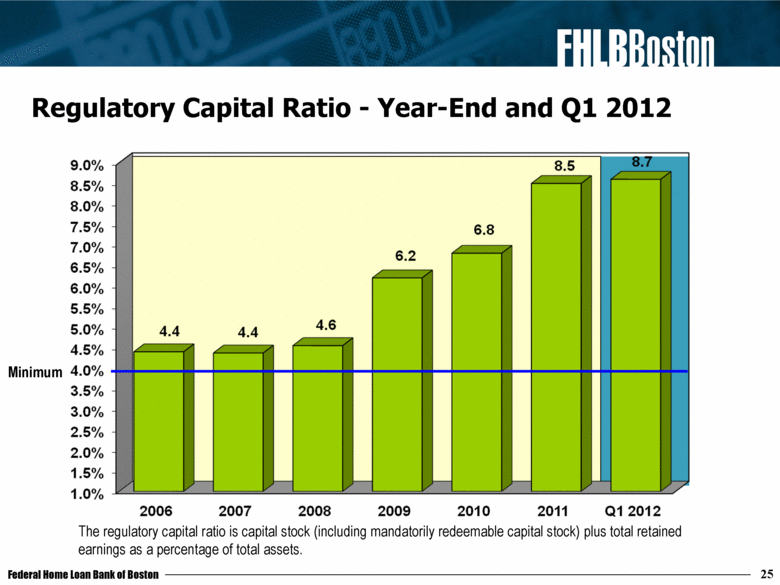
25 Regulatory Capital Ratio - Year-End and Q1 2012 Minimum The regulatory capital ratio is capital stock (including mandatorily redeemable capital stock) plus total retained earnings as a percentage of total assets. |
|
|
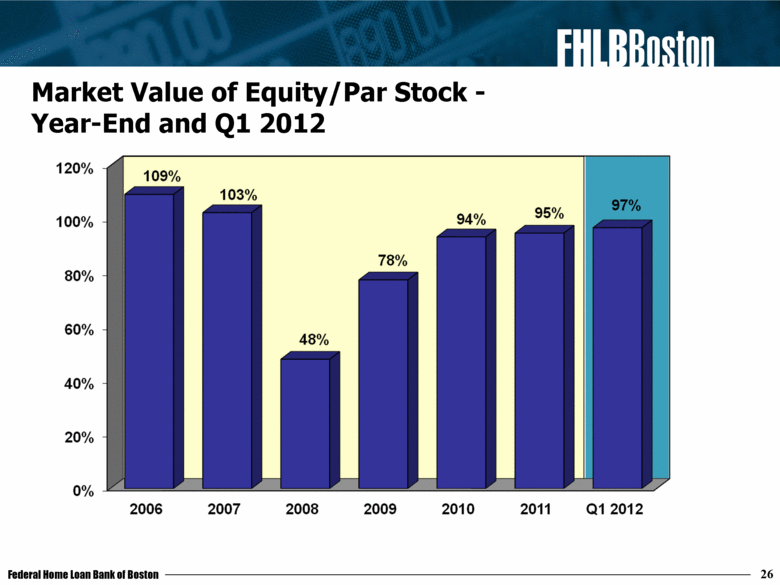
26 Market Value of Equity/Par Stock - Year-End and Q1 2012 |
|
|
Current Business Issues 27 |
|
|
Positioned for Stabilized Performance and a Strengthening Balance Sheet Ten consecutive quarters of positive net income achieved along with six quarters of dividend declarations Economy, interest rates, and private-label MBS continue to play important factors Investment risk declining, and retained earnings growth continues to be priority Objectives: Retained earnings to exceed negative AOCI Retained earnings to reach the board-approved target 28 |
|
|
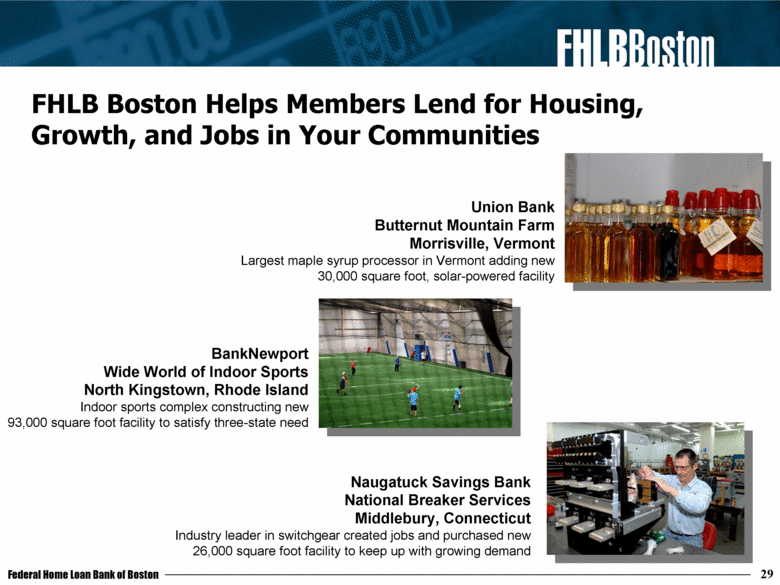
FHLB Boston Helps Members Lend for Housing, Growth, and Jobs in Your Communities 29 Union Bank Butternut Mountain Farm Morrisville, Vermont Largest maple syrup processor in Vermont adding new 30,000 square foot, solar-powered facility BankNewport Wide World of Indoor Sports North Kingstown, Rhode Island Indoor sports complex constructing new 93,000 square foot facility to satisfy three-state need Naugatuck Savings Bank National Breaker Services Middlebury, Connecticut Industry leader in switchgear created jobs and purchased new 26,000 square foot facility to keep up with growing demand |
|
|
Financial Reform Legislation Expect Congress to take up housing GSE reform after the election FHFA’s Strategic Plan for Fannie Mae and Freddie Mac Conservatorships would build secondary mortgage market infrastructure, shrink GSE presence in marketplace, and prevent foreclosures and ensure credit for new and refinanced mortgages National Association of Home Builders proposes creation of home-finance entities, including FHLBanks, to purchase and securitize mortgages Mortgage Bankers Association calls for housing to be a national policy priority and private capital to be the dominant source of mortgage credit, but with a governmental role Continue to monitor other legislative and regulatory issues Financial Stability Oversight Council’s proposed rulemaking on systemically important financial institutions Dodd-Frank derivative regulation Appreciate support of members and New England trade associations 30 |
|
|
Industry and Economic Outlook 31 |
|
|
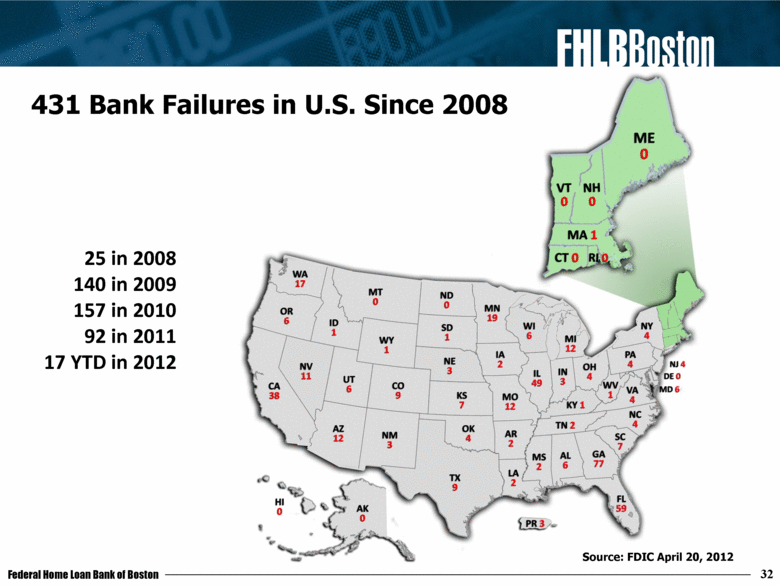
25 in 2008 140 in 2009 157 in 2010 92 in 2011 17 YTD in 2012 431 Bank Failures in U.S. Since 2008 32 Source: FDIC April 20, 2012 |
|
|
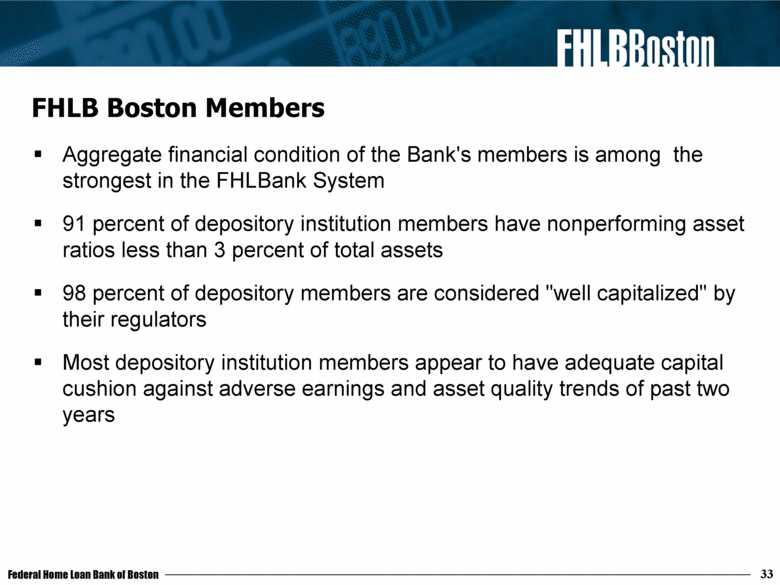
FHLB Boston Members Aggregate financial condition of the Bank's members is among the strongest in the FHLBank System 91 percent of depository institution members have nonperforming asset ratios less than 3 percent of total assets 98 percent of depository members are considered "well capitalized" by their regulators Most depository institution members appear to have adequate capital cushion against adverse earnings and asset quality trends of past two years 33 |
|
|
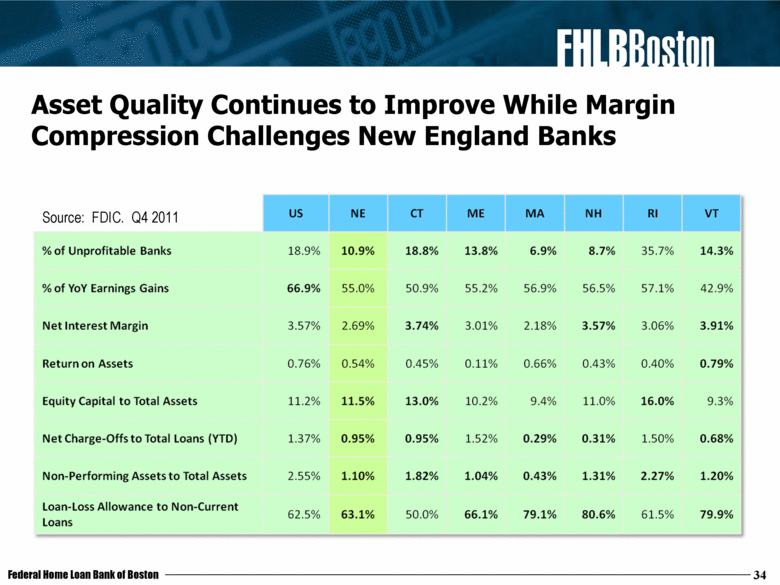
Source: FDIC. Q4 2011 34 Asset Quality Continues to Improve While Margin Compression Challenges New England Banks |
|
|
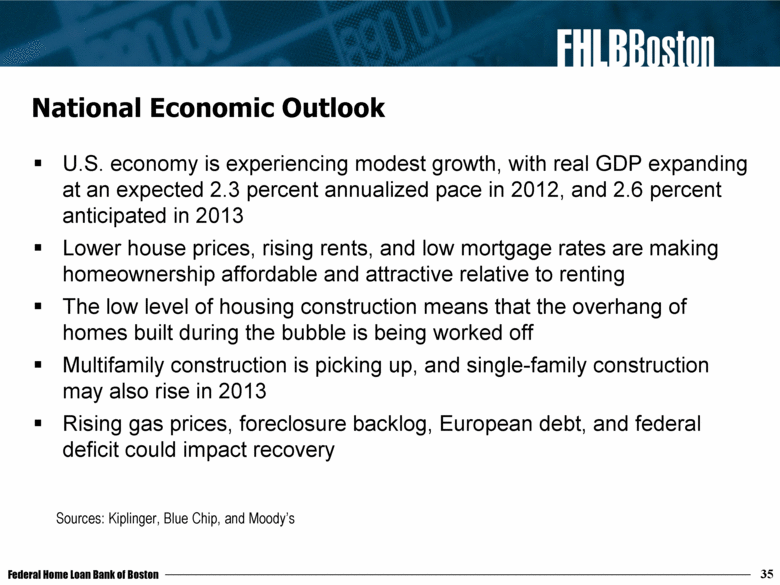
National Economic Outlook U.S. economy is experiencing modest growth, with real GDP expanding at an expected 2.3 percent annualized pace in 2012, and 2.6 percent anticipated in 2013 Lower house prices, rising rents, and low mortgage rates are making homeownership affordable and attractive relative to renting The low level of housing construction means that the overhang of homes built during the bubble is being worked off Multifamily construction is picking up, and single-family construction may also rise in 2013 Rising gas prices, foreclosure backlog, European debt, and federal deficit could impact recovery 35 Sources: Kiplinger, Blue Chip, and Moody’s |
|
|
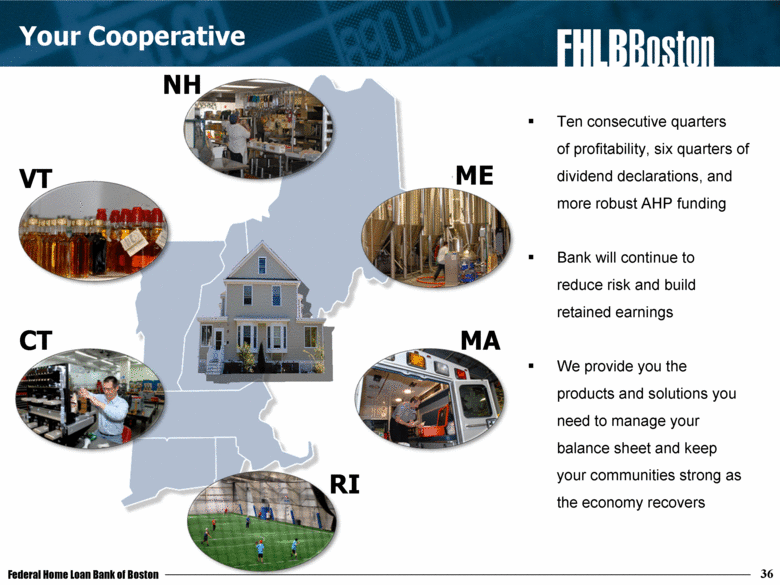
36 Your Cooperative Ten consecutive quarters of profitability, six quarters of dividend declarations, and more robust AHP funding Bank will continue to reduce risk and build retained earnings We provide you the products and solutions you need to manage your balance sheet and keep your communities strong as the economy recovers VT CT RI MA ME NH |
|
|
79th Annual Shareholders Meeting April 27, 2012 |

