Attached files
| file | filename |
|---|---|
| 8-K/A - 8-K/A QUARTERLY SUPPLEMENT - TANGER FACTORY OUTLET CENTERS, INC | a8-kasupplementrevision.htm |

Exhibit 99.2
Tanger Factory Outlet Centers, Inc.
Supplemental Operating and Financial Data
March 31, 2012
1
Supplemental Operating and Financial Data for the
Quarter Ended 3/31/12

Notice
For a more detailed discussion of the factors that affect our operating results, interested parties should review the Tanger Factory Outlet Centers, Inc. Annual Report on Form 10-K for the fiscal year ended December 31, 2011.
This Supplemental Operating and Financial Data is not an offer to sell or a solicitation to buy any securities of the Company. Any offers to sell or solicitations to buy any securities of the Company shall be made only by means of a prospectus.
2
Supplemental Operating and Financial Data for the
Quarter Ended 3/31/12
Table of Contents
Section | ||
Portfolio Data: | ||
Geographic Diversification | 4 | |
Property Summary - Occupancy at End of Each Period Shown | 5 | |
Portfolio Occupancy at the End of Each Period | 7 | |
Major Tenants | 8 | |
Lease Expirations as of March 31, 2012 | 9 | |
Leasing Activity | 10 | |
Financial Data: | ||
Consolidated Balance Sheets | 11 | |
Consolidated Statements of Operations | 12 | |
FFO and FAD Analysis | 13 | |
Unconsolidated Joint Venture Information | 14 | |
Debt Outstanding Summary | 16 | |
Future Scheduled Principal Payments | 17 | |
Senior Unsecured Notes Financial Covenants | 17 | |
Investor Information | 18 | |
3
Supplemental Operating and Financial Data for the
Quarter Ended 3/31/12
Geographic Diversification
As of March 31, 2012 | ||||||||
State | # of Centers | GLA | % of GLA | |||||
South Carolina | 5 | 1,576,873 | 15 | % | ||||
Pennsylvania | 3 | 874,422 | 8 | % | ||||
New York | 1 | 729,736 | 7 | % | ||||
Georgia | 2 | 668,780 | 6 | % | ||||
Texas | 2 | 619,729 | 6 | % | ||||
Delaware | 1 | 568,975 | 5 | % | ||||
Alabama | 1 | 557,228 | 5 | % | ||||
North Carolina | 3 | 505,242 | 5 | % | ||||
New Jersey | 1 | 489,762 | 4 | % | ||||
Michigan | 2 | 437,202 | 4 | % | ||||
Tennessee | 1 | 419,038 | 4 | % | ||||
Ohio | 1 | 409,820 | 4 | % | ||||
Missouri | 1 | 302,922 | 3 | % | ||||
Utah | 1 | 298,379 | 3 | % | ||||
Connecticut | 1 | 289,950 | 3 | % | ||||
Louisiana | 1 | 282,403 | 3 | % | ||||
Iowa | 1 | 277,230 | 2 | % | ||||
Oregon | 1 | 270,212 | 2 | % | ||||
Illinois | 1 | 250,439 | 2 | % | ||||
New Hampshire | 1 | 245,698 | 2 | % | ||||
Maryland | 1 | 199,243 | 2 | % | ||||
Florida | 1 | 198,877 | 2 | % | ||||
California | 1 | 171,300 | 2 | % | ||||
Maine | 2 | 82,286 | 1 | % | ||||
Total (1) | 36 | 10,725,746 | 100 | % | ||||
(1) | Excludes two unconsolidated outlet centers in which Tanger has a 50% ownership interest (a 265,086 square foot center in Wisconsin Dells, Wisconsin and a 157,382 square foot center in Cookstown, Ontario). Also, excludes one 741,976 square foot shopping center and one 29,253 square foot warehouse in Deer Park, New York, in which Tanger has a 33.3% ownership interest through unconsolidated joint ventures. |
4
Supplemental Operating and Financial Data for the
Quarter Ended 3/31/12
Property Summary - Occupancy at End of Each Period Shown
Consolidated properties | |||||||||||||||||
Location | Total GLA 3/31/12 | % Occupied 3/31/12 | % Occupied 12/31/11 | % Occupied 9/30/11 | % Occupied 6/30/11 | % Occupied 3/31/11 | |||||||||||
Riverhead, NY | 729,736 | 98 | % | 99 | % | 99 | % | 100 | % | 98 | % | ||||||
Rehoboth Beach, DE | 568,975 | 100 | % | 100 | % | 99 | % | 98 | % | 99 | % | ||||||
Foley, AL | 557,228 | 98 | % | 97 | % | 96 | % | 98 | % | 98 | % | ||||||
Atlantic City, NJ (2) | 489,762 | 98 | % | 99 | % | 99 | % | N/A | N/A | ||||||||
San Marcos, TX | 441,929 | 99 | % | 100 | % | 100 | % | 97 | % | 95 | % | ||||||
Myrtle Beach Hwy 501, SC | 425,247 | 97 | % | 99 | % | 98 | % | 99 | % | 92 | % | ||||||
Sevierville, TN | 419,038 | 99 | % | 100 | % | 100 | % | 100 | % | 100 | % | ||||||
Jeffersonville, OH (3) | 409,820 | 95 | % | 99 | % | 99 | % | 99 | % | N/A | |||||||
Myrtle Beach Hwy 17, SC | 402,791 | 99 | % | 99 | % | 99 | % | 97 | % | 96 | % | ||||||
Washington, PA | 372,972 | 98 | % | 99 | % | 99 | % | 99 | % | 99 | % | ||||||
Commerce II, GA | 370,512 | 98 | % | 100 | % | 100 | % | 99 | % | 99 | % | ||||||
Charleston, SC | 365,107 | 97 | % | 99 | % | 99 | % | 93 | % | 92 | % | ||||||
Howell, MI | 324,632 | 97 | % | 98 | % | 98 | % | 98 | % | 99 | % | ||||||
Mebane, NC | 318,910 | 100 | % | 100 | % | 99 | % | 100 | % | 99 | % | ||||||
Branson, MO | 302,922 | 98 | % | 100 | % | 100 | % | 98 | % | 98 | % | ||||||
Park City, UT | 298,379 | 99 | % | 100 | % | 100 | % | 100 | % | 100 | % | ||||||
Locust Grove, GA | 298,268 | 98 | % | 100 | % | 100 | % | 99 | % | 99 | % | ||||||
Westbrook, CT | 289,950 | 98 | % | 100 | % | 98 | % | 98 | % | 92 | % | ||||||
Gonzales, LA | 282,403 | 99 | % | 100 | % | 99 | % | 99 | % | 95 | % | ||||||
Williamsburg, IA | 277,230 | 98 | % | 99 | % | 99 | % | 97 | % | 96 | % | ||||||
Lincoln City, OR | 270,212 | 95 | % | 96 | % | 95 | % | 98 | % | 99 | % | ||||||
Lancaster, PA | 254,002 | 100 | % | 100 | % | 100 | % | 100 | % | 98 | % | ||||||
Tuscola, IL | 250,439 | 90 | % | 90 | % | 90 | % | 87 | % | 86 | % | ||||||
Hershey, PA (4) | 247,448 | 97 | % | 100 | % | 100 | % | N/A | N/A | ||||||||
Tilton, NH | 245,698 | 99 | % | 100 | % | 100 | % | 100 | % | 99 | % | ||||||
Hilton Head II, SC | 206,529 | 100 | % | 98 | % | 96 | % | 98 | % | 98 | % | ||||||
Ocean City, MD (2) | 199,243 | 91 | % | 92 | % | 92 | % | N/A | N/A | ||||||||
Fort Myers, FL | 198,877 | 92 | % | 92 | % | 85 | % | 85 | % | 90 | % | ||||||
Terrell, TX | 177,800 | 94 | % | 94 | % | 94 | % | 94 | % | 94 | % | ||||||
Hilton Head I, SC (5) | 177,199 | 100 | % | 98 | % | 96 | % | 96 | % | 82 | % | ||||||
Barstow, CA | 171,300 | 100 | % | 100 | % | 100 | % | 100 | % | 100 | % | ||||||
West Branch, MI | 112,570 | 96 | % | 96 | % | 100 | % | 100 | % | 98 | % | ||||||
Blowing Rock, NC | 104,154 | 98 | % | 100 | % | 100 | % | 100 | % | 100 | % | ||||||
Nags Head, NC | 82,178 | 100 | % | 100 | % | 100 | % | 100 | % | 95 | % | ||||||
Kittery I, ME | 57,667 | 100 | % | 100 | % | 100 | % | 93 | % | 89 | % | ||||||
Kittery II, ME | 24,619 | 100 | % | 100 | % | 100 | % | 100 | % | 100 | % | ||||||
Total | 10,725,746 | 97 | % | 99 | % | 98% (1) | 98% (1) | 97% (1) | |||||||||
Unconsolidated joint venture properties | |||||||||||||||||
Deer Park, NY (6) | 771,229 | 91 | % | 90 | % | 89 | % | 88 | % | 85 | % | ||||||
Wisconsin Dells, WI | 265,086 | 98 | % | 98 | % | 98 | % | 99 | % | 98 | % | ||||||
Cookstown, ON (7) | 157,382 | 91 | % | 100 | % | N/A | N/A | N/A | |||||||||
5
Supplemental Operating and Financial Data for the
Quarter Ended 3/31/12
(1) | Excludes the occupancy rate at our Hilton Head I, South Carolina center which opened March 31, 2011 and had not |
yet stabilized.
(2) | Center acquired in July 2011. |
(3) | Center acquired in June 2011. |
(4) | Center acquired in September 2011. |
(5) | Center opened on March 31, 2011. |
(6) | Includes a 29,253 square foot warehouse adjacent to the shopping center. |
(7) | Center acquired in December 2011 and located in Ontario, Canada. |
6
Supplemental Operating and Financial Data for the
Quarter Ended 3/31/12
Portfolio Occupancy at the End of Each Period (1)
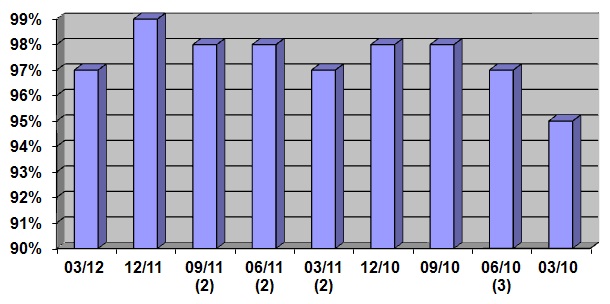
(1) | Excludes two unconsolidated outlet centers in which Tanger has a 50% ownership interest (a 265,086 square foot center in Wisconsin Dells, WI and a 157,382 square foot center in Cookstown, ON). Also, excludes one 741,976 square foot shopping center and one 29,253 square foot warehouse in Deer Park, NY, in which Tanger has a 33.3% ownership interest through unconsolidated joint ventures. |
(2) | Excludes the occupancy rate at our Hilton Head I, SC center which opened during the first quarter of 2011 and had not yet stabilized. |
(3) | Excludes the occupancy rate at our Commerce I, Georgia center which was held for sale as of June 30, 2010 and subsequently sold on July 7, 2010. |
7
Supplemental Operating and Financial Data for the
Quarter Ended 3/31/12
Major Tenants (1)
Ten Largest Tenants As of March 31, 2012 | ||||||||
Tenant | # of Stores | GLA | % of Total GLA | |||||
The Gap, Inc. | 79 | 859,519 | 8.0 | % | ||||
Phillips-Van Heusen | 133 | 685,900 | 6.4 | % | ||||
Dress Barn, Inc. | 62 | 379,600 | 3.5 | % | ||||
Nike | 34 | 364,887 | 3.4 | % | ||||
Adidas | 43 | 333,792 | 3.1 | % | ||||
VF Outlet, Inc. | 32 | 323,049 | 3.0 | % | ||||
Ann Taylor | 42 | 295,371 | 2.8 | % | ||||
Polo Ralph Lauren | 29 | 286,851 | 2.7 | % | ||||
Carter's | 59 | 276,641 | 2.6 | % | ||||
Hanesbrands Direct, LLC | 43 | 245,663 | 2.3 | % | ||||
Total of All Listed Above | 556 | 4,051,273 | 37.8 | % | ||||
(1) | Excludes two unconsolidated outlet centers in which Tanger has a 50% ownership interest (a 265,086 square foot center in Wisconsin Dells, WI and a 157,382 square foot center in Cookstown, ON). Also, excludes one 741,976 square foot shopping center and one 29,253 square foot warehouse in Deer Park, NY, in which Tanger has a 33.3% ownership interest through unconsolidated joint ventures. |
8
Supplemental Operating and Financial Data for the
Quarter Ended 3/31/12
Lease Expirations as of March 31, 2012
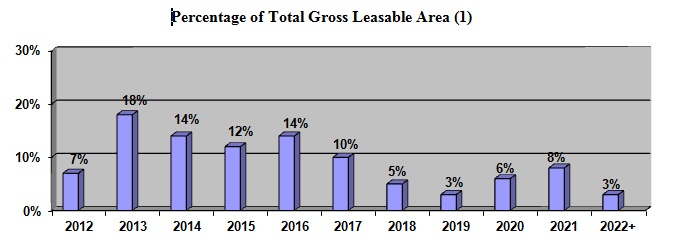
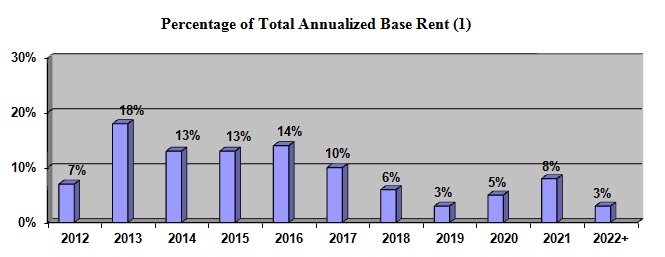
(1) Excludes two unconsolidated outlet centers in which Tanger has a 50% ownership interest (a 265,086 square foot center in Wisconsin Dells, WI and a 157,382 square foot center in Cookstown, ON). Also, excludes one 741,976 square foot shopping center and one 29,253 square foot warehouse in Deer Park, NY, in which Tanger has a 33.3% ownership interest through unconsolidated joint ventures.
9
Supplemental Operating and Financial Data for the
Quarter Ended 3/31/12
Leasing Activity (1)
3/31/2012 | 6/30/2012 | 9/30/2012 | 12/31/2012 | Year to Date | Prior Year to Date | ||||||||||||
Re-tenanted Space: | |||||||||||||||||
Number of leases | 60 | 60 | 96 | ||||||||||||||
Gross leasable area | 220,237 | 220,237 | 336,269 | ||||||||||||||
New initial base rent per square foot | $ | 30.01 | $ | 30.01 | $ | 25.9 | |||||||||||
Prior expiring base rent per square foot | $ | 20.84 | $ | 20.84 | $ | 19.27 | |||||||||||
Percent increase | 44.0 | % | 44.0 | % | 34.4 | % | |||||||||||
New straight line base rent per square foot | $ | 32.53 | $ | 32.53 | $ | 28.26 | |||||||||||
Prior straight line base rent per square foot | $ | 20.6 | $ | 20.60 | $ | 18.85 | |||||||||||
Percent increase | 57.9 | % | 57.9 | % | 49.9 | % | |||||||||||
Renewed Space: | |||||||||||||||||
Number of leases | 188 | 188 | 180 | ||||||||||||||
Gross leasable area | 920,436 | 920,436 | 932,095 | ||||||||||||||
New initial base rent per square foot | $ | 21.27 | $ | 21.27 | $ | 20.15 | |||||||||||
Prior expiring base rent per square foot | $ | 19.38 | $ | 19.38 | $ | 18.44 | |||||||||||
Percent increase | 9.7 | % | 9.7 | % | 9.3 | % | |||||||||||
New straight line base rent per square foot | $ | 21.97 | $ | 21.97 | $ | 20.73 | |||||||||||
Prior straight line base rent per square foot | $ | 19.18 | $ | 19.18 | $ | 17.88 | |||||||||||
Percent increase | 14.5 | % | 14.5 | % | 16.0 | % | |||||||||||
Total Re-tenanted and Renewed Space: | |||||||||||||||||
Number of leases | 248 | 248 | 276 | ||||||||||||||
Gross leasable area | 1,140,673 | 1,140,673 | 1,268,364 | ||||||||||||||
New initial base rent per square foot | $ | 22.96 | $ | 22.96 | $ | 21.67 | |||||||||||
Prior expiring base rent per square foot | $ | 19.66 | $ | 19.66 | $ | 18.66 | |||||||||||
Percent increase | 16.7 | % | 16.7 | % | 16.1 | % | |||||||||||
New straight line base rent per square foot | $ | 24.01 | $ | 24.01 | $ | 22.73 | |||||||||||
Prior straight line base rent per square foot | $ | 19.46 | $ | 19.46 | $ | 18.14 | |||||||||||
Percent increase | 23.4 | % | 23.4 | % | 25.3 | % | |||||||||||
(1) | Excludes two unconsolidated outlet centers in which Tanger has a 50% ownership interest (a 265,086 square foot center in Wisconsin Dells, WI and a 157,382 square foot center in Cookstown, ON). Also, excludes one 741,976 square foot shopping center and one 29,253 square foot warehouse in Deer Park, NY, in which Tanger has a 33.3% ownership interest through unconsolidated joint ventures. |
10
Supplemental Operating and Financial Data for the
Quarter Ended 3/31/12
Consolidated Balance Sheets (dollars in thousands)
3/31/2012 | 12/31/2011 | 9/30/2011 | 6/30/2011 | 3/31/2011 | |||||||||||||||
Assets | |||||||||||||||||||
Rental property | |||||||||||||||||||
Land | $ | 148,002 | $ | 148,002 | $ | 148,002 | $ | 144,329 | $ | 141,577 | |||||||||
Buildings | 1,773,055 | 1,764,494 | 1,747,149 | 1,560,920 | 1,441,260 | ||||||||||||||
Construction in progress | 4,545 | 3,549 | 1,800 | 3,367 | 2,590 | ||||||||||||||
Total rental property | 1,925,602 | 1,916,045 | 1,896,951 | 1,708,616 | 1,585,427 | ||||||||||||||
Accumulated depreciation | (530,150 | ) | (512,485 | ) | (494,518 | ) | (477,687 | ) | (462,942 | ) | |||||||||
Total rental property - net | 1,395,452 | 1,403,560 | 1,402,433 | 1,230,929 | 1,122,485 | ||||||||||||||
Cash and cash equivalents | 10,787 | 7,894 | 3,694 | 18,438 | 731 | ||||||||||||||
Investments in unconsolidated joint ventures, net | 48,483 | 28,481 | 9,447 | 4,592 | 5,861 | ||||||||||||||
Deferred lease costs and other intangibles, net | 115,157 | 120,636 | 120,933 | 56,166 | 32,704 | ||||||||||||||
Deferred debt origination costs, net | 10,775 | 8,861 | 6,327 | 6,783 | 7,165 | ||||||||||||||
Prepaids and other assets | 54,304 | 52,383 | 50,856 | 50,681 | 49,298 | ||||||||||||||
Total assets | $ | 1,634,958 | $ | 1,621,815 | $ | 1,593,690 | $ | 1,367,589 | $ | 1,218,244 | |||||||||
Liabilities and equity | |||||||||||||||||||
Liabilities | |||||||||||||||||||
Debt | |||||||||||||||||||
Senior, unsecured notes, net of discounts | $ | 547,829 | $ | 547,763 | $ | 547,698 | $ | 554,644 | $ | 554,670 | |||||||||
Senior, unsecured term loans, net of discounts | 259,344 | 9,308 | — | — | — | ||||||||||||||
Senior, unsecured bridge loan | — | — | 150,000 | 150,000 | — | ||||||||||||||
Mortgages payable, including premiums | 110,483 | 111,379 | 112,235 | — | — | ||||||||||||||
Unsecured lines of credit | 121,073 | 357,092 | 172,300 | 182,000 | 166,300 | ||||||||||||||
Total debt | 1,038,729 | 1,025,542 | 982,233 | 886,644 | 720,970 | ||||||||||||||
Construction trade payables | 15,698 | 13,656 | 19,331 | 27,333 | 30,984 | ||||||||||||||
Accounts payable & accruals | 43,165 | 37,757 | 44,127 | 27,129 | 33,503 | ||||||||||||||
Other liabilities | 16,399 | 16,428 | 16,249 | 16,170 | 16,409 | ||||||||||||||
Total liabilities | 1,113,991 | 1,093,383 | 1,061,940 | 957,276 | 801,866 | ||||||||||||||
Commitments and Contingencies | |||||||||||||||||||
Equity | |||||||||||||||||||
Tanger Factory Outlet Centers, Inc. equity | |||||||||||||||||||
Common shares | 926 | 867 | 867 | 813 | 813 | ||||||||||||||
Paid in capital | 751,633 | 720,073 | 718,318 | 607,756 | 606,121 | ||||||||||||||
Accumulated distributions in excess of net income | (271,941 | ) | (261,913 | ) | (257,930 | ) | (253,213 | ) | (246,372 | ) | |||||||||
Accumulated other comprehensive income | 1,449 | 1,535 | 1,516 | 1,683 | 1,754 | ||||||||||||||
Equity attributable to Tanger Factory Outlet Centers, Inc. | 482,067 | 460,562 | 462,771 | 357,039 | 362,316 | ||||||||||||||
Equity attributable to noncontrolling interests: | |||||||||||||||||||
Noncontrolling interests in Operating Partnership | 32,068 | 61,027 | 61,344 | 53,274 | 54,062 | ||||||||||||||
Noncontrolling interest in other consolidated partnerships | 6,832 | 6,843 | 7,635 | — | — | ||||||||||||||
Total equity | 520,967 | 528,432 | 531,750 | 410,313 | 416,378 | ||||||||||||||
Total liabilities and equity | $ | 1,634,958 | $ | 1,621,815 | $ | 1,593,690 | $ | 1,367,589 | $ | 1,218,244 | |||||||||
11
Supplemental Operating and Financial Data for the
Quarter Ended 3/31/12
Consolidated Statements of Operations (dollars and shares in thousands)
Three Months Ended | YTD | ||||||||||||||||||||||||||
3/31/12 | 12/31/11 | 9/30/11 | 6/30/11 | 3/31/11 | 3/31/12 | 3/31/11 | |||||||||||||||||||||
Revenues | |||||||||||||||||||||||||||
Base rentals | $ | 57,219 | $ | 58,007 | $ | 55,018 | $ | 48,393 | $ | 46,219 | $ | 57,219 | $ | 46,219 | |||||||||||||
Percentage rentals | 1,744 | 3,872 | 2,684 | 1,137 | 1,391 | 1,744 | 1,391 | ||||||||||||||||||||
Expense reimbursements | 23,476 | 24,826 | 22,973 | 20,616 | 21,205 | 23,476 | 21,205 | ||||||||||||||||||||
Other income | 1,804 | 2,435 | 2,568 | 1,955 | 1,924 | 1,804 | 1,924 | ||||||||||||||||||||
Total revenues | 84,243 | 89,140 | 83,243 | 72,101 | 70,739 | 84,243 | 70,739 | ||||||||||||||||||||
Expenses | |||||||||||||||||||||||||||
Property operating | 26,088 | 27,192 | 25,181 | 23,765 | 24,108 | 26,088 | 24,108 | ||||||||||||||||||||
General & administrative | 10,020 | 8,237 | 7,943 | 7,185 | 6,767 | 10,020 | 6,767 | ||||||||||||||||||||
Acquisition costs | — | 217 | 978 | 974 | 567 | — | 567 | ||||||||||||||||||||
Abandoned development costs | — | — | — | — | 158 | — | 158 | ||||||||||||||||||||
Depreciation and amortization | 25,515 | 25,228 | 22,964 | 17,858 | 17,965 | 25,515 | 17,965 | ||||||||||||||||||||
Total expenses | 61,623 | 60,874 | 57,066 | 49,782 | 49,565 | 61,623 | 49,565 | ||||||||||||||||||||
Operating income | 22,620 | 28,266 | 26,177 | 22,319 | 21,174 | 22,620 | 21,174 | ||||||||||||||||||||
Interest expense | 12,334 | 12,386 | 11,958 | 10,713 | 10,325 | 12,334 | 10,325 | ||||||||||||||||||||
Income before equity in losses of unconsolidated joint ventures | 10,286 | 15,880 | 14,219 | 11,606 | 10,849 | 10,286 | 10,849 | ||||||||||||||||||||
Equity in losses of unconsolidated joint ventures | (1,452 | ) | (742 | ) | (27 | ) | (764 | ) | (32 | ) | (1,452 | ) | (32 | ) | |||||||||||||
Net income | 8,834 | 15,138 | 14,192 | 10,842 | 10,817 | 8,834 | 10,817 | ||||||||||||||||||||
Noncontrolling interests in Operating Partnership | (713 | ) | (1,787 | ) | (1,730 | ) | (1,420 | ) | (1,419 | ) | (713 | ) | (1,419 | ) | |||||||||||||
Noncontrolling interests in other consolidated partnerships | 7 | 6 | 2 | — | — | 7 | — | ||||||||||||||||||||
Net income attributable to the Company | 8,128 | 13,357 | 12,464 | 9,422 | 9,398 | 8,128 | 9,398 | ||||||||||||||||||||
Allocation to participating securities | (158 | ) | (163 | ) | (164 | ) | (165 | ) | (192 | ) | (158 | ) | (192 | ) | |||||||||||||
Net income available to common shareholders | $ | 7,970 | $ | 13,194 | $ | 12,300 | $ | 9,257 | $ | 9,206 | $ | 7,970 | $ | 9,206 | |||||||||||||
Basic earnings per common share: | |||||||||||||||||||||||||||
Net income | $ | 0.09 | $ | 0.15 | $ | 0.14 | $ | 0.11 | $ | 0.11 | $ | 0.09 | $ | 0.11 | |||||||||||||
Diluted earnings per common share: | |||||||||||||||||||||||||||
Net income | $ | 0.09 | $ | 0.15 | $ | 0.14 | $ | 0.11 | $ | 0.11 | $ | 0.09 | $ | 0.11 | |||||||||||||
Weighted average common shares: | |||||||||||||||||||||||||||
Basic | 89,671 | 85,891 | 85,171 | 80,483 | 80,353 | 89,671 | 80,353 | ||||||||||||||||||||
Diluted | 90,832 | 86,917 | 85,992 | 81,104 | 80,552 | 90,832 | 80,552 | ||||||||||||||||||||
12
Supplemental Operating and Financial Data for the
Quarter Ended 3/31/12
FFO and FAD Analysis (dollars and shares in thousands)
Three Months Ended | YTD | ||||||||||||||||||||||||||
3/31/12 | 12/31/11 | 9/30/11 | 6/30/11 | 3/31/11 | 3/31/12 | 3/31/11 | |||||||||||||||||||||
Funds from operations: | |||||||||||||||||||||||||||
Net income | $ | 8,834 | $ | 15,138 | $ | 14,192 | $ | 10,842 | $ | 10,817 | $ | 8,834 | $ | 10,817 | |||||||||||||
Adjusted for - | |||||||||||||||||||||||||||
Depreciation and amortization uniquely significant to real estate - consolidated properties | 25,301 | 25,019 | 22,763 | 17,686 | 17,807 | 25,301 | 17,807 | ||||||||||||||||||||
Depreciation and amortization uniquely significant to real estate - unconsolidated joint ventures | 1,815 | 1,253 | 1,280 | 1,336 | 1,306 | 1,815 | 1,306 | ||||||||||||||||||||
Impairment charge - unconsolidated joint ventures | — | 300 | — | — | — | — | — | ||||||||||||||||||||
Funds from operations | 35,950 | 41,710 | 38,235 | 29,864 | 29,930 | 35,950 | 29,930 | ||||||||||||||||||||
FFO attributable to noncontrolling interests in other consolidated partnerships | (2 | ) | (18 | ) | (19 | ) | — | — | (2 | ) | — | ||||||||||||||||
Allocation to participating securities | (308 | ) | (345 | ) | (320 | ) | (264 | ) | (310 | ) | (308 | ) | (310 | ) | |||||||||||||
Funds from operations available to common shareholders | $ | 35,640 | $ | 41,347 | $ | 37,896 | $ | 29,600 | $ | 29,620 | $ | 35,640 | $ | 29,620 | |||||||||||||
Funds from operations per share | $ | 0.36 | $ | 0.42 | $ | 0.39 | $ | 0.32 | $ | 0.32 | $ | 0.36 | $ | 0.32 | |||||||||||||
Funds available for distribution to common shareholders: | |||||||||||||||||||||||||||
Funds from operations | $ | 35,640 | $ | 41,347 | $ | 37,896 | $ | 29,600 | $ | 29,620 | $ | 35,640 | $ | 29,620 | |||||||||||||
Adjusted for - | |||||||||||||||||||||||||||
Corporate depreciation excluded above | 214 | 209 | 201 | 172 | 158 | 214 | 158 | ||||||||||||||||||||
Amortization of finance costs | 561 | 603 | 592 | 482 | 466 | 561 | 466 | ||||||||||||||||||||
Amortization of net debt discount (premium) | (248 | ) | (262 | ) | (97 | ) | 22 | 23 | (248 | ) | 23 | ||||||||||||||||
Amortization of share-based compensation | 3,306 | 1,756 | 1,887 | 1,615 | 1,798 | 3,306 | 1,798 | ||||||||||||||||||||
Straight line rent adjustment | (997 | ) | (787 | ) | (1,009 | ) | (1,240 | ) | (793 | ) | (997 | ) | (793 | ) | |||||||||||||
Market rent adjustment | (234 | ) | (176 | ) | 79 | (202 | ) | (155 | ) | (234 | ) | (155 | ) | ||||||||||||||
2nd generation tenant allowances | (5,537 | ) | (2,796 | ) | (5,766 | ) | (2,979 | ) | (2,443 | ) | (5,537 | ) | (2,443 | ) | |||||||||||||
Capital improvements | (891 | ) | (1,181 | ) | (3,419 | ) | (4,334 | ) | (1,598 | ) | (891 | ) | (1,598 | ) | |||||||||||||
Adjustments from unconsolidated joint ventures | 168 | (62 | ) | (87 | ) | (14 | ) | (35 | ) | 168 | (35 | ) | |||||||||||||||
Funds available for distribution | $ | 31,982 | $ | 38,651 | $ | 30,277 | $ | 23,122 | $ | 27,041 | $ | 31,982 | $ | 27,041 | |||||||||||||
Funds available for distribution per share | $ | 0.32 | $ | 0.39 | $ | 0.31 | $ | 0.25 | $ | 0.29 | $ | 0.32 | $ | 0.29 | |||||||||||||
Dividends paid per share | $ | 0.20 | $ | 0.20 | $ | 0.20 | $ | 0.20 | $ | 0.19 | $ | 0.20 | $ | 0.19 | |||||||||||||
FFO payout ratio | 56 | % | 48 | % | 51 | % | 63 | % | 61 | % | 56 | % | 61 | % | |||||||||||||
FAD payout ratio | 63 | % | 51 | % | 65 | % | 80 | % | 67 | % | 63 | % | 67 | % | |||||||||||||
Diluted weighted average common shs. | 98,690 | 98,409 | 97,811 | 93,237 | 92,685 | 98,690 | 92,685 | ||||||||||||||||||||
13
Supplemental Operating and Financial Data for the
Quarter Ended 3/31/12
Unconsolidated Joint Venture Information
The following table details certain information as of and for the quarter ended March 31, 2012 about various unconsolidated real estate joint ventures in which we have an ownership interest (dollars in millions):
Joint Venture | Center Location | Ownership % | Square Feet | Tanger's Share of Total Assets | Tanger's Share of NOI | Tanger's Share of Debt | ||||||||||||||
Wisconsin Dells | Wisconsin Dells, Wisconsin | 50.0 | % | 265,086 | $ | 16.7 | $ | 0.5 | $ | 12.1 | ||||||||||
Deer Park | Deer Park, Long Island NY | 33.3 | % | 741,976 | $ | 89.9 | $ | 1.6 | $ | 82.3 | ||||||||||
Deer Park Warehouse | Deer Park, Long Island NY | 33.3 | % | 29,253 | $ | 0.8 | $ | — | $ | 0.8 | ||||||||||
Galveston/Houston | Texas City, TX | 50.0 | % | — | $ | 16.0 | $ | — | $ | — | ||||||||||
RioCan Canada | Various | 50.0 | % | 157,382 | $ | 32.0 | $ | 0.4 | $ | — | ||||||||||
National Harbor | Washington D.C. Metro Area | 50.0 | % | — | $ | 0.8 | $ | — | $ | — | ||||||||||
Other | $ | 0.2 | $ | — | $ | — | ||||||||||||||
Total | $ | 156.4 | $ | 2.5 | $ | 95.2 | ||||||||||||||
14
Supplemental Operating and Financial Data for the
Quarter Ended 3/31/12
Unconsolidated Joint Venture Information
Summary Balance Sheets (dollars in thousands)
3/31/2012 | 12/31/2011 | 9/30/2011 | 6/30/2011 | 3/31/2011 | Tanger's Share as of 3/31/12 | ||||||||||||||||||
Assets | |||||||||||||||||||||||
Investment properties at cost - net | $ | 357,357 | $ | 344,098 | $ | 289,318 | $ | 284,076 | $ | 285,332 | $ | 137,361 | |||||||||||
Cash and cash equivalents | 9,621 | 7,582 | 16,141 | 15,682 | 14,697 | 4,263 | |||||||||||||||||
Deferred lease costs, net | 14,294 | 14,815 | 2,840 | 2,877 | 3,011 | 6,751 | |||||||||||||||||
Deferred debt origination costs, net | 6,626 | 7,566 | 724 | 970 | 1,172 | 2,219 | |||||||||||||||||
Prepaids and other assets | 15,663 | 11,687 | 9,969 | 8,555 | 7,349 | 5,834 | |||||||||||||||||
Total assets | $ | 403,561 | $ | 385,748 | $ | 318,992 | $ | 312,160 | $ | 311,561 | $ | 156,428 | |||||||||||
Liabilities & Owners' Equity | |||||||||||||||||||||||
Mortgages payable | $ | 273,534 | $ | 303,230 | $ | 293,534 | $ | 293,534 | $ | 294,034 | $ | 95,220 | |||||||||||
Construction trade payables | 7,719 | 2,669 | 4,958 | 6,034 | 4,710 | 3,411 | |||||||||||||||||
Accounts payable & other liabilities | 24,788 | 27,246 | 5,378 | 6,937 | 4,281 | 10,841 | |||||||||||||||||
Total liabilities | 306,041 | 333,145 | 303,870 | 306,505 | 303,025 | 109,472 | |||||||||||||||||
Owners' equity | 97,520 | 52,603 | 15,122 | 5,655 | 8,536 | 46,956 | |||||||||||||||||
Total liabilities & owners' equity | $ | 403,561 | $ | 385,748 | $ | 318,992 | $ | 312,160 | $ | 311,561 | $ | 156,428 | |||||||||||
Summary Statements of Operations (dollars in thousands)
Three Months Ended | YTD | ||||||||||||||||||||||||||
3/31/12 | 12/31/11 | 9/30/11 | 6/30/11 | 3/31/11 | 3/31/12 | 3/31/11 | |||||||||||||||||||||
Revenues | $ | 11,658 | $ | 10,045 | $ | 9,488 | $ | 9,752 | $ | 9,562 | $ | 11,658 | $ | 9,562 | |||||||||||||
Expenses | |||||||||||||||||||||||||||
Property operating | 4,891 | 4,742 | 4,718 | 4,473 | 4,101 | 4,891 | 4,101 | ||||||||||||||||||||
General & administrative | 163 | 136 | 58 | (131 | ) | 187 | 163 | 187 | |||||||||||||||||||
Acquisition costs | 704 | — | — | — | — | 704 | — | ||||||||||||||||||||
Abandoned development costs | 954 | — | — | — | — | 954 | — | ||||||||||||||||||||
Impairment charge | — | 900 | — | — | — | — | — | ||||||||||||||||||||
Depreciation & amortization | 4,608 | 3,470 | 3,534 | 3,627 | 3,611 | 4,608 | 3,611 | ||||||||||||||||||||
Total expenses | 11,320 | 9,248 | 8,310 | 7,969 | 7,899 | 11,320 | 7,899 | ||||||||||||||||||||
Operating income | 338 | 797 | 1,178 | 1,783 | 1,663 | 338 | 1,663 | ||||||||||||||||||||
Interest expense | 3,829 | 3,146 | 1,381 | 4,126 | 1,803 | 3,829 | 1,803 | ||||||||||||||||||||
Net loss | $ | (3,491 | ) | $ | (2,349 | ) | $ | (203 | ) | $ | (2,343 | ) | $ | (140 | ) | $ | (3,491 | ) | $ | (140 | ) | ||||||
Tanger's share of: | |||||||||||||||||||||||||||
Total revenues less property operating and general & administrative expenses ("NOI") | $ | 2,526 | $ | 2,196 | $ | 1,751 | $ | 1,984 | $ | 1,912 | $ | 2,526 | $ | 1,912 | |||||||||||||
Net loss | $ | (1,452 | ) | $ | (742 | ) | $ | (27 | ) | $ | (764 | ) | $ | (32 | ) | $ | (1,452 | ) | $ | (32 | ) | ||||||
Depreciation (real estate related) | $ | 1,815 | $ | 1,553 | $ | 1,280 | $ | 1,336 | $ | 1,306 | $ | 1,815 | $ | 1,306 | |||||||||||||
15
Supplemental Operating and Financial Data for the
Quarter Ended 3/31/12
Debt Outstanding Summary (dollars in thousands)
As of March 31, 2012 | |||||||||||
Principal Balance | Stated Interest Rate | Market Interest Rate | Maturity Date | ||||||||
Unsecured debt: | |||||||||||
Unsecured lines of credit (1) | $ | 121,073 | Libor + 1.25% | 11/10/2015 | |||||||
2015 Senior unsecured notes | 250,000 | 6.15 | % | 11/15/2015 | |||||||
2020 Senior unsecured notes | 300,000 | 6.125 | % | 6/1/2020 | |||||||
Unsecured term loan | 250,000 | Libor + 1.80% | 2/23/2019 | ||||||||
Unsecured note | 10,000 | 1.50 | % | 3.153 | % | 6/30/2016 | |||||
Net debt discounts | (2,827 | ) | |||||||||
Total unsecured debt | 928,246 | ||||||||||
Secured mortgage debt: (2) | |||||||||||
Atlantic City, NJ (including premium of $4,796) | 58,227 | 5.14% - 7.65% | 5.05 | % | 11/15/2021 - 12/8/2026 | ||||||
Ocean City, MD (including premium of $353) | 19,138 | 5.24 | % | 4.68 | % | 1/6/2016 | |||||
Hershey, PA (including premium of $2,020) | 33,118 | 5.17% - 8.00% | 3.40 | % | 8/1/2015 | ||||||
Total secured mortgage debt | 110,483 | ||||||||||
Tanger's share of unconsolidated JV debt: | |||||||||||
Wisconsin Dells | 12,125 | Libor + 3.00% | — | 12/18/2012 | |||||||
Deer Park | 82,315 | Libor + 3.50 - 5.00% | — | 5/17/2014 | |||||||
Deer Park Warehouse (3) | 780 | 8.25 | % | 5/17/2011 | |||||||
Total Tanger's share of unconsolidated JV debt | $ | 95,220 | |||||||||
(1) | The Company has an unsecured, syndicated credit line with a borrowing capacity totaling $500.0 million and a separate cash management line of credit with a borrowing capacity of $20.0 million with one of the participants in the syndication. Both lines expire on November 10, 2015. Facility fees of 25 basis points annually are charged in arrears based on the amount of the commitment. |
(2) | Represents mortgages assumed in the acquisitions of various properties owned by joint ventures which are consolidated for financial reporting purposes. |
(3) | In June 2008, we, along with our partners in Deer Park, entered into a joint venture to purchase a 29,000 square foot warehouse adjacent to the Deer Park project described above for a total purchase price of $3.3 million. Deer Park Warehouse, in which we have a 33.3% ownership interest, is an unconsolidated joint venture. The interest-only mortgage loan agreement for the warehouse matured on May 17, 2011 and the joint venture did not qualify for the one-year extension option. As a result, the joint venture has accrued interest at a default rate of 8.25% from May 17, 2011 to March 31, 2012, and is currently in negotiations with the lender. As of March 31, 2012, the outstanding principal balance under the warehouse mortgage was $2.3 million. In December 2011, the joint venture recorded an impairment charge of approximately $900,000 to lower the basis of the warehouse to its estimated fair market value. |
16
Supplemental Operating and Financial Data for the
Quarter Ended 3/31/12
Future Scheduled Principal Payments (dollars in thousands)
As of March 31, 2012 | |||||||||||
Year | Tanger Consolidated Payments | Tanger's Share of Unconsolidated JV Payments | Total Scheduled Payments | ||||||||
2012 | $ | 1,931 | $ | 12,906 | $ | 14,837 | |||||
2013 | 4,633 | — | 4,633 | ||||||||
2014 | 3,599 | 82,314 | 85,913 | ||||||||
2015 | 403,412 | — | 403,412 | ||||||||
2016 | 30,279 | — | 30,279 | ||||||||
2017 | 3,004 | — | 3,004 | ||||||||
2018 | 3,179 | — | 3,179 | ||||||||
2019 | 253,365 | — | 253,365 | ||||||||
2020 | 303,561 | — | 303,561 | ||||||||
2021 | 5,788 | — | 5,788 | ||||||||
2022 & thereafter | 21,636 | — | 21,636 | ||||||||
$ | 1,034,387 | $ | 95,220 | $ | 1,129,607 | ||||||
Net Premiums on Debt | 4,342 | — | 4,342 | ||||||||
$ | 1,038,729 | $ | 95,220 | $ | 1,133,949 | ||||||
Senior Unsecured Notes Financial Covenants (1)
As of March 31, 2012 | ||||||
Required | Actual | Compliance | ||||
Total Consolidated Debt to Adjusted Total Assets | <60% | 47 | % | Yes | ||
Total Secured Debt to Adjusted Total Assets | <40% | 5 | % | Yes | ||
Total Unencumbered Assets to Unsecured Debt | >135% | 208 | % | Yes | ||
Consolidated Income Available for Debt Service to Annual Debt Service Charge | >1.5 | 4.29 | Yes | |||
(1) | For a complete listing of all Debt Covenants related to the Company's Senior Unsecured Notes, as well as definitions of the above terms, please refer to the Company's filings with the Securities and Exchange Commission. |
17
Supplemental Operating and Financial Data for the
Quarter Ended 3/31/12
Investor Information
Tanger Outlet Centers welcomes any questions or comments from shareholders, analysts, investment managers, media and prospective investors. Please address all inquiries to our Investor Relations Department.
Tanger Factory Outlet Centers, Inc. | |
Investor Relations | |
Phone: | (336) 834-6892 |
Fax: | (336) 297-0931 |
e-mail: | tangermail@tangeroutlet.com |
Mail: | Tanger Factory Outlet Centers, Inc. |
3200 Northline Avenue | |
Suite 360 | |
Greensboro, NC 27408 | |
18
Supplemental Operating and Financial Data for the
Quarter Ended 3/31/12