Attached files
| file | filename |
|---|---|
| 8-K - CAMBER ENERGY, INC. | lucas8k042512.htm |
Exhibit 99.1

Lucas Energy, Inc. Presentation April 2012 NYSEAmex:LEI

NYSEAmex: LEI www.lucasenergy.com

Certain statements made during this presentation are forward-looking and are subject to risks and uncertainties. The forward-looking statements made are based on our beliefs, assumptions and expectations of future performance, taking into account all information currently available to us. Actual results could differ materially from the forward-looking statements made during this presentation. Although we believe that the expectations reflected in the forward-looking statements are reasonable based on the current market conditions, we can provide no assurance that our forward-looking statements will accurately reflect actual results. When we use the words "believe," "expect," "anticipate," "plan," "will," "intend" or other similar expressions, we are identifying forward-looking statements. The forward-looking statements made during this presentation are subject to the safe harbor of the Private Securities Litigation Reform Act of 1995. Investors are cautioned that any forward-looking statements are not guarantees of future performance and actual results or developments may differ materially from those projected. The forward-looking statements in this presentation are made as of the date hereof. We take no obligation to update or correct our own forward-looking statements or those prepared by third parties that are not paid by the Company. The Company’s complete SEC filings are available at http://www.sec.gov and we refer you to our filings for a more detailed discussion of the risks that may have a direct bearing on our operating results, performance and financial condition.
|
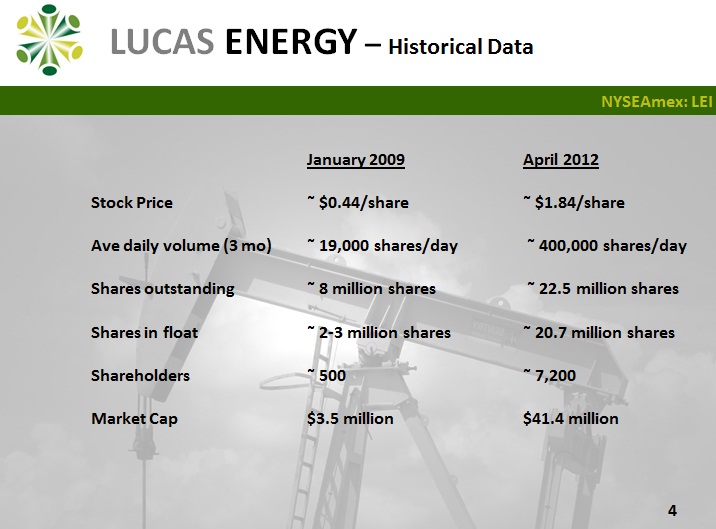
January 2009
|
April 2012
|
|
|
Stock Price
|
˜ $0.44/share
|
˜ $1.84/share
|
|
Ave daily volume (3 mo)
|
˜ 19,000 shares/day
|
˜ 400,000 shares/day
|
|
Shares outstanding
|
˜ 8 million shares
|
˜ 22.5 million shares
|
|
Shares in float
|
˜ 2-3 million shares
|
˜ 20.7 million shares
|
|
Shareholders
|
˜ 500
|
˜ 7,200
|
|
Market Cap
|
$3.5 million
|
$41.4 million
|

Original business plan. Drilling to increase production. Joint Ventures to bring more undeveloped assets on production. Sale or joint venture of the Eagle Ford assets. Evaluation of the Eaglebine assets for sale or joint venture. Active discussions with potential large joint venture partners to expand assets and production significantly.

Texas Arkansas Louisiana Mississippi North Bayou Jack Master's Creek Field Houston Brookeland Giddings Pearsall Mexico Gulf of Mexico

Gross Operated Production FY2011: 56,813 Bbls (156 BOPD) FY2012: 95,619 Bbls (261 BOPD) March 2012 – 535 BOPD

Revenue Forecast Factors Base Production – 90% chance of success. Small JV/s – 75% chance of success. Medium JV – 50% chance of success.Large JV – 25% chance of success * The chance of success is the estimation that the execution and production will happen under current operating conditions as well as negotiation status, it does not include oil price, mechanical, or costs factors.

FY2013 Base Forecast Forecast for current company operated properties Net oil production for the year = 52,000 Bbls Price per bbl = $95 Net revenue from base production = $4.94 Million * before taxes and LOE

Small JV Contributions Bbls of oil per new horizontal well = 53,500 Gross Working interest carried & retained = 25% Net revenue interest lease = 75% Price per bbl = $95 Net revenue per new horizontal well = $953,000 No. of new horizontal wells carried to the tanks = 4 Net revenue from Small JV’s = $3.8 million (full 12-mo period) Contribution to FY2013 revenue = $1.2 million* before taxes and LOE

Medium JV Contributions Gross production per new lateral from an old well bore = 33,000 Bbls Working interest carried and retained = 20% Net revenue interest lease = 75% Price per bbl = $95 Net revenue per new lateral from an old well bore = $470,250 No. of new laterals carried to the tanks per month = 2 No. of months = 7 months Net revenue from Medium JV’s = $6.6 million (full 12-mo period) Contribution to FY2013 revenue = $2.2 million * before taxes and LOE

Large JV Contributions Gross production per new horizontal well = 75,000 bbls Working interest carried and retained = 25% Net revenue interest lease = 75% Price per bbl = $95 Net revenue per new horizontal well = $1.3 million New wells carried to the tanks per month = 2 No. of months = 5 months Net revenue from Large JV’s = $13.0 million (full 12-mo period) Contribution to FY2013 revenue = $6.5 million * before taxes and LOE

Forecase of Potential Revenues for FY2013 Base production - $4.9 million Small JV’s - 1.2 million Medium JV - 2.2 million Large JV - 6.5 million Total potential for 2013 - $14.8 million* before taxes and LOE.

Forecast of Future Potential Annualized Revenues Base production $ 4.9 million Small JV’s 3.8 million Medium JV 6.6 million Large JV 13.0 million Total future potential $28.3 million * before taxes and LOE.

Forecast of Potential Net Revenues for FY2013 Estimated net revenues $14.8 million Estimated LOE and Taxes 2.6 million G&A 4.8 million EBITDA $7.4 million* After taxes, LOE, and overhead

Cash Items Not Considered as Revenue Mark up on acreage - $5.0 million GG&A contribution - $3.5 million Sale of Eagle Ford - $60.0 million * Lucas is under full cost accounting and does not report acreage sales as revenues.

Lucas Energy Market Factors Trade on NYSE Amex as LEI Outstanding Shares: 22.6 million Average daily volume: 401,239 (3 mo) 52 week hi/low: $3.57 / $1.04 Market cap: $41.6 million at 4/17/12 Debt: No corporate debt Project debt: $22 million non-recourse * Fiscal Year: March 31 * Note recourse to Nordic acquisition properties only.

Lucas Energy Contact Info Corporate Office 3555 Timmons Lane, Suite 1550 Houston, Texas 77027 Tel (713) 528-1881 Fax (713) 337-1510 www.lucasenergy.com