Attached files
| file | filename |
|---|---|
| 8-K - 8-K - LODGENET INTERACTIVE CORP | a12-10432_18k.htm |
| EX-99.1 - EX-99.1 - LODGENET INTERACTIVE CORP | a12-10432_1ex99d1.htm |
Exhibit 99.2
|
|
LodgeNet Interactive Corporation Q1 2012 Earnings Presentation April 24, 2012 |
|
|
Certain statements in this presentation constitute “forward-looking statements.” When used in this presentation and in the prepared remarks during our April 24th conference call, as well as in response to the questions during the conference call, the words “intends,” “expects,” “estimates,” “believes,” and similar expressions, and statements which are made in the future tense or refer to future events or developments, including, without limitation, those related to our full year 2012 guidance, including revenue, adjusted operating cash flow, net income per common share, anticipated HD and Envision room installations and number of rooms with our mobile footprint, are intended to identify such forward-looking statements. Such forward-looking statements are subject to risks, uncertainties and other factors that could cause the actual results, performance or achievements to be materially different from any future results, performance or achievements expressed or implied by such forward-looking statements. Such factors include, among others, the following: the effects of economic conditions, including general financial conditions; the economic condition of the lodging industry, which can be particularly affected by the financial conditions referenced above, as well as by high gas prices, levels of unemployment, consumer confidence, acts or threats of terrorism and public health issues; competition from providers of similar services and from alternative systems for accessing in-room entertainment; competition from HSIA providers; changes in demand for our products and services; programming availability, timeliness, quality and costs; technological developments by competitors; developmental costs, difficulties and delays; relationships with customers and property owners, in particular as we reduce capital investment; the availability of capital to finance growth; compliance with credit facility covenants; the impact of governmental regulations; potential effects of litigation; risks of diversification into new products, services or markets; risks related to the security of our data systems; and other factors detailed, from time to time, in our filings with the Securities and Exchange Commission. For any of the foregoing reasons, our guidance and our actual financial results may not meet our expectations. These forward-looking statements speak only as of the date of this presentation. We expressly disclaim any obligation or undertaking to release publicly any updates or revisions to any forward-looking statements contained herein to reflect any change in our expectations with regard thereto or any change in events, conditions or circumstances on which any such statement is based. 2 |
|
|
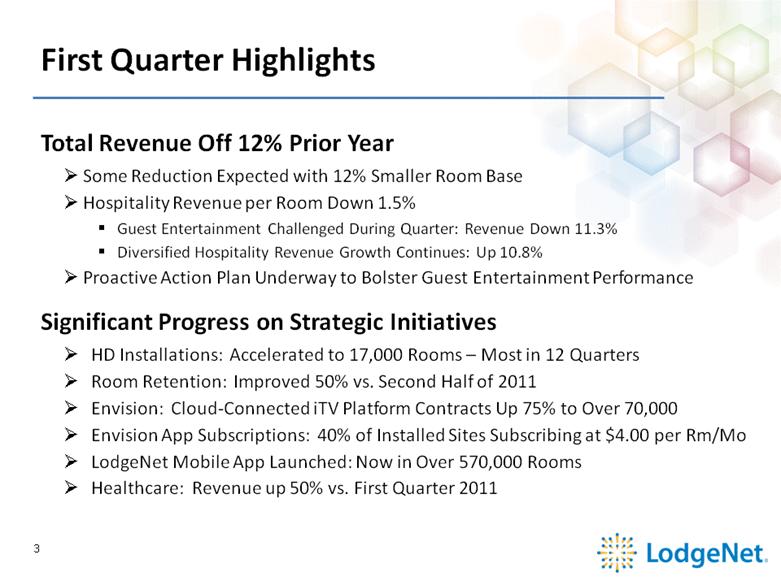
Total Revenue Off 12% Prior Year Some Reduction Expected with 12% Smaller Room Base Hospitality Revenue per Room Down 1.5% Guest Entertainment Challenged During Quarter: Revenue Down 11.3% Diversified Hospitality Revenue Growth Continues: Up 10.8% Proactive Action Plan Underway to Bolster Guest Entertainment Performance Significant Progress on Strategic Initiatives HD Installations: Accelerated to 17,000 Rooms – Most in 12 Quarters Room Retention: Improved 50% vs. Second Half of 2011 Envision: Cloud-Connected iTV Platform Contracts Up 75% to Over 70,000 Envision App Subscriptions: 40% of Installed Sites Subscribing at $4.00 per Rm/Mo LodgeNet Mobile App Launched: Now in Over 570,000 Rooms Healthcare: Revenue up 50% vs. First Quarter 2011 First Quarter Highlights 3 |
|
|
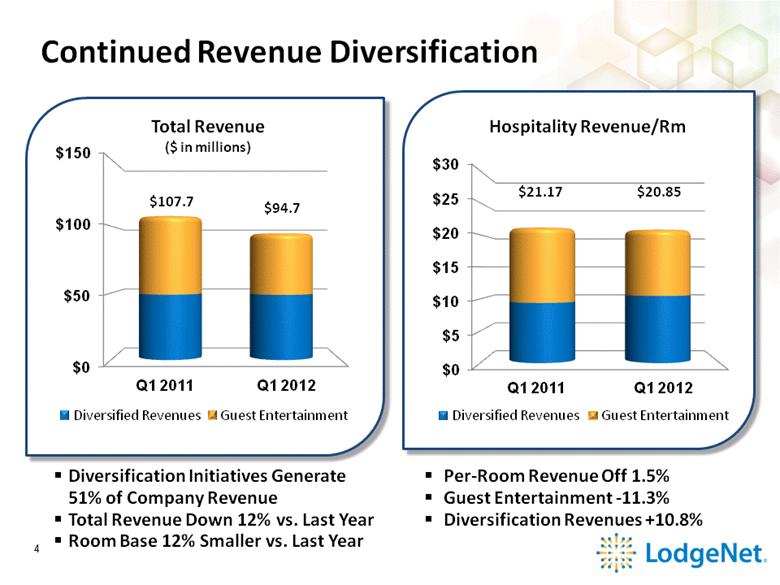
Diversification Initiatives Generate 51% of Company Revenue Total Revenue Down 12% vs. Last Year Room Base 12% Smaller vs. Last Year Continued Revenue Diversification 4 Per-Room Revenue Off 1.5% Guest Entertainment -11.3% Diversification Revenues +10.8% Hospitality Revenue/Rm Total Revenue ($ in millions) Deversified Revenues Guest Entertainment $0 $50 $100 $150 $107.7 $94.7 Q1 2011 Q1 2012 $0 $5 $10 $15 $20 $25 $30 Q1 2011 Q1 2012 $21.17 $20.85 Deversified Revenues Guest Entertainment |
|
|
Q1 Revenue Per Room Comparison Guest Entertainment Down 11.3% Negatively impacted by Less Popular Theatrical Content and Lower Sales Trend on Mature Content Diversified Revenues Up 10.8% Hotel Services up 5.1% Per Room Driven by Higher TV Programming System Sales Growth Driven by High Definition Equipment Sales Advertising Services Down as Planned with Transition to Expanded Ad Insertion Network 5 Q1 '12 Q1 '11 Hospitality Revenue Guest Entertainment $10.46 $11.79 (1.33) $ -11.3% Hotel Services 7.28 6.93 0.35 5.1% System Sales and Related 2.82 1.94 0.88 45.4% Advertising Services 0.29 0.51 (0.22) -43.1% Total Revenue per Room 20.85 $ 21.17 $ (0.32) $ -1.5% Excluding Guest Entertainment 10.39 $ 9.38 $ 1.01 $ 10.8% Change Q1 '12 vs Q1 '11 |

|
|
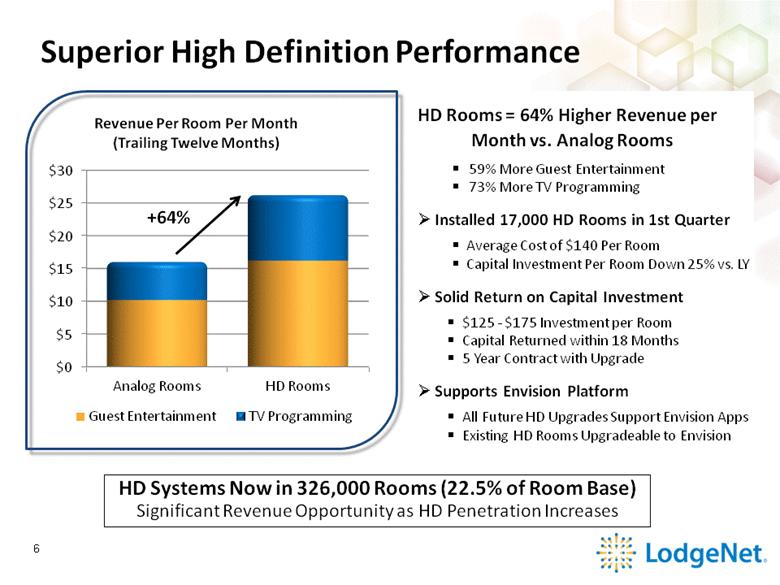
Superior High Definition Performance HD Rooms = 64% Higher Revenue per Month vs. Analog Rooms 59% More Guest Entertainment 73% More TV Programming Installed 17,000 HD Rooms in 1st Quarter Average Cost of $140 Per Room Capital Investment Per Room Down 25% vs. LY Solid Return on Capital Investment $125 - $175 Investment per Room Capital Returned within 18 Months 5 Year Contract with Upgrade Supports Envision Platform All Future HD Upgrades Support Envision Apps Existing HD Rooms Upgradeable to Envision HD Systems Now in 326,000 Rooms (22.5% of Room Base) Significant Revenue Opportunity as HD Penetration Increases 6 Revenue Per Room Per Month (Trailing Twelve Months) $0 $5 $10 $15 $20 $25 $30 Analog Rooms HD Rooms Guest Entertainment TV Programming +64% |
|
|
High Definition Capital Investment HD Investment Down 40% in Two Years Lower Server and Component Costs Reduced Installation and Assembly Costs Higher Mix of Upgrades vs. New Installations - 40% High Definition Capital Investment Per Room Declining Capex per Room Enables LodgeNet to Sustain HD Envision Rollout in 2012 7 |

|
|
High Definition Room Upgrades Accelerating (# of HD Rooms) 8 Nearly 17,000 New HD Rooms Added in Q1 – Greatest Activity in 3 Years Hotels Accelerating Upgrade Activity with Improving Occupancies and Higher ADR’s Lack of HD Content Becoming a Competitive Pressure: Travelers Expect an HD Experience |

|
|
Envision Rooms Accelerating (# of Envision Rooms) 9 iTV Platform Builds Momentum 71,000 HD iTV Rooms - Up 75% vs YE 2011 Adoption by Marquee Properties Across All Brands Advanced App Adoption Exceeds Expectations 40% Subscribe to Advanced Apps Advanced Apps Generate Over $4 of Revenue Per Room Per Month On Pace to Deliver on 2012 Guidance 71,000 Contracted |

|
|
Solid Gross Margins Total Margin Rate Impacted by Revenue Mix Changes Guest Entertainment – Maintained 60%+ Gross Margins Hotel Services – Lower TV Programming Margins – Temporary Due to Price Increase Timing System Sales & Related – Lower Margin Equipment Sales Driven by HD Upgrades Advertising – Increase Due to Transition of Ad Insertion Business Healthcare – Lower Margin Q1 Installation – Return to High 40%’s by Q3 10 ppt Q1 '12 Q1 '11 Change Guest Entertainment 60.3% 61.1% -0.8% Hotel Services 15.4% 16.9% -1.5% System Sales & Related 26.8% 34.9% -8.1% Advertising Services 79.1% 48.6% 30.5% Healthcare 36.3% 51.3% -15.0% Total Gross Margin 40.2% 44.0% -3.8% |

|
|
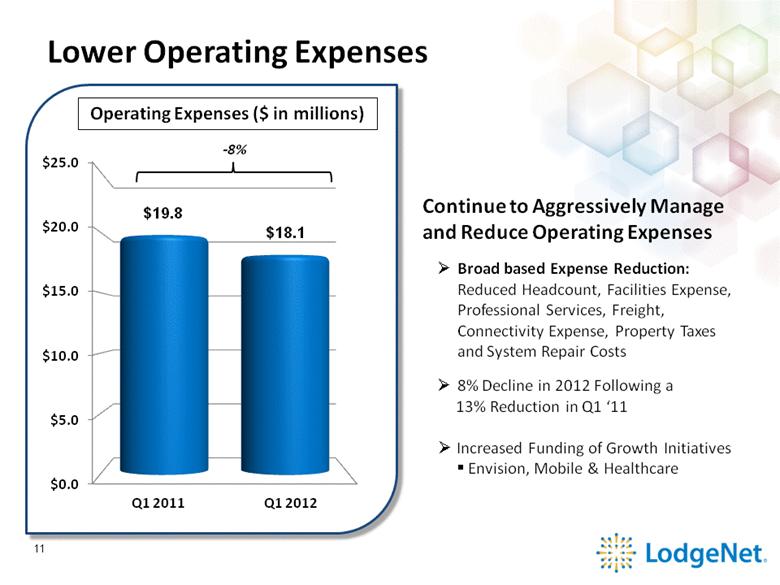
Lower Operating Expenses -8% Operating Expenses ($ in millions) 11 Continue to Aggressively Manage and Reduce Operating Expenses Broad based Expense Reduction: Reduced Headcount, Facilities Expense, Professional Services, Freight, Connectivity Expense, Property Taxes and System Repair Costs 8% Decline in 2012 Following a 13% Reduction in Q1 ‘11 Increased Funding of Growth Initiatives Envision, Mobile & Healthcare |
|
|
Profitability Metrics * Adjusted Operating Cash Flow Definition - see slide 18 Adjusted Operating Cash Flow (Trailing Twelve Months, $ in millions) 12 Operating Margins Maintained Solid Product Margins Operating Expense Control Down $11.5 million Over Past 5 Quarters |

|
|
Free Cash Flow Analysis* Annual Comparison ($ in millions) *Free Cash Flow Definition see slide 18 ** Share Count with Preferred Stock Converted 40.31mm Shares 13 Q1 '12 Q1 '11 Adjusted Operating Cash Flow 20.3 $ 27.9 $ 0.50 $ Interest Payments (6.0) (8.0) Working Capital (net) 8.5 (0.7) Pre-Investment Cash Flow 22.8 $ 19.2 $ 0.56 $ Corporate Assets (2.6) (1.5) Room Based Development (2.0) (1.0) HD Investments & Extensions (4.6) (2.1) Total Capital Investment (9.2) (4.6) Free Cash Flow 13.6 $ 14.6 $ 0.34 $ Q1 '12 W/Converted Share** |
|
|
Company Continues to Reduce Debt ($ in millions) 14 Paid Down $17 Million of Debt During Quarter Significantly Below Leverage Covenant of 4.00x * Adjusted Operating Cash Flow Definition - see slide 18 |
|
|
Full Year 2012 Guidance * Adjusted Operating Cash Flow Definition - see slide 18 ($ in millions except per-share data) 15 2012 Financial Guidance 2012 Key Metric Guidance Revenue per Room = Average Revenue / Room Room Data = Ending Installed Rooms unchanged from original guidance low high Revenue 405 $ 420 $ AOCF* 92.5 $ 97.5 $ Net Income Per Common Share (0.10) $ 0.10 $ Full Year 2012 2011 Full Year 2012 Actual Guidance Hospitality Revenue Per Room 21.36 $ 22.00 $ Guest Entertainment Rooms 1,477,000 1,400,000 High Definition Rooms 309,000 410,000 Envision Rooms 18,500 130,000 Mobile Rooms - 0 - 750,000 |
|
|
Proven & Impactful Growth Opportunities Revenue Diversification: Strategy Creating Positive Changes 2006: 80% of Revenue from Guest Entertainment Today: 50% from Diversified Sources Tomorrow: Up to 70% of Revenue with new Advertising Initiatives ‘Four Screen’ Services Strategy: No Longer “Tethered to the TV” Interactive TV + Web + Mobile + Tablets In the Room + On the Property + On their Way Revenues: Entertainment + Hotel Services + Advertising Services Mobile: 1:1 Relationship with Consumer + New Services for Hotels Targeted and Interactive Advertising: High Value Demographic 2012: Business Outlook 16 |
|
|
Guest Entertainment Strategy Best Screen, Earliest Content, and Discerning Consumers Transition to Higher-Revenue HDTV: Only 22.5% HD Penetration Today Guest Entertainment Revenues 60% Greater Envision Driving Adoption Enhancements to Marketing & Pricing: Numerous over Past Year Multi-Tier Pricing Structure: Titles as low as $4.99 Earliest Window: Prominently Marketed Graphical User Interface Enhancements Internet Clips: Recently Introduced Strategic Opportunities Studio Promotions: Billions of Impressions Ultra Violet: Electronic Sell Through Internet Streaming to TV Entertainment to Go 2012: Business Outlook 17 |
|
|
Reconciliation of Operating Income to Adjusted Operating Cash Flow Operating Income Plus: Depreciation and Amortization Plus: Restructuring Charges Plus: Share-Based Compensation Plus: Impairment Charge Plus: Debt Issuance Costs Equals: Adjusted Operating Cash Flow Reconciliation of Free Cash Flow Cash from Operations Less: Cash Used for Investing Activities, including Growth-Related Capital Equals: Free Cash Flow 18 |