Attached files
| file | filename |
|---|---|
| 8-K - 8-K - EMCLAIRE FINANCIAL CORP | v310233_8k.htm |
Exhibit 99.1

2012 Annual Meeting of Shareholders Parent Holding Company of The Farmers National Bank of Emlenton April 25, 2012 – 9:00 AM Emlenton, Pennsylvania William C. Marsh Chairman, President & CEO

Introductions From Bank/Company : • Board of Directors • Executive Management • Other Officers and Employees Guests : • Independent Accountants – Leah Blazek; Crowe Horwath, LLP • Market Maker – Bob Wagner; Boenning & Scattergood, Inc. 2

Forward Looking Statements This presentation contains certain forward - looking statements and information relating to the Company that are based on the beliefs of management as well as assumptions made by and information currently available to management. These forward - looking statements relate to, among other things, expectations of the business environment in which we operate, projections of future performance, potential future credit experience, perceived opportunities in the market and statements regarding our mission and vision. Such statements reflect the current views of the Company with respect to future looking events and are subject to certain risks, uncertainties and assumptions. Should one or more of these risks or uncertainties materialize or should underlying assumptions prove incorrect, actual results may vary materially from those described herein as anticipated, believed, estimated, expected or intended. The Company does not intend to update these forward - looking statements. NOTE: This presentation will be available on - line at www.emclairefinancial.com . 3

Section Topic Page Corporate Overview & Outlook 5 Growth & Expansion 8 Financial Results 13 Asset Quality 26 Capital, Dividends & Stock Performance 32 Strategic Update Looking Ahead 38 Open Discussion and Closing 45

Corporate Overview • Record earnings – 2011 and 1Q 2012 • Continued core balance sheet growth – loans/deposits • Consistent organic growth – earnings and footings • Asset quality improvement • Capital level improvement • Continue to improve professional staff – additions/training 5

Economic Outlook • Market interest rate environment low and to remain low • Unemployment improving – nationally and particularly in region • Real estate values stabilizing – Western Pennsylvania held firmer than nationally • Bank earnings and valuations recovering nationally • Gasoline prices – up and down; impact on transportation • Regionally – Marcellus Shale; Southern Butler County Growth 6
Regulatory Outlook • Dodd - Frank & Consumer Financial Protection Bureau – Safe Act (mortgage lending business) – Like traditional Consumer Product Safety Commission; but for financial companies – All impacts mainly larger financial companies • Overdraft rules • FDIC insurance premiums • OCC / OTS merger • No question regulations will have an impact – currently we are addressing and managing 7

Growth & Expansion 8 • History of Growth • Franchise • Five Year Balance Sheet Look • Growth Components

History of Growth – 10,000X 9 Total Assets 1900 -The Farmers National Bank of Emlenton organized $50,000 December 1978 -Eau Claire branch opened $16,929,000 April 1985 -Clarion branch opened $35,506,000 1989 -Formed holding company Emclaire Financial Corp. $55,054,000 July 1991 -Purchased branches in East Brady and Emlenton from Mellon Bank $87,474,000 May 1996 -Bon Aire branch opened August 1996 -Knox Riverside branch opened September 1996 -Purchased branch in Knox from Mellon Bank $128,002,000 March 1998 -Acquired Peoples Savings Bank (3 branches: Ridgway, Dubois, & Brookville) $194,132,000 March 2002 -Consolidated Knox branch offices $238,577,000 January 2003 -Meridian branch (Butler) opened $262,512,000 November 2006 -Cranberry (Seneca) branch opened $300,560,000 April 2008 -Grove City branch opened October 2008 - Completed conversion/merger with Elk County Savings & Loan association in conjunction with the completion of a $3.5 million common stock offering at $21.15 per share (163,569 shares issued) December 2008 -Issued $7.5 million of Preferred Stock under Treasury's Capital Purchase Program $375,664,000 August 2009 -Completed purchase of $90 million Titusville branch from PNC / National City November 2009 -EMCF begins trading on NASDAQ Capital Market $467,526,000 March 2011 -Raised $4.6 million in common equity via private placement stock offering August 2011 -Issued $10.0 million of Preferred Stock under SBLF program; repaid TARP/CPP $491,882,000 March 2012 -Bank assets increase 4.3% from December 2011 $512,838,0002012 1996 1998 2002 2003 2006 2008 2009 2011 1900 1978 1985 1989 1991

Banking Franchise Headquarters & Main Banking Office Banking Office Erie Pittsburgh Future Branch Opportunities 10

Balance Sheet Growth 64% Asset Growth – 12/31/2007 to 3/31/2012 11 $175 $225 $275 $325 $375 $425 $475 $525 12/31/2007 12/31/2008 12/31/2009 12/31/2010 12/31/2011 3/31/2012 (In Millions) Total Assets $312 $376 $468 $482 $492 $513 Deposits 244 287 385 410 416 437 Loans, net 230 265 293 306 313 320 $’s in millions

0% 10% 20% 30% 40% 50% 60% 70% 80% 90% 100% Loans Deposits 45.57% 29.29% 17.17% 20.43% 37.26% 50.27% Sources of Balance Sheet Growth Acquisitions New Branches Organic Components of Growth 12 2006 – 2012

Financial Results 13 • Consolidated Financial Highlights • Balance Sheet Review • 2011 Results • 2012 First Quarter Results • Core Results • Efficiency

Consolidated Financial Highlights (Dollar amounts in thousands, except share data) 14 • Appreciable growth/progress in “controllable” measurements • 58% asset growth • 10% tangible book value growth 2011 2010 2009 2008 2007 Total assets 491,882$ 481,885$ 467,526$ 375,664$ 311,720$ Loans receivable, net 312,545 306,152 292,615 264,838 229,819 Deposits 416,468 409,658 385,325 286,647 244,262 Borrowed funds 20,000 30,000 40,000 48,188 40,400 Stockholders' equity 50,730 39,118 37,034 36,123 24,703 Stockholders' equity per common share $23.25 $21.67 $20.68 $20.06 $19.48 Tangible stockholders' equity per common share $20.26 $17.77 $16.32 $19.06 $18.36 Market value per common share $15.95 $16.35 $13.85 $23.50 $25.75 Common shares outstanding 1,751,908 1,457,404 1,431,404 1,431,404 1,267,835 As of the year ended December 31, Balance Sheet:
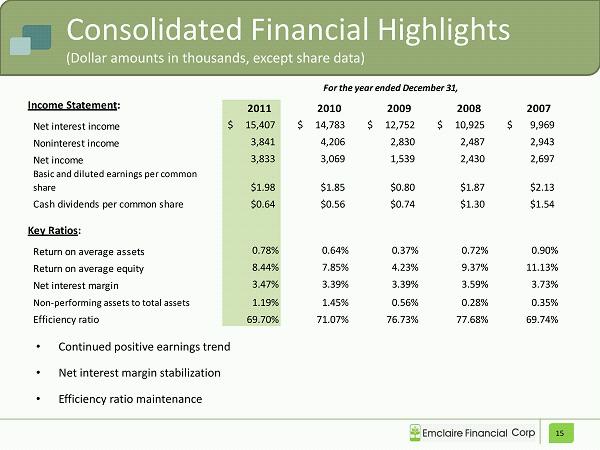
Consolidated Financial Highlights (Dollar amounts in thousands, except share data) 15 • Continued positive earnings trend • Net interest margin stabilization • Efficiency ratio maintenance 2011 2010 2009 2008 2007 Net interest income 15,407$ 14,783$ 12,752$ 10,925$ 9,969$ Noninterest income 3,841 4,206 2,830 2,487 2,943 Net income 3,833 3,069 1,539 2,430 2,697 Basic and diluted earnings per common share $1.98 $1.85 $0.80 $1.87 $2.13 Cash dividends per common share $0.64 $0.56 $0.74 $1.30 $1.54 Return on average assets 0.78% 0.64% 0.37% 0.72% 0.90% Return on average equity 8.44% 7.85% 4.23% 9.37% 11.13% Net interest margin 3.47% 3.39% 3.39% 3.59% 3.73% Non-performing assets to total assets 1.19% 1.45% 0.56% 0.28% 0.35% Efficiency ratio 69.70% 71.07% 76.73% 77.68% 69.74% For the year ended December 31, Income Statement: Key Ratios:

Consolidated Balance Sheets ($’s in thousands, except share data) March 31, 2012 December 31, 2011 December 31, 2010 Assets : • Cash $ 29,960 $ 28,193 $ 19,027 • Investments 134,984 123,154 125,820 • Loans Receivable, net 320,095 312,545 306,152 • Other (intangible assets of $5,151, $5,244 and $5,685) 27,800 27,990 30,886 Total Assets $ 512,838 $ 491,882 $ 481,885 Liabilities : • Deposits $ 437,459 $ 416,468 $ 409,658 • Borrowed funds 20,000 20,000 30,000 • Other 4,434 4,684 3,109 Total Liabilities 461,893 441,152 442,767 Stockholders’ Equity 50,945 50,730 39,118 Total Liabilities and Equity $512,838 $ 491,882 $ 481,885 Tangible book value per common share (15.0% increase from 2010) $20.43 $20.26 $17.77 16

Consolidated Balance Sheets • December 31, 2011 versus December 31, 2010: — Asset growth 2.1% — Loan growth 2.1% — Deposit growth 1.7% • March 31, 2012 versus December 31, 2011: — Asset growth 4.3% — Loan growth 2.4% — Deposit growth 5.0% • Continued opportunity to invest in loans without balance sheet growth 17

Earnings – 2011 vs. 2010 18 (Dollar amounts in thousands, except share data) 2011 2010 % Change Net interest income $ 15,407 $ 14,783 4.2% Provision for loan losses 420 1,306 - 67.8% Noninterest income 3,841 4,206 - 8.7% Security gains 482 975 - 50.6% Noninterest expense 14,045 13,813 1.7% Prepayment penalties 334 557 - 40.0% Net income $ 3,833 $ 3,069 24.9% Preferred dividends (SBLF/TARP) 517 393 31.6% Net income to common shareholders $ 3,316 $ 2,676 23.9% Net income per common share $1.98 $1.85 7.0%

Earnings – 2011 vs. 2010 Net interest income increased $624,000 or 4.2% – Loan portfolio growth – Net interest margin management Provision for loan losses declined 67.8% – Key problem credits resolved – Nonperforming assets down 16% to $5.9 million – Classified assets down 5% to $11.8 million Security gains; borrowed fund prepayment – net positive FDIC Premiums declined – $410,000 in 2011 vs. $570,000 in 2010 Preferred stock dividends increased $124,000 or 31.6% – Impact of unwinding CPP/TARP – $10.0 million SBLF vs. $7.5 million CPP/TARP Continued core net income growth (Non - GAAP; unaudited) – 2011 – $3,788,000 (+16.3%) – 2010 – $3,257,000 19

Earnings Considerations 20 Headwinds: • Regulatory burden & compliance costs • Interest rate environment • Technology and security costs • Healthcare costs • Mild loan demand Opportunities: • Noninterest revenue growth • Improved operating efficiencies • Realized reduction in FDIC premiums • Expansion of sales staff • Entrance into new markets • Marcellus Shale impact • SBLF capital • Continued staff improvement/training

Earnings – 1Q 2012 vs. 1Q 2011 (Dollar amounts in thousands, except share data) 2012 2011 % Change Net interest income $3,912 $3,736 4.7% Provision for loan losses 113 120 - 5.8% Noninterest income 1,219 930 31.1% Noninterest expense 3,633 3,583 1.4% Net income 1,039 781 33.0% Preferred dividends / discount accretion 125 98 27.6% Net income to common shareholders $914 $683 33.8% Net income per common share $0.52 $0.47 10.6% Return on average common equity 8.93% 8.73% +20 bps 21

Earnings – 1Q 2012 vs. 1Q 2011 Net interest income increased $176,000 or 4.7% – Loan portfolio growth – Net interest margin management Provision for loan losses declined 5.8% – Recovery on key problem credit – Nonperforming assets down $1.0 million or 17.4% Security gains FDIC Premiums declined 32.9% – $96,000 in 2012 vs. $143,000 in 2011 Preferred stock dividends increased $27,000 or 27.6% – $10.0 million SBLF vs. $7.5 million CPP/TARP Continued core net income growth (Non - GAAP; unaudited) – 2012 – $856,000 (+18.2%) – 2011 – $724,000 22

$12,000 $13,000 $14,000 $15,000 $16,000 $17,000 $18,000 $19,000 $20,000 2007 2008 2009 2010 2011 Core revenue, FTE Core Revenue Growth (on a fully tax equivalent basis) 23 10% annual growth 2007 2008 2009 2010 2011 Interest income, FTE $18,290 $19,492 $20,899 $22,479 $22,032 Interest expense 7,886 8,168 7,582 7,069 5,872 CAGR: Net interest income, FTE 10,404 11,324 13,317 15,410 16,160 11.6% Noninterest income: Customer service fees 1,549 1,638 1,495 1,419 1,490 Financial services 448 449 389 700 520 Other core noninterest income 706 785 976 1,112 1,336 CAGR: Total core noninterest income 2,703 2,872 2,860 3,231 3,346 5.5% Core revenue, FTE $13,107 $14,196 $16,177 $18,641 $19,506 10.4% Core Revenue Growth: Dollars in $000's As of December 31,

$1,500 $2,000 $2,500 $3,000 $3,500 $4,000 2007 2008 2009 2010 2011 Core earnings Reported earnings Core Earnings Growth (Non - GAAP, unaudited. Reflects management’s estimate) 24 12% annual growth 2007 2008 2009 2010 2011 CAGR: Net income, reported $2,697 $2,430 $1,539 $3,069 $3,833 9.2% Adjustments: Security (gains) & losses ($207) $391 $34 ($975) ($482) Plus: non-recurring expenses - 1,062 1,264 409 401 Plus: excess provision - 170 797 856 - Minus: other non-recurring income (220) (1,007) (4) - - Tax impact @ 35% 149 (517) (711) (102) 28 Total core earnings adjustments (278) 99 1,380 188 (53) CAGR: Core earnings $2,419 $2,529 $2,919 $3,257 $3,780 11.8% As of December 31, Core Earnings Growth: Dollars in $000's

Efficiency 25 • FDIC premiums • Regulatory costs • Vendor management – technology, electronic products, related systems 2011 2010 2009 2008 2007 Employees: Full Time 103 107 111 96 94 Part Time 24 16 15 15 17 Full-time equivalent (FTE) 115 115 119 104 103 Banking Offices 13 13 13 12 11 Total Assets (in $000's) $491,882 $481,885 $467,526 $375,664 $311,720 Assets per FTE (in $000's) $4,277 $4,190 $3,929 $3,612 $3,026 Efficiency Ratio 69.70% 71.07% 76.73% 77.68% 69.74% As of and for the year ended December 31,

Asset Quality 26 • Overview • Classified Assets • Delinquency Trends • Loan Portfolio Growth

Asset Quality Overview 27 Dec. 31 Dec. 31 March 31 June 30 Sept. 30 Dec. 31 March 31 2009 2010 2011 2011 2011 2011 2012 Total Delinquency (> 30 days) $7,702 $6,718 $6,699 $5,680 $4,796 $3,984 $2,963 Nonperforming Assets: Loans 90 or more days past due $59 $41 $76 $200 $0 $66 $210 Nonaccrual loans 2,359 6,570 7,352 6,530 5,269 5,499 4,384 Total Nonperforming Loans $2,418 $6,611 $7,428 $6,730 $5,269 $5,565 $4,594 Repossessed Assets & OREO 213 373 319 284 351 307 256 Total Nonperforming Assets $2,631 $6,984 $7,747 $7,014 $5,620 $5,872 $4,850 Nonperforming Assets / Assets 0.56% 1.45% 1.57% 1.43% 1.14% 1.19% 0.95% Allowance for Loan Losses: $3,202 $4,132 $3,942 $3,562 $3,525 $3,536 $3,642 Allowance / Loans 1.08% 1.33% 1.30% 1.15% 1.14% 1.12% 1.12% Allowance / Nonperforming loans 132.42% 62.50% 53.07% 52.93% 66.90% 63.54% 79.27% Charge-Offs (for the quarter, annualized) Charge offs / Average Loans 0.29% 0.22% 0.42% 0.69% 0.13% 0.22% 0.14% As of: In $000's

Peer Group includes the following institutions: 1st Summit Bancorp, of Johnstown, Inc.; Peoples Financial Services Corp.; Kish Bancorp, Inc.; Dimeco, Inc.; NexTier Inc.,; Allegheny Valley Bancorp, Inc.; Farmers & Merchants Bank of Western PA; Clearfield Bank & Trust Co.; Mars National Bank; and Mercer County State Bank. Average assets of peer group = $486 million

5 credit relationships (15 loans) account for 88.9% ($4.3 million) of nonperforming assets at 3/31/12 Classified & criticized assets include 55
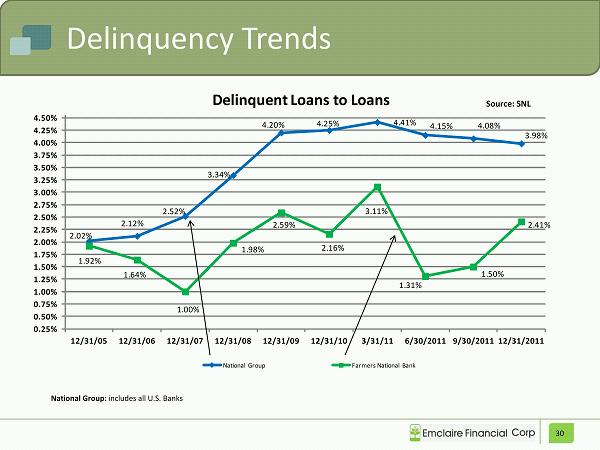
2.02% 2.12% 2.52% 3.34% 4.20% 4.25% 4.41% 4.15% 4.08% 3.98% 1.92% 1.64% 1.00% 1.98% 2.59% 2.16% 3.11% 1.31% 1.50% 2.41% 0.25% 0.50% 0.75% 1.00% 1.25% 1.50% 1.75% 2.00% 2.25% 2.50% 2.75% 3.00% 3.25% 3.50% 3.75% 4.00% 4.25% 4.50% 12/31/05 12/31/06 12/31/07 12/31/08 12/31/09 12/31/10 3/31/11 6/30/2011 9/30/2011 12/31/2011 Delinquent Loans to Loans National Group Farmers National Bank Delinquency Trends 30 National Group: includes all U.S. Banks Source: SNL

Loan Portfolio Growth 39.6% Loan Growth – 12/31/2007 to 3/31/2012 31 $70,000 $100,000 $130,000 $160,000 $190,000 $220,000 $250,000 $280,000 $310,000 $340,000 12/31/2007 12/31/2008 12/31/2009 12/31/2010 12/31/2011 3/31/2012 $124,811 $141,013 $164,277 $173,476 $177,490 $176,727 $107,165 $126,476 $131,540 $136,808 $138,591 $147,009 $231,976 $267,489 $295,817 $310,284 $316,081 $323,736 In $000's Consumer Loans Commercial Loans $’s in 000’s

Capital, Dividends & Stock Performance 32 • Private Placement Offering • Regulatory Capital – Bank • Capital Management • Stock Performance

Private Placement Stock Offering • Completed March 2011 – Issued 290,004 shares of EMCF common stock at $15.95/share • $4.6 million in net new capital: – $1.2 million by directors and officers – $2.5 million by other private individual investors – $914,000 by institutional investors • Participation by 34 accredited individual and institutional investors • Positive regulatory capital impact position for growth 33

Capital Management SBLF Participation $30 Billion government program managed by U.S. Treasury Department Provide banks with capital to lend to small businesses Emclaire obtained $10.0 million investment in August 2011 Redeemed $7.5 Million TARP Dividend can decrease to as low as 1.00% following small business loan growth Supports local economy and small business constituents Attractive- provides“Bridge”more time to exit government funding Planned exit over time through earnings and capital management strategies Reduced debt by $10.0 million $5.0 million FHLB Advance $5.0 million line of credit balance (available credit remains) Quarterly dividend recently increased to $0.18 per share Represents a 12.5% increase from prior dividend of $0.16 per share Sign of continued financial strength

Regulatory Capital - Bank Farmers National Bank of Emlenton Regulatory Capital (Dollar Amounts in $000's) 12/31/2011 12/31/2010 12/31/2009 Average assets $ 483,667$ 471,439$ 454,643 Risk-weighted assets280,269 281,303 274,844 Stockholder's equity48,648 42,256 39,959 Total Capital to Risk-Weighted Assets16.25 %14.52 %13.54 % Actual $ 45,550$ 40,850$ 37,224 To be well capitalized (10.00%)28,027 28,130 27,484 Excess Capital17,523 12,720 9,740 Tier 1 Capital to Risk-Weighted Assets15.00 %13.27 %12.38 % Actual $ 42,046$ 37,326$ 34,022 To be well capitalized (6.00%)16,816 16,878 16,491 Excess Capital25,230 20,448 17,531 Tier 1 Capital to Average Assets8.69 %7.92 %7.48 % Actual $ 42,046$ 37,326$ 34,022 To be well capitalized (5.00%)24,183 23,572 22,732 Excess Capital17,863 13,754 11,290

Blue shaded area = Emclaire Financial Corp Red = KBW Bank Index (BKX) Green = S&P 500 Index Source: SNL Financial Stock Performance – Long Term 36 » Outperformed S&P 500 Index and KBW Bank Index over last 11 years » Total Return (March 2001 – March 2012) = 109.2% o Price Appreciation 32.8% o Dividend Yield 76.4% 100 shares purchased on March 31, 2001 ▪ Total cost = $1,400 ▪ Value at 3/31/12 = $1,859 ▪ Dividends earned = $1,069 x Total gain = $1,528 (6.9% avg. annual return)

Blue shaded area = Emclaire Financial Corp Red = KBW Bank Index (BKX) Green = S&P 500 Index Source: SNL Financial Stock Performance – Short Term 37 » Outperformed S&P 500 Index and KBW Bank Index over last 12 months » Total Return (March 2011 – March 2012) = 11.6% o Price Appreciation 7.8% o Dividend Yield 3.8% 100 shares purchased on March 31, 2011 ▪ Total cost = $1,725 ▪ Value at 3/31/12 = $1,859 ▪ Dividends earned = $ 66 x Total gain = $200 (11.6% total return)

Strategic Update – Looking Ahead 38 • Market Assessment • Planned New Banking Offices • Strategy Recap
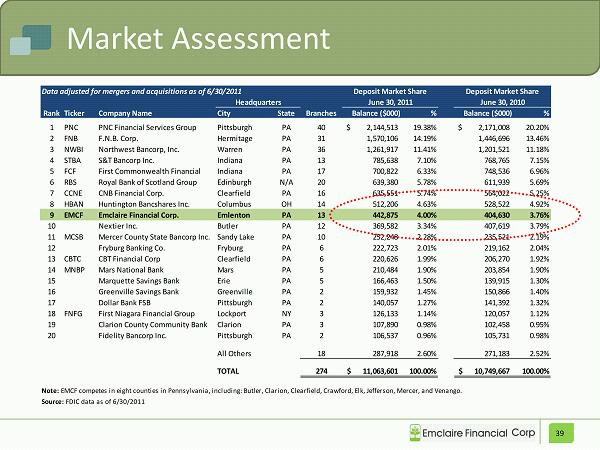
Market Assessment 39 Data adjusted for mergers and acquisitions as of 6/30/2011 RankTicker Company Name City State Branches Balance ($000) % Balance ($000) % 1 PNC PNC Financial Services Group Pittsburgh PA 40 2,144,513$ 19.38% 2,171,008$ 20.20% 2 FNB F.N.B. Corp. Hermitage PA 31 1,570,106 14.19% 1,446,696 13.46% 3 NWBI Northwest Bancorp, Inc. Warren PA 36 1,261,917 11.41% 1,201,521 11.18% 4 STBA S&T Bancorp Inc. Indiana PA 13 785,638 7.10% 768,765 7.15% 5 FCF First Commonwealth Financial Indiana PA 17 700,822 6.33% 748,536 6.96% 6 RBS Royal Bank of Scotland Group Edinburgh N/A 20 639,380 5.78% 611,939 5.69% 7 CCNE CNB Financial Corp. Clearfield PA 16 635,551 5.74% 564,022 5.25% 8 HBAN Huntington Bancshares Inc. Columbus OH 14 512,206 4.63% 528,522 4.92% 9 EMCF Emclaire Financial Corp. Emlenton PA 13 442,875 4.00% 404,630 3.76% 10 Nextier Inc. Butler PA 12 369,582 3.34% 407,619 3.79% 11 MCSB Mercer County State Bancorp Inc. Sandy Lake PA 10 252,248 2.28% 235,521 2.19% 12 Fryburg Banking Co. Fryburg PA 6 222,723 2.01% 219,162 2.04% 13 CBTC CBT Financial Corp Clearfield PA 6 220,626 1.99% 206,270 1.92% 14 MNBP Mars National Bank Mars PA 5 210,484 1.90% 203,854 1.90% 15 Marquette Savings Bank Erie PA 5 166,463 1.50% 139,915 1.30% 16 Greenville Savings Bank Greenville PA 2 159,932 1.45% 150,866 1.40% 17 Dollar Bank FSB Pittsburgh PA 2 140,057 1.27% 141,392 1.32% 18 FNFG First Niagara Financial Group Lockport NY 3 126,133 1.14% 120,057 1.12% 19 Clarion County Community Bank Clarion PA 3 107,890 0.98% 102,458 0.95% 20 Fidelity Bancorp Inc. Pittsburgh PA 2 106,537 0.96% 105,731 0.98% All Others 18 287,918 2.60% 271,183 2.52% TOTAL 274 11,063,601$ 100.00% 10,749,667$ 100.00% Note: EMCF competes in eight counties in Pennsylvania, including: Butler, Clarion, Clearfield, Crawford, Elk, Jefferson, Mercer, and Venango. Source: FDIC data as of 6/30/2011 Headquarters June 30, 2011 Deposit Market Share Deposit Market Share June 30, 2010

Market Assessment 40 County Butler 3,344,069$ 104,865$ 3.14% 12 3 186,847 55,382$ 2.6% Clarion 791,241 99,655 12.59% 6 3 40,499 37,708 2.0% Clearfield 1,326,997 19,274 1.45% 7 1 83,248 39,584 2.3% Crawford 1,161,303 92,410 7.96% 5 1 89,185 41,793 2.2% Elk 663,930 15,228 2.29% 5 1 32,583 48,084 2.4% Jefferson 888,296 23,541 2.65% 8 1 45,343 39,550 2.2% Mercer 2,183,781 12,900 0.59% 8 1 117,398 43,688 2.3% Venango 703,984 75,002 10.65% 5 2 55,112 41,744 2.5% TOTAL 11,063,601$ 442,875$ 4.00% 9 13 650,215 Allegheny 61,523,049 1,220,731 51,369$ 2.9% Armstrong 1,113,731 68,991 39,845 2.3% Beaver 2,080,937 174,138 48,639 2.7% Erie 3,871,933 279,906 47,579 2.6% Indiana 2,084,355 87,927 38,118 2.3% Lawrence 1,480,820 90,839 42,132 2.3% McKean 793,102 43,660 42,677 2.5% Warren 799,922 40,631 44,523 2.1% Washington 4,323,551 210,285 49,939 2.8% Westmoreland 6,785,788 362,461 48,485 2.6% TOTAL 84,857,188$ 2,579,569 GRAND TOTAL 95,920,789$ 3,229,784 Pennsylvania 300,267,467$ 4,724 12,574,407 52,723$ 2.7% United States 8,249,136,699$ 98,477 311,212,863 53,279$ 2.5% Source: FDIC (2011), SNL Financial 2011 Median Household Income ($) 2006-2011 Median HHI CAGR (%) Market Demographics Total Deposits in Market ($000) Deposits in Market ($000) Market Share (%) EMCF as of June 30, 2011 Rank # of EMCF Branches 2011 Population (actual)

Future Office – Cranberry Twp., PA 41 Proposed Cranberry Promenade Banking Office Cranberry Township, PA Target Open = 2012/13

Future Office - Hermitage, PA Proposed Hermitage Banking Office Mercer County Route 18, Hermitage, PA Target Open: 2014/15 42
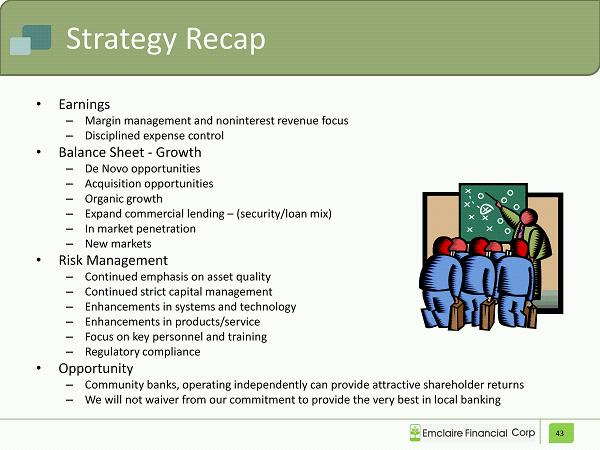
Strategy Recap • Earnings – Margin management and noninterest revenue focus – Disciplined expense control • Balance Sheet - Growth – De Novo opportunities – Acquisition opportunities – Organic growth – Expand commercial lending – (security/loan mix) – In market penetration – New markets • Risk Management – Continued emphasis on asset quality – Continued strict capital management – Enhancements in systems and technology – Enhancements in products/service – Focus on key personnel and training – Regulatory compliance • Opportunity – Community banks, operating independently can provide attractive shareholder returns – We will not waiver from our commitment to provide the very best in local banking 43
Well Positioned • Capital • Franchise • Systems & Technology • People …To execute our strategies and enhance shareholder value… …Our people working diligently, and doing the “right thing” has resulted in and will result in positive financial performance… 44

Open Discussion 45 • Questions and Answers

Closing 46 • Thank you all for attending • Thank you to board, management group and staff • Special thank you

Special Thank You Administrative Professionals Day Best Wishes – Dave Cox 47

2012 Annual Meeting of Shareholders Parent Holding Company of The Farmers National Bank of Emlenton April 25, 2012 – 9:00 AM Emlenton, Pennsylvania William C. Marsh Chairman, President & CEO