Attached files
| file | filename |
|---|---|
| 8-K - 8-K - SIGMA ALDRICH CORP | d338737d8k.htm |
| EX-99.1 - EX-99.1 - SIGMA ALDRICH CORP | d338737dex991.htm |
 Sigma-Aldrich Corporation
Q1 2012 Earnings Review & Outlook
•
Enabling Science to Improve the Quality of Life
sigma-aldrich.com
Exhibit 99.2 |
 2
2
Cautionary Statements
Our
presentation
today
may
include
forward-looking
statements
within
the
meaning
of
Section
27A
of
the
Securities
Act
of
1933
and
Section
21E of the Securities Exchange Act of 1934. Such statements involve risk and
uncertainty, including financial, business environment
and
projections,
and
related
to
matters
that
are
not
historical
facts.
Such
statements
are
preceded
by,
followed
by
or
include
the words “believes,”
“can,”
“expects,”
“plans,”
“anticipates,”
“should,”
“enhances,”
“estimates,”
“forecasts,”
“will”
or similar expressions.
Additionally, this presentation contains forward-looking statements relating to
future performance, goals, strategic actions and initiatives and similar
intentions and beliefs, including, without limitation, statements with respect to Sigma-Aldrich Corporation’s (the “Company,”
“we,”
“us”
or “our”) expectations, goals, beliefs, intentions, outlook, plans and
the like regarding future sales, earnings, free cash flow, share
repurchases, acquisitions and other matters. These statements are based on
assumptions regarding the Company operations, investments and acquisitions
and conditions in the market the Company serves. The Company believes these assumptions are reasonable
and well founded. The statements in this presentation are subject to risks
and uncertainties, including, among others, certain economic, political and
technological factors. Actual results could differ materially from those stated or implied in this presentation, due to, but not
limited to, such factors as (1) global economic conditions, (2) changes in pricing
and the competitive environment and the global demand for
the
Company’s
products,
(3)
fluctuations
in
foreign
currency
exchange
rates,
(4)
changes
in
research
funding
and
the
success
of
research and development activities, (5) failure of planned sales initiatives in
our Research and SAFC business units, (6) dependence on uninterrupted
manufacturing
operations
and
global
supply
chain,
(7)
changes
in
the
regulatory
environment
in
which
the
Company
operates, (8) changes in worldwide tax rates or tax benefits from domestic and
international operations, including the matters described in Note 10
– Income Taxes to the Company’s Consolidated Financial Statements
included in Item 8, Part II in the Company’s Annual Report on Form
10-K for the year ended December 31, 2011 (the “10-K”), (9) exposure to litigation including product liability claims, (10) the ability
to maintain adequate quality standards, (11) reliance on third party package
delivery services, (12) an unanticipated increase in interest rates, (13)
other changes in the business environment in which the Company operates, (14) the outcome of the outstanding matters
described in Note 11 –
Contingent Liabilities and Commitments, to the Company’s consolidated
financial statements included in Item 8, Part II in the 10-K and (15)
acquisitions or divestitures of businesses. A further discussion of the Company’s risk factors can be found in
Item 1A of Part I of the 10-K. The Company does not undertake any
obligation to update these forward-looking statements. •
With over 60 percent of sales denominated in currencies other than the U.S. dollar,
management uses currency adjusted growth, and believes it is useful to
investors, to judge the Company’s local currency performance. Organic sales growth data presented herein excludes
currency
impacts,
and
where
indicated,
acquisition
impacts.
The
Company
calculates
the
impact
of
changes
in
foreign
currency
exchange
rates by multiplying current period activity by the difference between current
period exchange rates and prior period exchange rates; the result
is
the
defined
impact
of
“changes
in
foreign
currency
exchange
rates”
or
“changes
in
FX.”
While
we
are
able
to
report
currency
impacts after the fact, we are unable to estimate changes that may occur later in
2012 to applicable exchange rates. Any significant changes in currency
exchange rates would likely have a significant impact on our reported growth rates due to the volume of our sales
denominated in foreign currencies.
•
Management also uses the following non-GAAP measures to judge its performance
and ability to pursue opportunities that enhance shareholder value:
adjusted net income and EPS; adjusted operating income margin (reconciled on Slide 14); and free cash flow (provided
on Slide 17). Due to the uncertain timing of future restructuring and other
special charges we are unable to include these charges in the 2012 diluted
adjusted EPS forecast or provide reconciliation to the corresponding GAAP measures. Management believes this non-GAAP
information is useful to investors as well. Reconciliations of GAAP to non-GAAP
information are included in the Company’s April 24, 2012 earnings
release
posted
on
its
website,
www.sigma-aldrich.com,
and
in
the
Appendix
–
Reconciliation
of
GAAP
to
Non-GAAP
Financial
Measures beginning on Slide 12. |
 3
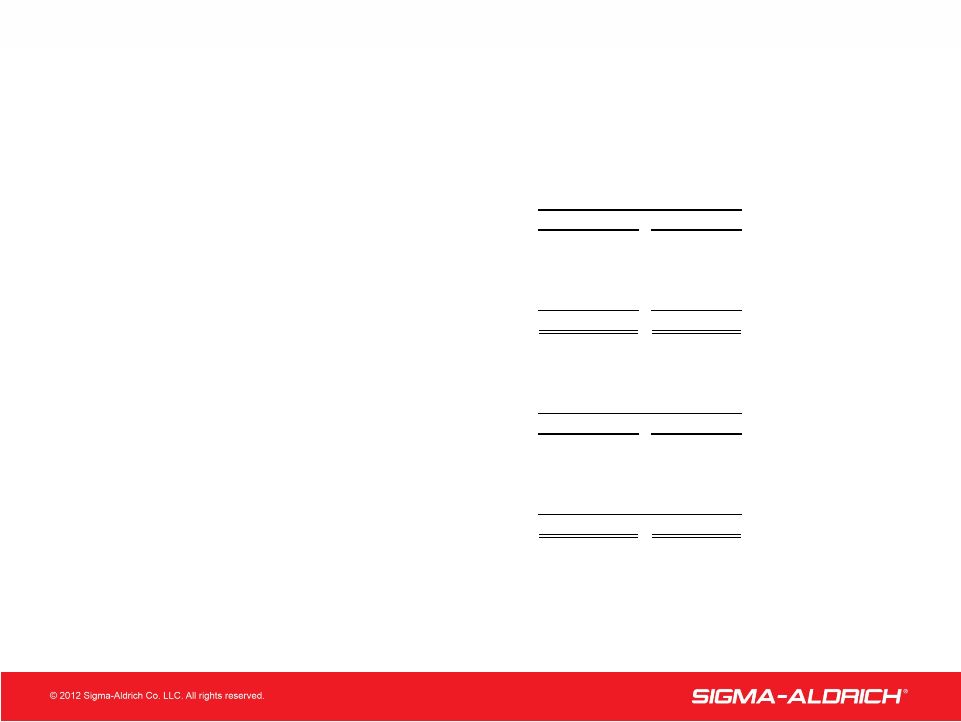
1st Quarter 2012 Financial Results
($ in millions, except per share amounts)
3
YEAR-OVER-YEAR
Sales of $665 Million Increase 5% Over Last Year
Sales and Operating Income New Quarterly Highs
As
Reported
Q1 2012
As
Reported
Excluding
Special
Items
Operating Income
$ 172
3%
4%
Net Income
$ 117
2%
4%
Diluted EPS
$0.96
1%
5%
Free Cash Flow
$ 112
16%
Q1 2012
As
Reported
Excluding
Currency and
Acquisition
Impacts
Sales
$ 665
5%
3%
YEAR-OVER-YEAR
(1)
(1)
See Slide 17 for Reconciliation of Net Cash Provided by Operating Activities to
Free Cash Flow (2)
Special items include one-time restructuring charges, acquisition related
transaction costs and tax benefit item. (2) |
 4
4
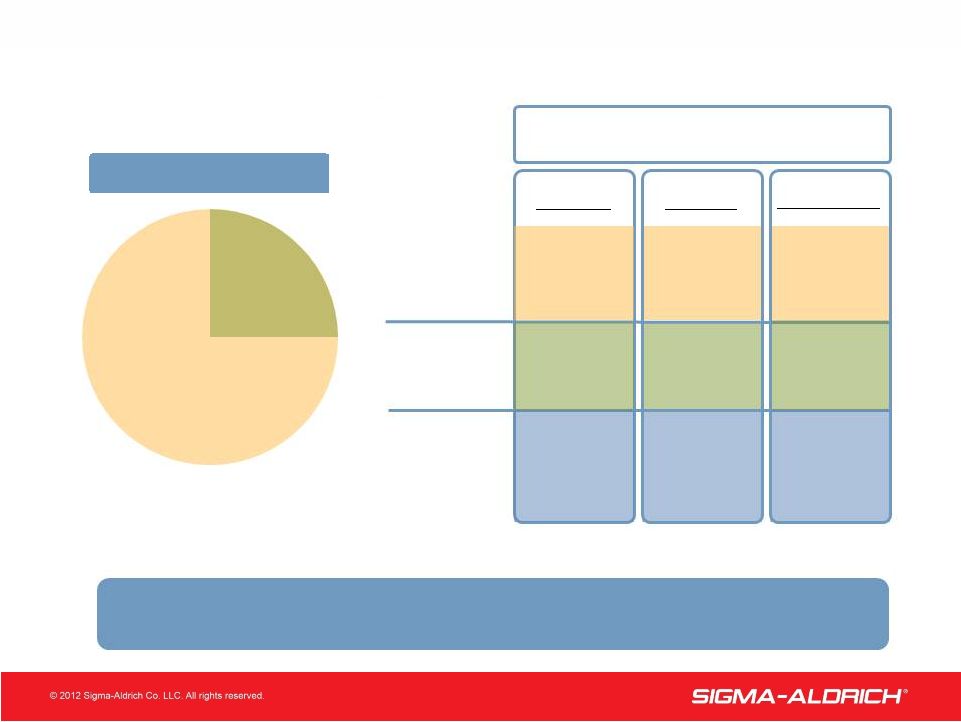
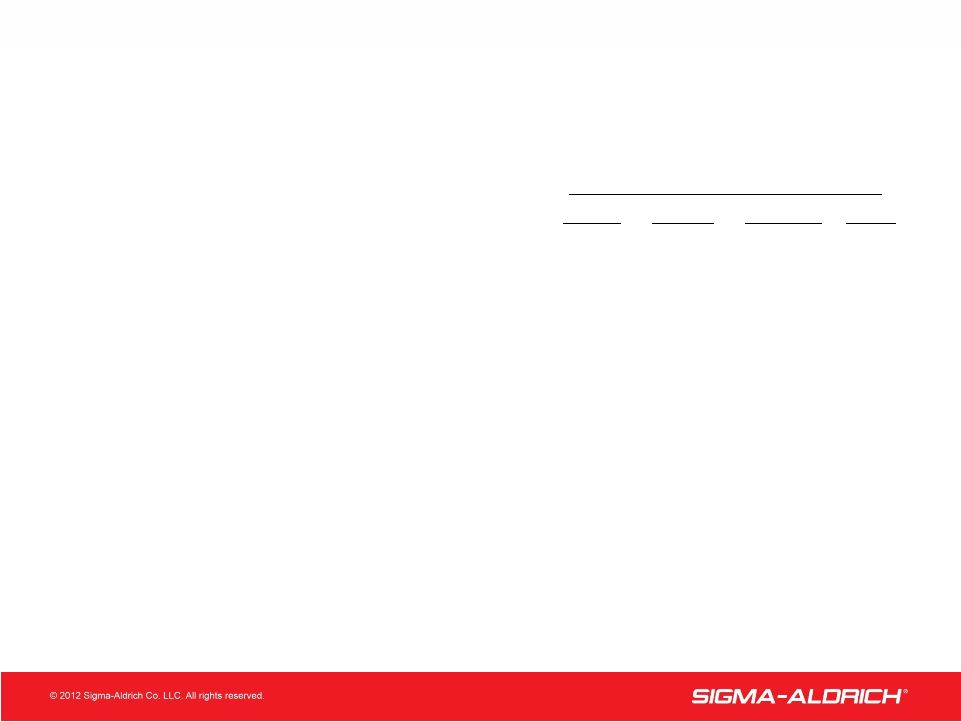
2012 Sales Growth
RESEARCH
70%
30%
SAFC
4%
1%
3%
Research
SAFC
Total
Company
Organic*
Reported
4%
9%
5%
Q1 2012 / Q1 2011
Sales Mix (QTD)
*See Slide 16 for Reconciliation of Reported Sales Growth to Adjusted (Organic)
Sales Growth. 2%
9%
4%
Acquisitions
Organic Sales Growth in Line with Expectations |
 5
5
Q1 2012 Sales Performance Highlight
Innovation
Reported
Organic
(1)
•
Analytical, Biology, Materials Science
Sales Growth
(2)
4-8%
3-9%
Geographic Growth
•
North America
5%
1%
•
Europe
1%
2%
•
Asia Pacific/Latin America
13%
9%
•
Focus Markets –
India, China, Brazil
21%
13%
eCommerce Sales
•
Increase in sales through
channel
8%
(2)
Varies for individual product lines.
(1)
Adjusted for currency and acquisitions. See Slides 15 & 16 for
Reconciliation of Reported Sales Growth to Adjusted (Organic) Sales
00
Growth.
Initiatives Collectively on Track |
 6
26.6%
6
Margin Analysis
Adjusted
Operating
Margin,
Excluding
the
Impact
of
Acquisitions,
Improved
PERCENTAGE OF SALES
Q1 2012
Adjusted
Operating
Income
Margin
–
Q1
2011
26.9%
Adjusted Operating Income Before Acquisitions
(1)
(1)
(1)
Adjusted Operating Margin excludes one-time acquisition transaction costs and
restructuring charges. See Slide 14 for Reconciliation of 00Reported Operating Income Margin to Adjusted Operating Income Margin.
Currency
0.2%
SG&A / R&D
(0.2%)
Acquisitions
(1.0%)
Volume / Price / Mix
0.7%
27.6%
Adjusted
Operating
Income
Margin
–
Q1
2012 |
 7
7
Free Cash Flow
(in millions)
2012
$ 117
32
(56)
51
144
(32)
$ 112
Net Income
Free Cash Flow
Net Cash Provided by Operating Activities
Less Capital Expenditures
Other
Changes in Performance Working Capital*
Depreciation & Amortization
2011
*Accounts
Receivable
+
Inventory
–
Accounts
Payable
3 Months Ended March 31
Working
Capital
and
Capital
Expenditures
Increase
to
Support
Sales
Growth
and
Improve
Operational Efficiency
$ 119
26
(45)
51
151
(18)
$ 133 |
 8
8
•
Record quarter for sales and earnings
•
Acquisition of BioReliance and Research Organics
•
New Capacity
First Quarter 2012 Highlights
Q1 Results Meet Expectations; Acquisition and New Capacity to Boost Sales
Growth |
 9
•
Macro-economic Pressures
•
Industry Consolidation
•
Outsourcing in Pharmaceutical
•
Emerging Market Growth
•
Shift to Biologics
•
Applied Markets Growth
Key Trends Drive Opportunities
Sigma-Aldrich Positioned to Capitalize on These Market Trends
|
 10
10
2012 Guidance
Organic Sales Growth
1st Half
Mid Single-digit
2nd Half
Full Year
Low Double-digits
Low to Mid Single-digit
Research
SAFC
Mid
Single-digit
Organic Sales Growth and EPS Outlook Reaffirmed
Low to Mid Single-digit
Diluted Adjusted EPS*
Free Cash Flow
$ 3.90 to $
4.05
Approximately $425M
*Excludes any new restructuring charges, transaction costs associated with
acquisitions and other one time charges. |
 11
11
QUESTIONS?
Sigma-Aldrich Corporation
Q1 2012 Earnings Review |
 12
Appendix
Reconciliation of GAAP to Non-GAAP
Financial Measures |
 13
Reconciliation of Reported Net Income and Diluted Earnings
Per Share to Adjusted Net Income and Adjusted Diluted
Earnings Per Share (Unaudited)
2012
2011
2012
2011
Reported net income
117
$
119
$
0.96
$
0.97
$
Acquisition transaction costs
4
-
0.03
-
Restructuring costs
-
2
-
0.01
Tax Benefit
-
(5)
-
(0.04)
Adjusted net income
121
$
116
$
0.99
$
0.94
$
Three Months Ended
Three Months Ended
March 31,
March 31,
Net Income
Diluted Earnings
(in millions)
Per Share |
 14
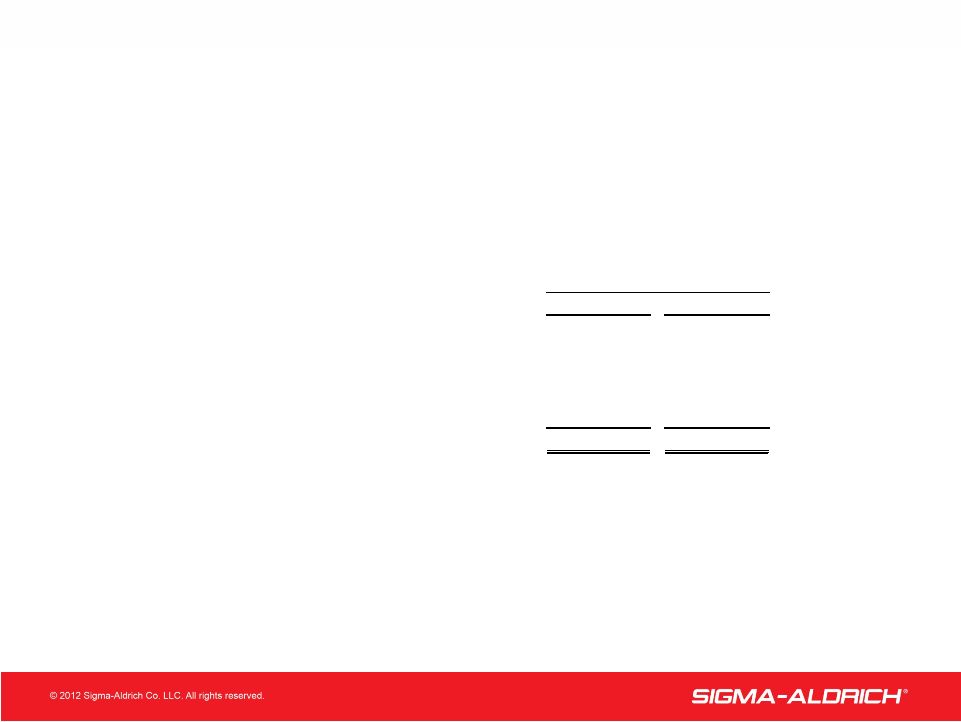
Reconciliation of Reported Operating Income to Adjusted
Operating Income (Unaudited)
2012
2011
Reported operating income
172
$
167
$
Acquisition transaction costs
5
-
Restructuring costs
-
3
Adjusted
operating income 177
$
170
$
2012
2011
Reported operating income margin
25.9%
26.4%
Acquisition transaction costs
0.7%
-
Restructuring costs
-
0.5%
Adjusted operating income margin
26.6%
26.9%
Three Months Ended
March 31,
Three Months Ended
March 31, |
 15
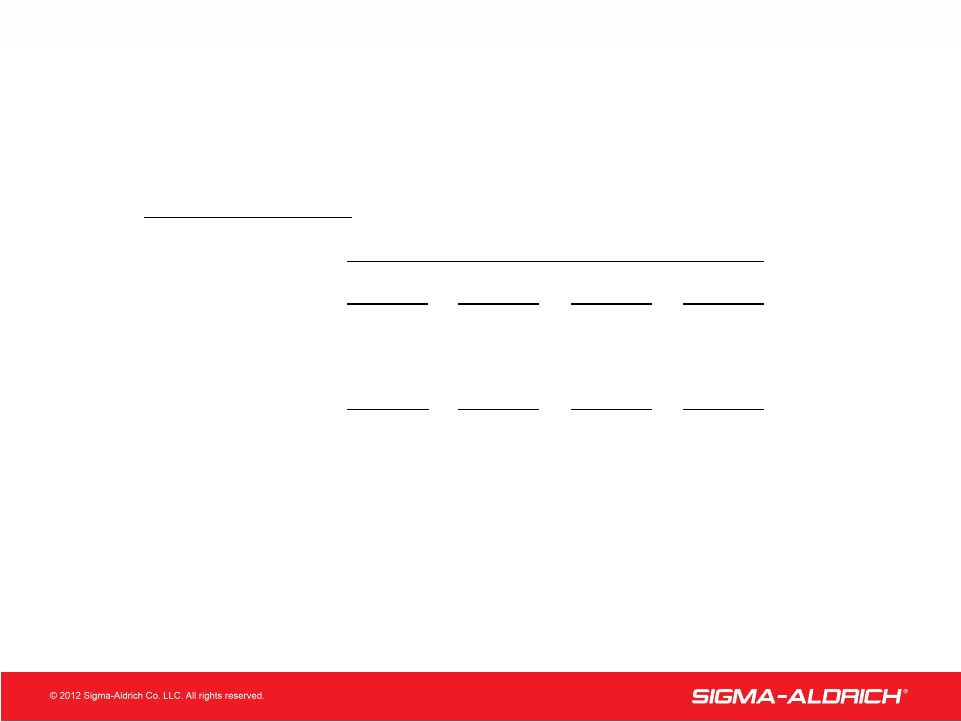
Reconciliation of Reported Sales Growth to Adjusted (Organic)
Sales Growth (Unaudited)
Three
Months
Ended
March
31,
2012
Reported
FX Impact
Acquisitions
Organic
•
Analytical, Biology, Materials Science Sales
Growth Geographic
Growth •
North America
•
Europe
•
Asia Pacific/Latin
America
•
Focus Markets –
India, China, Brazil
*Varies for individual product areas
4 - 8%
*
(1) - (2)%
*
0 - 2%
*
3 - 9%
*
5%
- %
4%
1%
1%
(4)%
3%
2%
13%
- %
4%
9%
21%
(3)%
11%
13% |
 16
Reconciliation of Reported Sales Growth to Adjusted (Organic)
Sales Growth (Unaudited)
Sales Growth by Business Unit
Currency
Acquisition
Adjusted
Reported
Benefit
Benefit
(Organic)
Research Chemicals
4%
(2%)
2%
4%
SAFC
9%
(1%)
9%
1%
Total Customer Sales
5%
(2%)
4%
3%
Three Months
Ended March 31, 2012 |
 17
Reconciliation of Net Cash Provided by Operating Activities to
Free Cash Flow (Unaudited)
In millions
2012
2011
Net cash provided by operating activities
144
$
151
$
Less: Capital expenditures
(32)
(18)
Free cash flow
112
$
133
$
March 31,
Three Months Ended |