Attached files
| file | filename |
|---|---|
| 8-K - 8-K - RYDER SYSTEM INC | d338820d8k.htm |
| EX-99.1 - EX-99.1 - RYDER SYSTEM INC | d338820dex991.htm |
 First Quarter 2012
Earnings Conference Call
April 24, 2012
Exhibit 99.2 |
 04/24/2012
Safe Harbor and Non-GAAP Financial Measures
Certain
statements
and
information
included
in
this
presentation
are
"forward-looking
statements"
under
the
Federal
Private
Securities
Litigation
Reform
Act
of
1995.
Accordingly,
these
forward-looking
statements
should
be
evaluated
with
consideration
given
to
the
many
risks
and
uncertainties
inherent
in
our
business
that
could
cause
actual
results
and
events
to
differ
materially
from
those
in
the
forward-looking
statements.
Important
factors
that
could
cause
such
differences
include,
among
others,
a
slowdown
of
the
economic
recovery
and
decreases
in
freight
demand,
our
ability
to
obtain
adequate
profit
margins
for
our
services,
our
inability
to
maintain
current
pricing
levels
due
to
soft
economic
conditions,
uncertainty
or
decline
in
economic
and
market
conditions
affecting
demand
for
our
services,
a
decline
in
the
market
for
used
vehicles
resulting
in
a
decline
in
residual
values
of
our
lease
or
rental
vehicles,
competition
from
other
service
providers,
customer
retention
levels,
unexpected
volatility
or
declines
in
automotive
or
high-tech
volume,
loss
of
key
customers
in
the
Supply
Chain
Solutions
(SCS)
business
segment,
unexpected
reserves
or
write-offs
due
to
the
deterioration
of
the
credit
worthiness
or
bankruptcy
of
customers,
changes
in
financial,
tax
or
regulatory
requirements
or
changes
in
customers’
business
environments
that
will
limit
their
ability
to
commit
to
long-term
vehicle
leases,
a
decrease
in
credit
ratings,
increased
debt
costs
resulting
from
volatile
financial
markets,
inability
to
achieve
planned
synergies
and
customer
retention
levels
or
anticipate
costs
and
liabilities
from
acquisitions,
labor
strikes
or
work
stoppages
affecting
our
or
our
customers’
business
operations,
driver
and
technician
shortages
and
increasing
driver
costs,
adequacy
of
accounting
estimates,
reserves
and
accruals
particularly
with
respect
to
pension,
taxes,
insurance
and
revenue,
a
decline
in
pension
plan
returns,
changes
in
obligations
relating
to
multi-employer
plans,
sudden
or
unusual
changes
in
fuel
prices,
our
ability
to
manage
our
cost
structure,
new
accounting
pronouncements,
rules
or
interpretations,
changes
in
government
regulations,
new
proposed
changes
in
lease
accounting
rules,
the
inability
to
comply
with
government
regulations
particularly
relating
to
various
state
and
federal
privacy,
employment
and
environmental
regulations,
new
legal
proceedings
or
unanticipated
outcomes
in
existing
legal
proceedings
and
the
risks
described
in
our
filings
with
the
Securities
and
Exchange
Commission.
The
risks
included
here
are
not
exhaustive.
New
risks
emerge
from
time
to
time
and
it
is
not
possible
for
management
to
predict
all
such
risk
factors
or
to
assess
the
impact
of
such
risks
on
our
business.
Accordingly,
we
undertake
no
obligation
to
publicly
update
or
revise
any
forward-looking
statements,
whether
as
a
result
of
new
information,
future
events,
or
otherwise.
This
presentation
includes
certain
non-GAAP
financial
measures
as
defined
under
SEC
rules,
including
operating
revenue,
comparable
earnings,
comparable
EPS
excluding
non-service
pension
costs,
2012
comparable
EPS
forecasts,
comparable
earnings
before
income
tax,
comparable
tax
rate,
adjusted
return
on
capital,
adjusted
total
capital,
total
cash
generated,
free
cash
flow,
total
obligations
and
the
ratios
based
on
these
financial
measures.
Refer
to
Appendix
–
Non-GAAP
Financial
Measures
for
more
information
about
the
non-GAAP
financial
measures
contained
in
this
presentation.
Additional
information
regarding
non-
GAAP
financial
measures
can
also
be
found
in
our
reports
filed
with
the
SEC,
which
are
available
in
the
Investors
area
of
our
website
at
investors.ryder.com.
2
Proprietary and Confidential |
 Contents
First
Quarter
2012
Results
Overview
Asset Management Update
Earnings Outlook
Q & A
04/24/2012
3
Proprietary and Confidential |
 04/24/2012
1st Quarter Results Overview
Earnings
per
diluted
share
from
continuing
operations
were
$0.68
in
1Q12
vs.
$0.50
in
1Q11
–
1Q12
included
a
$0.09
net
benefit
related
to
the
resolution
of
a
tax
matter,
partially
offset
by
acquisition-related
restructuring
costs
–
1Q11 included a $0.01 charge for acquisition-related restructuring costs
Comparable earnings per share from continuing operations were $0.59 vs.
$0.51 in 1Q11
Total revenue increased 8% (and operating revenue increased 9%) vs. prior
year reflecting the impact of organic revenue growth and acquisitions
4
Proprietary and Confidential |
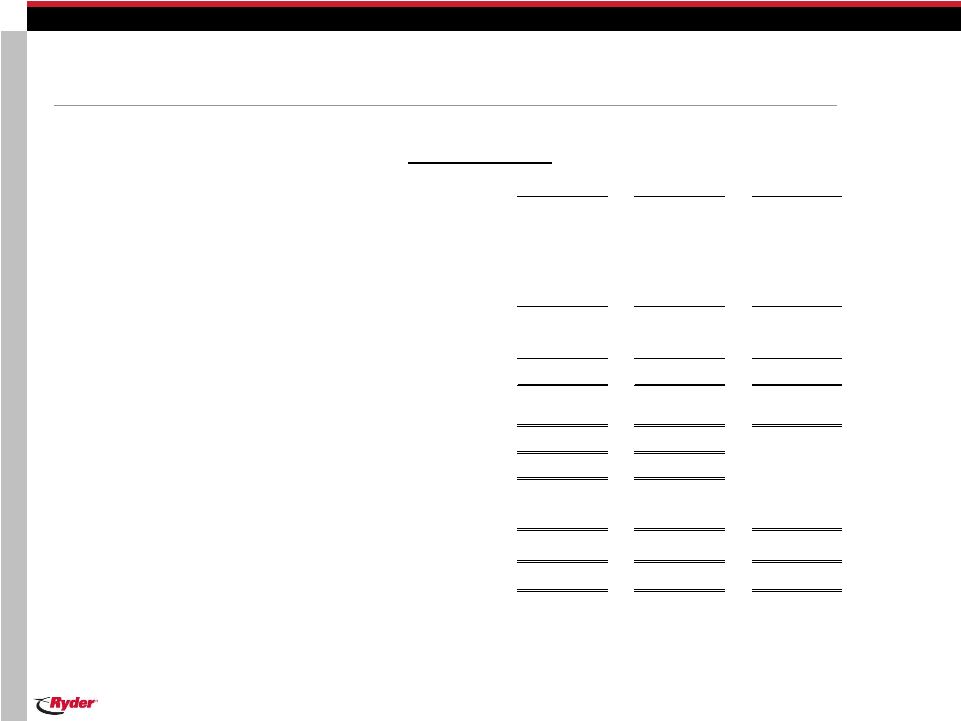
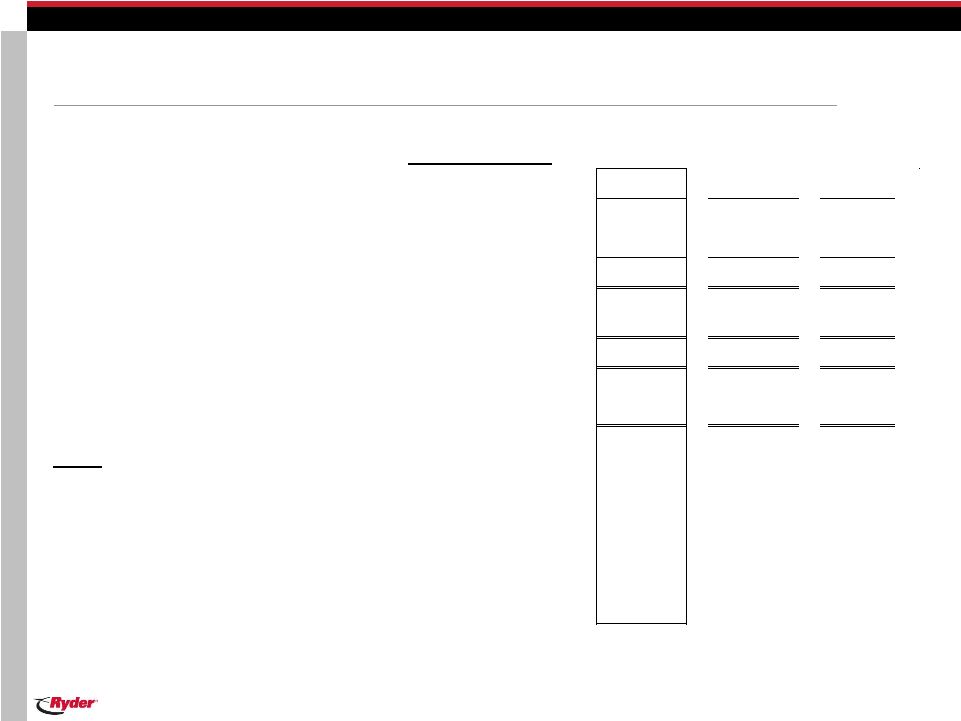 Key
Financial Statistics First Quarter
($ Millions, Except Per Share Amounts)
Note: Amounts throughout presentation may not be additive due to
rounding. 2012
2011
% B/(W)
Operating Revenue
1,228.9
$
1,129.1
$
9%
Fuel Services and Subcontracted Transportation Revenue
307.4
296.3
4%
Total Revenue
1,536.3
$
1,425.4
$
8%
Earnings Per Share From Continuing Operations
0.68
$
0.50
$
36%
Comparable Earnings Per Share From Continuing Operations
0.59
$
0.51
$
16%
Net Earnings Per Share
0.67
$
0.48
$
40%
Memo:
50.9
51.0
Tax Rate From Continuing Operations
26.9%
40.7%
Comparable Tax Rate From Continuing Operations
37.1%
40.7%
5.6%
5.1%
Comparable EPS from Continuing Operations excluding
Non-Service Pension Costs
0.69
$
0.56
$
23%
04/24/2012
5
Proprietary and Confidential
Average Shares (Millions) -
Diluted
Adjusted Return on Capital (Trailing 12 month) |
 04/24/2012
1st Quarter Results Overview -
FMS
Fleet Management Solutions (FMS) total revenue up 9% (and operating revenue
up 10%) vs. prior year
–
Contractual revenue up 6%
–
Full service lease revenue up 6%
–
Contract maintenance revenue increased 5%
–
Commercial rental revenue up 26%
–
Fuel revenue up 7% due primarily to increase in fuel pass-throughs
FMS earnings before tax (EBT) up 20%
–
FMS EBT percent of operating revenue up 50 basis points to 6.4%
FMS earnings positively impacted by the Hill Hire acquisition, organic lease
growth, improved used vehicle sales results and commercial rental performance
–
These
benefits
were
partially
offset
by
higher
maintenance
costs
to
service
a
slightly
older
lease
fleet,
including
higher
outservicing
costs,
and
new
sales
commissions
6
Proprietary and Confidential |
 04/24/2012
1st Quarter Results Overview –
SCS (including DCC)
Supply
Chain
Solutions
(SCS)
total
revenue
up
7%
(and
operating
revenue
up
7%)
vs.
prior
year
due
to
higher
overall
freight
volumes
and
new
business,
as
well
as
a
prior
year
acquisition
SCS earnings before tax (EBT) up 8%
–
SCS
EBT
percent
of
operating
revenue
remained
unchanged
at
4.5%
SCS
earnings
increased
due
to
higher
freight
volumes
and
new
business
7
Proprietary and Confidential |
 04/24/2012
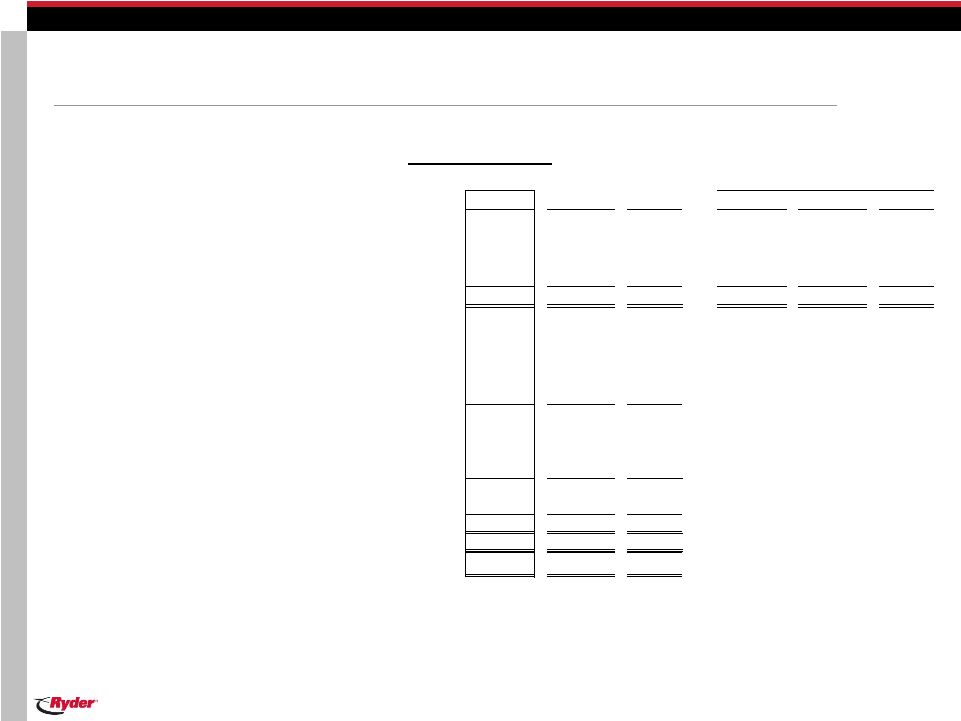
Business Segments
2012
2011
% B/(W)
2012
2011
% B/(W)
Operating Revenue:
Fleet Management Solutions
792.7
$
719.0
$
10%
1,071.4
$
980.1
$
9%
Supply Chain Solutions
(1)
484.6
452.7
7%
571.9
535.8
7%
Eliminations
(48.4)
(42.6)
(14)%
(107.0)
(90.5)
(18)%
Total
1,228.9
$
1,129.1
$
9%
1,536.3
$
1,425.4
$
8%
Segment Earnings Before Tax:
(2)
Fleet Management Solutions
50.7
$
42.4
$
20%
Supply Chain Solutions
(1)
21.9
20.2
8%
Eliminations
(6.5)
(4.9)
32%
66.1
57.6
15%
Central Support Services (Unallocated Share)
(9.5)
(8.7)
(9)%
Non-Service Pension Costs
(8.0)
(4.5)
(77)%
Restructuring and Other Charges, Net and Other Items
(0.9)
(0.8)
(13)%
Earnings Before Income Taxes
47.7
43.6
9%
Provision for Income Taxes
(12.8)
(17.8)
28%
Earnings from Continuing Operations
34.9
$
25.9
$
35%
Comparable Earnings from Continuing Operations
30.6
$
26.3
$
16%
Net Earnings
34.3
$
25.1
$
37%
Memo: Total Revenue
First Quarter
(1)
Combined Supply Chain Solutions and Dedicated Contract Carriage.
(2)
Our primary measure of segment financial performance excludes unallocated CSS,
non-service pension costs, restructuring and other charges, net and other items.
($ Millions)
8
Proprietary and Confidential |
 04/24/2012
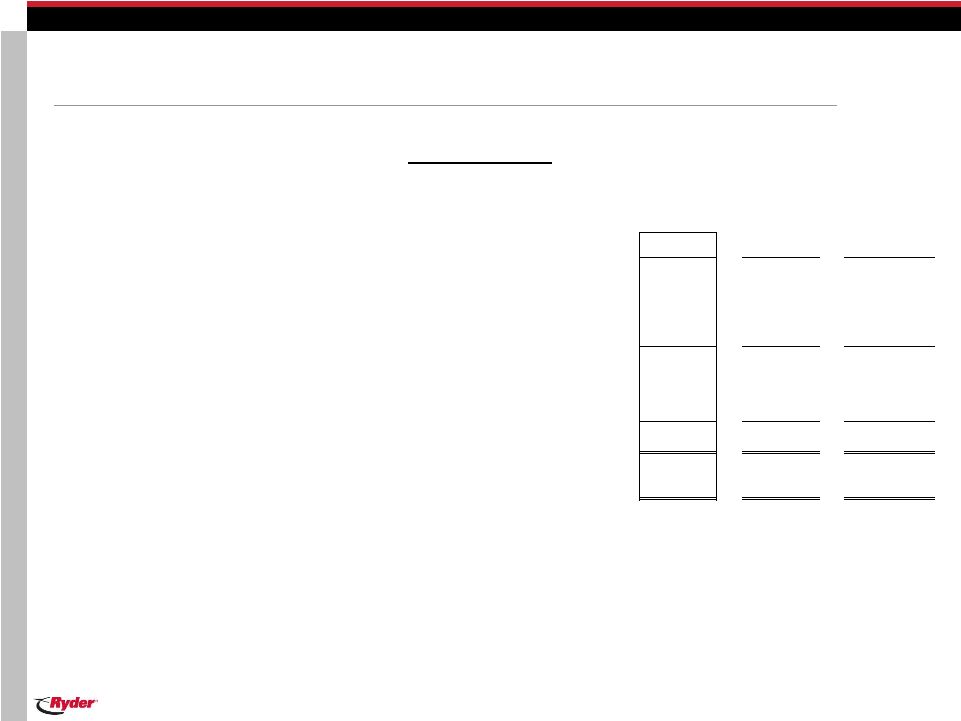
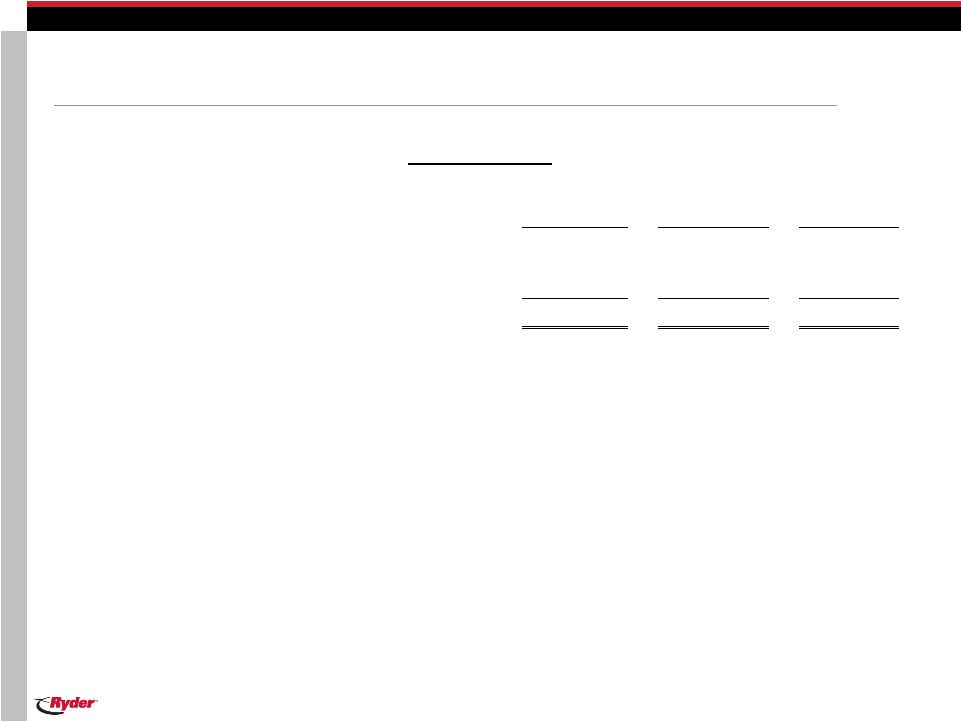
Capital Expenditures
2012 $
2012
2011
O/(U) 2011
Full Service Lease
436
$
112
$
324
$
Commercial Rental
335
317
18
Operating Property and Equipment
16
18
(2)
Gross Capital Expenditures
787
448
339
Less: Proceeds from Sales (Primarily Revenue Earning Equipment)
94
71
23
Net Capital Expenditures
693
$
377
$
316
$
Memo: Acquisitions
2
$
84
$
(82)
$
First Quarter
($ Millions)
9
Proprietary and Confidential |
 04/24/2012
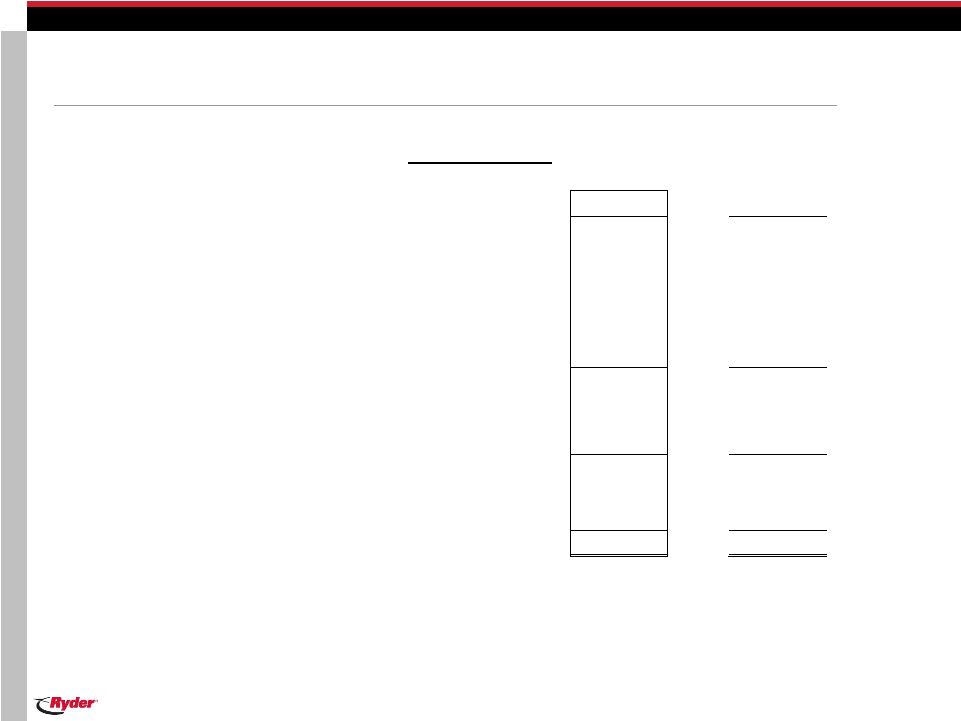
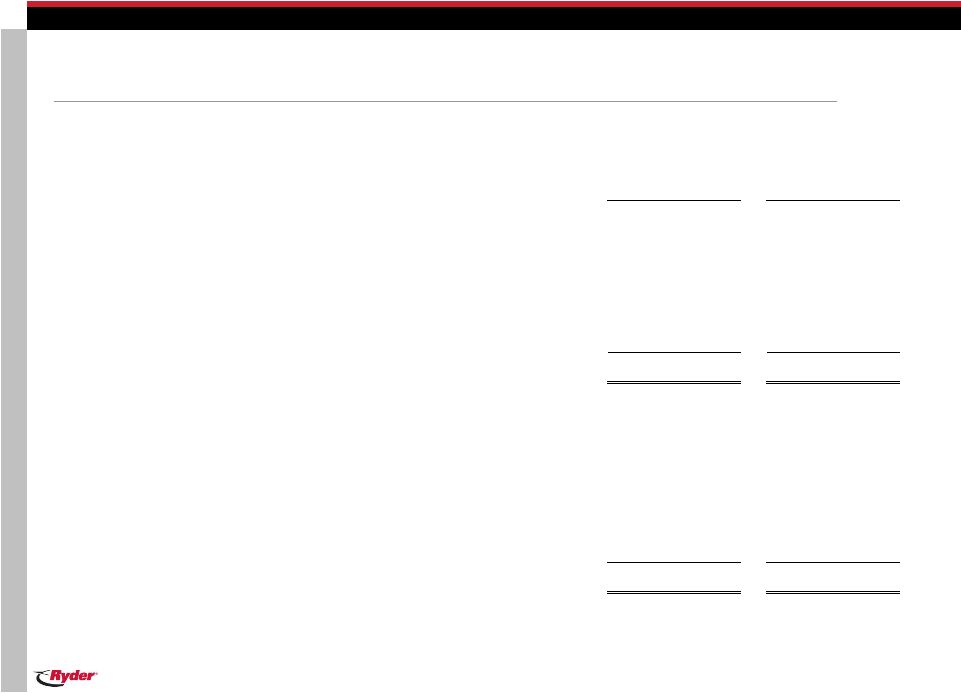
Cash Flow from Continuing Operations
First Quarter
($ Millions)
2012
2011
Earnings from Continuing Operations
35
$
26
$
Depreciation
227
206
Gains on Vehicle Sales, Net
(22)
(12)
Amortization and Other Non-Cash Charges, Net
14
12
Pension Contributions
(4)
(4)
Changes in Working Capital and Deferred Taxes
(63)
(10)
Cash Provided by Operating Activities
186
218
Proceeds from Sales (Primarily Revenue Earning Equipment)
94
71
Collections of Direct Finance Leases
15
15
Total Cash Generated
296
304
Capital Expenditures
(1)
(471)
(313)
Free Cash Flow
(2)
(175)
$
(10)
$
(1)
Capital expenditures presented net of changes in accounts payable related to
purchases of revenue earning equipment. (2)
Free Cash Flow excludes acquisitions and changes in restricted cash.
10
Proprietary and Confidential |
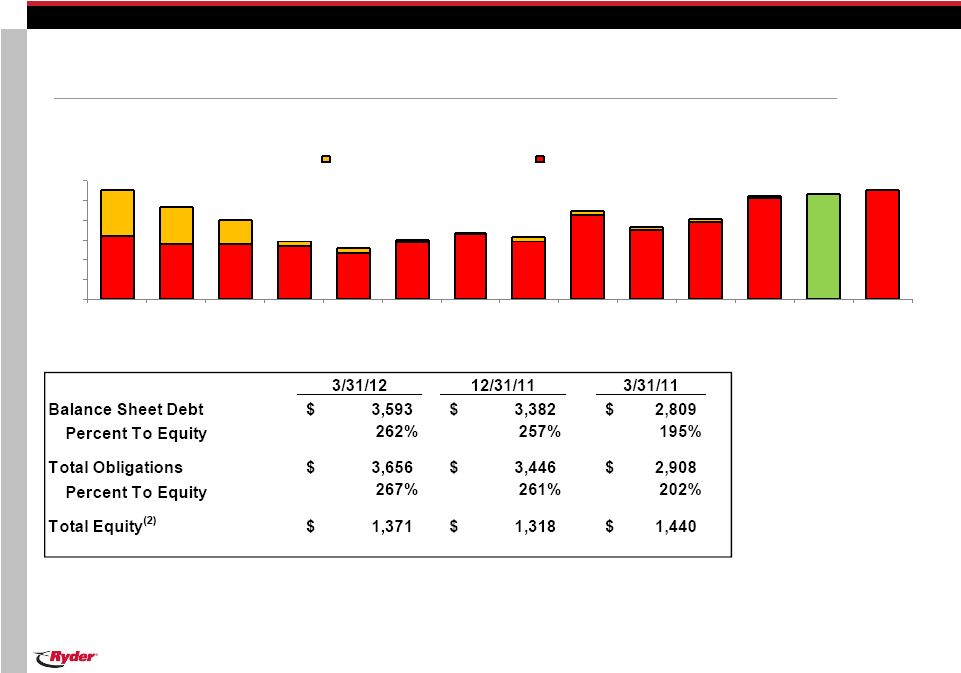 275%
234%
201%
146%
129%
151%
168%
157%
225%
183%
203%
261%
267%
275%
0%
50%
100%
150%
200%
250%
300%
12/31/00
12/31/01
12/31/02
12/31/03
12/31/04
12/31/05
12/31/06
12/31/07
12/31/08
12/31/09
12/31/10
12/31/11
3/31/12
Long Term
Target
Midpoint
Total Obligations to Equity
Balance Sheet Debt to Equity
04/24/2012
Debt to Equity Ratio
(1)
Represents
long
term
total
obligations
to
equity
target
of
250
-
300%
while
maintaining
a
strong
investment
grade
rating.
(2)
Total Equity includes impact of accumulated net pension related equity charge of
$591 million as of 3/31/12, $595 million as of 12/31/11 and $420 million as of 3/31/11.
($ Millions)
(1)
11
Proprietary and Confidential |
 Contents
First Quarter 2012 Results Overview
Asset Management Update
Earnings Outlook
Q & A
04/24/2012
12
Proprietary and Confidential |
 04/24/2012
Units held for sale were 8,700 at quarter end, up from 5,000 units held for sale in
the prior year
–
Average units held for sale were 7,400 during the quarter, up from 5,200 in the
prior year The number of used vehicles sold in the first quarter were 5,000,
up 22% from the prior year
Proceeds per unit were up 20% for tractors and were up 3% for trucks in the first
quarter compared with prior year (excluding the impact of exchange
rates) –
Proceeds per unit were up 1% for tractors and up 1% for trucks vs. the prior
quarter Vehicles no longer earning revenue (including units held for sale)
were 12,200 at quarter- end, up 4,800 from the prior year
Average first quarter total commercial rental fleet was up 31%
year-over-year (13% excluding acquisitions)
Global Asset Management Update
(1)
(1)
Units rounded to nearest hundred.
13
Proprietary and Confidential |
 Contents
First Quarter 2012 Results Overview
Asset Management Update
Earnings Forecast
Q & A
04/24/2012
14
Proprietary and Confidential |
 04/24/2012
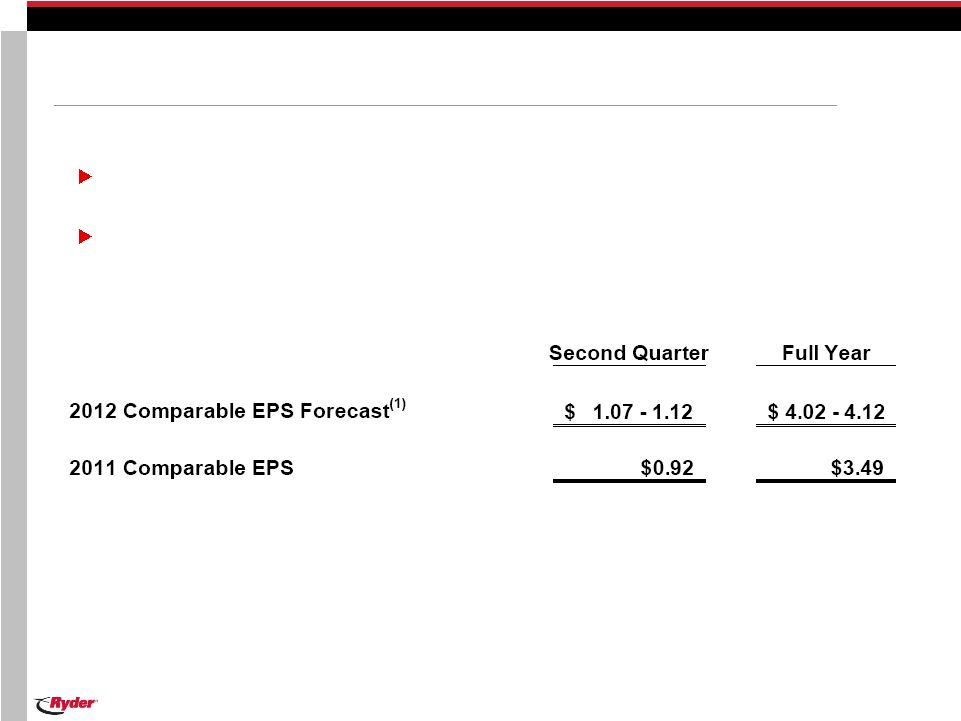
EPS Forecast –
Continuing Operations
($ Earnings Per Share)
(1)
Full Year 2012 Comparable EPS Forecast excludes a $0.10 tax benefit and a $0.02
restructuring charge. Second Quarter 2012 Comparable EPS Forecast excludes $0.01
in restructuring charges. Full year 2011 excludes $0.09 in net tax charges, $0.05
in restructuring charges and $0.04 in acquisition transaction costs. Raising
full year EPS forecast from $4.00 - $4.10 to $4.02 -
$4.12
Current forecast is as follows:
15
Proprietary and Confidential |
 Q&A
04/24/2012
16
Proprietary and Confidential |
 Appendix
Business Segment Detail
Central Support Services
Balance Sheet
Asset Management
Financial Indicators Forecast
New
Business
Segment
Presentation
(2009
–
2011)
New
SCS
Segment
Presentation
(2009
–
2011)
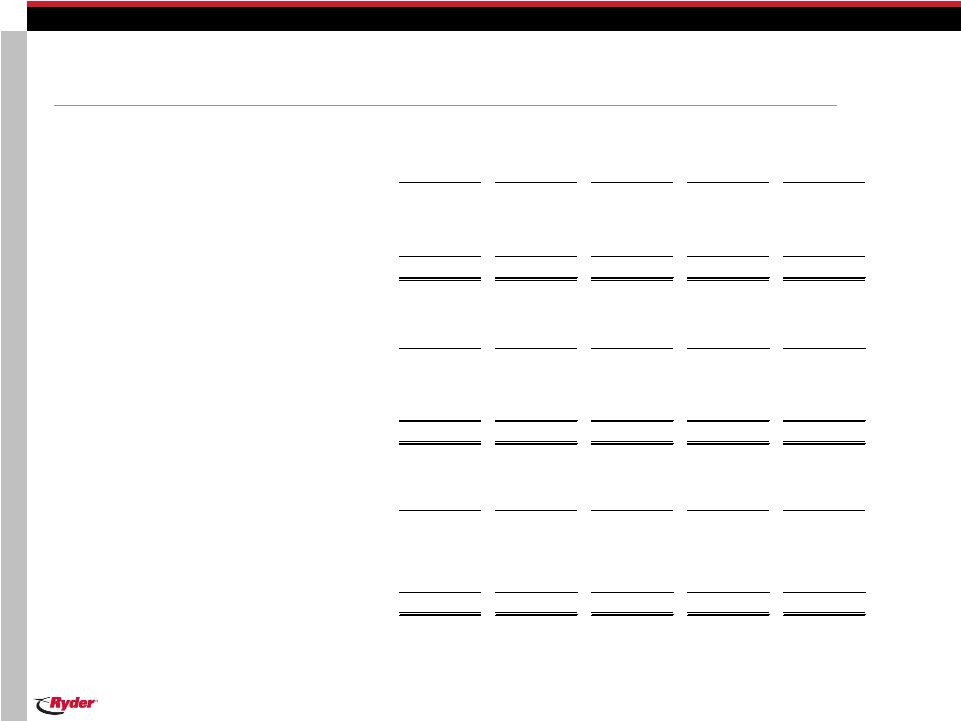
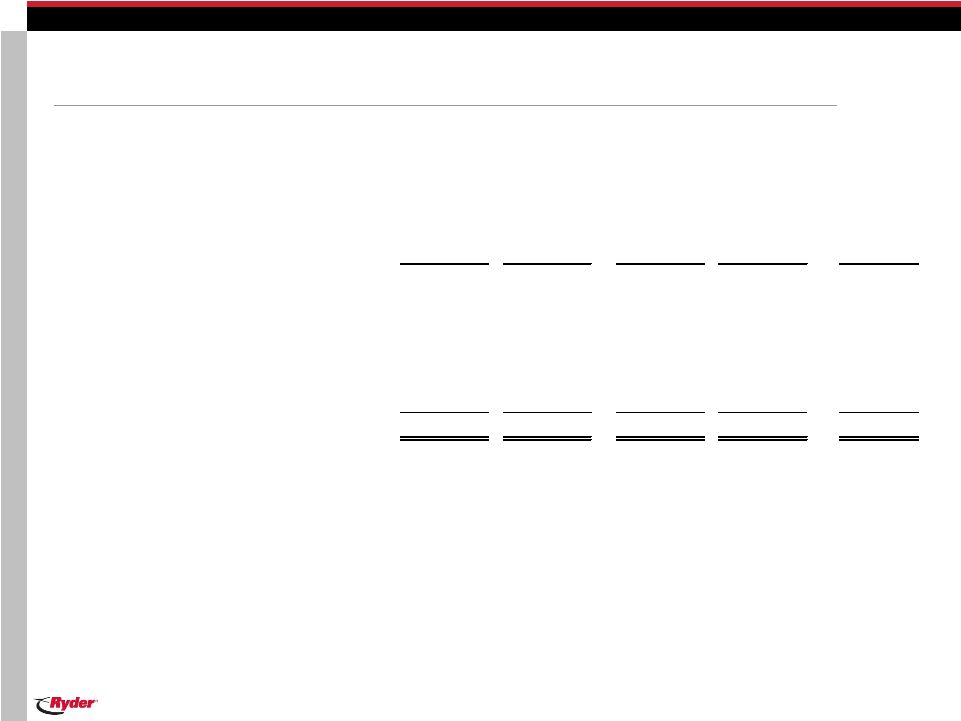
Revenue and EBT (10 year history)
Non-GAAP Financial Measures & Reconciliations
04/24/2012
17
Proprietary and Confidential |
 04/24/2012
Fleet Management Solutions (FMS)
2012
2011
% B/(W)
Full Service Lease
510.6
$
483.3
$
6%
Contract Maintenance
39.9
38.1
5%
Contractual Revenue
550.5
521.4
6%
Contract-related Maintenance
53.6
44.7
20%
Commercial Rental
171.2
135.7
26%
Other
17.4
17.3
1%
Operating Revenue
792.7
719.0
10%
Fuel Services Revenue
278.6
261.1
7%
Total Revenue
1,071.4
$
980.1
$
9%
Segment Earnings Before Tax (EBT)
50.7
$
42.4
$
20%
Segment EBT as % of Total Revenue
4.7%
4.3%
Segment EBT as % of Operating Revenue
6.4%
5.9%
First Quarter
($ Millions)
18
Proprietary and Confidential |
 04/24/2012
Supply Chain Solutions (SCS)
(1)
First Quarter
($ Millions)
2012
2011
% B/(W)
Automotive
139.7
$
122.7
$
14%
High-Tech
80.3
80.4
-
Retail & CPG
178.8
167.1
7%
Industrial & Other
85.8
82.5
4%
Operating Revenue
484.6
452.7
7%
Subcontracted Transportation
87.3
83.1
5%
Total Revenue
571.9
$
535.8
$
7%
Segment Earnings Before Tax (EBT)
21.9
$
20.2
$
8%
Segment EBT as % of Total Revenue
3.8%
3.8%
Segment EBT as % of Operating Revenue
4.5%
4.5%
Memo:
Dedicated Services - Operating Revenue
282.1
$
249.6
$
13%
Dedicated Services - Total Revenue
328.3
$
287.9
$
14%
Fuel Costs
66.8
$
53.8
$
24%
(1)
Combined Supply Chain Solutions and Dedicated Contract Carriage.
(2)
Excludes Dedicated Services Subcontracted Transportation.
19
Proprietary and Confidential
(2) |
 04/24/2012
Central Support Services (CSS)
2012
2011
% B/(W)
Allocated CSS Costs
38.7
$
36.6
$
(6)%
Unallocated CSS Costs
9.5
8.7
(9)%
Total CSS Costs
48.2
$
45.3
$
(6)%
First Quarter
($ Millions)
20
Proprietary and Confidential |
 04/24/2012
Balance Sheet
March 31,
December 31,
2012
2011
Cash and Cash Equivalents
114
$
105
$
Other Current Assets
1,002
984
Revenue Earning Equipment, Net
5,530
5,050
Operating Property and Equipment, Net
626
624
Other Assets
878
856
Total Assets
8,149
$
7,618
$
Short-Term Debt / Current Portion Long-Term Debt
587
$
274
$
Other Current Liabilities
1,175
900
Long-Term Debt
3,006
3,108
Other Non-Current Liabilities (including Deferred Income Taxes)
2,009
2,018
Shareholders' Equity
1,371
1,318
Total Liabilities and Shareholders' Equity
8,149
$
7,618
$
($ Millions)
21
Proprietary and Confidential |
 04/24/2012
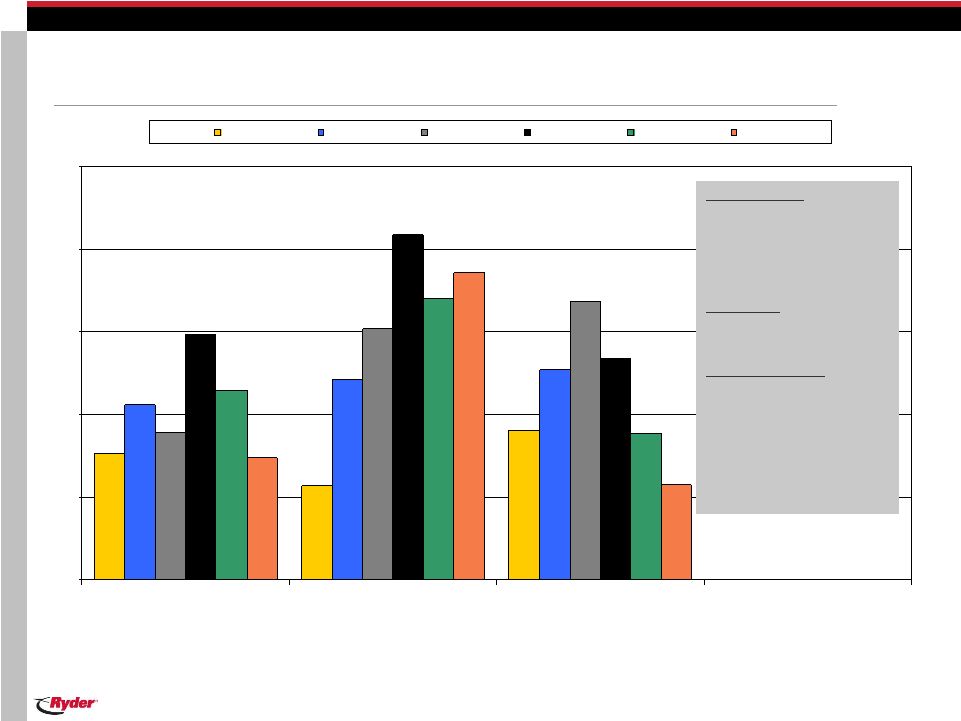
U.S. Asset Management Update
(a)
(a)
U.S. only
(b)
Excludes early terminations where customer purchases vehicle
(c)
Current year statistics may exclude some units due to a lag in reporting
(b)
Number of
Units
765
569
905
1,061
1,210
1,269
896
1,521
1,684
1,485
2,088
1,334
1,147
1,701
889
742
1,855
572
0
500
1,000
1,500
2,000
2,500
Redeployments
Extensions
Early Terminations
1Q 07
1Q 08
1Q 09
1Q 10
1Q 11
1Q 12
(c)
Redeployments
–
vehicles
coming off-lease with useful
life remaining are redeployed
in the Ryder fleet (Commercial
Rental, SCS, or with another
Lease customer).
Extensions –
Ryder re-prices
lease contract and extends
maturity date.
Early terminations –
customer elects to terminate
lease prior to maturity.
Depending on the remaining
useful life, the vehicle may be
redeployed in the Ryder fleet
(Commercial Rental, SCS,
other Lease customer) or sold
by Ryder.
22
Proprietary and Confidential |
 04/24/2012
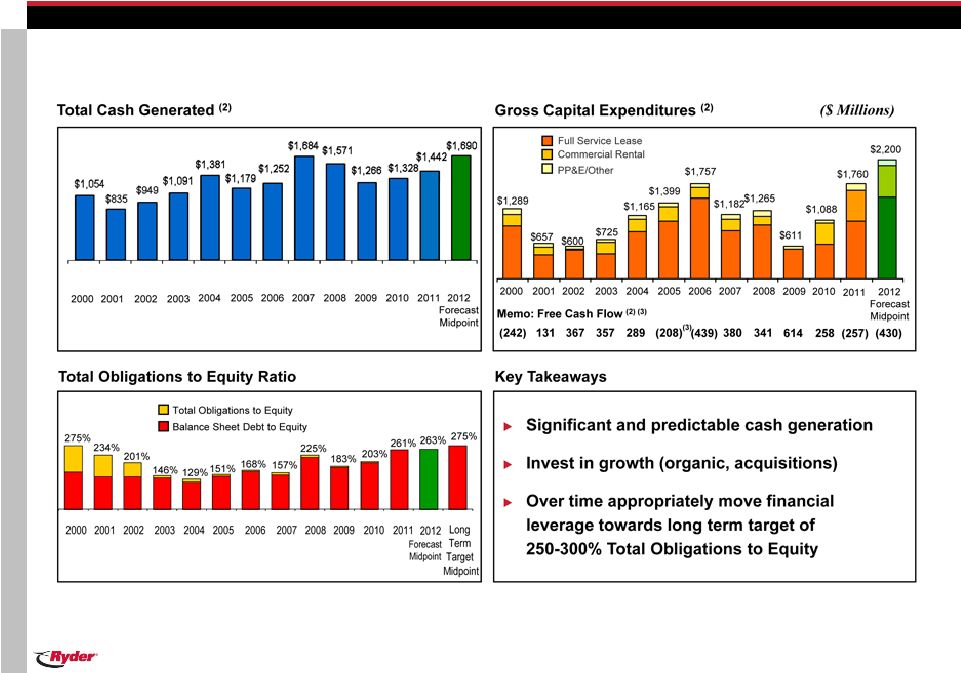
Financial Indicators Forecast
(1)
(1)
Total
Obligations
to
Equity
includes
acquisitions.
Free
Cash
Flow
and
Gross
Capital
Expenditures
exclude
acquisitions.
(2)
2000-2004
not
restated
for
operations
discontinued
in
2009.
(3)
Includes
$176
million
payment
to
the
IRS
related
to
full
resolution
of
1998
-
2000
tax
period
matters.
23
Proprietary and Confidential |
 New
Business Segment Presentation (1)
($ Millions)
04/24/2012
1Q 2011
2Q 2011
3Q 2011
4Q 2011
FY 2011
Operating Revenue:
Fleet Management Solutions
719.0
$
778.9
$
824.7
$
813.3
$
3,135.9
$
Supply Chain Solutions
452.7
456.8
476.3
471.8
1,857.5
Eliminations
(42.6)
(43.7)
(44.4)
(48.1)
(178.8)
Total
1,129.1
$
1,192.0
$
1,256.5
$
1,237.0
$
4,814.6
$
Segment Earnings Before Tax:
Fleet Management Solutions
42.4
$
71.5
$
78.0
$
73.8
$
265.7
$
Supply Chain Solutions
20.2
27.8
31.4
25.5
104.9
Eliminations
(4.9)
(6.5)
(5.7)
(7.1)
(24.2)
57.6
92.7
103.8
92.2
346.4
Central Support Services (Unallocated Share)
(8.7)
(11.2)
(11.5)
(11.1)
(42.5)
Non-service Pension Costs
(4.5)
(4.8)
(4.6)
(4.7)
(18.7)
Restructuring and Other Charges, Net and Other Items
(0.8)
(1.7)
-
(3.3)
(5.8)
Earnings Before Income Taxes
43.6
75.0
87.7
73.1
279.4
Provision for Income Taxes
(17.8)
(34.1)
(30.7)
(25.4)
(108.0)
Earnings from Continuing Operations
25.9
$
40.9
$
56.9
$
47.7
$
171.4
$
Comparable Earnings from Continuing Operations
26.3
$
47.8
$
56.4
$
50.1
$
180.6
$
Net Earnings
25.1
$
40.0
$
56.5
$
48.1
$
169.8
$
(1) Supply Chain Solutions and Dedicated Contract Carriage have been combined.
Non-service pension costs have been excluded from segment earnings. Note:
Amounts may not recalculate due to rounding. 24
Proprietary and Confidential |
 New
Business Segment Presentation (1)
($ Millions)
Proprietary and Confidential
1Q 2010
2Q 2010
3Q 2010
4Q 2010
FY 2010
Operating Revenue:
Fleet Management Solutions
677.4
$
709.0
$
733.9
$
726.3
$
2,846.5
$
Supply Chain Solutions
350.2
368.5
377.2
377.6
1,473.5
Eliminations
(40.0)
(40.4)
(39.5)
(41.9)
(161.8)
Total
987.6
$
1,037.1
$
1,071.6
$
1,061.9
$
4,158.2
$
Segment Earnings Before Tax:
Fleet Management Solutions
27.3
$
51.6
$
60.3
$
55.7
$
194.9
$
Supply Chain Solutions
15.2
21.6
24.5
20.4
81.7
Eliminations
(4.7)
(5.1)
(4.6)
(4.8)
(19.3)
37.8
68.1
80.2
71.3
257.3
Central Support Services (Unallocated Share)
(8.8)
(9.8)
(11.9)
(10.7)
(41.2)
Non-service Pension Costs
(6.5)
(6.1)
(6.3)
(7.8)
(26.6)
Restructuring and Other Charges, Net and Other Items
-
-
-
(3.2)
(3.2)
Earnings Before Income Taxes
22.5
52.2
62.0
49.6
186.3
Provision for Income Taxes
(9.6)
(21.6)
(22.3)
(8.1)
(61.7)
Earnings from Continuing Operations
12.9
$
30.6
$
39.7
$
41.5
$
124.6
$
Comparable Earnings from Continuing Operations
12.9
$
30.6
$
39.7
$
33.8
$
117.0
$
Net Earnings
12.4
$
29.8
$
38.8
$
37.1
$
118.2
$
04/24/2012
25
(1) Supply Chain Solutions and Dedicated Contract Carriage have been combined.
Non-service pension costs have been excluded from segment earnings. Note:
Amounts may not recalculate due to rounding. |
 New
Business Segment Presentation (1)
($ Millions)
1Q 2009
2Q 2009
3Q 2009
4Q 2009
FY 2009
Operating Revenue:
Fleet Management Solutions
693.2
$
712.6
$
712.5
$
699.5
$
2,817.7
$
Supply Chain Solutions
341.1
347.0
362.8
361.0
1,412.0
Eliminations
(43.5)
(41.8)
(41.2)
(40.7)
(167.2)
Total
990.8
$
1,017.8
$
1,034.0
$
1,019.8
$
4,062.5
$
Segment Earnings Before Tax:
Fleet Management Solutions
40.7
$
51.5
$
47.6
$
42.4
$
182.2
$
Supply Chain Solutions
12.7
17.7
26.8
19.5
76.6
Eliminations
(5.6)
(4.8)
(5.7)
(4.9)
(21.1)
47.8
64.4
68.7
57.0
237.8
Central Support Services (Unallocated Share)
(6.9)
(8.2)
(9.1)
(11.1)
(35.3)
Non-service Pension Costs
(11.8)
(11.0)
(11.5)
(11.4)
(45.6)
Restructuring and Other Charges, Net and Other Items
(6.7)
0.2
(3.9)
(2.7)
(13.1)
Earnings Before Income Taxes
22.4
45.3
44.2
31.8
143.8
Provision for Income Taxes
(11.5)
(18.3)
(15.8)
(8.1)
(53.7)
Earnings from Continuing Operations
10.9
$
27.1
$
28.4
$
23.7
$
90.1
$
Comparable Earnings from Continuing Operations
16.7
$
27.0
$
28.7
$
22.2
$
94.6
$
Net Earnings
6.8
$
22.9
$
24.0
$
8.2
$
61.9
$
04/24/2012
26
Proprietary and Confidential
(1) Supply Chain Solutions and Dedicated Contract Carriage have been combined.
Non-service pension costs have been excluded from segment earnings. Note:
Amounts may not recalculate due to rounding. |
 04/24/2012
27
Proprietary and Confidential
New SCS Segment Presentation
(1)
1Q 2011
2Q 2011
3Q 2011
4Q 2011
FY 2011
Automotive
122.7
$
107.8
$
115.3
$
123.3
$
469.2
$
High-Tech
80.4
85.4
84.0
83.8
333.6
Retail & CPG
167.1
176.1
187.6
180.3
711.0
Industrial & Other
82.5
87.6
89.3
84.3
343.7
Operating Revenue
452.7
456.8
476.3
471.7
1,857.5
Subcontracted Transportation
83.1
83.2
88.7
93.5
348.5
Total Revenue
535.8
$
540.0
$
565.0
$
565.3
$
2,206.0
$
Segment Earnings Before Tax (EBT)
20.2
$
27.8
31.4
25.5
104.9
Segment EBT as % of Total Revenue
3.8%
5.1%
5.6%
4.5%
4.8%
Segment EBT as % of Operating Revenue
4.5%
6.1%
6.6%
5.4%
5.6%
Memo:
Dedicated Services - Operating
Revenue (2)
249.6
$
249.4
$
261.2
$
267.0
$
1,027.2
$
Dedicated Services - Total Revenue
287.9
$
286.0
$
303.9
$
315.2
$
1,193.0
$
Fuel Costs
53.8
$
55.1
$
54.9
$
59.9
$
223.7
$
(1)
Combined Supply Chain Solutions and Dedicated Contract Carriage.
(2)
Excludes Dedicated Services Subcontracted Transportation.
Note: Amounts may not recalculate due to rounding. |
 04/24/2012
28
Proprietary and Confidential
New SCS Segment Presentation
(1)
1Q 2010
2Q 2010
3Q 2010
4Q 2010
FY 2010
Automotive
106.6
$
113.1
$
114.7
$
114.2
$
448.7
$
High-Tech
72.3
74.7
79.3
82.5
308.8
Retail & CPG
95.6
98.6
100.2
100.3
394.7
Industrial & Other
75.8
82.1
83.0
80.5
321.3
Operating Revenue
350.2
368.5
377.2
377.6
1,473.5
Subcontracted Transportation
60.3
64.6
67.0
69.4
261.3
Total Revenue
410.5
$
433.1
$
444.3
$
446.9
$
1,734.8
$
Segment Earnings Before Tax (EBT)
15.2
$
21.6
24.5
20.4
81.7
Segment EBT as % of Total Revenue
3.7%
5.0%
5.5%
4.6%
4.7%
Segment EBT as % of Operating Revenue
4.3%
5.9%
6.5%
5.4%
5.5%
Memo:
Dedicated Services - Operating
Revenue (2)
218.9
$
231.6
$
231.4
$
230.8
$
912.7
$
Dedicated Services - Total Revenue
247.7
$
260.8
$
260.7
$
261.7
$
1,030.9
$
Fuel Costs
37.9
$
41.1
$
40.4
$
43.3
$
162.7
$
(1)
Combined Supply Chain Solutions and Dedicated Contract Carriage.
(2)
Excludes Dedicated Services Subcontracted Transportation.
Note: Amounts may not recalculate due to rounding. |
 04/24/2012
29
Proprietary and Confidential
New SCS Segment Presentation
(1)
1Q 2009
2Q 2009
3Q 2009
4Q 2009
FY 2009
Automotive
94.9
$
98.0
$
107.3
$
109.2
$
409.3
$
High-Tech
75.0
75.8
75.6
74.0
300.4
Retail & CPG
91.7
91.6
96.8
99.3
379.4
Industrial & Other
79.5
81.7
83.0
78.6
322.8
Operating Revenue
341.1
347.1
362.8
361.0
1,412.0
Subcontracted Transportation
41.2
44.8
52.5
60.3
198.9
Total Revenue
382.3
$
391.9
$
415.3
$
421.4
$
1,610.9
$
Segment Earnings Before Tax (EBT)
12.7
$
17.7
26.8
19.5
76.6
Segment EBT as % of Total Revenue
3.3%
4.5%
6.5%
4.6%
4.8%
Segment EBT as % of Operating Revenue
3.7%
5.1%
7.4%
5.4%
5.4%
Memo:
Dedicated Services - Operating
Revenue (2)
213.5
$
219.8
$
229.3
$
225.8
$
888.4
$
Dedicated Services - Total Revenue
227.1
$
239.7
$
253.8
$
253.9
$
974.5
$
Fuel Costs
30.3
$
31.7
$
35.7
$
37.0
$
134.7
$
(1)
Combined Supply Chain Solutions and Dedicated Contract Carriage.
(2)
Excludes Dedicated Services Subcontracted Transportation.
Note: Amounts may not recalculate due to rounding. |
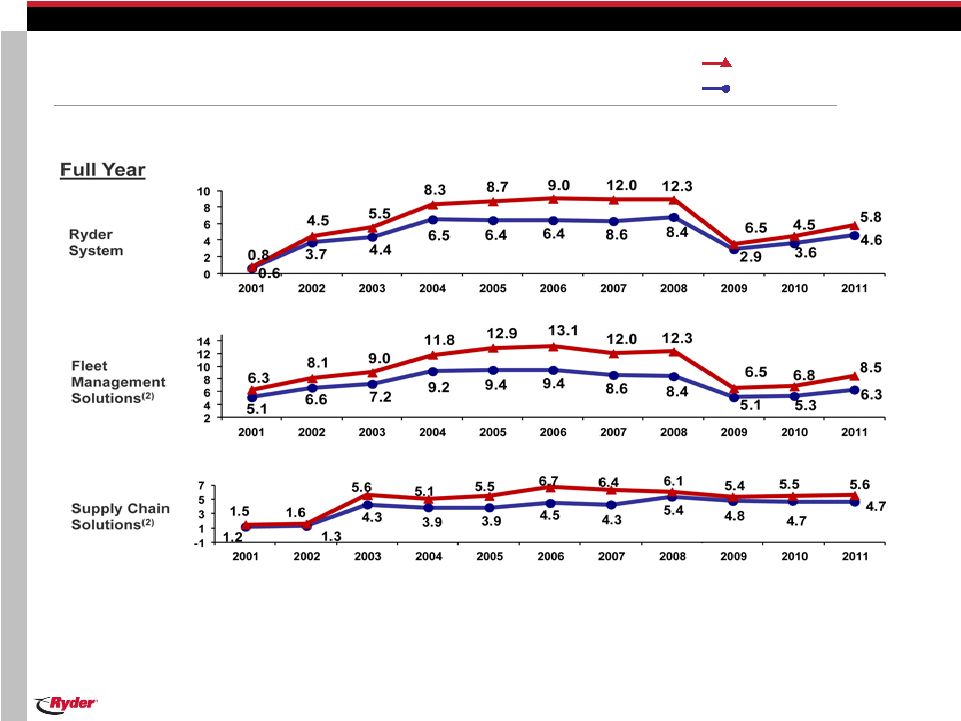
 Segment –
Revenue
(1)
Total Revenue
Operating Revenue
(1)
2001-2003 not restated for discontinued operations.
(2)
FMS Operating Revenue excludes fuel services revenue.
(3)
SCS Operating Revenue excludes subcontracted transportation.
04/24/2012
($ Billions)
30
Proprietary and Confidential |
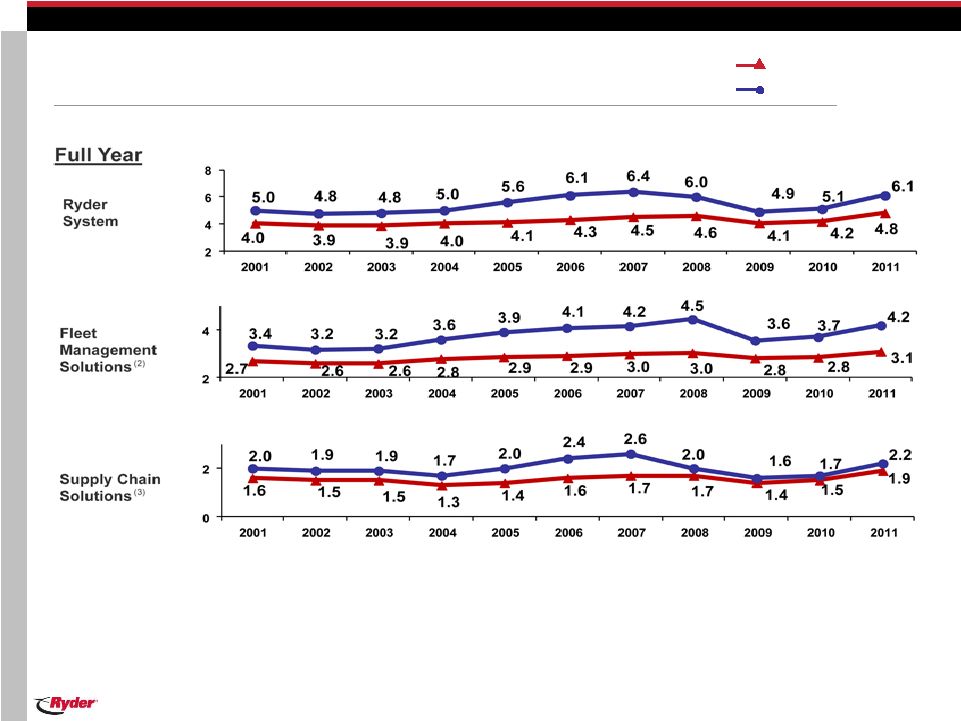
 Segment –
Earnings Before Tax (EBT)
(1)
EBT as % of Total Revenue
EBT as % of Operating Revenue
(1)
2001-2003 not restated for discontinued operations.
(2)
Excludes non-service pension costs.
04/24/2012
31
Proprietary and Confidential |
 04/24/2012
Non-GAAP Financial Measures
This presentation includes “non-GAAP financial measures”
as defined by SEC rules. As required by SEC
rules, we provide a reconciliation of each non-GAAP financial measure to the
most comparable GAAP measure. Non-GAAP financial measures should be
considered in addition to, but not as a substitute for or
superior to, other measures of financial performance prepared in
accordance with GAAP.
Specifically, the following non-GAAP financial measures are included in this
presentation: Non-GAAP Financial Measure
Comparable GAAP Measure
Reconciliation & Additional Information
Presented on Slide Titled
Page
Operating Revenue
Total Revenue / Total Revenue Forecast
Key Financial Statistics
5
Comparable Earnings / Comparable EPS
Earnings / EPS from Continuing Operations
Earnings and EPS from Continuing Operations
Reconciliation / Earnings from Continuing
Operations Reconciliation 2009 / Earnings from
Continuing Operations Reconciliation 2010 /
Earnings from Continuing Operations
Reconciliation 2011
33, 42-
44
Comparable EPS Excluding Non-Service Pension
Costs
EPS from Continuing Operations
Earnings and EPS from Continuing Operations
Reconciliation
33
Comparable Earnings Before Income Tax /
Comparable Tax Rate
Earnings Before Income Tax / Tax Rate
EBT and Tax Rate from Continuing Operations
Reconciliation
34
Comparable EPS Forecast
EPS Forecast
EPS Forecast –
Continuing Operations
15
Adjusted Return on Capital / Adjusted Total Capital
Net Earnings / Total Capital
Adjusted Return on Capital Reconciliation /
Segment Adjusted Return on Capital
Reconciliation
36-37
Total Cash Generated / Free Cash Flow
Cash Provided by Operating Activities
Cash Flow Reconciliation
39-40
Total Obligations / Total Obligations to Equity
Balance Sheet Debt / Debt to Equity
Debt to Equity Reconciliation
37-38
FMS and SCS Operating Revenue
FMS and SCS Total Revenue
Fleet Management Solutions / Supply Chain
Solutions / New SCS Segment Presentation ,
FMS Operating Results 2009-2011
18,19,
27-29,
41
32
Proprietary and Confidential |
 Earnings and EPS from Continuing Operations Reconciliation
($ Millions or $ Earnings Per Share)
1Q12 -
1Q12 -
1Q11 -
1Q11 -
Earnings
EPS
Earnings
EPS
Reported
34.9
$
0.68
$
25.9
$
0.50
$
Tax Benefits
(5.0)
(0.10)
-
-
Restructuring Charges
0.6
0.01
0.5
0.01
Comparable
30.6
0.59
26.3
0.51
Non-Service Pension Costs
4.9
0.10
2.7
0.05
Comparable EPS excluding Non-Service Pension Costs
35.5
$
0.69
$
30.8
$
0.56
$
Proprietary and Confidential
33
04/24/2012 |
 EBT
and Tax Rate from Continuing Operations Reconciliation ($ Millions
or $ Earnings Per Share) 1Q12 -
1Q12 -
1Q12 -
EBT
Tax
Tax Rate
Reported
47.7
$
12.8
$
26.9%
Tax Benefits
-
5.0
Restructuring Charges
0.9
0.2
Comparable
48.6
$
18.0
$
37.1%
04/24/2012
34
Proprietary and Confidential |
 04/24/2012
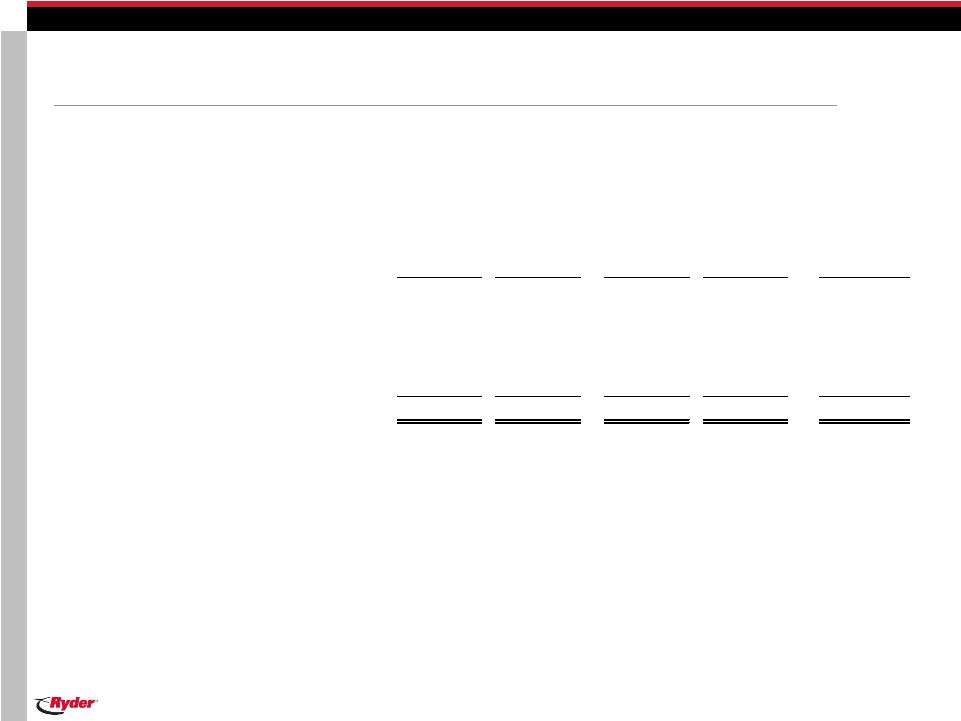
Adjusted Return on Capital Reconciliation
($ Millions)
(1)
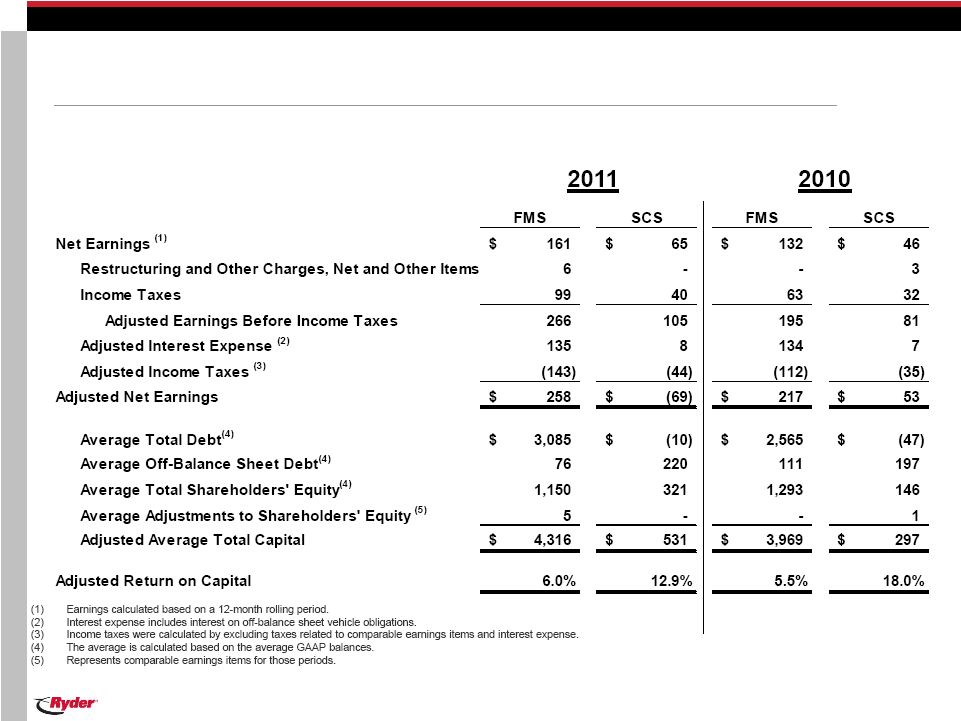
Earnings calculated based on a 12-month rolling period.
(2)
Interest expense includes interest on off-balance sheet vehicle
obligations. (3)
Income taxes were calculated by excluding taxes related to comparable earnings
items and interest expense. (4)
The average is calculated based on the average GAAP balances.
(5)
Represents comparable earnings items for those periods.
3/31/12
3/31/11
Net Earnings
(1)
179
$
131
$
Restructuring and Other Charges, Net and Other Items
6
7
Income Taxes
103
69
Adjusted Earnings Before Income Taxes
288
207
Adjusted Interest Expense
(2)
135
134
Adjusted Income Taxes
(3)
(156)
(132)
Adjusted Net Earnings
268
$
209
$
Average Total Debt
(4)
3,256
$
2,591
$
Average Off-Balance Sheet Debt
(4)
72
109
Average Total Shareholders' Equity
(4)
1,409
1,403
Average Adjustments to Shareholders' Equity
(5)
5
(1)
Adjusted Average Total Capital
4,742
$
4,102
$
Adjusted Return on Capital
5.6%
5.1%
35
Proprietary and Confidential |
 04/24/2012
Segment Adjusted Return on Capital Reconciliation
($ Millions)
36
Proprietary and Confidential |
 04/24/2012
Debt to Equity Reconciliation
% to
% to
% to
% to
% to
% to
% to
% to
12/31/00
Equity
12/31/01
Equity
12/31/02
Equity
12/31/03
Equity
12/31/04
Equity
12/31/05
Equity
12/31/06
Equity
12/31/07
Equity
Balance Sheet Debt
$2,017
161%
$1,709
139%
$1,552
140%
$1,816
135%
$1,783
118%
$2,185
143%
$2,817
164%
$2,776
147%
Receivables Sold
345
110
-
-
-
-
-
-
PV of minimum
lease payments
and guaranteed
residual values
under operating
leases for
vehicles
879
625
370
153
161
117
78
178
PV of contingent
rentals under
securitizations
209
441
311
-
-
-
-
-
Total Obligations
$3,450
275%
$2,885
234%
$2,233
201%
$1,969
146%
$1,944
129%
$2,302
151%
$2,895
168%
$2,954
157%
Note:
In
connection
with
adopting
FIN
46
effective
July
1,
2003,
the
Company
consolidated
the
vehicle
securitization
trusts
previously
disclosed
as
off-balance
sheet
debt.
($ Millions)
37
Proprietary and Confidential |
 04/24/2012
Debt to Equity Reconciliation
($ Millions)
Note: Amounts may not recalculate due to rounding.
% to
% to
% to
% to
% to
12/31/08
Equity
12/31/09
Equity
12/31/10
Equity
12/31/11
Equity
3/31/12
Equity
3/31/11
Balance Sheet Debt
$2,863
213%
$2,498
175%
$2,747
196%
$3,382
257%
$3,593
262%
$2,809
Receivables Sold
-
-
-
-
-
-
PV of minimum
lease payments and
guaranteed residual
values under
operating leases for
vehicles
163
119
100
64
63
99
Total Obligations
$3,026
225%
$2,617
183%
$2,847
203%
$3,446
261%
$3,656
267%
$2,908
38
Proprietary and Confidential |
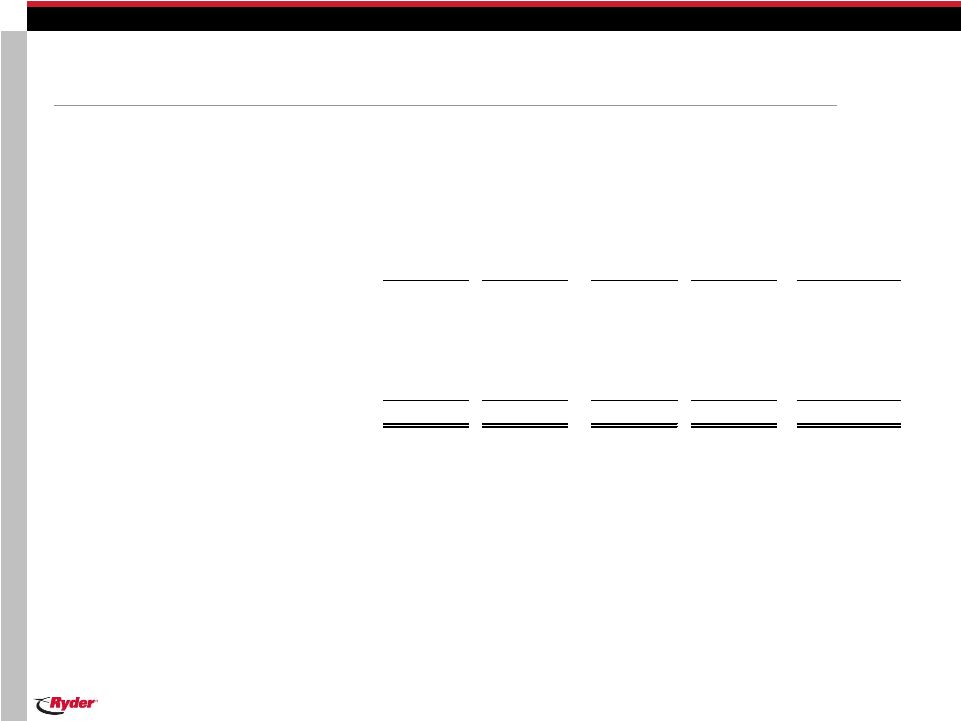
 04/24/2012
($ Millions)
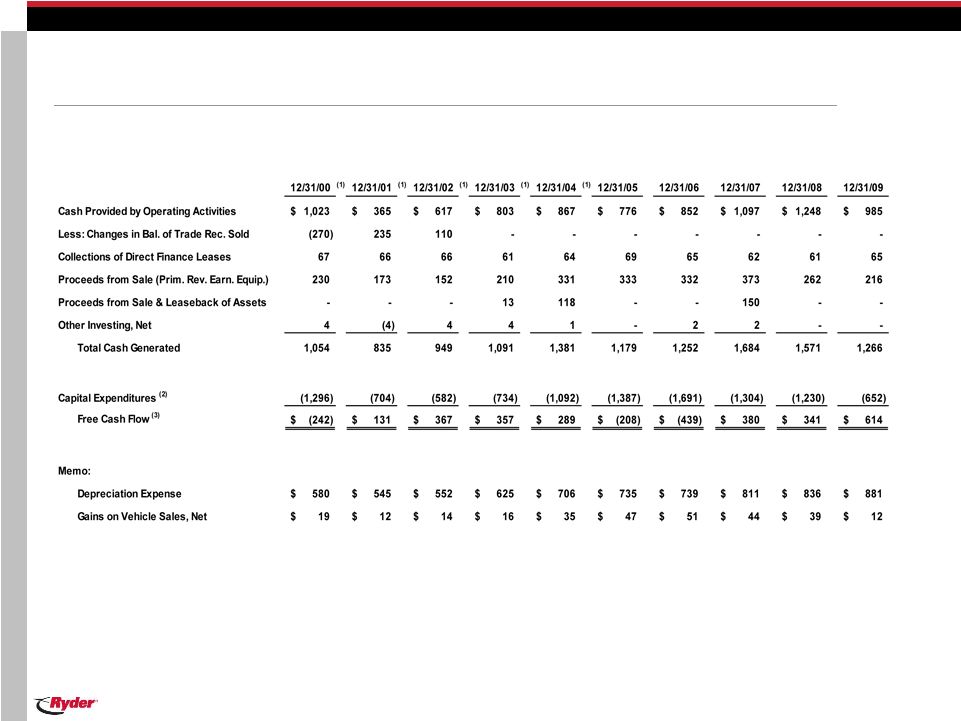
Cash Flow Reconciliation
39
Proprietary and Confidential
(1)
Amounts have not been recasted for discontinued operations
(2)
Capital expenditures presented net of changes in accounts payable related to
purchases of revenue earning equipment. (3)
Free Cash Flow excludes acquisitions and changes in restricted cash.
|
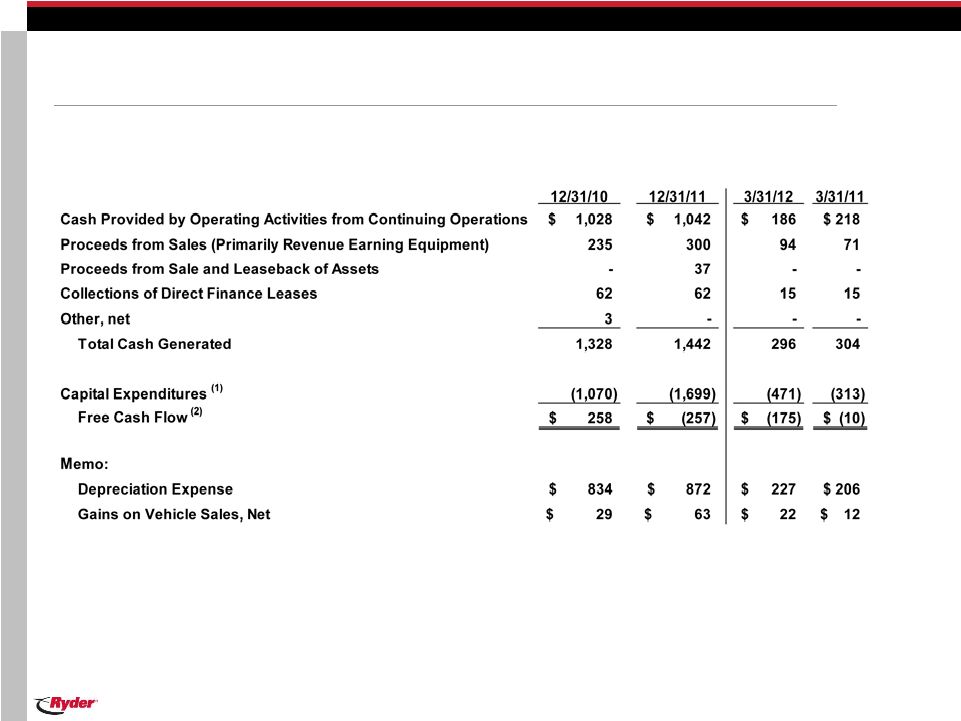 04/24/2012
($ Millions)
(1)
Capital expenditures presented net of changes in accounts payable related to
purchases of revenue earning equipment. (2)
Free Cash Flow excludes acquisitions and changes in restricted cash.
Cash Flow Reconciliation
40
Proprietary and Confidential |
 FMS
Operating Results 2009 - 2011
($ Millions)
1Q 2009
2Q 2009
3Q 2009
4Q 2009
FY 2009
Fleet Management Solutions
Operating Revenue
693.2
$
712.6
$
712.5
$
699.5
$
2,817.7
$
Fuel Services Revenue
170.3
178.7
200.3
200.8
750.1
Total
863.5
891.3
912.8
900.2
3,567.8
1Q 2010
2Q 2010
3Q 2010
4Q 2010
FY 2010
Fleet Management Solutions
Operating Revenue
677.4
$
709.0
$
733.9
$
726.3
$
2,846.5
$
Fuel Services Revenue
206.6
222.2
215.1
221.8
865.6
Total
884.0
931.2
948.9
948.1
3,712.2
1Q 2011
2Q 2011
3Q 2011
4Q 2011
FY 2011
Fleet Management Solutions
Operating Revenue
719.0
$
778.9
$
824.7
$
813.3
$
3,135.9
$
Fuel Services Revenue
261.1
285.6
274.4
261.3
1,082.5
Total
980.1
1,064.5
1,099.0
1,074.7
4,218.3
04/24/2012
41
Proprietary and Confidential |
 Earnings from Continuing Operations Reconciliation 2009
($ Millions or $ Earnings Per Share)
1Q09 -
2Q09 -
3Q09 -
4Q09 -
FY09 -
Earnings
Earnings
Earnings
Earnings
Earnings
Reported
10.9
$
27.1
$
28.4
$
23.7
$
90.1
$
International Asset Impairment
3.9
-
0.2
2.4
6.7
Reversal of Tax Reserves
-
-
(2.2)
-
(2.2)
Tax law changes
-
-
-
(4.1)
(4.1)
Restructuring Charges (Recovery)
1.9
(0.1)
2.3
0.2
4.2
Comparable
16.7
$
27.0
$
28.7
$
22.2
$
94.6
$
Proprietary and Confidential
42
04/24/2012 |
 Earnings from Continuing Operations Reconciliation 2010
($ Millions or $ Earnings Per Share)
1Q10 -
2Q10 -
3Q10 -
4Q10 -
FY10 -
Earnings
Earnings
Earnings
Earnings
Earnings
Reported
22.5
$
52.2
$
62.0
$
41.4
$
124.6
$
Int'l Asset Gain on Sale
-
-
-
(0.9)
(0.9)
Tax Benefits
-
-
-
(10.8)
(10.8)
Acquisition Related Transaction Costs
-
-
-
4.1
4.1
Comparable
22.5
$
52.2
$
62.0
$
33.8
$
117.0
$
Proprietary and Confidential
43
04/24/2012 |
 Earnings from Continuing Operations Reconciliation 2011
($ Millions or $ Earnings Per Share)
1Q11 -
2Q11 -
3Q11 -
4Q11 -
FY11 -
Earnings
Earnings
Earnings
Earnings
Earnings
Reported
25.9
$
40.9
$
56.9
$
47.7
$
171.4
$
Tax Law Changes/Benefits
-
5.4
(0.6)
-
4.8
Acquisition Transaction Costs
-
1.5
-
0.4
1.9
Restructuring Charges
0.5
-
-
2.0
2.5
Comparable
26.3
$
47.8
$
56.4
$
50.1
$
180.6
$
Proprietary and Confidential
44
04/24/2012 |
 *
*
*
*
*
*
*
* * * * * * * |