Attached files
| file | filename |
|---|---|
| 8-K/A - 8-K/A - FIFTH THIRD BANCORP | d339773d8ka.htm |
 1Q12
Earnings Conference Call April 19, 2012
Please refer to earnings release dated April 19, 2012 for further information.
Exhibit 99.1
©
Fifth Third Bank | All Rights Reserved |
 2
Cautionary statement
©
Fifth Third Bank | All Rights Reserved
This report contains statements that we believe are “forward-looking statements” within
the meaning of Section 27A of the Securities Act of 1933, as amended, and Rule 175 promulgated
thereunder, and Section 21E of the Securities Exchange Act of 1934, as amended, and Rule
3b-6 promulgated thereunder. These statements relate to our financial condition, results of
operations, plans, objectives, future performance or business. They usually can be identified by
the use of forward-looking language such as “will likely result,” “may,” “are expected to,” “is
anticipated,” “estimate,” “forecast,” “projected,” “intends
to,” or may include other similar words or phrases such as “believes,” “plans,” “trend,”
“objective,” “continue,” “remain,” or similar expressions, or future or
conditional verbs such as “will,” “would,” “should,” “could,” “might,” “can,” or
similar verbs. You should not place undue reliance on these statements, as they are subject to risks
and uncertainties, including but not limited to the risk factors set forth in our most recent
Annual Report on Form 10-K. When considering these forward-looking statements, you should
keep in mind these risks and uncertainties, as well as any cautionary statements we may make.
Moreover, you should treat these statements as speaking only as of the date they are made and
based only on information then actually known to us.
There are a number of important factors that could cause future results to differ materially from
historical performance and these forward- looking statements. Factors that might cause such
a difference include, but are not limited to: (1) general economic conditions and weakening in
the economy, specifically the real estate market, either nationally or in the states in which Fifth Third, one or more acquired entities and/or
the combined company do business, are less favorable than expected; (2) deteriorating credit quality;
(3) political developments, wars or other hostilities may disrupt or increase volatility in
securities markets or other economic conditions; (4) changes in the interest rate environment
reduce interest margins; (5) prepayment speeds, loan origination and sale volumes, charge-offs and
loan loss provisions; (6) Fifth Third’s ability to maintain required capital levels and
adequate sources of funding and liquidity; (7) maintaining capital requirements may limit Fifth
Third’s operations and potential growth; (8) changes and trends in capital markets; (9) problems
encountered by larger or similar financial institutions may adversely affect the banking
industry and/or Fifth Third; (10) competitive pressures among depository institutions increase
significantly; (11) effects of critical accounting policies and judgments; (12) changes in accounting
policies or procedures as may be required by the Financial Accounting Standards Board (FASB) or
other regulatory agencies; (13) legislative or regulatory changes or actions, or significant
litigation, adversely affect Fifth Third, one or more acquired entities and/or the combined company or the businesses in which Fifth
Third, one or more acquired entities and/or the combined company are engaged, including the
Dodd-Frank Wall Street Reform and Consumer Protection Act; (14) ability to maintain
favorable ratings from rating agencies; (15) fluctuation of Fifth Third’s stock price; (16) ability to attract
and retain key personnel; (17) ability to receive dividends from its subsidiaries; (18) potentially
dilutive effect of future acquisitions on current shareholders’ ownership of Fifth Third;
(19) effects of accounting or financial results of one or more acquired entities; (20) difficulties from the
separation of Vantiv, LLC, formerly Fifth Third Processing Solutions from Fifth Third; (21) loss of
income from any sale or potential sale of businesses that could have an adverse effect on Fifth
Third’s earnings and future growth; (22) ability to secure confidential information through
the use of computer systems and telecommunications networks; and (23) the impact of reputational risk
created by these developments on such matters as business generation and retention, funding and
liquidity. You should refer to our periodic and current reports filed with the Securities and Exchange
Commission, or “SEC,” for further information on other factors, which could cause
actual results to be significantly different from those expressed or implied by these forward-looking
statements. |
 3
©
Fifth Third Bank | All Rights Reserved
Net income available to common shareholders of $421mm ($0.45 per
diluted common share), vs. $305mm ($0.33 per
share) in 4Q11 and $88mm ($0.10 per share) in 1Q11
—
1Q12 return on assets (ROA) of 1.49%; 1.20% excluding items below
—
Pre-provision net revenue (PPNR)* of $694mm, or $569mm excluding items
below Credit trends remain favorable
—
Net charge-offs (NCOs) of $220mm (1.08% of loans and leases) down $19mm (8 bps)
vs. 4Q11; lowest since 4Q07 —
Total NPAs of $1.8bn including loans HFS down $164mm or 8% sequentially; lowest since
1Q08 —
NPA ratio of 2.03% down 20 bps from 4Q11, NPL ratio of 1.64% down 12 bps from 4Q11;
gross NPL inflows of $351mm down 11% sequentially
—
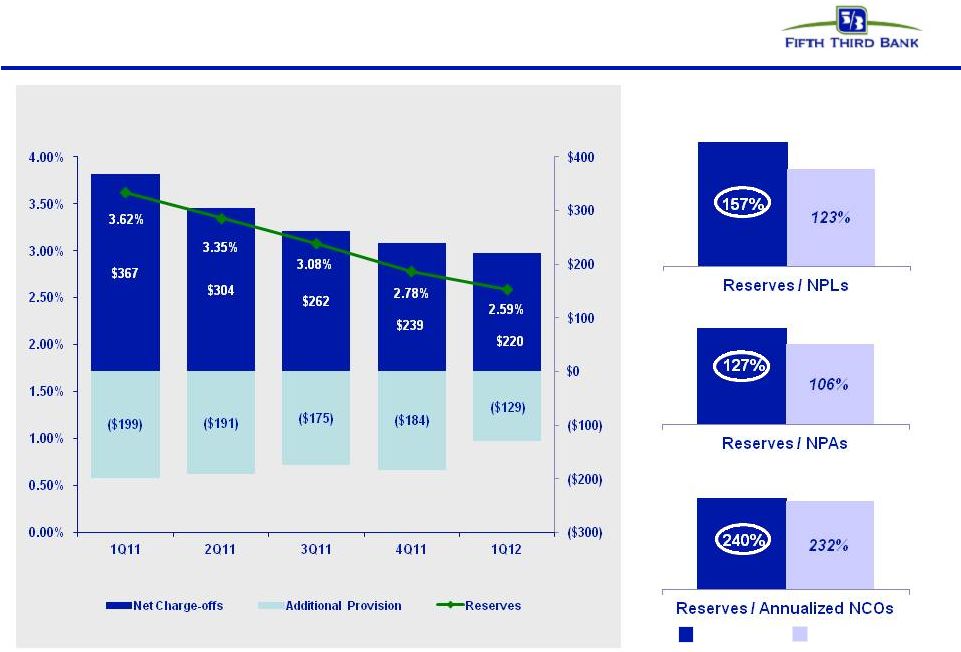
Provision expense `of $91mm, up $36mm vs. 4Q11; loan loss allowance down $129mm
sequentially; allowance to loan ratio of 2.59%, 127% of NPAs, 157% of
nonperforming loans and leases, and 2.4x 1Q12 annualized NCOs —
Total delinquencies (loans 30-89 days past due and >90 days past due) down
11% sequentially, lowest since 3Q05 —
No direct European sovereign exposure; total exposure to European peripheral
borrowers <$0.2bn; total exposure to European banks <$0.1bn**
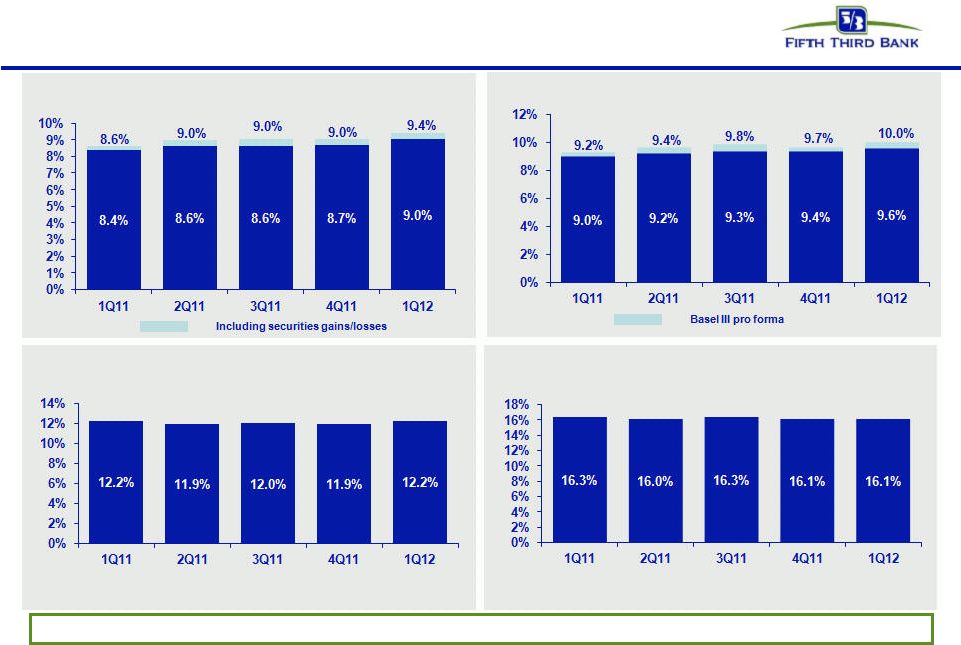
Strong capital ratios; exceed fully phased-in Basel III proposed standards
—
Tier 1 common ratio 9.64%*, up 29 bps sequentially (pro forma***
~10.0% on a fully-phased in Basel III-adjusted
basis, estimated among highest of large cap U.S. banks)
—
Tier 1 capital ratio 12.19%, Total capital ratio 16.06%, Leverage ratio 11.31%
—
Tangible common equity ratio* of 9.02% excluding unrealized gains/losses; 9.37%
including them —
Book value per share of $14.30, tangible book value per share* of $11.64 (up 3% from
4Q11) Significant items in 1Q12 results related to Vantiv
$ in mm, except per share data
Net income impact
After tax EPS
impact
Pre-tax
After tax
Gains associated with Vantiv IPO
$115
~$75
~$0.08
Vantiv debt termination-related charges (estimated)
~($36)
~($23)
~($0.02)
Gains on higher valuation of Vantiv puts and warrants
$46
~$30
~$0.03
1Q12 in review
* Non-GAAP measure; See Reg. G reconciliation in appendix
** “European” includes non-Eurozone countries; “European peripheral” includes
Greece, Ireland, Italy, Portugal, Spain *** Current estimate (non-GAAP), subject to final
rule-making and clarification by U.S. banking regulators; currently assumes unrealized securities gains are included
in common equity for purposes of this calculation
|
 4
Financial summary
•
1Q12 earnings of $0.45 per diluted share driven by strong core performance and gains
associated with Vantiv’s IPO –
Included $115mm pre-tax gains associated with Vantiv’s IPO and $46mm in
positive valuation adjustments on the Vantiv warrant and put option, as well
as estimated $36mm pre-tax charges related to Vantiv’s bank debt
refinancing and termination
•
13% return on average common equity; 16% return on average tangible common
equity^ •
Average transaction deposits up 2%; core deposits up 1% sequentially
•
Average loans* up 5% from 1Q11, reflecting strength in C&I, commercial lease,
residential mortgage, and auto loans Actual
Seq.
YOY
($ in millions)
1Q11
4Q11
1Q12
$
%
$
%
Average Balances
Commercial loans*
$43,410
$44,636
$45,913
$1,277
3%
$2,503
6%
Consumer loans*
34,226
35,278
35,587
309
1%
1,361
4%
Total loans & leases*
$77,636
$79,914
$81,500
$1,586
2%
$3,864
5%
Core deposits
$77,524
$80,587
$81,686
$1,099
1%
$4,162
5%
Income Statement Data
Net interest income (taxable equivalent)
$884
$920
$903
($17)
(2%)
$19
2%
Provision for loan and lease losses
168
55
91
36
64%
(77)
(46%)
Noninterest income
584
550
769
219
40%
185
32%
Noninterest expense
918
993
973
(20)
(2%)
55
6%
Net Income
$265
$314
$430
$116
37%
$165
62%
Net income available to common shareholders
$88
$305
$421
$116
38%
$333
377%
Pre-provision net revenue^
$545
$473
$694
$221
47%
$149
27%
Earnings per share, diluted
$0.10
$0.33
$0.45
$0.12
36%
$0.35
350%
Net interest margin
3.71%
3.67%
3.61%
(6bps)
(2%)
(10bps)
(3%)
Return on average assets
0.97%
1.08%
1.49%
41bps
38%
52bps
54%
Return on average common equity
3.1%
9.5%
13.1%
360bps
38%
1000bps
323%
Return on average tangible common equity^
4.2%
11.9%
16.2%
430bps
36%
1200bps
286%
^
Non-GAAP measure; See Reg. G reconciliation in appendix
Note: Numbers may not sum due to rounding and percentages are calculated on actual
dollar amounts not the rounded dollar amounts ©
Fifth Third Bank | All Rights Reserved |
 5
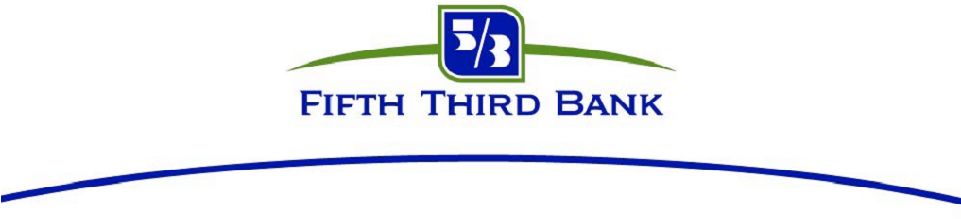
Net interest income
NII and NIM (FTE)
•
Sequential net interest income trends reflected lower yields on loans and lower
reinvestment rates on securities given the current interest rate environment
partially offset by growth in C&I, commercial lease, residential mortgage,
and auto loan balances –
NII down $17mm, or 2%, sequentially and up $19mm, or 2% year-over-year
–
NIM down 6 bps sequentially and 10 bps year-over-year
•
Yield on interest-earning assets declined 5 bps sequentially and 29 bps
year-over-year * Represents purchase accounting adjustments included
in net interest income. Yield Analysis
1Q11
4Q11
1Q12
(bps)
YoY
(bps)
Commercial and industrial loans
4.45%
4.28%
4.20%
(8)
(25)
Commercial mortgage loans
4.11%
3.89%
3.95%
6
(16)
Commercial construction loans
3.15%
3.04%
3.04%
-
(11)
Commercial leases
4.17%
3.87%
3.79%
(8)
(38)
Residential mortgage loans
4.67%
4.16%
4.17%
1
(50)
Home equity
3.96%
3.87%
3.85%
(2)
(11)
Automobile loans
5.10%
4.27%
3.99%
(28)
(111)
Credit card
10.43%
9.66%
9.43%
(23)
(100)
Other consumer loans and leases
18.54%
36.95%
40.13%
318
2,159
Total loans and leases
4.67%
4.41%
4.34%
(7)
(33)
Taxable securities
3.96%
3.75%
3.68%
(7)
(28)
Tax exempt securities
4.77%
5.42%
5.60%
18
83
Other short-term investments
0.25%
0.24%
0.26%
2
1
Total interest-earning assets
4.47%
4.23%
4.18%
(5)
(29)
Total interest-bearing liabilities
1.02%
0.79%
0.79%
-
(23)
Net interest spread
3.45%
3.44%
3.39%
(5)
(6)
©
Fifth Third Bank | All Rights Reserved
($mm)
$903
Seq. |
 6
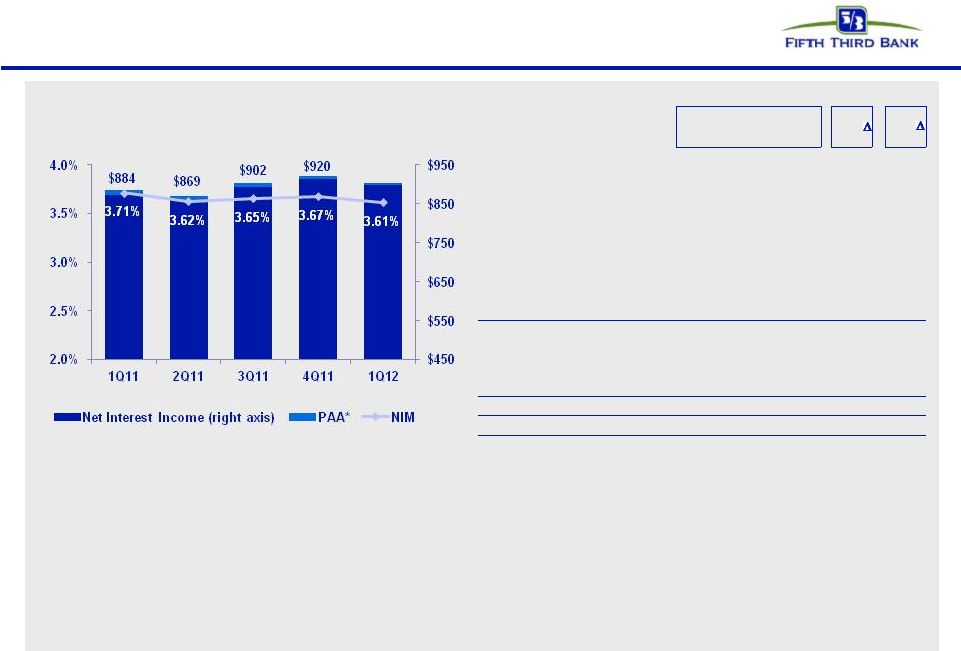
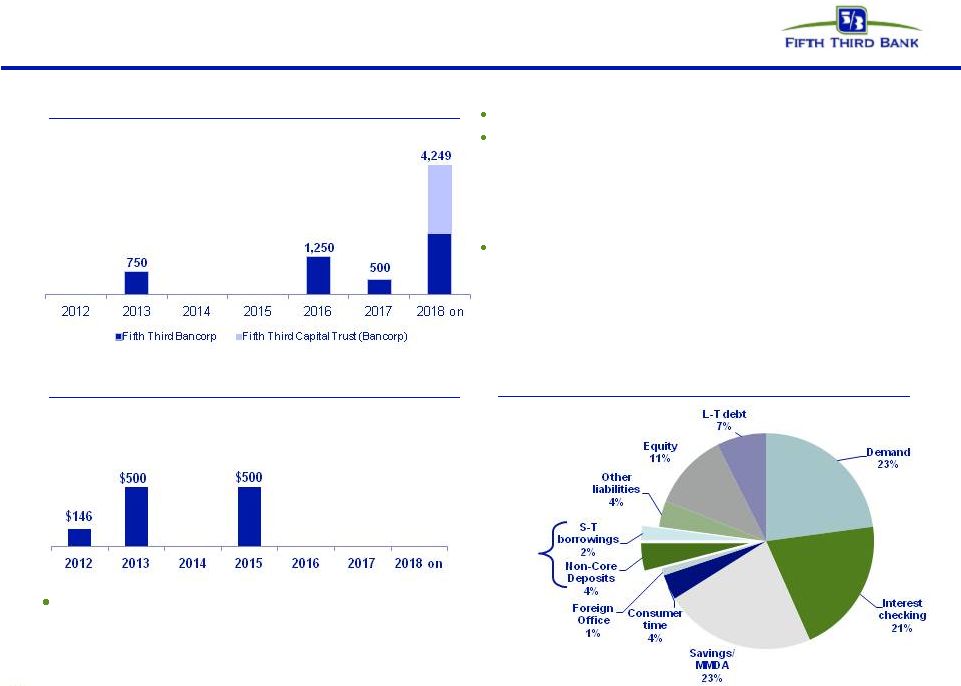
Balance sheet
•
C&I loans up 5% sequentially and 15% from 1Q11
•
CRE loans down 3% sequentially and 13% from 1Q11
•
Consumer loans up 1% sequentially and 4% from 1Q11
•
Average warehoused residential mortgage loans held-for-sale were
$2.1B in 1Q12 versus $2.2B in 4Q11
+1% QoQ; +5% YoY
•
Core deposit to loan ratio of 100%, flat versus 1Q11
•
DDAs flat sequentially and up 21% year-over-year
•
Consumer average transaction deposits up 1% sequentially and 7%
from the previous year
•
Commercial average transaction deposits up 3% sequentially and
14% from the previous year
Average loan growth ($B)^
Average core deposit growth ($B)
(2%) QoQ; +1%YoY
Average wholesale funding ($B)
•
Wholesale funding relatively flat year-over-year
–
Non-core deposits up 3% sequentially
–
Short term borrowings down 12% sequentially
–
Long-term debt up 1% sequentially
^ Excludes loans held-for-sale
Note: Numbers may not sum due to rounding
©
Fifth Third Bank | All Rights Reserved |
 7
Noninterest income
•
Noninterest income of $769mm increased $219mm, or 40%, from prior quarter; driven by
the net benefit of Vantiv’s IPO, related debt refinancing, and warrant
gains; lower charges on the Visa total return swap; and higher mortgage
banking and corporate banking revenue •
1Q12 debit interchange revenue of $29mm, versus $29mm in 4Q11 and $54mm in 1Q11
•
Credit costs recorded in noninterest income:
Noninterest income
Note: Numbers may not sum due to rounding
Actual
($ in millions)
1Q11
4Q11
1Q12
Gain / (loss) on sale of loans
$17
$9
$5
Commercial loans HFS FV adjustment
(16)
(18)
(1)
Gain / (loss) on sale of OREO properties
(2)
(22)
(17)
Mortgage repurchase costs
(2)
(1)
(2)
Total credit-related revenue impact
($3)
($33)
($14)
Actual
Seq.
YOY
1Q11
4Q11
1Q12
$
%
$
%
($ in millions)
Service charges on deposits
$124
$136
$129
($7)
(5%)
$5
4%
Corporate banking revenue
86
82
97
15
18%
11
13%
Mortgage banking net revenue
102
156
204
48
31%
102
100%
Investment advisory revenue
98
90
96
6
7%
(2)
(1%)
Card and processing revenue
80
60
59
(1)
(2%)
(21)
(27%)
Other noninterest income
81
24
175
151
629%
94
116%
Securities gains, net
8
5
9
4
80%
1
13%
Securities gains, net -
5
(3)
-
3
NM
(5)
NM
non-qualifying hedges on MSRs
Noninterest income
$584
$550
$769
$219
40%
$185
32%
©
Fifth Third Bank | All Rights Reserved |
 8
Noninterest expense
Noninterest expense
•
Noninterest expense of $973mm decreased $20mm, or 2%, compared with 4Q11, driven by a
$23mm benefit from resolution of certain outstanding disputes for
non-income tax related assessments, partially offset by seasonally high
FICA and unemployment costs; additions to litigation reserves; debt termination charges; and severance
expense
•
Credit costs recorded in noninterest expense:
Note: Numbers may not sum due to rounding
©
Fifth Third Bank | All Rights Reserved
Actual
Seq.
YOY
1Q11
4Q11
1Q12
$
%
$
%
($ in millions)
Salaries, wages and incentives
$351
$393
$399
$6
2%
$48
14%
Employee benefits
97
84
112
28
32%
15
15%
Net occupancy expense
77
79
77
(2)
(2%)
-
-
Technology and communications
45
48
47
(1)
(2%)
2
4%
Equipment expense
29
27
27
-
(1%)
(2)
(6%)
Card and processing expense
29
28
30
2
5%
1
3%
Other noninterest expense
290
334
281
(53)
(16%)
(9)
(3%)
Noninterest expense
$918
$993
$973
($20)
(2%)
$55
6%
Actual
($ in millions)
1Q11
4Q11
1Q12
Mortgage repurchase expense
$8
$18
$15
Provision for unfunded commitments
(16)
(6)
(2)
Derivative valuation adjustments
(0)
(5)
(4)
OREO expense
13
8
5
Other problem asset related expenses
27
28
19
Total credit-related operating expenses
$31
$44
$34 |
 9
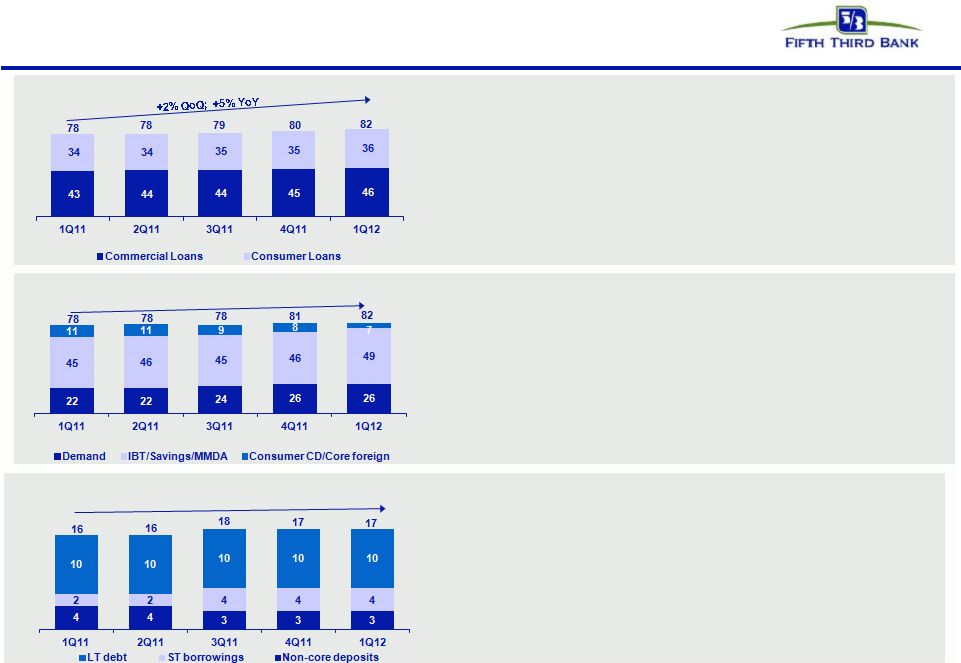
Pre-tax pre-provision earnings*
PPNR trend
*Non-GAAP measure. See Reg. G reconciliation in appendix.
^ Prior quarters include similar adjustments.
^^ See Slide 7 and Slide 8 for detailed breakout of credit-related items.
•
PPNR of $694mm up 47% from 4Q11 levels and up 27% over prior year
reflecting increased noninterest income and decreased
noninterest expense, partially offset by lower net interest income
•
Adjusted PPNR
of
$584mm,
including
negative
adjustments
totaling
$110mm,
up
10%
sequentially and 7% year-over-year
PPNR reconciliation
©
Fifth Third Bank | All Rights Reserved
($ in millions)
1Q11
2Q11
3Q11
4Q11
1Q12
Income before income taxes (U.S. GAAP) (a)
$377
$506
$530
$418
$603
Add: Provision expense (U.S. GAAP) (b)
168
113
87
55
91
PPNR (a) + (b)
$545
$619
$617
$473
$694
Adjustments to remove (benefit) / detriment^:
Vantiv IPO gain
-
-
-
-
(115)
Vantiv debt refinancing
-
-
-
-
36
Valuation of 2009 Visa total return swap
9
4
17
54
19
Securities (gains) / losses
(8)
(6)
(26)
(5)
(9)
Non-income tax related assessment resolution
-
-
-
-
(23)
Vantiv warrants & puts
2
(29)
(3)
(10)
(46)
Extinguishment (gains) / losses
(3)
(6)
-
-
9
Termination of certain borrowings and hedging
transactions
-
-
28
-
-
Severance expense
-
-
-
-
6
Litigation reserve additions
1
-
4
19
13
Adjusted PPNR
$546
$582
$637
$531
$584
Credit-related items^^:
In noninterest income
3
28
25
33
14
In noninterest expense
31
36
45
44
34
Credit-adjusted PPNR**
$580
$646
$707
$608
$632
** There are limitations on the usefulness of credit-adjusted PPNR, including the significant
degree to which changes in credit and fair value are integral, recurring components of the
Bancorp’s core operations as a financial institution. This measure has been included herein to facilitate a greater understanding of the Bancorp’s financial condition. |
 10
Strong capital position
Strong capital ratios under Basel I; estimated Basel III Tier 1 common ratio of
10.0%* Tangible common equity ratio^**
Tier I capital ratio
Total risk-based capital ratio
Tier 1 common equity**
©
Fifth Third Bank | All Rights Reserved
C
urrent period regulatory capital data ratios are estimated.
^ Tangible common equity ratio excluding (dark blue) and including (light blue) unrealized securities
gains / losses after-tax * Estimate, subject to final rule-making and clarification by
U.S. banking regulators; currently assumes unrealized securities gains are included in common equity for purposes of this calculation
**Non-GAAP measure. See Reg. G reconciliation in appendix. |
 11
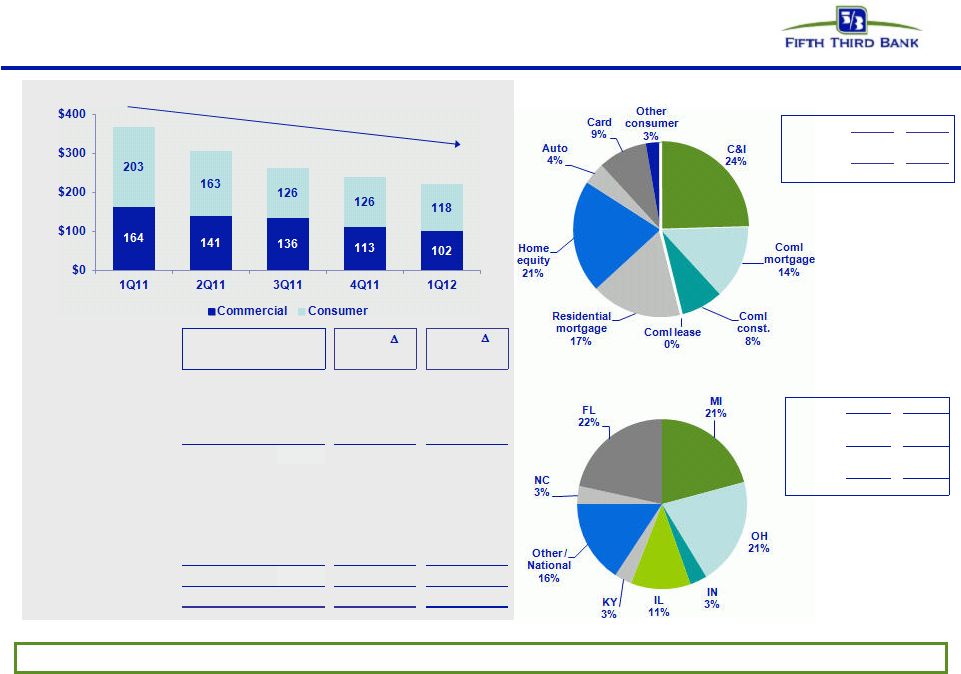
Net charge-offs
Net charge-offs by loan type
Net charge-offs by geography
Net charge-offs ($mm)
$mm
%
Commercial
$102
46%
Consumer
$118
54%
Total
$220
100%
Actual
Seq.
YOY
($ in millions)
1Q11
4Q11
1Q12
$
%
$
%
C&I
$83
$62
$54
($8)
(13%)
($29)
(35%)
Commercial mortgage
54
47
30
(17)
(36%)
(24)
(44%)
Commercial construction
26
4
18
14
350%
(8)
(31%)
Commercial lease
1
-
-
-
NM
(1)
(100%)
Commercial
$164
$113
$102
($11)
(10%)
($62)
(38%)
Residential mortgage loans
65
36
37
1
3%
(28)
(43%)
Home equity
63
50
46
(4)
(8%)
(17)
(27%)
Automobile
20
13
9
(4)
(31%)
(11)
(55%)
Credit card
31
21
20
(1)
(5%)
(11)
(35%)
Other consumer
24
6
6
-
-
(18)
(75%)
Consumer
$203
$126
$118
($8)
(6%)
($85)
(42%)
Total net charge-offs
$367
$239
$220
($19)
(8%)
($147)
(40%)
Year-over-year charge-offs down significantly due to improving credit
trends $mm
%
Florida
$47
22%
Michigan
46
21%
Subtotal
$93
43%
Other
127
57%
Total
$220
100%
©
Fifth Third Bank | All Rights Reserved
$239
$220
$367
$304
$262 |
 ©
Fifth Third Bank | All Rights Reserved
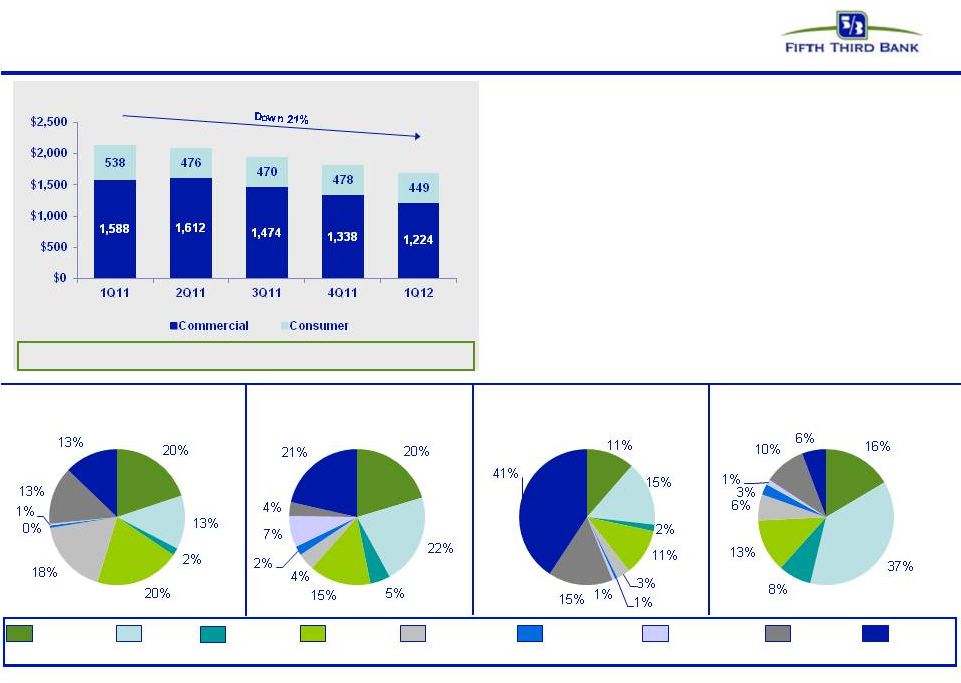
Nonperforming assets
•
NPAs of $1.7B excluding held-for-sale down
21% year-over-year
•
Commercial NPAs of $1.2B, down 23% from
the previous year
–
Homebuilder / developer NPAs of
$123mm; represent 10% of total
commercial NPAs
•
Consumer NPAs of $449mm, down 17% from
the previous year
•
NPAs in held-for-sale of $117mm
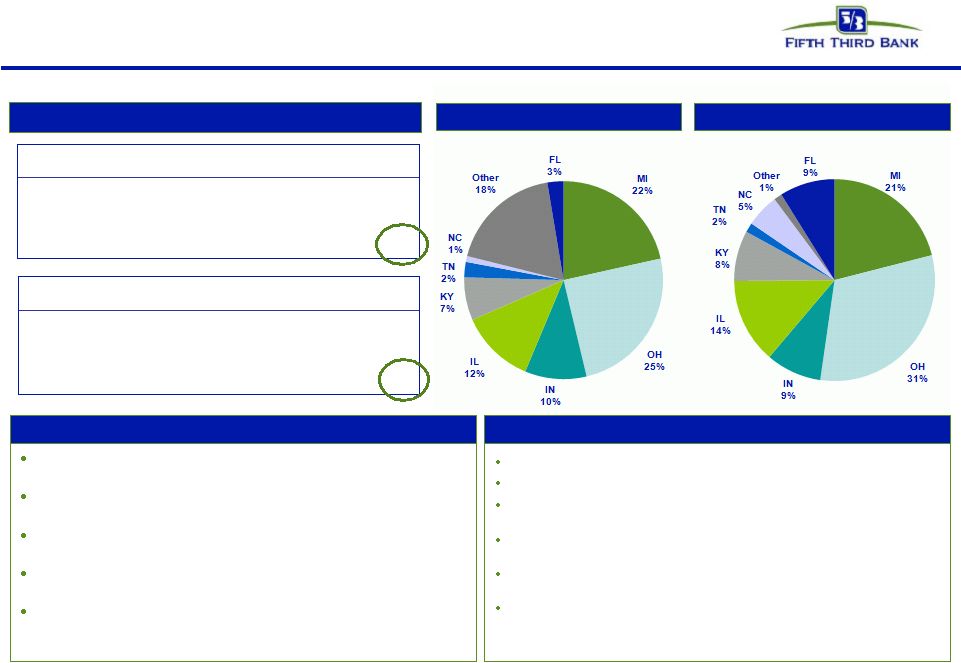
C&I / Lease
$485mm, 29%
CRE
$739mm, 44%
Residential
$393mm, 24%
Other Consumer
$56mm, 3%
ILLINOIS
INDIANA
FLORIDA
TENNESSEE
KENTUCKY
OHIO
MICHIGAN
NORTH
CAROLINA
OTHER /
NATIONAL
NPAs exclude loans held-for-sale.
Nonperforming assets ($mm)
$1,944
$1,816
Nonperforming assets continue to improve
$1,673
$2,126
$2,088
12 |
 13
NPL Rollforward
Significant improvement in NPL inflows over past year
Note: Numbers may not sum due to rounding
©
Fifth Third Bank | All Rights Reserved
NPL HFI Rollforward
Commercial
1Q11
2Q11
3Q11
4Q11
1Q12
Beginning NPL Amount
1,214
1,211
1,253
1,155
1,058
Transfers to nonperforming
329
340
217
189
168
Transfers to performing
(2)
(10)
(11)
-
(1)
Transfers to performing (restructured)
-
-
(1)
-
(2)
Transfers from held for sale
-
-
-
4
-
Transfers to held for sale
(16)
(15)
(58)
(3)
(3)
Loans sold from portfolio
(12)
(7)
(17)
(21)
(8)
Loan paydowns/payoffs
(108)
(91)
(77)
(149)
(94)
Transfer to other real estate owned
(37)
(39)
(20)
(14)
(36)
Charge-offs
(164)
(141)
(136)
(113)
(101)
Draws/other extensions of credit
7
5
5
10
7
Ending Commercial NPL
1,211
1,253
1,155
1,058
988
Consumer
1Q11
2Q11
3Q11
4Q11
1Q12
Beginning NPL Amount
466
434
386
383
380
Transfers to nonperforming
232
214
201
205
184
Transfers to performing
(35)
(34)
(33)
(28)
(36)
Transfers to performing (restructured)
(50)
(41)
(39)
(39)
(36)
Transfers to held for sale
-
-
-
-
-
Loans sold from portfolio
(1)
(21)
-
-
(4)
Loan paydowns/payoffs
(18)
(27)
(27)
(26)
(28)
Transfer to other real estate owned
(18)
(15)
(16)
(30)
(18)
Charge-offs
(144)
(126)
(91)
(87)
(80)
Draws/other extensions of credit
2
2
2
2
2
Ending Consumer NPL
434
386
383
380
364
Total NPL
1,645
1,639
1,538
1,438
1,352
Total new nonaccrual loans -
HFI
561
554
418
394
352 |
 14
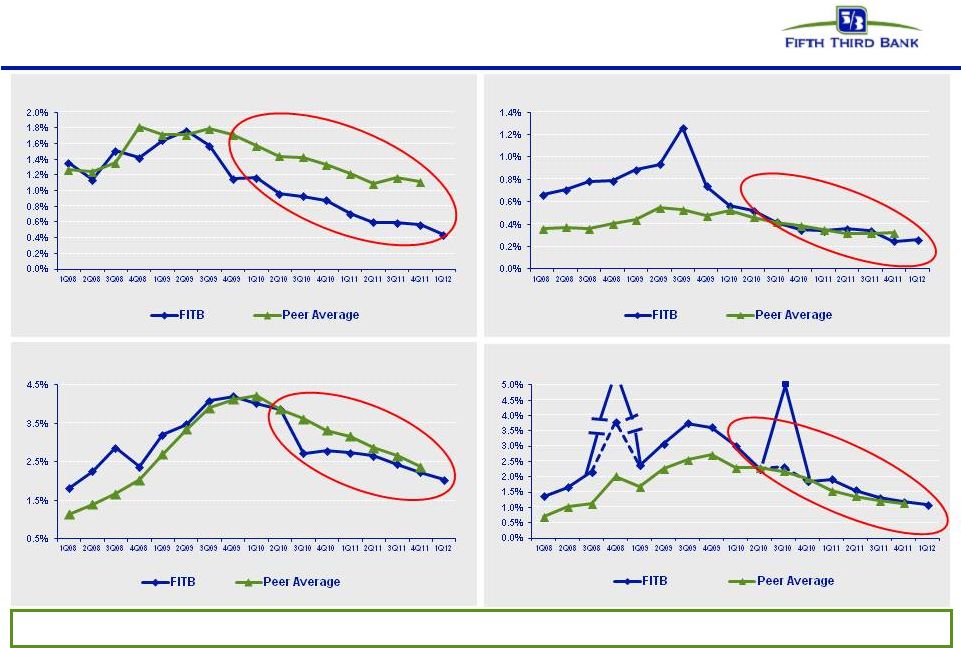
Continued improvement in credit trends
FITB credit metrics are in line with or better than peers
NPA ratio vs. peers
Net charge-off ratio vs. peers
Loans 90+ days delinquent % vs. peers
Loans 30-89 days delinquent % vs. peers
(7.5%)*
(HFS transfer)
3.8%
Before credit
actions
5.0%*
2.3%
Before credit
actions
©
Fifth Third Bank | All Rights Reserved
Peer average includes: BBT, CMA, HBAN, KEY, MTB, PNC, RF, STI, USB, WFC, and ZION
Source: SNL Financial and company filings. All ratios exclude loans held-for-sale and covered
assets for peers where appropriate. * 4Q08 NCOs included $800mm in NCOs related to commercial
loans moved to held-for-sale; 3Q10 NCOs included $510mm in NCOs related to loans sold or moved to held-for-sale
|
 15
Strong reserve position
Peer average includes: BBT, CMA, HBAN, KEY, MTB, PNC, RF,STI, USB, WFC, and
ZION Source: SNL and company reports. NPAs / NPLs exclude
held-for-sale portion for all banks as well as covered assets for BBT, USB, and ZION
1Q12 coverage ratios strong
relative to peers (4Q11)
Industry leading reserve levels
Fifth Third
(1Q12)
Peer Average
(4Q11)
©
Fifth Third Bank | All Rights Reserved |
 16
Mortgage repurchase overview
18% rise in 1Q12 outstanding claims balance from prior
quarter
—
Within recent norms of quarterly increases and
decreases
Virtually all sold loans and the majority of new claims relate
to agencies
Majority of outstanding balances of the serviced for others
portfolio relates to origination activity in 2009 and later
Private claims and exposure relate to whole loan sales (no
outstanding first mortgage securitizations)
Repurchase Reserves* ($ in millions)
Outstanding Counterparty Claims ($ in millions)
Outstanding Balance of Sold Loans ($ in millions)
1Q11
2Q11
3Q11
4Q11
1Q12
Beginning balance
101
87
80
69
72
Net reserve additions
10
15
20
20
17
Repurchase losses
(23)
(23)
(31)
(17)
(17)
Ending balance
87
80
69
72
71
2005 and prior
GSE
GNMA
Private
Total
$6,680
$273
$492
$7,445
2006
1,550
55
250
1,855
2007
2,509
80
215
2,804
2008
2,406
633
0.3
3,039
2009
9,462
3,563
0.7
13,026
2010 and later
26,338
5,884
0.3
32,222
Total
$48,945
$10,488
$958
$60,391
*Includes
reps
and
warranty
reserve
($55mm)
and
reserve
for
loans
sold
with
recourse
($17mm)
% Current
40% 42% 49% 41%
37%
©
Fifth Third Bank | All Rights Reserved
135
110
64
47
60
17
21
19
18
$145
$127
$85
$66
$78
$-
$20
$40
$60
$80
$100
$120
$140
$160
$180
1Q11
2Q11
3Q11
4Q11
1Q12
Agencies
Private
Total Claims
10
98% of outstanding balance of loans sold
77% of current quarter outstanding claims
Preponderance of private sales prior to 2006
Note: Numbers may not sum due to rounding |
 17
*“European”
includes
non-Eurozone
countries;
“European
peripheral”
includes
Greece,
Ireland,
Italy,
Portugal,
Spain
Traditional banking focus
consistent with direction of financial reform
Business
profile
positions
Fifth
Third
well
–
today
and
in
the
future
•
Do not require substantial changes to Fifth Third’s business model or asset mix
with attendant execution risk
•
Fifth Third’s business model is driven by traditional banking activities,
consistent with direction of financial reform
Dodd-Frank /
Basel III
•
International activity primarily related to trade finance and lending to U.S.
subsidiaries of foreign companies (e.g. Fifth Third loss in Lehman bankruptcy
expected to be less than $2mm)
Financial system
interconnectedness
•
Little to no impact (de minimis market maker in derivatives, proprietary
trading) –
Low trading business activity; daily VaR ~$1mm or less
–
Small private equity portfolio <$200mm
Volcker rule
•
Other large firms facing significant litigation related to mortgage securitizations,
GSE repurchases, and private label mortgage repurchases
•
Fifth Third’s mortgage risks are manageable
–
Quarterly mortgage repurchase costs ~$20mm
–
Total
mortgage securitizations outstanding $19mm (2003 HELOC performing well)
Mortgage Putback /
Litigation risk
•
No significant business at Fifth Third impaired during crisis
Effect of crisis on
core business
•
No direct European sovereign exposure
European banks and
sovereign debt
exposure
©
Fifth Third Bank | All Rights Reserved
No originations of CDOs, securitizations on behalf of others
–
Didn’t originate or sell subprime mortgages or Option ARMs
Total exposure to European peripheral borrowers less than $0.2 billion*
Total exposure to European banks less than $0.1B |
 18
Appendix
©
Fifth Third Bank | All Rights Reserved |
 19
Well-positioned for the future
•
Holding company cash currently sufficient for more than 3 years of obligations; no
holding company and minimal Bank unsecured debt maturities until 2013
•
Fifth Third has completely exited all crisis-era government support
programs Superior capital and liquidity position
•
NCOs of 1.1%; 2.4x reserves / annualized NCOs
•
Substantial reduction in exposure to CRE since 1Q09; relatively low CRE exposure
versus peers •
Very low relative exposure to areas of concern, e.g. European financials, mortgage
repurchase risk Proactive approach to risk management
•
Traditional commercial banking franchise built on customer-oriented localized
operating model •
Strong market share in key markets with focus on further improving density
•
Fee income ~46% of total revenues
Diversified traditional banking platform
•
PPNR has remained strong throughout the credit cycle
•
PPNR substantially exceeds annual net charge-offs (315% PPNR / NCOs^ in
1Q12) •
1.5% ROAA; 16% return on average tangible common equity^
Industry leader in earnings power
^ Non-GAAP measure. See Reg. G reconciliation on slides 34-35.
©
Fifth Third Bank | All Rights Reserved
Fifth Third is one of the few large banks that have no TLGP-guaranteed debt to
refinance in 2012 |
 20
Balance Sheet:
Average loans & leases (excl. HFS)
Average transaction deposits
Income Statement:
Net interest income*
Net interest margin*
Noninterest income
Noninterest expense
Pre-provision net revenue**
ROA
Effective tax rate
Asset Quality:
Net charge-offs
Loan loss allowance
Nonperforming assets^
Capital
Ratios
#
:
Tier I common equity** (Basel III)
Tier I leverage
Tier I capital
Total risk-based capital
Category
Fifth Third: Outlook
2Q12 Outlook
$81.5bn
$77.1bn
~$895mm +/-
Down ~5-6 bps +/-
vs.1Q12
~$625mm +/-
Down ~$15mm vs. 1Q12
~1Q12 levels (ex-Vantiv) +/-
~1.1 -1.2%
~32-33% for 2Q12 (29% FY2012)
*Presented on a fully-taxable equivalent basis.
** Non-GAAP measure. See Reg. G reconciliation on slides 34-35.
^ Ratio as a percent of loans excluding held-for-sale; allowance
expectation assumes current expectation for credit and economic trends and is subject to review at quarter-end.
^^ Annualized net charge-offs as a percentage of average loans and leases
# Current period regulatory capital data ratios are estimated; see slide 35 for
estimation of Basel III phased-in Tier 1 common 1Q12 Actual
Outlook as of April 19, 2012
Solid growth vs. 1Q12
Stable vs. 1Q12
Down ~$25mm vs. 1Q12 (<1.00%^^)
Lower vs. 1Q12
Down ~$75-100mm vs. 1Q12
$903mm
3.61%
$769mm ($644mm ex-Vantiv)
$973mm
$694mm ($569mm ex-Vantiv)
1.5% (1.2% ex-Vantiv)
29%
9.6% (~10.0%)
11.3%
12.2%
16.1%
$220mm(1.08%^^)
$2.1bn (2.59%)
$1.7bn (2.03%)
Please see cautionary statement on slide 2 for risk factors related to
forward-looking statements ©
Fifth Third Bank | All Rights Reserved |
 21
Total
Exposure
Funded
Exposure
Total
Exposure
Funded
Exposure
Total
Exposure
Funded
Exposure
Total
Exposure
Funded
Exposure
(amounts in $mm)
Peripheral Europe
-
-
11
-
168
124
179
124
Other Eurozone
-
-
44
34
1,275
742
1,319
776
Total Eurozone
-
-
55
34
1,443
866
1,498
900
Other Europe
-
-
23
18
820
496
843
514
Total Europe
-
-
77
52
2,263
1,362
2,340
1,414
Sovereigns
Financial Institutions
Non-Financial Entities
Total
European Exposure
Total exposure includes funded and unfunded commitments, net of collateral; funded
exposure excludes unfunded exposure Peripheral Europe includes Greece,
Ireland, Italy, Portugal and Spain Eurozone
includes
countries
participating
in
the
European
common
currency
(Euro)
Other Europe includes European countries not part of the Euro (primarily the United
Kingdom and Switzerland) Data above includes exposure to U.S. subsidiaries of
Europe-domiciled companies Note: Numbers may not sum due to
rounding z
•
International exposure primarily related to trade finance and financing activities of
U.S. companies with foreign parent or overseas activities of U.S.
customers •
No European sovereign exposure (total international sovereign exposure $3mm)
•
Total exposure to European financial institutions <$80mm
•
Total exposure to five peripheral Europe countries <$200mm
•
$900mm in funded exposure to Eurozone-related companies (~1% of total loan
portfolio) z
z
©
Fifth Third Bank | All Rights Reserved |
 22
Available and contingent borrowing capacity (1Q12):
–
FHLB ~$11B
–
Federal Reserve ~$24B
Holding Company cash at 3/31/12: $3.2B
Cash currently sufficient to satisfy all fixed obligations
in a stressed environment for more than 3 years
(debt maturities, common and preferred dividends,
interest and other expenses) without accessing capital
markets; relying on dividends from subsidiaries;
proceeds from asset sales
Expected cash obligations over the next 24 months
—
~$591mm common dividends
—
~$70mm Series G preferred dividends
—
~$889mm interest and other expenses
Holding company unsecured debt maturities ($mm)
Bank
unsecured
debt
maturities
($mm
–
excl.
Brokered
CDs)
Heavily core funded
Strong liquidity profile
S-T
wholesale
6%
©
Fifth Third Bank | All Rights Reserved |
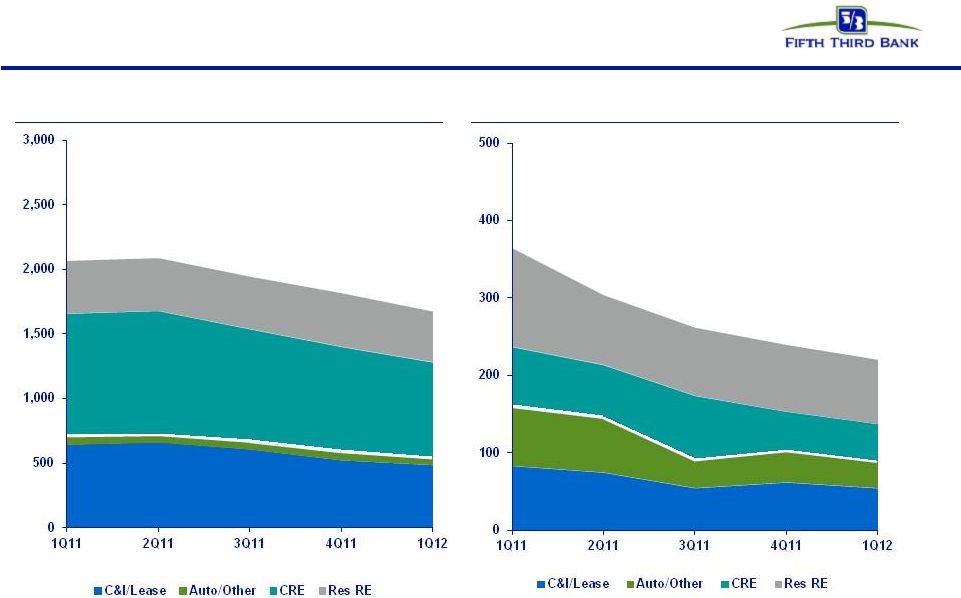 23
Non-performing assets and net charge-offs:
Product view*
Total NPAs
Total NCOs
*NPAs exclude loans held-for-sale.
©
Fifth Third Bank | All Rights Reserved |
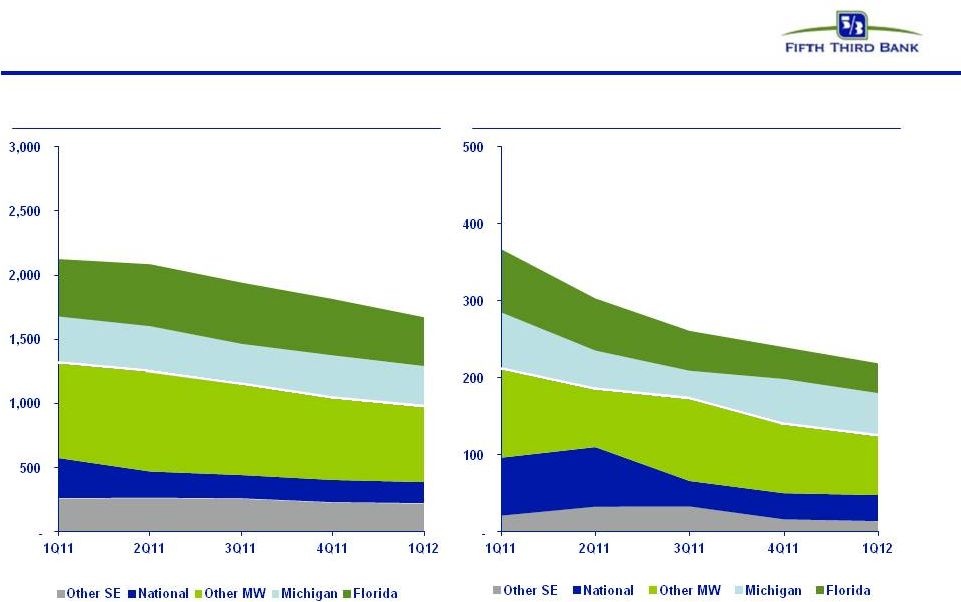 Total NPAs
Total NCOs
Non-performing assets and net charge-offs:
Geographic view*
*NPAs exclude loans held-for-sale.
24
©
Fifth Third Bank | All Rights Reserved |
 25
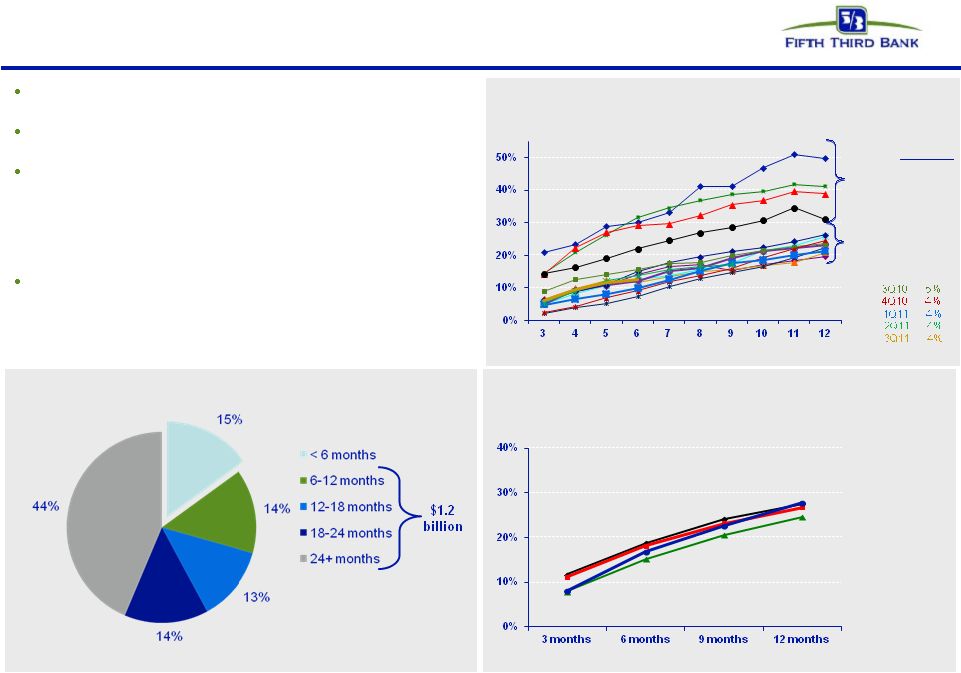
Troubled debt restructurings overview
Successive improvement in vintage performance during
2008 and 2009 as volume of modification increased
Fifth Third’s mortgage portfolio TDRs have redefaulted
at a lower rate than GSE composites
Of $1.8B in consumer TDRs, $1.6B were on accrual
status and $201mm were nonaccruals
—
$1.2B of TDRs are current and have been on the
books 6 or more months; within that, ~$1B of
TDRs are current and have been on the books for
more than a year
As current TDRs season, their default propensity
declines significantly
—
We see much lower defaults on current loans after
a vintage approaches 12 months since
modification
TDR performance has improved in newer vintages
Redefault benchmarks
Source: Fifth Third and OCC/OTS data through 3Q11
Mortgage TDR 60+ redefault trend by vintage*
1Q08 3%
2Q08 7%
3Q08 7%
4Q08 8%
1Q09 11%
2Q09 12%
Months since modification
Mortgage TDR 60+ redefault rate: Fifth Third comparison
(January 1, 2008 through December 2011)*
Fannie Mae
Industry
portfolio loans
Fifth Third
Volume by
vintage
Freddie Mac
3Q09 12%
$1.3B current consumer TDRs (%)
4Q09 7%
2008
2009-
2011
1Q10 7%
2Q10 5%
* Fifth Third data includes changes made to align with OCC/OTS methodology (i.e.
excludes government loans, closed loans and OREO from calculations)
©
Fifth Third Bank | All Rights Reserved |
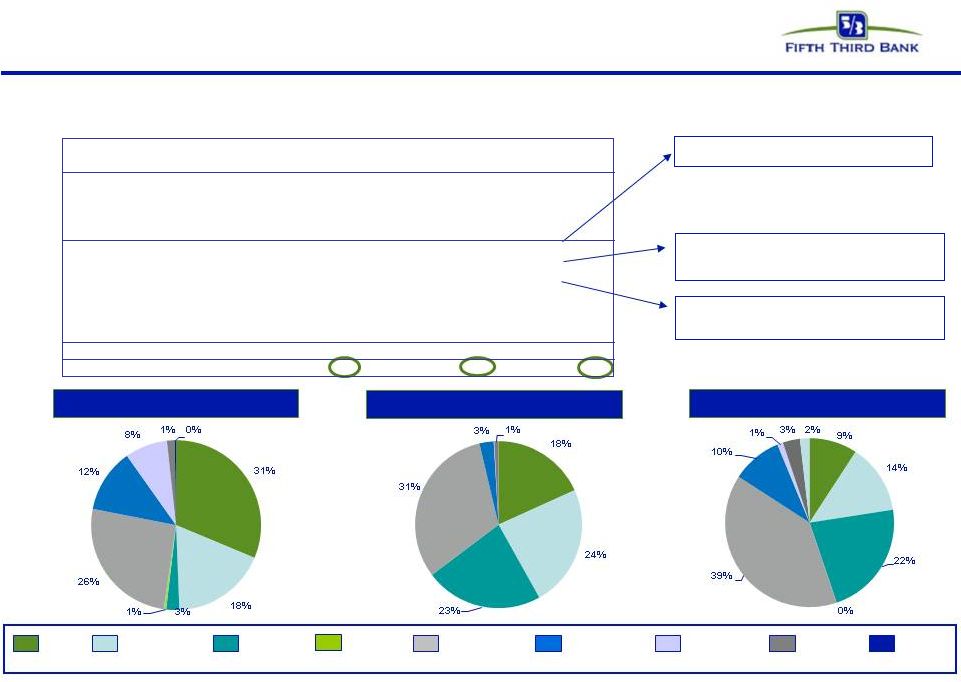
 26
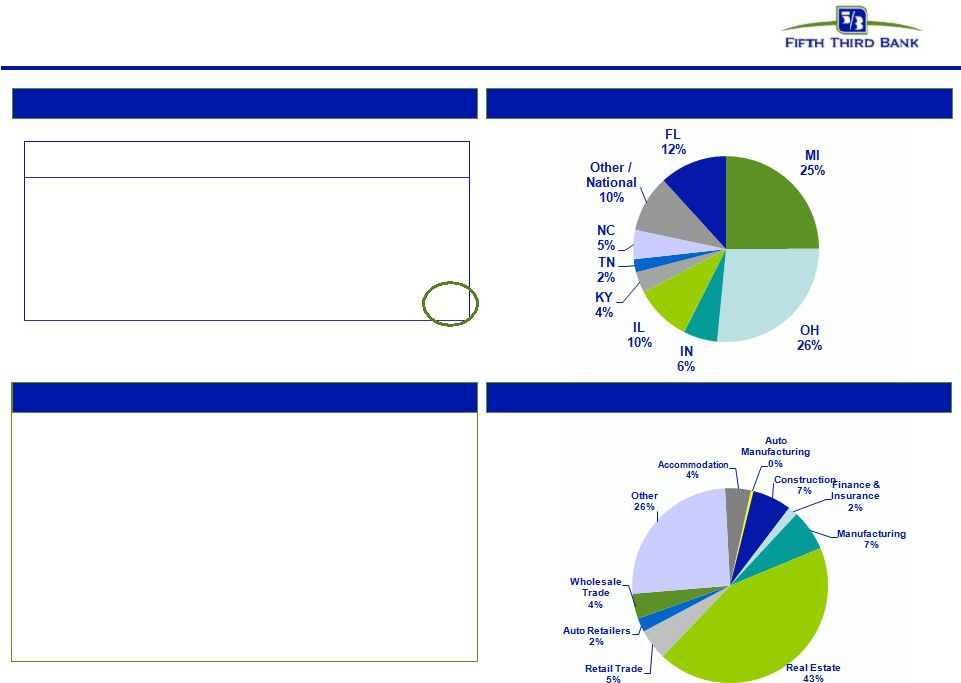
Commercial & industrial*
Loans by geography
Credit trends
Loans by industry
Comments
•
Commercial & Industrial loans represented 39% of total loans
and 24% of net charge-offs
•
25% of 1Q12 losses on loans to companies in real estate
related industries
–
Loans to real estate related industries of $2.5B (8%);
1Q12 NCO ratio of 0.53%
•
FL represented 8% of 1Q12 losses, 6% of loans; MI
represented 14% of losses, 10% of loans
*NPAs exclude loans held-for-sale.
©
Fifth Third Bank | All Rights Reserved
($ in millions)
1Q11
2Q11
3Q11
4Q11
1Q12
EOP Balance
$27,344
$28,099
$29,258
$30,783
$32,155
Avg Loans
$27,331
$27,909
$28,777
$29,891
$31,371
90+ days delinquent
$8
$7
$9
$4
$2
as % of loans
0.03%
0.02%
0.03%
0.01%
0.01%
NPAs
$620
$638
$588
$509
$474
as % of loans
2.27%
2.27%
2.01%
1.65%
1.47%
Net charge-offs
$83
$76
$55
$62
$54
as % of loans
1.22%
1.10%
0.76%
0.82%
0.69%
C&I
Accommodation
2%
Construction
4%
Finance
&
Insurance
13%
Manufacturing
24%
Real Estate
4%
Retail Trade
4%
Auto Retailers
2%
Other
35%
MI
10%
OH
17%
IN
4%
IL
14%
KY
4%
TN
4%
NC
3%
Other /
National
38%
FL
6%
Auto
Manufacturing
1%
Wholesale
Trade
11% |
  27
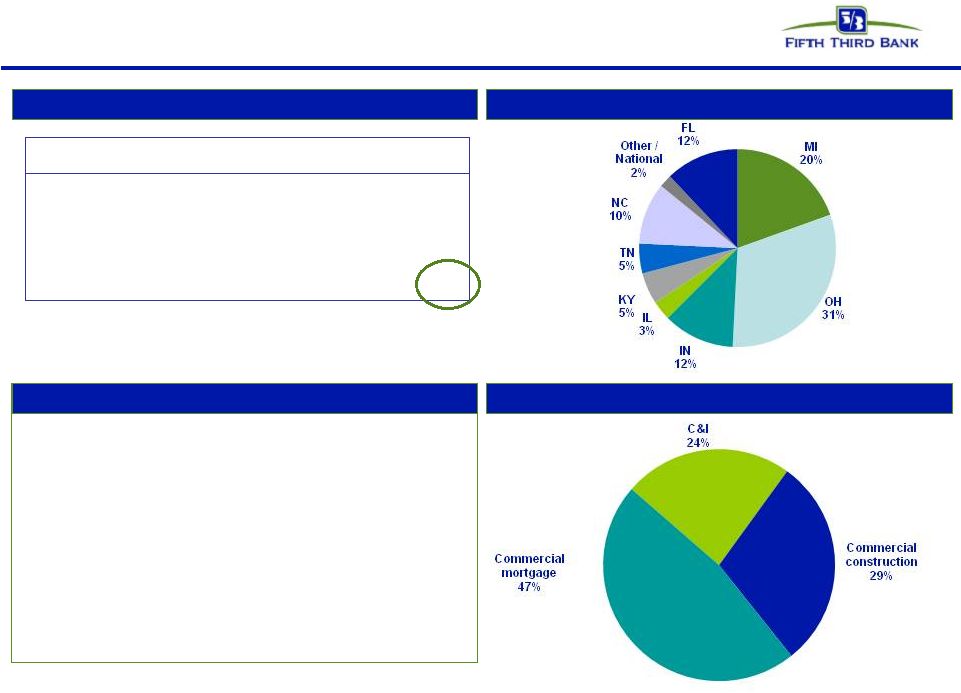
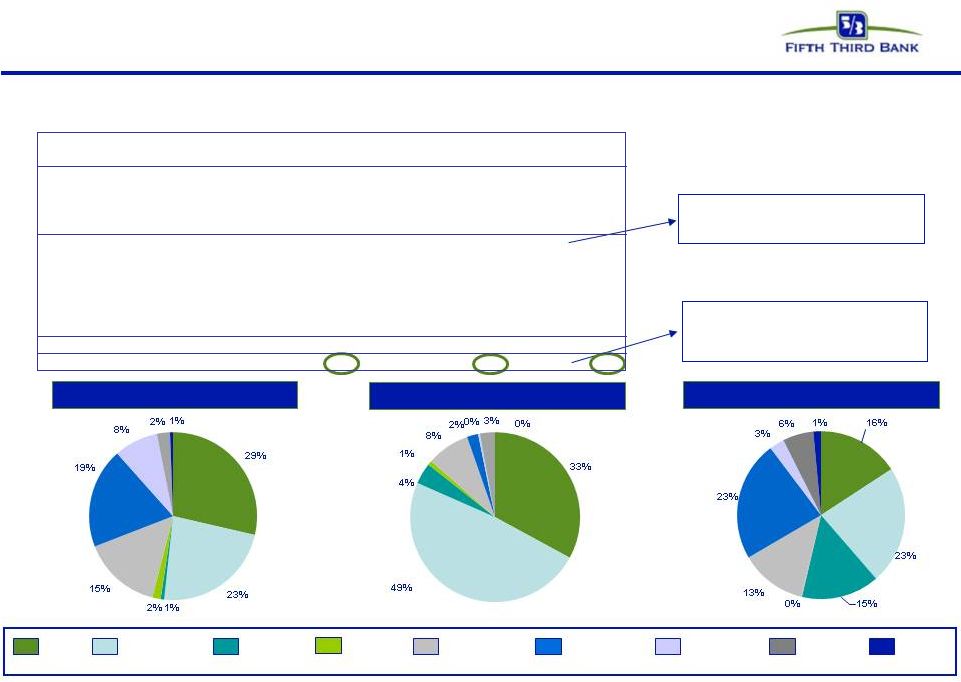
Commercial mortgage*
Loans by geography
Credit trends
Loans by industry
Comments
*NPAs exclude loans held-for-sale.
•
Commercial mortgage loans represented 12% of total loans
and 13% of net charge-offs
•
Owner occupied 1Q12 NCO ratio of 0.9%, non-owner occupied
1Q12 NCO ratio of 1.5%
•
Loans from FL/MI represented 38% of portfolio loans, 57% of
portfolio losses in 1Q12
($ in millions)
1Q11
2Q11
3Q11
4Q11
1Q12
EOP Balance
$10,510
$10,233
$10,330
$10,138
$9,909
Avg Loans
$10,685
$10,394
$10,050
$10,262
$10,007
90+ days delinquent
$8
$12
$9
$3
$30
as % of loans
0.08%
0.11%
0.09%
0.03%
0.30%
NPAs
$696
$710
$630
$637
$568
as % of loans
6.63%
6.94%
6.10%
6.28%
5.73%
Net charge-offs
$54
$47
$47
$47
$30
as % of loans
2.04%
1.83%
1.86%
1.82%
1.18%
Commercial mortgage
©
Fifth Third Bank | All Rights Reserved |
  28
($ in millions)
1Q11
2Q11
3Q11
4Q11
1Q12
EOP Balance
$1,980
$1,778
$1,213
$1,020
$901
Avg Loans
$2,030
$1,918
$1,752
$1,132
$992
90+ days delinquent
$23
$48
$43
$1
$0
as % of loans
1.16%
2.71%
3.65%
0.09%
0.05%
NPAs
$248
$240
$238
$179
$171
as % of loans
12.53%
13.52%
19.60%
17.60%
19.02%
Net charge-offs
$26
$20
$35
$4
$18
as % of loans
5.24%
4.09%
7.90%
1.37%
7.30%
Commercial construction
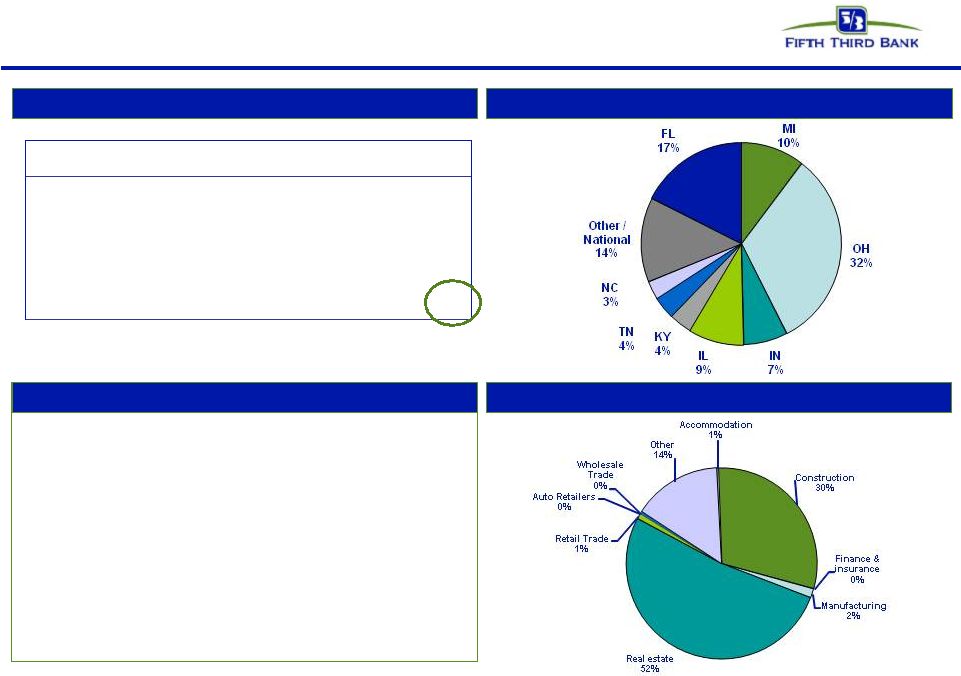
Commercial construction*
Loans by geography
Credit trends
Loans by industry
Comments
*NPAs exclude loans held-for-sale.
•
Commercial construction loans represented 1% of total loans
and 8% of net charge-offs
•
Loans from FL/MI represented 27% of portfolio loans, 97% of
portfolio losses in 1Q12
©
Fifth Third Bank | All Rights Reserved |
 29
($ in millions)
1Q11
2Q11
3Q11
4Q11
1Q12
EOP Balance
$651
$597
$578
$512
$423
90+ days delinquent
$1
$1
$3
$0
$1
as % of loans
0.16%
0.19%
0.59%
0.03%
0.15%
NPAs
$249
$243
$207
$155
$123
as % of loans
38.30%
40.67%
35.87%
30.34%
29.06%
Net charge-offs
$22
$14
$18
$2
$14
as % of loans
13.04%
8.91%
11.50%
1.28%
11.95%
Homebuilders/developers
Homebuilders/developers*
(included in previous slides)
Loans by geography
Credit trends
Loans by industry
Comments
•
Originations of builder/developer loans suspended in 2007
•
Remaining portfolio balance of $423mm, down 87% from
peak of $3.3B in 2Q08; represents approximately 0.5% of
total loans and 0.9% of commercial loans
•
$14mm of NCOs (17% commercial mortgage, 81%
commercial construction, 2% C&I)
•
$123mm of NPAs (53% commercial mortgage, 38%
commercial construction, 9% C&I)
*NPAs exclude loans held-for-sale.
©
Fifth Third Bank | All Rights Reserved |
 30
©
Fifth Third Bank | All Rights Reserved
Residential mortgage
1
liens:
100%;
weighted
average
LTV:
73.6%
Weighted average origination FICO: 749
Origination FICO distribution: <660 7%; 660-689 6%; 690-719
10%; 720-749 13%; 750+ 52%; Other^ 12%
(note: loans <660 includes CRA loans and FHA/VA loans)
Origination LTV distribution: <=70 36%; 70.1-80 38%; 80.1-90 7%;
90.1-95 4%; >95 15%
Vintage distribution: 2012 8%; 2011 28%; 2010 17%; 2009 5%;
2008 6%; 2007 7%; 2006 7%; 2005 11%; 2004 and prior 11%
% through broker: 14%; performance similar to direct
Loans by geography
Credit trends
Portfolio details
Comments
^ Includes acquired loans where FICO at origination is not available
•
Residential
mortgage
loans
represented
14%
of
total
loans
and
17% of net charge-offs
•
FL portfolio 16% of residential mortgage loans and 50% of
portfolio losses
($ in millions)
1Q11
2Q11
3Q11
4Q11
1Q12
EOP Balance
$9,530
$9,849
$10,249
$10,672
$11,094
Avg Loans
$9,282
$9,654
$10,006
$10,464
$10,828
90+ days delinquent
$98
$87
$91
$79
$73
as % of loans
1.03%
0.88%
0.89%
0.74%
0.66%
NPAs
$338
$338
$337
$350
$331
as % of loans
3.55%
3.43%
3.29%
3.28%
2.98%
Net charge-offs
$65
$36
$36
$36
$37
as % of loans
2.82%
1.50%
1.41%
1.38%
1.39%
Residential mortgage
MI
15%
OH
25%
IN
7%
IL
12%
KY
6%
TN
2%
NC
5%
Other /
National
12%
FL
16%
st |
   31
Home equity loans represented 13% of total loans and 21% of net
charge-offs
Approximately 14% of portfolio in broker product generated 33% total
loss
Approximately one third of Fifth Third 2
liens are behind Fifth
Third 1
liens
2005/2006 vintages represent approximately 28% of portfolio; account
for 50% of losses
Aggressive home equity line management strategies in place
($ in millions)
1Q11
2Q11
3Q11
4Q11
1Q12
EOP Balance
$9,585
$9,462
$9,380
$9,038
$8,986
90+ days delinquent
$59
$61
$62
$56
$55
as % of loans
0.62%
0.64%
0.66%
0.62%
0.62%
Net charge-offs
$39
$34
$35
$30
$31
as % of loans
1.64%
1.46%
1.50%
1.33%
1.39%
Home equity - direct
($ in millions)
1Q11
2Q11
3Q11
4Q11
1Q12
EOP Balance
$1,637
$1,586
$1,540
$1,455
$1,507
90+ days delinquent
$25
$23
$21
$18
$19
as % of loans
1.51%
1.46%
1.37%
1.24%
1.23%
Net charge-offs
$24
$20
$18
$16
$15
as % of loans
5.88%
4.95%
4.53%
4.27%
4.01%
Home equity - brokered
Home equity
1 liens: 32%; 2
liens: 68%
Weighted average origination FICO: 750
Origination FICO distribution^: <660 4%; 660-689 7%; 690-719 13%;
720-749 17%; 750+ 51%; Other 8%
Average CLTV: 74%; Origination CLTV distribution: <=70 40%; 70.1-80 22%;
80.1-90 18%; 90.1-95 7%; >95 13%
Vintage distribution: 2012 1%; 2011 5%; 2010 4%; 2009 4%; 2008 11%; 2007
11%; 2006 14%; 2005 13%; 2004 and prior 37%
% through broker channels: 14% WA FICO: 735 brokered, 753 direct; WA
CLTV: 88% brokered; 71% direct
Portfolio details
Comments
Brokered loans by geography
Direct loans by geography
Credit trends
Note: Brokered and direct home equity net charge-off ratios are calculated
based on end of period loan balances ^ Includes acquired loans where FICO at
origination is not available ©
Fifth Third Bank | All Rights Reserved
st
st
nd
nd |
 Florida market*
Deterioration in real estate values having effect on credit trends as evidenced by
elevated NPA/NCOs in real estate related products COML
MORTGAGE
C&I
RESI
MORTGAGE
OTHER
CONS
COML
CONST
COML
LEASE
HOME
EQUITY
AUTO
CREDIT
CARD
Total Loans
NPAs
NCOs
*NPAs exclude loans held-for-sale.
Weak commercial real estate market
Losses due to significant declines in
valuations
Valuations; relatively small home
equity portfolio
32
©
Fifth Third Bank | All Rights Reserved
Loans ($B)
% of
FITB
NPAs ($M)
% of
FITB
NCOs
($M)
% of
FITB
Commercial loans
2.1
7%
62
13%
4
8%
Commercial mortgage
1.2
12%
80
14%
6
21%
Commercial construction
0.2
19%
78
46%
11
59%
Commercial lease
0.0
1%
-
0%
-
0%
Commercial
3.5
8%
221
18%
21
21%
Mortgage
1.7
16%
150
46%
19
50%
Home equity
0.8
8%
9
15%
5
10%
Auto
0.5
5%
0
4%
1
5%
Credit card
0.1
5%
3
6%
2
8%
Other consumer
0.0
6%
-
0%
1
18%
Consumer
3.2
9%
163
36%
26
22%
Total
6.7
8%
384
23%
47
21% |
 Michigan market*
Deterioration in home price values coupled with weak economy impacted credit results
due to frequency of defaults and severity COML
MORTGAGE
C&I
RESI
MORTGAGE
OTHER
CONS
COML
CONST
COML
LEASE
HOME
EQUITY
AUTO
CREDIT
CARD
Total Loans
NPAs
NCOs
*NPAs exclude loans held-for-sale.
Negative impact from housing
valuations, economy,
unemployment
Economic weakness impact on
commercial real estate market
33
©
Fifth Third Bank | All Rights Reserved
Loans ($B)
% of
FITB
NPAs ($M)
% of
FITB
NCOs
($M)
% of
FITB
Commercial loans
3.2
10%
94
20%
7
14%
Commercial mortgage
2.6
26%
139
24%
10
36%
Commercial construction
0.1
9%
11
7%
7
38%
Commercial lease
0.2
5%
2
21%
(0)
0%
Commercial
6.0
13%
247
20%
25
24%
Mortgage
1.7
15%
39
12%
6
16%
Home equity
2.2
21%
6
10%
11
23%
Auto
0.9
8%
1
9%
1
13%
Credit card
0.3
15%
9
20%
3
14%
Other consumer
0.1
21%
-
0%
1
14%
Consumer
5.1
14%
55
12%
21
18%
Total
11.2
301
46
14%
18%
21% |
 34
Regulation G Non-GAAP reconciliation
©
Fifth Third Bank | All Rights Reserved
$ and shares in millions
(unaudited)
March
December
September
June
March
2012
2011
2011
2011
2011
Income before income taxes (U.S. GAAP)
$603
$418
$530
$506
$377
Add:
Provision expense (U.S. GAAP)
91
55
87
113
168
Pre-provision net revenue (a)
694
473
617
619
545
Net income available to common shareholders (U.S. GAAP)
421
305
373
328
88
Add:
Intangible amortization, net of tax
3
3
3
4
5
Tangible net income available to common shareholders
424
308
376
332
93
Tangible net income available to common shareholders (annualized) (b)
1,705
1,222
1,492
1,332
377
Average Bancorp shareholders' equity (U.S. GAAP)
13,366
13,147
12,841
12,365
13,052
Less:
Average preferred stock
398
398
398
398
1,557
Average goodwill
2,417
2,417
2,417
2,417
2,417
Average intangible assets
38
42
47
52
59
Average tangible common equity (c)
10,513
10,290
9,979
9,498
9,019
Total Bancorp shareholders' equity (U.S. GAAP)
13,560
13,201
13,029
12,572
12,163
Less:
Preferred stock
(398)
(398)
(398)
(398)
(398)
Goodwill
(2,417)
(2,417)
(2,417)
(2,417)
(2,417)
Intangible assets
(36)
(40)
(45)
(49)
(55)
Tangible common equity, including unrealized gains / losses (d)
10,709
10,346
10,169
9,708
9,293
Less: Accumulated other comprehensive income / loss
(468)
(470)
(542)
(396)
(263)
Tangible common equity, excluding unrealized gains / losses (e)
10,241
9,876
9,627
9,312
9,030
Total assets (U.S. GAAP)
116,747
116,967
114,905
110,805
110,485
Less:
Goodwill
(2,417)
(2,417)
(2,417)
(2,417)
(2,417)
Intangible assets
(36)
(40)
(45)
(49)
(55)
Tangible assets, including unrealized gains / losses (f)
114,294
114,510
112,443
108,339
108,013
Less: Accumulated other comprehensive income / loss, before tax
(720)
(723)
(834)
(609)
(405)
Tangible assets, excluding unrealized gains / losses (g)
113,574
113,787
111,609
107,730
107,608
Common shares outstanding (h)
920
920
920
920
919
Net charge-offs (i)
220
239
262
304
367
Ratios:
Return on average tangible common equity (b) / (c)
16.2%
11.9%
15.0%
14.0%
4.2%
Tangible common equity (excluding unrealized gains/losses) (e) /
(g)
9.02%
8.68%
8.63%
8.64%
8.39%
Tangible common equity (including unrealized gains/losses) (d) /
(f)
9.37%
9.04%
9.04%
8.96%
8.60%
Tangible book value per share (d) / (h)
11.64
11.25
11.05
10.55
10.11
Pre-provision net revenue / net charge-offs (a) / (i)
315%
198%
235%
204%
149%
For the Three Months Ended |
 35
Regulation G Non-GAAP reconciliation
©
Fifth Third Bank | All Rights Reserved
$ and shares in millions
(unaudited)
March
December
September
June
March
2012
2011
2011
2011
2011
Total Bancorp shareholders' equity (U.S. GAAP)
$13,560
$13,201
$13,029
$12,572
$12,163
Goodwill and certain other intangibles
(2,518)
(2,514)
(2,514)
(2,536)
(2,546)
Unrealized gains
(468)
(470)
(542)
(396)
(263)
Qualifying trust preferred securities
2,248
2,248
2,273
2,312
2,763
Other
38
38
20
20
12
Tier I capital
12,860
12,503
12,266
11,972
12,129
Less:
Preferred stock
(398)
(398)
(398)
(398)
(398)
Qualifying trust preferred securities
(2,248)
(2,248)
(2,273)
(2,312)
(2,763)
Qualifying noncontrolling interest in consolidated subsidiaries
(50)
(50)
(30)
(30)
(30)
Tier I common equity (a)
10,164
9,807
9,565
9,232
8,938
Unrealized gains
468
Disallowed deferred tax assets
-
Disallowed MSRs
78
Other
11
Less:
10% of individual deferred tax assets, MSRs, investment in financial entities
-
15% of aggregate deferred tax assets, MSRs, investment in financial entities
-
Tier 1 common equity, Basel III proforma (b)
10,721
Risk-weighted assets, determined in accordance with
prescribed regulatory requirements (c)
105,451
104,945
102,562
100,320
99,392
Regulatory deductions not deducted from Tier 1 common equity,
risk-weighted at 250%
1,582
Risk-weighted assets, Basel III proforma (d)
107,033
Ratios:
Tier I common equity (a) / (c)
9.64%
9.35%
9.33%
9.20%
8.99%
Tier I common equity, Basel III proforma (b) / (d)
10.02%
Add:
For the Three Months Ended
9.74%
9.80%
1,453
1,377
106,398
103,939
470
542
-
-
70
64
12
10
-
-
-
-
10,359
10,181
9.43%
9.16%
101,794
100,964
1,474
1,572
-
-
-
-
9
396
263
(113)
(41)
70
90
(7)
9,594
9,243 |