Attached files
| file | filename |
|---|---|
| 8-K - FORM 8-K - BANCORPSOUTH INC | d339277d8k.htm |
| EX-99.1 - PRESS RELEASE ISSUED ON APRIL 23, 2012 BY BANCORPSOUTH, INC - BANCORPSOUTH INC | d339277dex991.htm |
 BancorpSouth, Inc.
Financial Information
As of March 31, 2012
Exhibit 99.2 |
 Forward Looking Information
2
Certain statements contained in this presentation and the accompanying slides may not be based on
historical facts and are “forward-looking
statements” within the
meaning of Section 27A of the Securities Act of 1933, as amended, and Section 21E of the Securities Exchange Act of
1934, as amended. These forward-looking statements may be identified by reference to a
future period or by the use of forward-looking terminology, such as “anticipate,” “believe,” “estimate,” “expect,” “foresee,” “may,” “might,” “will,” “intend,” “could,” “would” or “plan,” or future
or conditional verb tenses, and variations or negatives of such terms. These forward-looking
statements include, without limitation, statements about long-term prospects for
shareholder value, the impact of the prevailing economy, the use of non-GAAP financial measures, disposition of
ORE, internal initiatives, results of operations and financial condition. We caution you not to place
undue reliance on the forward-looking statements contained in this presentation, in that
actual results could differ materially from those indicated in such forward-looking statements as a
result of a variety of factors. These factors may include, but are not limited to, conditions in the
financial markets and economic conditions generally, the ongoing debt crisis and the downgrade
of the sovereign credit ratings for various nations, the adequacy of the Company’s provision
and allowance for credit losses to cover actual credit losses, the credit risk associated with real
estate construction, acquisition and development loans, losses resulting from the significant
amount of the Company’s other real estate owned, limitations on the Company’s ability to declare and
pay dividends, the impact of legal or administrative proceedings, the availability of capital
on favorable terms if and when needed, liquidity risk, governmental regulation, including the
Dodd Frank Act, and supervision of the Company’s operations, the impact of regulations on service
charges on the Company’s core
deposit accounts, the susceptibility of the Company’s business to local economic conditions, the soundness of
other financial institutions, changes in interest rates, the impact of monetary policies and economic
factors on the Company’s ability to attract
deposits or make loans, volatility in capital and credit markets, reputational risk, the impact of
hurricanes or other adverse weather events, any requirement that the Company write down
goodwill or other intangible assets, diversification in the types of financial services the Company offers,
competition with other financial services companies, risks in connection with completed or potential
acquisitions, the Company’s growth strategy,
interruptions or breaches in the
Company’s information system security, the failure of certain third party vendors to perform, dilution caused by the
Company
’
s issuance of any additional shares of its common stock to raise capital or acquire other banks, bank
holding companies, financial holding companies and insurance agencies, the effectiveness of the
Company’s internal controls, other factors generally understood to affect the
financial results of financial services companies and other factors detailed from time to time in the
Company’s press releases and filings with the
Securities and Exchange Commission. Forward-looking statements speak only as of the date
they were made, and, except as required by law, we do not undertake any obligation to update or
revise forward-looking statements to reflect events or circumstances after the date of this
presentation. Certain tabular presentations may not reconcile because of rounding. Unless otherwise
noted, any quotes in this presentation can be attributed to company management.
|
 This presentation contains financial information determined by methods other than
those prescribed by accounting principles generally accepted in the United
States ("GAAP”). Management uses these "non-GAAP" financial measures in its analysis of the Company's capital and
performance. Management believes that the ratio of tangible common equity to
tangible assets is important to investors who are interested in evaluating
the adequacy of the Company’s capital levels. You should not view these
disclosures as a substitute for results determined in accordance with GAAP, and they are not necessarily
comparable to non-GAAP measures used by other companies. The limitations
associated with these measures are the risks that persons might disagree as
to the appropriateness of items comprising these measures and that different companies might calculate these measures
differently. Information provided in the Appendix of this presentation reconciles
these non-GAAP measures with comparable measures calculated in
accordance with GAAP. Non-GAAP Financial Disclaimer
3 |
 Financial Highlights
At and for the three months ended March 31, 2012
Net income of $22.9 million, or $0.25 per diluted share
Continued improvement in many credit quality indicators including the
provision for credit losses, total NPLs and NPAs, net charge-offs, and
near-term past dues
Net interest margin remained relatively stable at 3.66%
Mortgage production increased to $395 million, and mortgage lending
contributed $15.1 million of non-interest revenue including a positive
MSR valuation adjustment of $3.7 million
Capital levels improved:
3/31/12
12/31/11
3/31/11
Equity/Assets
10.46%
9.72%
8.94%
TIER I Leverage Capital
9.85%
8.85%
8.01%
Total Capital
14.39% 13.03%
11.92%
4 |
 Provision for credit losses declined $9.3 million, or 48.1%, from the
previous quarter
NPLs decreased $37.0 million, or 11.5%, and NPAs declined $43.0 million,
or 8.7%, from the previous quarter
Nonaccrual loan formation remained relatively flat at $40.4 million,
compared to $39.5 million for the fourth quarter of 2011
54% of non-accrual loans were paying as agreed
Loans 30-89 days past due, still accruing, declined from $37.5 million as
of
12/31/11 to $29.0 million as of 3/31/12
OREO decreased $6.0 million, or 3.5%, from the previous quarter
Credit Quality Highlights
At and for the three months ended March 31, 2012
“Paying as Agreed”
includes loans < 30 days past due with payments occurring at least
quarterly 5 |
 6
Recent Operating Results
Dollars in millions, except per share data
NM –
Not meaningful
3/31/12
12/31/11
3/31/11
Net interest revenue
$105.6
$107.5
$109.4
(3.5)
%
Provision for credit losses
10.0
19.3
53.5
(81.3)
Noninterest revenue
72.4
65.3
68.3
5.9
Noninterest expense
135.7
135.9
130.0
4.4
Income (loss) before income taxes
32.3
17.7
(5.7)
NM
Income tax provision (benefit)
9.4
4.4
(5.2)
NM
Net income (loss)
$22.9
$13.3
($0.5)
NM
Net income (loss) per share: diluted
$0.25
$0.16
($0.01)
NM
Three Months Ended
Q1'12 vs.
Q1'11 |
 Noninterest Revenue
Dollars in thousands
NM –
Not meaningful
7
Q1 '12 vs.
3/31/12
12/31/11
3/31/11
Q1 '11
Mortgage origination and servicing
11,445
$
9,919
$
5,041
$
127.0
%
MSR valuation adjustment
3,697
(991)
2,540
45.6
Credit card, debit card and merchant fees
7,523
7,783
10,346
(27.3)
Service charges
15,116
17,412
15,368
(1.6)
Trust income
2,282
3,348
3,134
(27.2)
Security gains, net
74
18
17
NM
Insurance commissions
23,153
19,416
22,549
2.7
Other
9,070
8,430
9,316
(2.6)
Total noninterest revenue
72,360
$
65,335
$
68,311
$
5.9
%
Three Months Ended |
 NPLs
Dollars in millions
Net loans and leases as of March 31, 2012
8
NPLs as a Percent
Outstanding
NPLs
of Outstanding
Commercial and industrial
$1,441.7
$12.5
0.9
%
Real estate:
Consumer mortgages
1,938.0
52.2
2.7
Home equity
501.3
2.7
0.5
Agricultural
256.7
4.3
1.7
Commercial and industrial-owner occupied
1,287.5
37.1
2.9
Construction, acquisition and development
858.1
121.4
14.1
Commercial
1,742.0
46.8
2.7
Credit cards
100.5
3.1
3.0
All other
612.0
5.2
0.9
Total loans
$8,737.9
$285.2
3.3
% |
 Real
Estate Construction, Acquisition and Development Dollars in millions
Net loans and leases as of March 31, 2012
9
$0
$100
$200
$300
$400
$500
Multi
-Family
Construction
1-4 Family
Construction
Recreation & All
Other Loans
Commercial
Construction
Commercial A & D
Residential A & D
NPLs
NPLs as a Percent of
Outstanding
Multi-Family Construction
4.7
$
-
$
1-4 Family Construction
159.3
12.8
Recreation and All Other Loans
63.4
1.2
Commercial Construction
122.2
4.7
Commercial Acquisition and Development
191.8
26.4
Residential Acquisition and Development
316.8
76.3
Real Estate Construction, Acquisition
and Development
858.1
$
121.4
$
Outstanding
13.8
24.1
14.1%
0.0%
8.0
1.9
3.8 |
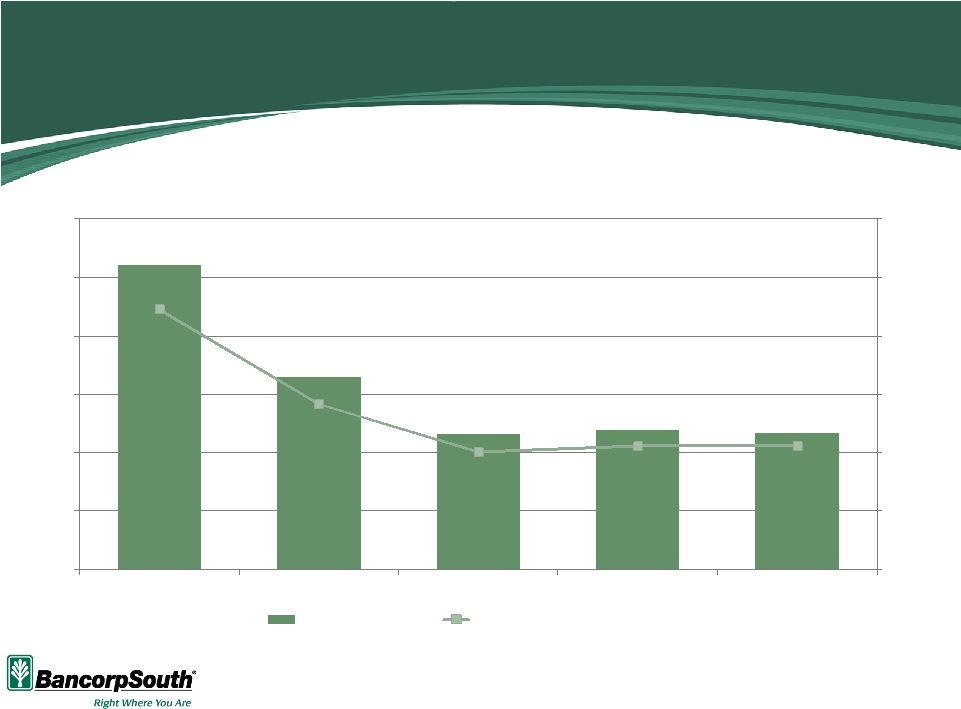
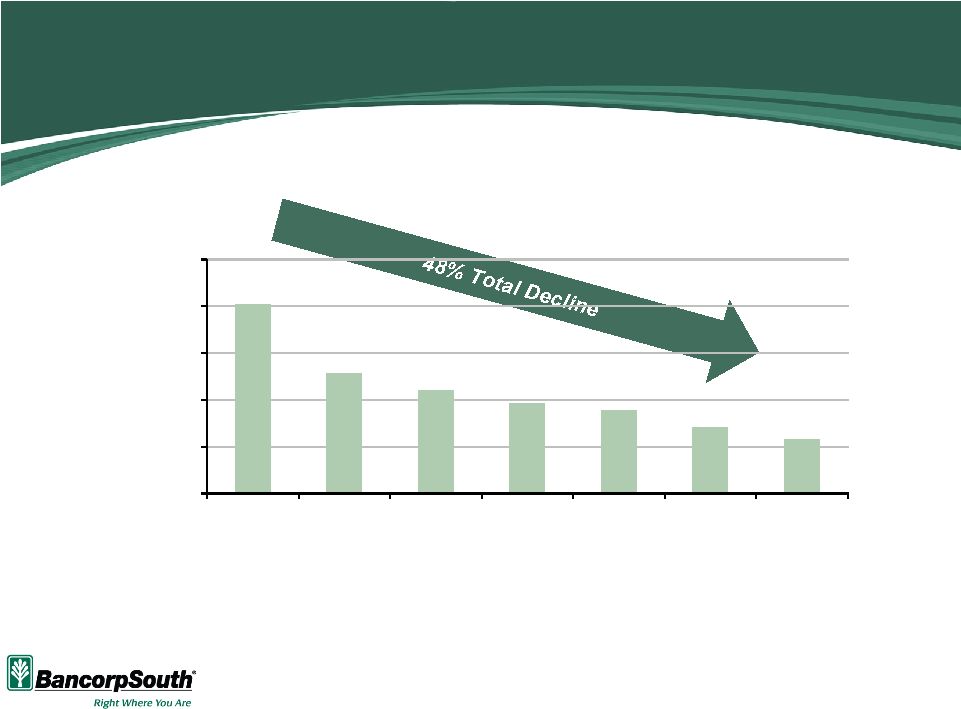 Residential Acquisition and Development
10
Dollars in millions
$606
$456
$420
$393
$377
$342
$317
$200
$300
$400
$500
$600
$700
12/31/09
12/31/10
3/31/11
6/30/11
9/30/11
12/31/11
3/31/12 |
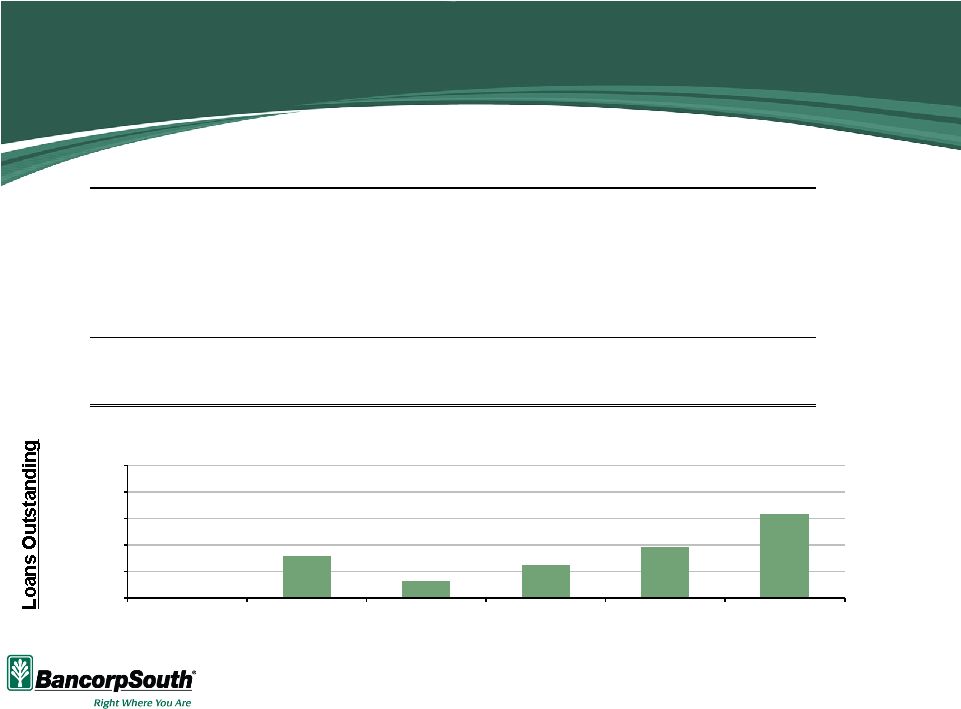
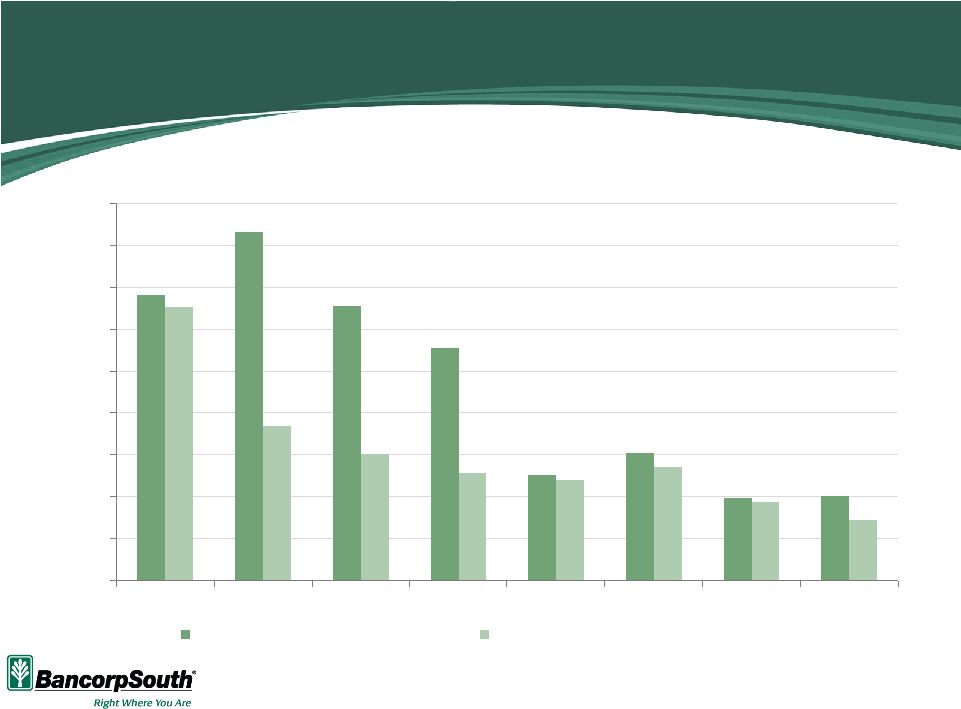 Newly
Identified Non-Accrual Loans Dollars in millions
Newly identified non-accrual loans based on the quarters ended for the dates
shown 11
$136
$166
$131
$111
$50
$61
$39
$40
$131
$74
$60
$52
$48
$54
$38
$29
$0
$20
$40
$60
$80
$100
$120
$140
$160
$180
6/30/10
9/30/10
12/31/10
3/31/11
6/30/11
9/30/11
12/31/11
3/31/12
Newly Identified Non-Accrual Loans
Loans 30-89 Days Past Due, Still Accruing |
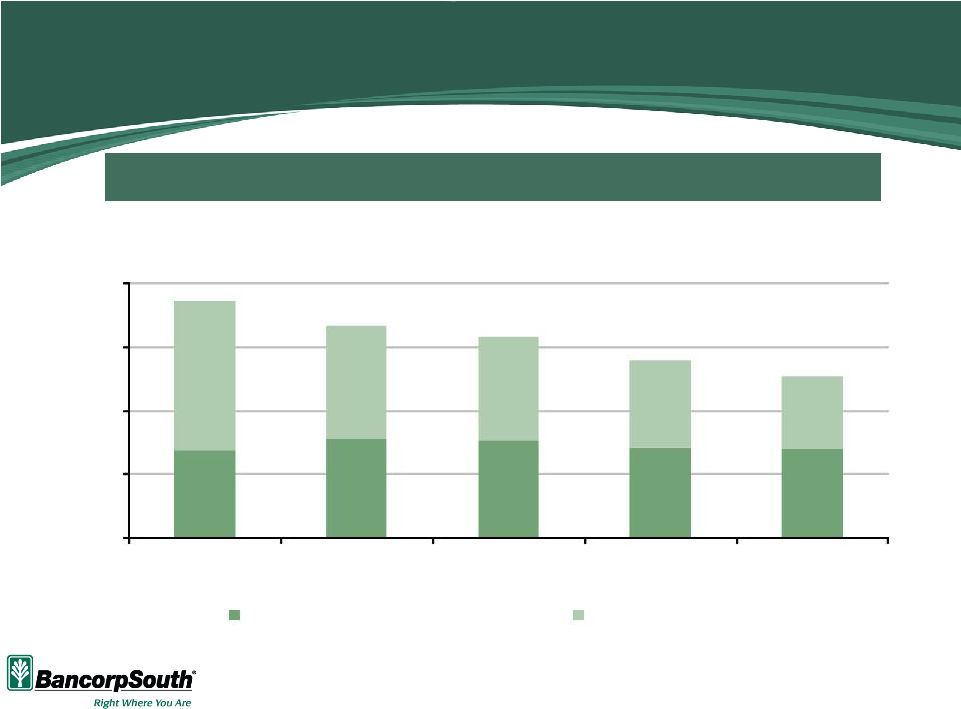 Non-Accrual Loans
Dollars in millions
“Paying as Agreed”
includes loans < 30 days past due with payments occurring at least
quarterly 54% of non-accrual loans were paying as agreed as of March 31,
2012 12
$0
$100
$200
$300
$400
3/31/11
6/30/11
9/30/11
12/31/11
3/31/12
Non-Accrual Lns Paying as Agreed
All Other Non-Accrual Lns |
 Dollars in millions
Net charge-offs based on the quarters ended for the dates shown
Net Charge-offs are Improving
% Avg. Loans
13
$52
$33
$23
$24
$23
0.0%
0.5%
1.0%
1.5%
2.0%
2.5%
3.0%
$0
$10
$20
$30
$40
$50
$60
3/31/11
6/30/11
9/30/11
12/31/11
3/31/12
Net Charge-Offs
Net Charge-offs / Average loans |
 14
Internal Initiatives
Integration of specialty lending lines of business into the general banking
organization structure
Corporate Banking
Small Business Lending
Equipment Leasing
Home Equity Lines of Credit
Geographic reorganization from 10 regions to 4 regions
Northeast –
Central and North MS, Tennessee
Southeast –
Mid and South MS, Alabama, Florida
Northwest –
Arkansas, Missouri
Southwest –
Texas, Louisiana |
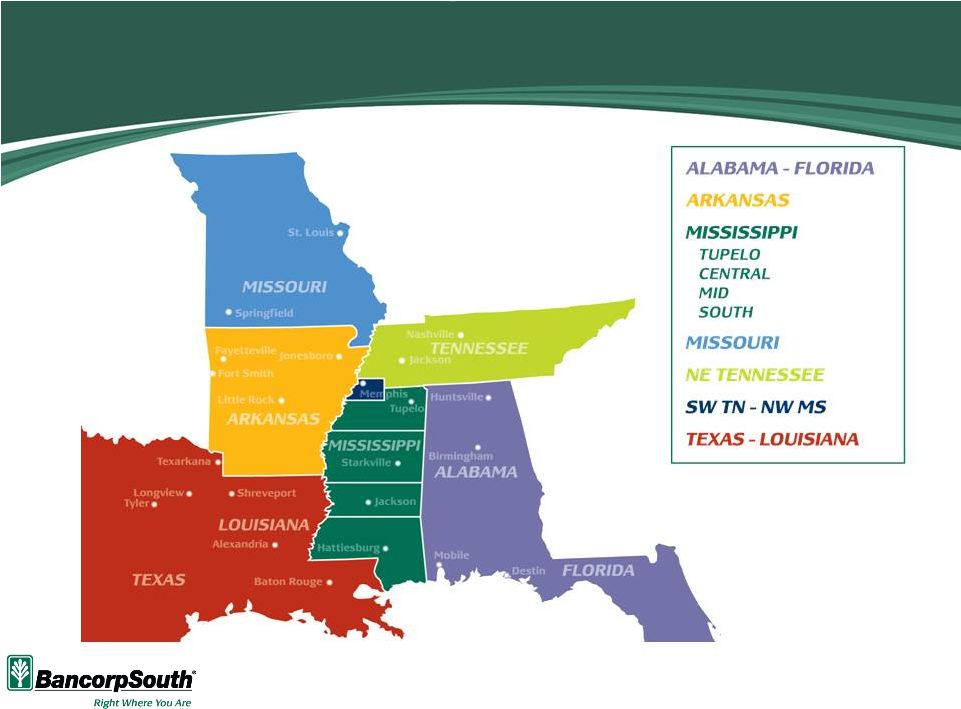 15
Previous Regional Structure |
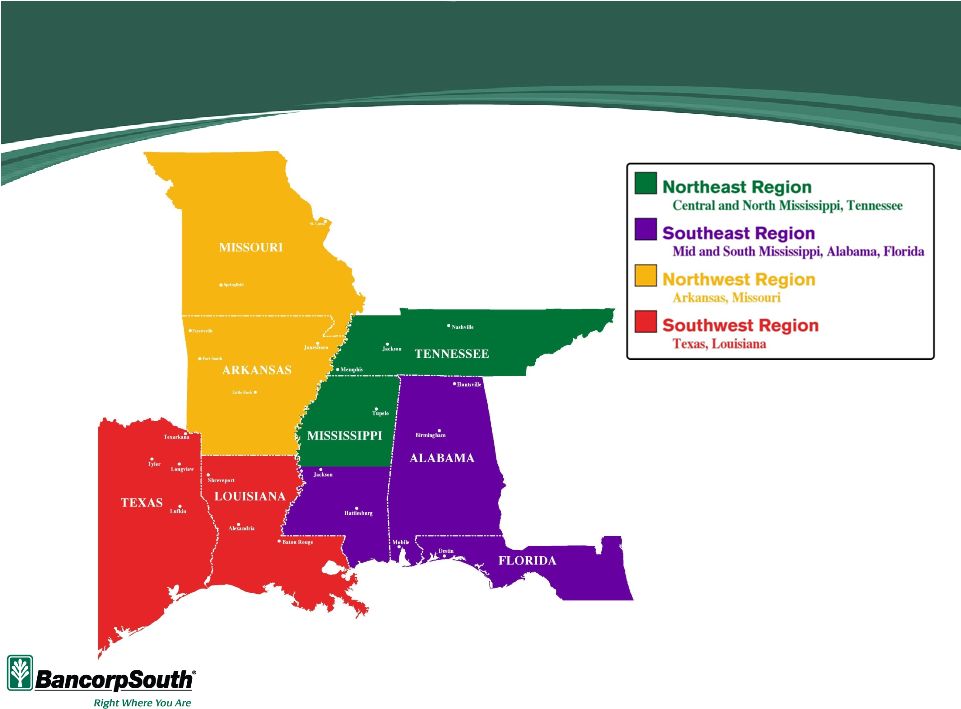 New
Regional Structure 16 |
 Appendix |
 18
Non-GAAP Financial Reconciliation
Tangible Common Equity / Tangible Assets (TCE/TA)
As of
As of
As of
3/31/2012
12/31/2011
3/31/2011
(Dollars In Thousands)
Common Equity --> A
$1,392,199
$1,262,912
$1,211,061
Assets --> B
13,307,572
12,995,851
13,547,238
Intangibles --> C
287,147
287,910
290,141
Tangible Common Equity --> D=A-C
1,105,052
975,002
920,920
Tangible Assets --> E=B-C
13,020,425
12,707,941
13,257,097
TCE/TA --> D/E
8.49%
7.67%
6.95% |