Attached files
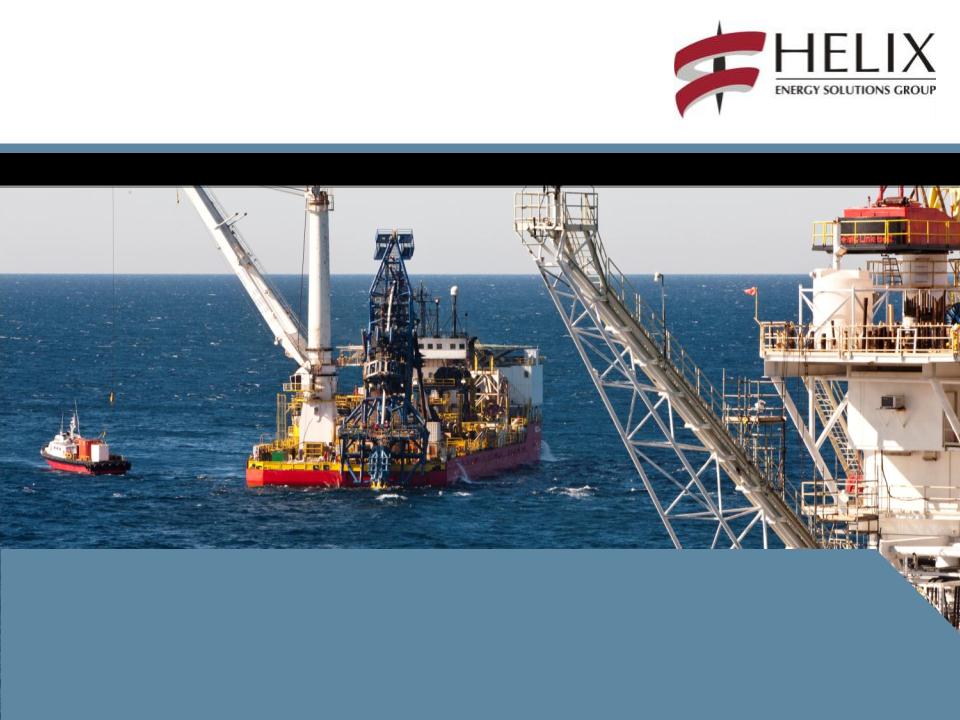
April 23, 2012
First Quarter 2012 Conference Call

2
Forward-Looking Statements
This presentation contains forward-looking statements within the meaning of Section 27A of the Securities Act of
1933 and Section 21E of the Securities Exchange Act of 1934. All such statements, other than statements of
historical fact, are “forward-looking statements” within the meaning of the Private Securities Litigation Reform Act of
1995, including, without limitation, any projections of financial items; projections of contracting services activity; future
production volumes, results of exploration, exploitation, development, acquisition and operations expenditures, and
prospective reserve levels of properties or wells; projections of utilization; any statements of the plans, strategies and
objectives of management for future operations; any statements concerning developments; and any statements of
assumptions underlying any of the foregoing. These statements involve certain assumptions we made based on our
experience and perception of historical trends, current conditions, expected future developments and other factors
we believe are reasonable and appropriate under the circumstances. The forward-looking statements are subject to
a number of known and unknown risks, uncertainties and other factors that could cause our actual results to differ
materially. The risks, uncertainties and assumptions referred to above include the performance of contracts by
suppliers, customers and partners; actions by governmental and regulatory authorities; operating hazards and
delays; employee management issues; local, national and worldwide economic conditions; uncertainties inherent in
the exploration for and development of oil and gas and in estimating reserves; complexities of global political and
economic developments; geologic risks, volatility of oil and gas prices and other risks described from time to time in
our reports filed with the Securities and Exchange Commission (“SEC”), including the Company’s most recently filed
Annual Report on Form 10-K and in the Company’s other filings with the SEC. Free copies of the reports can be
found at the SEC’s website, www.SEC.gov. You should not place undue reliance on these forward-looking
statements which speak only as of the date of this presentation and the associated press release. We assume no
obligation or duty and do not intend to update these forward-looking statements except as required by the securities
laws.
References to quantities of oil or gas include amounts we believe will ultimately be produced, and may include
“proved reserves” and quantities of oil or gas that are not yet classified as “proved reserves” under SEC definitions.
Statements of oil and gas reserves are estimates based on assumptions and may be imprecise. Investors are urged
to consider closely the disclosure regarding reserves in our most recently filed Annual Report on Form 10-K and any
subsequent Quarterly Reports on Form 10-Q.

3
Presentation Outline
• Executive Summary
Summary of Q1 2012 Results (pg. 4)
• Operational Highlights by Segment
Contracting Services (pg. 9)
Oil & Gas (pg. 15)
• Key Balance Sheet Metrics (pg. 18)
• 2012 Outlook (pg. 21)
• Non-GAAP Reconciliations (pg. 26)
• Questions & Answers

Executive
Summary
Summary
4

5
Executive Summary
($ in millions, except per share data)
(A) See non-GAAP reconciliations on slides 27-28.

6
Executive Summary
• Q1 2012 EPS of $0.62 per diluted share compared with $0.16 per diluted share in Q4 2011
o Included impact of approximately $17.1 million ($11.1 million, or $0.10 per share after tax)
related to early extinguishment of debt in the first quarter (senior unsecured notes and
convertible senior notes).
related to early extinguishment of debt in the first quarter (senior unsecured notes and
convertible senior notes).
• Contracting Services and Production Facilities
o Near full utilization (94%) of Subsea Construction vessels in the first quarter
o Lower utilization in Well Intervention due to regulatory dry dock of the Q4000 for most of
March, offset by strong contribution from Well Enhancer’s West Africa campaign
March, offset by strong contribution from Well Enhancer’s West Africa campaign
• Oil and Gas
o First quarter average production rate of 22.2 Mboe/d (71% oil)
o Production through April 20 averaged approximately 19.1 Mboe/d (~76% oil)
o Oil and gas production totaled 2.02 MMboe in Q1 2012 versus 2.24 MMboe in Q4 2011
§ Lower production attributed to the sale of our eight Main Pass properties (primarily
gas) in January 2012 and shut-in of Noonan gas wells at the Bushwood field
gas) in January 2012 and shut-in of Noonan gas wells at the Bushwood field

7
Executive Summary
• Oil and Gas (continued)
o Avg realized price for oil of $109.18 / Bbl ($110.75 / Bbl in Q4 2011), inclusive of hedges
o Avg realized price for gas of $5.82 / Mcfe ($6.16 / Mcfe in Q4 2011), inclusive of hedges
§ Gas price realizations benefited from sales of natural gas liquids
§ NGL production of 0.17 MMboe in Q1 2012 and 0.22 MMboe in Q4 2011
• Balance sheet
o Cash increased to $620 million at 3/31/2012 from $546 million at 12/31/2011
o Liquidity* at $1.1 billion at 3/31/2012
o Net debt decreased to $560 million at 3/31/2012 from $609 million at 12/31/2011
o See updated debt maturity profile on slide 20
§ Funded $100 million term loan in late March and used proceeds plus $100 million of
revolver borrowings to redeem $200 million of 9.5% senior unsecured notes
revolver borrowings to redeem $200 million of 9.5% senior unsecured notes
§ Completed a $200 million, 3.25% convertible senior notes offering in March (due 2032)
using $142 million of proceeds to repurchase the existing 3.25% convertible senior
notes (due 2025)
using $142 million of proceeds to repurchase the existing 3.25% convertible senior
notes (due 2025)
* Liquidity as we define it is equal to cash and cash equivalents ($620 million), plus available capacity under our revolving credit facility ($454 million).

8
Operational
Highlights
Highlights

9
($ in millions, except percentages)
(A) See non-GAAP reconciliation on slides 27-28. Amounts are prior to intercompany
eliminations.
eliminations.
(B) Before gross profit impact of $6.6 million asset impairment charges in Australia in Q4 2011.
Contracting Services
• 94% utilization in Subsea Construction
• Q4000 and Seawell enter regulatory dry
dock in March
dock in March
• Well Enhancer completed a very
successful West Africa campaign for
Exxon Mobil
successful West Africa campaign for
Exxon Mobil
• Caesar on accommodations project in
Mexico through end of August
Mexico through end of August
Express and Intrepid alongside at
Ingleside, Texas spool base
Ingleside, Texas spool base

10
($ in millions)
Earnings (Loss) of Equity Investments
11
Contracting Services - Well Ops
GOM
• Q4000 worked on Shell and Helix Oil and Gas projects in Q1
• 67% utilization in Q1
• Entered dry dock early March and scheduled to complete sea
trials last week of April
trials last week of April
• Full slate of backlog through 2013 and extending into 2014
North Sea
• Well Enhancer successfully completed first West African
project for Exxon Mobil, intervening in seven subsea wells in
65 days, returned to the UK on March 30th
project for Exxon Mobil, intervening in seven subsea wells in
65 days, returned to the UK on March 30th
• Seawell fully utilized on Talisman and Shell before departing
for dry dock late March
for dry dock late March
• Both vessels nearly fully booked for the rest of 2012, except
for planned Q3 dry dock of Well Enhancer
for planned Q3 dry dock of Well Enhancer
Asia Pacific
• ROC Oil cementing campaign completed in April
• Woodside offshore intervention campaign expected to
commence late April and continue to mid June
commence late April and continue to mid June
• Wellhead cutting system 100% utilized for Q1
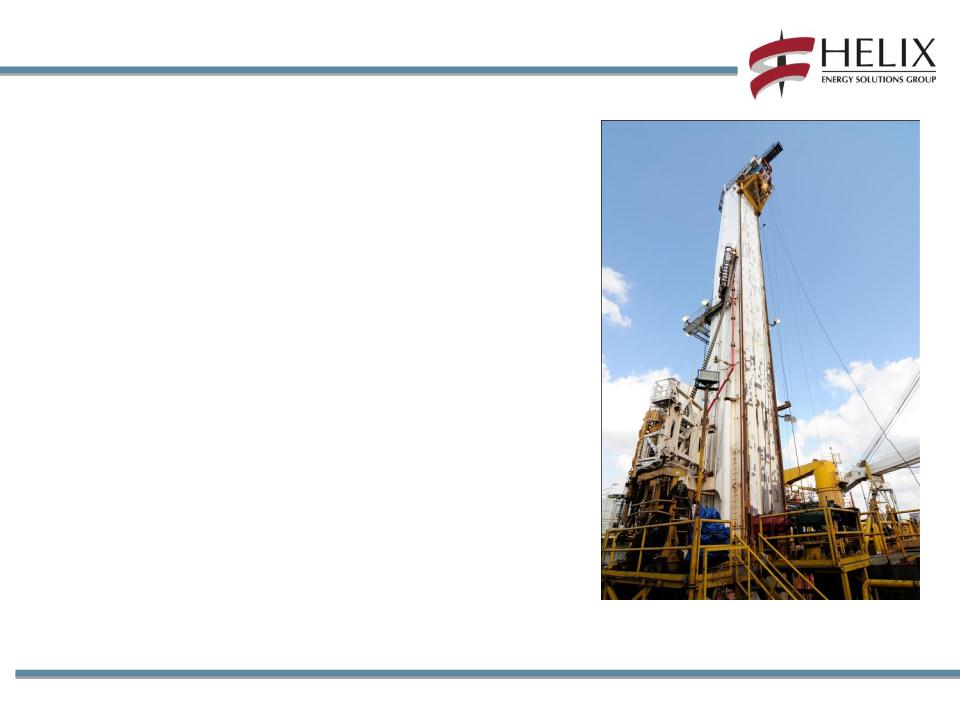
MODU DP3 Q4000 Multipurpose Tower
undergoing paintwork at dry dock
undergoing paintwork at dry dock

12
Contracting Services - Robotics
• 93% chartered vessel utilization and 68%
ROV utilization in Q1
ROV utilization in Q1
• Purchased two new 200hp work-class
ROV systems and deployed one in Q1
ROV systems and deployed one in Q1
• Completed five ROVDrill subsea coring
projects for renewable energy and oil and
gas clients
projects for renewable energy and oil and
gas clients
• Generated robust renewable energy and
oil and gas trenching revenues during Q1
utilizing the Island Pioneer and Deep
Cygnus vessel spreads (~$20 million in
related wind farm works)
oil and gas trenching revenues during Q1
utilizing the Island Pioneer and Deep
Cygnus vessel spreads (~$20 million in
related wind farm works)
• Grand Canyon and T1200 trencher
construction on target for delivery in Q2
2012, to initially be paired for renewable
energy market contracts
construction on target for delivery in Q2
2012, to initially be paired for renewable
energy market contracts
T1200 construction and testing near completion for Q2
2012 delivery aboard the Grand Canyon.
2012 delivery aboard the Grand Canyon.

13
Contracting Services - Subsea Construction
Contracting Services - Subsea Construction
• Near full utilization for Subsea Construction
vessels in Q1
vessels in Q1
• Express had 89% utilization in Q1 in the GOM
completing projects for Anadarko, ENI, Helix
Oil and Gas and Newfield
completing projects for Anadarko, ENI, Helix
Oil and Gas and Newfield
• Intrepid had 97% utilization in Q1 completing
projects offshore California, then transited
back to the GOM
projects offshore California, then transited
back to the GOM
• Caesar had 96% utilization in Q1 working in
Mexico’s Bay of Campeche on
accommodations project with work extended
thru August 31st
Mexico’s Bay of Campeche on
accommodations project with work extended
thru August 31st
• Express departed GOM for Mediterranean
project in early April
project in early April
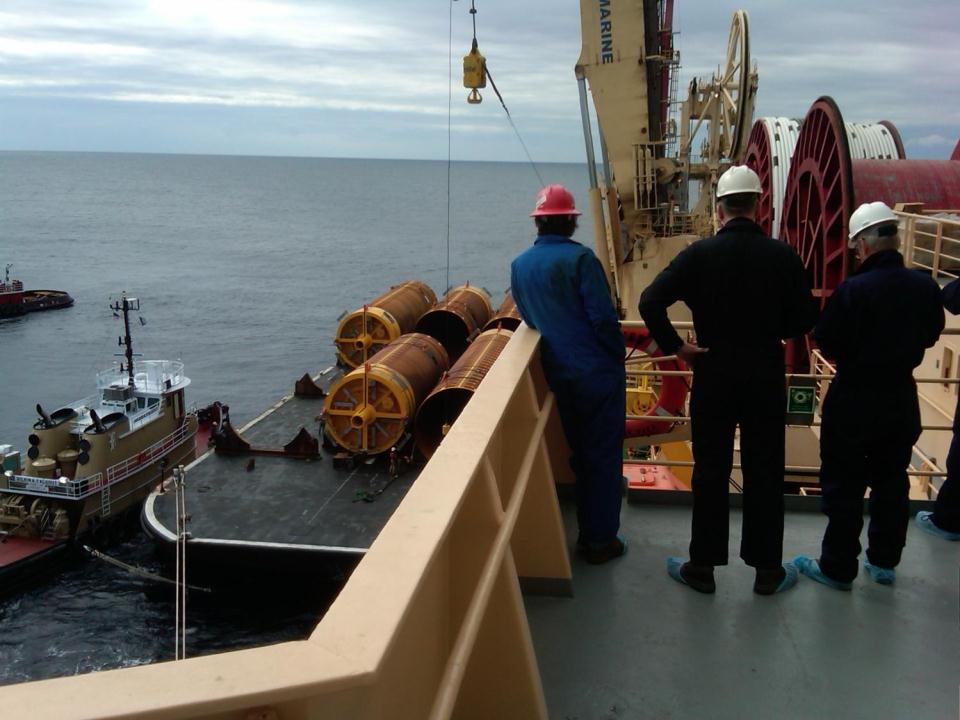
Express installing suction piles in the Walker Ridge
block of the Gulf of Mexico
block of the Gulf of Mexico

14
Contracting Services Utilization
• Express
• Caesar
• Island Pioneer (1)
• Deep Cygnus (1)
• Olympic Triton (1)
• (5) spot vessels (1)
• Well Enhancer
• Q4000
• 2 ROVDrill Units
• 3 Trenchers
(1) Chartered vessels.

15
(A) Fourth quarter 2011 impairments
primarily associated with the
reduction in carrying values of
certain oil and gas properties
due to year-end revisions in
reserves. Further, fourth quarter
2011 impacted by increased
asset retirement obligations for
U.S. and U.K. end of life
properties.
primarily associated with the
reduction in carrying values of
certain oil and gas properties
due to year-end revisions in
reserves. Further, fourth quarter
2011 impacted by increased
asset retirement obligations for
U.S. and U.K. end of life
properties.
(B) Including effect of settled hedges
and mark-to-market derivative
contracts. Natural gas per Mcf
prices inclusive of sales of NGLs.
and mark-to-market derivative
contracts. Natural gas per Mcf
prices inclusive of sales of NGLs.
Oil & Gas
16
Oil & Gas
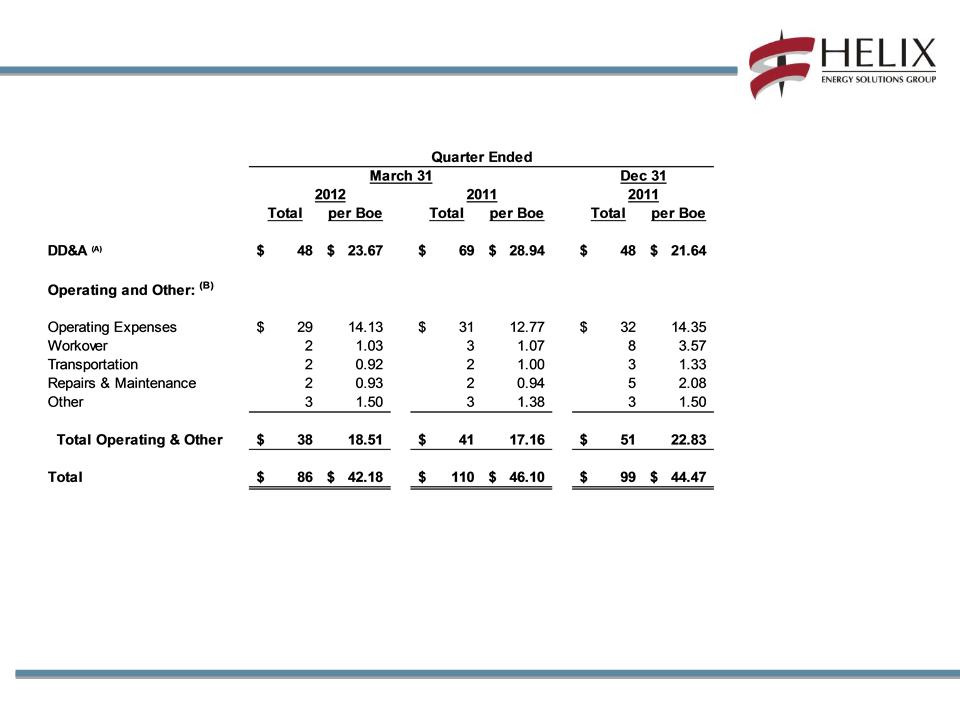
(A) Included accretion expense.
(B) Excluded exploration expense and net hurricane-related costs (reimbursements).
Operating Costs ($ in millions, except per Boe data)

17
Summary of Apr 2012 - Dec 2013 Hedging Positions *
*As of April 20, 2012

18
Key Balance
Sheet Metrics
Sheet Metrics

19
Debt and Liquidity Profile
Liquidity of approximately $1.1 billion at 3/31/2012
(A) Includes impact of unamortized debt discount under our convertible senior notes.
(B) Liquidity, as we define it, is equal to cash and cash equivalents ($620 million), plus available capacity
under our revolving credit facility ($454 million).
under our revolving credit facility ($454 million).

Debt Maturity Profile
20
• Total funded debt of $1.2 billion at end of Q1
2012 consisting of:
2012 consisting of:
o $358 million Convertible Senior Notes -
3.25%(A) ($319 million net of unamortized debt
discount)
3.25%(A) ($319 million net of unamortized debt
discount)
o $379 million Term Loans -
§ LIBOR + 3.50% on $279 million, and
§ LIBOR + 2.75% on $100 million
o $100 million Revolver borrowings -
§ LIBOR + 2.75%
§ $454 million of availability (including
~$46 million of LC’s in place as of Q1
2012)
~$46 million of LC’s in place as of Q1
2012)
o $275 million Senior Unsecured Notes - 9.5%
o $108 million MARAD Debt - 4.93%
§ Convertible Notes
§ Term Loans / Revolver
§ Senior Unsecured Notes
§ MARAD Debt
(A) $158 million stated maturity 2025. First put / call date in December 2012.
$200 million stated maturity 2032. First put / call date in March 2018.
21
2012 Outlook

22
2012 Outlook
|
Broad Metrics
|
2012 Outlook
(revised)
|
2012 Outlook
(original)
|
2011 Actual
|
|
Oil and Gas
Production |
7.5 MMboe
|
7.5 MMboe
|
8.7 MMboe
|
|
EBITDAX
|
> $600 million
|
~$600 million
|
$669 million
|
|
CAPEX
|
~$450 million
|
~$445 million
|
$229 million
|
|
Commodity Price
Deck |
2012 Outlook
(revised)
|
2012 Outlook
(original)
|
2011 Actual
|
|
|
Hedged
|
Oil
|
$109.00 / Bbl
|
$105.00 / Bbl
|
$100.91 / Bbl
|
|
Gas
|
$5.00 / Mcf
|
$4.50 / Mcf
|
$6.04 / Mcf
|
|

23
2012 Outlook
• Contracting Services
o Strong backlog for the Q4000, Well Enhancer and Seawell through 2013
§ Q4000 building backlog into 2014
o Intrepid completing repairs and working on LLOG and Nexen projects before entering dry dock
o Express transiting to work in the Mediterranean and North Sea in Q2 and Q3 of 2012 before
returning back to the Gulf of Mexico
returning back to the Gulf of Mexico
o Caesar deployed to Mexico’s Bay of Campeche for accommodations project through August
o Strong growth in global oilfield and renewable energy robotics markets
o Chartered two new-build vessels similar to the Grand Canyon vessel with deliveries expected
late 2013 and early 2014, respectively
late 2013 and early 2014, respectively
o Four vessels completing or scheduled for regulatory dry docks for remainder of 2012,
approximately $25 million impact on EBITDA
approximately $25 million impact on EBITDA
§ Q4000 - March / April
§ Seawell - April
§ Intrepid - Q2
§ Well Enhancer - Q3

24
2012 Outlook
• Oil and Gas
o Forecasted 2012 overall production of 7.5 MMboe, including Danny 2 (Bushwood field)
exploration well
exploration well
§ Danny 2 production commences Q4
− Well expected to spud late April
§ Wang (Phoenix field) expected to be drilled in Q3
− Rig and drilling permit secured
− Production now forecasted for early 2013
o Approximately 90% of 2012 revenues from oil and NGLs
o Anticipated 70% of production volume is oil and 65% of total production from deepwater
o 62% hedged for the year (74% of estimated PDP production)
o Assumes no significant storm disruptions
• Balance Sheet
o Funded new $100 million term loan in late March
o Terms and conditions same as revolving credit facility
o Proceeds from new term loan together with $100 million of revolver borrowings used to repay
$200 million in principal of 9.5% senior unsecured notes on March 30th
$200 million in principal of 9.5% senior unsecured notes on March 30th
o Completed new $200 million, 3.25% convertible senior notes offering (due 2032) using $142
million of the proceeds to repurchase existing 3.25% convertible senior notes (due 2025)
million of the proceeds to repurchase existing 3.25% convertible senior notes (due 2025)

25
2012 Outlook - Capex
• Capital Expenditures
o Contracting Services ($260 million)
§ Announced new build semi submersible intervention vessel (approximately $130 million of
capex in 2012)
capex in 2012)
− $60 million incurred in Q1
§ Regulatory dry docks for four vessels (two in process)
§ Continued incremental investment in robotics business, with a focus on adding trenching
spread capacity
spread capacity
o Oil and Gas ($190 million)
§ Focus capital investment on shelf oil developments/opportunistic workovers with relatively
fast payback
fast payback
§ Two major deepwater well projects planned this year
− Danny 2 - Q2 drill, Q3 completion
− Wang - Q3 drill, Q4 completion

26
Non-GAAP
Reconciliations
Reconciliations

27
Non-GAAP Reconciliations
Adjusted EBITDAX ($ in millions)
We calculate Adjusted EBITDAX as earnings before net interest expense, taxes, depreciation and amortization and exploration expense. These
non-GAAP measures are useful to investors and other internal and external users of our financial statements in evaluating our operating
performance because they are widely used by investors in our industry to measure a company’s operating performance without regard to items
which can vary substantially from company to company, and help investors meaningfully compare our results from period to period. Adjusted
EBITDAX should not be considered in isolation or as a substitute for, but instead is supplemental to, income from operations, net income or other
income data prepared in accordance with GAAP. Non-GAAP financial measures should be viewed in addition to, and not as an alternative to our
reported results prepared in accordance with GAAP. Users of this financial information should consider the types of events and transactions which
are excluded.

28
Revenue and Gross Profit As Reported ($ in millions)
Non-GAAP Reconciliations
Follow Helix ESG on Twitter:
www.twitter.com/Helix_ESG
Join the discussion on LinkedIn:
www.linkedin.com/company/helix
www.linkedin.com/company/helix