Attached files
| file | filename |
|---|---|
| EX-99.1 - EX-99.1 - JOHNSON CONTROLS INC | d338001dex991.htm |
| 8-K - 8-K - JOHNSON CONTROLS INC | d338001d8k.htm |
 April
20, 2012 Quarterly update
FY 2012 second quarter
Exhibit 99.2 |
 Agenda
Introduction
Glen Ponczak, Vice President, Global Investor Relations
Overview
Steve Roell, Chairman and Chief Executive Officer
Business results and financial review
Bruce McDonald, Executive Vice President and Chief Financial Officer
Q&A
FORWARD-LOOKING STATEMENT
Johnson Controls, Inc. has made forward-looking statements in this document
pertaining to its financial results for fiscal 2012 and beyond that are
based on preliminary data and are subject to risks and uncertainties. All
statements, other than statements of historical fact, are statements that
are,
or
could
be,
deemed
"forward-looking"
statements
and
include
terms
such
as
"outlook,"
"expectations,"
"estimates"
or
"forecasts."
For
those
statements, the Company cautions that numerous important factors, such as
automotive vehicle production levels, mix and schedules, energy and
commodity
prices,
the
strength
of
the
U.S.
or
other
economies,
currency
exchange
rates,
cancellation
of
or
changes
to
commercial
contracts,
changes in the levels or timing of investments in commercial buildings as well as
other factors discussed in Item 1A of Part I of the Company's most recent
Form 10-k filing (filed November 22, 2011) could affect the Company's actual results and could cause its actual consolidated results to
differ materially from those expressed in any forward-looking statement made
by, or on behalf of, the Company. 2 |
 2012
second quarter Macro environment
Mixed automotive industry production
–
Higher production (17%) in North America
–
Lower production (-
4%) in Europe but with some
strength in luxury segments
–
Slightly higher production (2%) in China
Unseasonably warm winter temperatures in
North America
–
Negative impact on North American aftermarket
battery demand
–
European weather normalized in Jan/Feb;
aftermarket battery demand recovered
3 |
 2012
second quarter Macro environment
Mixed non-residential buildings markets
–
Expansion continues in China (Tier 2 and 3 cities),
Middle East expansion
–
Some recovery in North America, though institutional
market likely slightly lower in 2H 2012
–
Architectural Billings Index—five months of expansion
after four years of decline
–
Pipeline of bidding activity higher than a year ago
–
Lower U.S. industry residential HVAC demand
•
2012 warm temperature negatively impacted
furnace sales
4 |
 2012
second quarter* Sales: $10.6 billion
vs. $10.1 billion in 2011
Segment income: $558 million
vs. $557 million in Q2 2011
Net income: $363 million
vs. $383 million in Q1 2011
EPS: $0.53 per diluted share
vs. $0.56 in Q1 2011
5
Results are consistent
with January 19, 2012
financial guidance |
 FY
2012 Second half vs. first half
Factors why 2012 second half results are expected to be better than the first
half Power Solutions
–
Pricing actions
–
Benefits of vertical integration
–
Reduction in battery imports to serve Chinese customers
Automotive Experience
–
Higher North American production rate
–
2H 2011 results negatively impacted by Japanese earthquake / tsunami
–
Seasonality (2H more profitable than 1H)
Building Efficiency
–
Positive impact from SG&A cost containment / reductions
–
Pricing actions
–
Seasonality (2H more profitable than 1H)
–
Improved performance in Service business
6 |
 Our
mid- to long-term strategies and outlook are intact
Strong market position in SLI batteries;
ability to drive higher margins through
vertical integration
Investments in AGM battery technology
to support customer demand for start-
stop vehicles
Emerging market leadership in all three
businesses
Higher automotive margins via seating
metals strategy and core product
portfolio / standardization
Building Efficiency market share gains
through our ability to help customers
improve energy efficiency and reduce
greenhouse gas footprint
7 |
 2012
second quarter Automotive Experience
2012
2011
Net sales
$5.6B
$5.2B
7%
Total sales up 4%, excluding acquisitions and currency
12% increase in North America vs. 17% higher production
Europe up 8% (excluding currency) vs. lower industry
production; Asia +6%
China sales (mostly non-consolidated): up 5% to $1.0 billion Segment income*
$236M
$247M
(4%)
Higher production volumes
Impact of 2011 acquisitions
Higher Asia profitability
Costs associated with launch difficulties trending
sequentially (vs. Q1 2012) lower
8
Return on sales by
geography*
N. America: 5%
Europe: 1%
Asia: 13%
New 3-D multi-layer cluster
introduced at the 2012
Consumer Electronics Show
*Excludes non-recurring items |
 2012
second quarter Building Efficiency
2012
2011
Net sales
$3.6B
$3.5B
1%
Higher revenues in Asia, North America Systems, GWS
–
Asia up 10%
–
North America Systems and Global Workplace Solutions up 6%
North America Service down 4% due to discretionary
service and maintenance deferrals
Europe, Latin America and residential HVAC lower
Segment income*
$127M
$132M
(4%)
Margin improvement in North America Systems & Service
and Asia
–
Lower in Europe, Latin America and residential HVAC
Accelerating SG&A cost reduction initiatives
9
Commercial backlog
(at March 31, 2012)
Record $5.3B, up 3%
*Excludes non-recurring items |
 2012
second quarter Power Solutions
2012
2011
Net sales
$1.4B
$1.4B
1%
Shipments: OE up 6%; aftermarket down 1%
Favorable product mix
Segment income*
$195M
$178M 10%
Increased vertical integration
Improved product mix
Cost of importing batteries to China
Hybrid battery joint venture consolidation in 2012
10
*Excludes non-recurring items
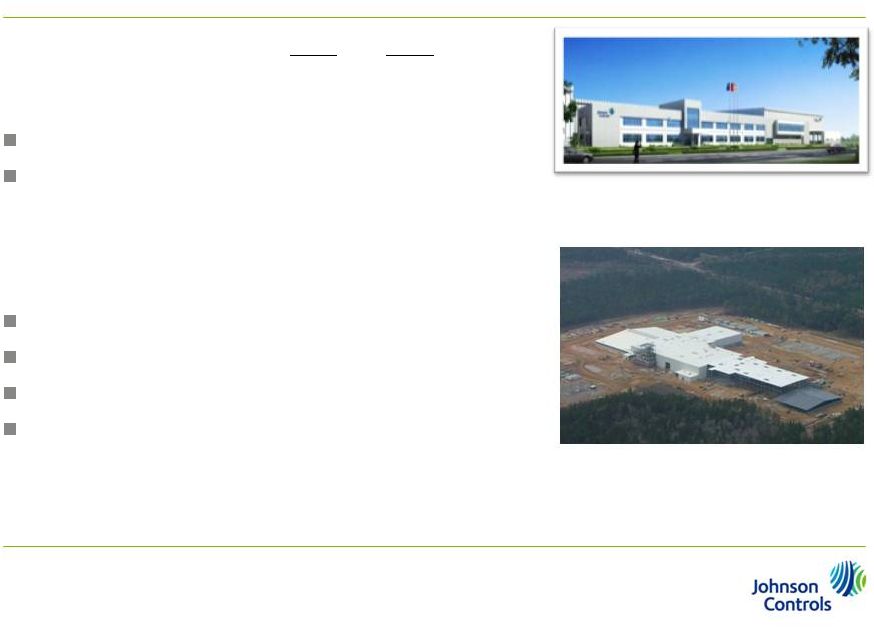
Florence, S.C. recycling facility
nearing construction completion
Changxing, China Facility |
 (in millions)
2012*
(excluding items)
2011*
(excluding items)
%
change
2012
(reported)
2011
(reported)
Sales
$10,565
$10,144
4%
$10,565
$10,144
Gross profit
% of sales
1,549
14.7%
1,474
14.5%
5%
1,549
14.7%
1,474
14.5%
SG&A expenses
1,070
978
9%
1,069
1,014
Equity income
79
61
30%
79
61
Segment income
$558
$557
-
$559
$521
5.3%
5.5%
5.3%
5.1%
Second quarter 2012
Financial highlights
11
FX –
Euro to U.S. dollar average exchange rate at $1.31 in Q2 2012 vs. $1.37 in
2011 Sales –
Excluding FX, sales up 6%
Gross profit –
Higher volumes and product mix
SG&A
–
Impact
from
2011
acquisitions
and
investments
in
innovation
and
emerging
markets
Equity income
–
Consolidation of hybrid business in 2012
* 2012 excludes a net gain related to the divestitures of two businesses of $35
million offset by a write-down of an investment of $14 million and
restructuring charges of $20 million; 2011 excludes acquisition related costs of $36 million |
 Second
quarter 2012 Financial highlights
Financing
charges-net
–
Higher
debt
levels
Income
tax
provision
–
Underlying
2012
tax
rate
of
19%,
consistent
with
2011
Non-controlling
interests
–
Improved
profitability
in
consolidated
Power
Solutions
JVs
12
(in millions, except earnings per share)
2012*
(excluding
items)
2011*
(excluding
items)
2012
(reported)
2011
(reported)
Segment income
$558
$557
$559
$521
Financing charges -
net
63
46
63
46
Income before taxes
495
511
496
475
Income tax provision
94
97
94
90
Net income
401
414
402
385
Income attributable to non-controlling interests
38
31
38
31
Net income attributable to JCI
$363
$383
$364
$354
Diluted earnings per share
$0.53
$0.56
$0.53
$0.51
* 2012 excludes a net gain related to the divestitures of two businesses of $35
million offset by a write-down of an investment of $14 million and
restructuring charges of $20 million; 2011 excludes net acquisition related costs of $29 million |
 2012
second quarter Balance sheet
13
Cash provided by operations increased $207
million from Q2 2011
Increased capital spending to $448 million,
$173 million higher than Q2 2011
Continue to focus on improvements in trade
working capital
Net debt / total capitalization 34%
2012 outlook
Comfortable with current full–year
sell-side consensus
Q3 earnings up approximately 20% y/y
Q4 earnings up approximately 25% y/y |