Attached files
| file | filename |
|---|---|
| 8-K - REPUBLIC BANCORP, INC. 8-K - REPUBLIC BANCORP INC /KY/ | a50244160.htm |
EXHIBIT 99.1
Annual Meeting of Shareholders Annual Meeting of Shareholders Thursday, April 19, 2012 Thursday, April 19, 2012
Safe Harbor During the course of this presentation, we will be providing you with a discussion of some of the factors we currently anticipate may influence the future results of Republic Bancorp, Inc. (“Republic” or the “Company”), as well as certain financial projections. We want to emphasize that these forward‐looking statements involve judgment, and that individual judgments may vary. Moreover, these statements are based on limited information available to us now, which is subject to change. Actual results may differ substantially from what we say today and no one should assume later that the comments we provide today are still valid. They speak only as of today. Specific risk factors that could change causing our projections not to be achieved are discussed in the “Risk Factors” section of our Form 10‐K filed with the Securities and Exchange Commission (“SEC”) on March 7, 2012, and other reports filed with the SEC from time to time. 2

Steve Trager Chairman and Chief Executive Officer 3

Highlights Year ended December 31, 2011 4
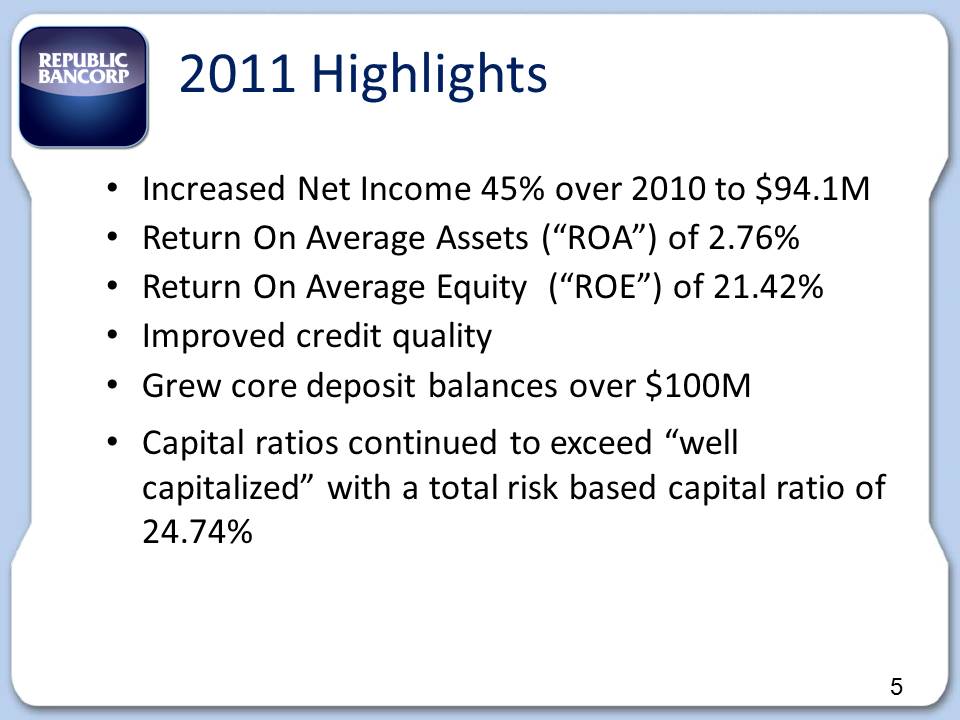
2011 Highlights Increased Net Income 45% over 2010 to $94.1M Return On Average Assets (“ROA”) of 2.76% Return On Average Equity (“ROE”) of 21.42% Improved credit quality Grew core deposit balances over $100M Capital ratios continued to exceed “well capitalized” with a total risk based capital ratio of 24.74% 5
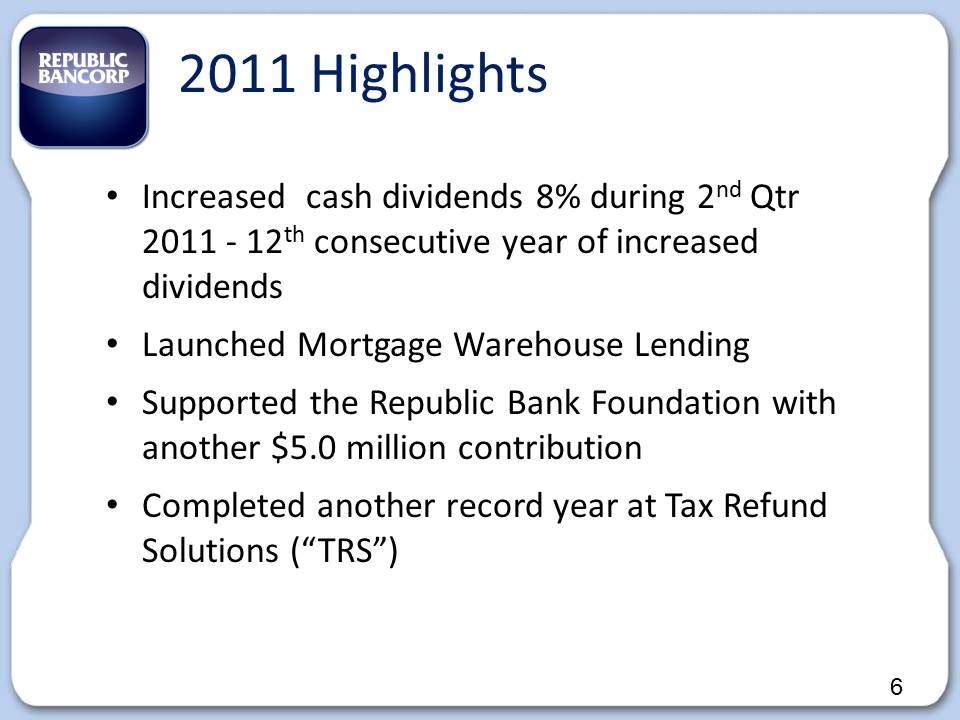
2011 Highlights Increased cash dividends 8% during 2nd Qtr 2011 ‐ 12th consecutive year of increased dividends Launched Mortgage Warehouse Lending Supported the Republic Bank Foundation with another $5.0 million contribution Completed another record year at Tax Refund Solutions (“TRS”) 6
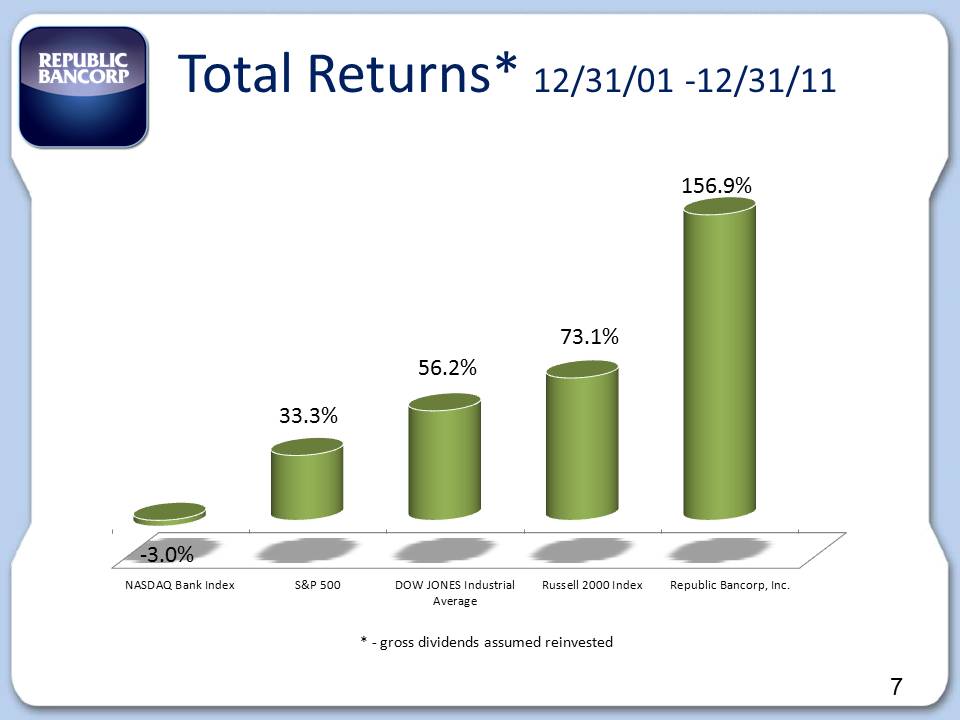
Total Returns* 12/31/01 ‐12/31/11 NASDAQ Bank Index S&P 500 DOW JONES Industrial Average Russell 2000 Index Republic Bancorp, Inc. ‐3.0% 33.3% 56.2% 73.1% 156.9% 7 * ‐ gross dividends assumed reinvested 7
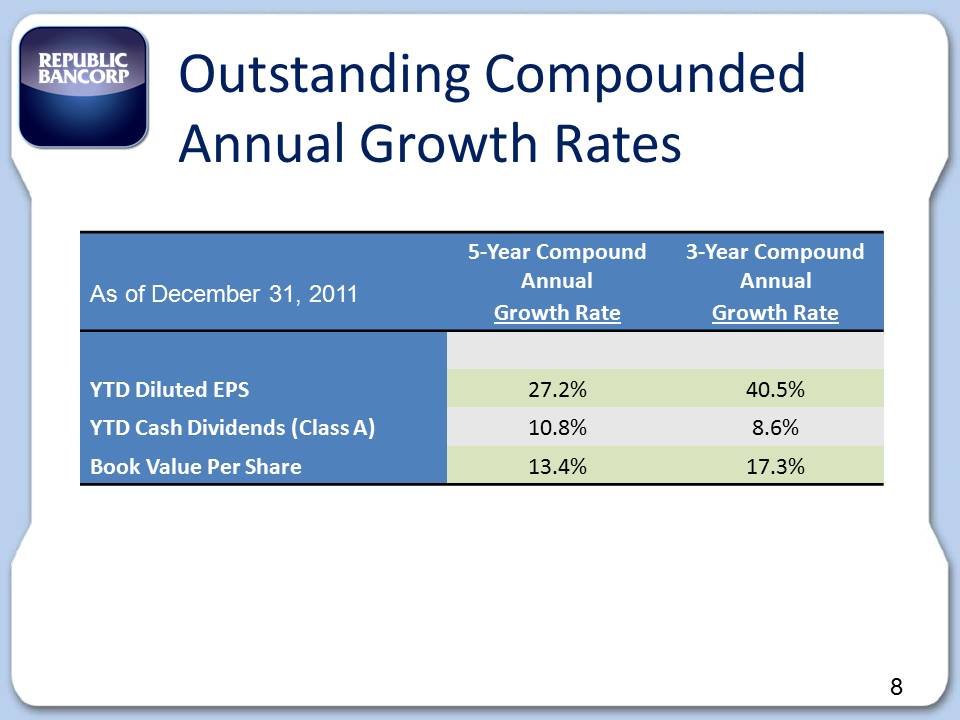
Outstanding Compounded Annual Growth Rates As of December 31, 2011 5‐Year Compound Annual Growth Rate 3‐Year Compound Annual Growth Rate YTD Diluted EPS 27.2% 40.5% YTD Cash Dividends (Class A) 10.8% 8.6% Book Value Per Share 13.4% 17.3% 8
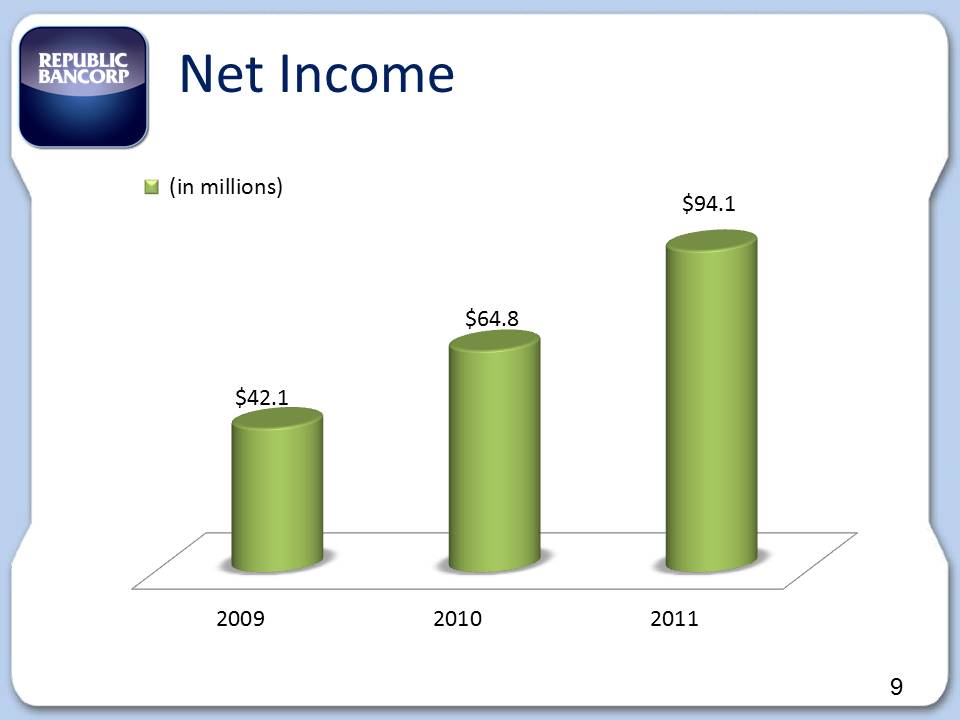
Net Income 2009 2010 2011 $42.1 $64.8 $94.1 (in millions) 9
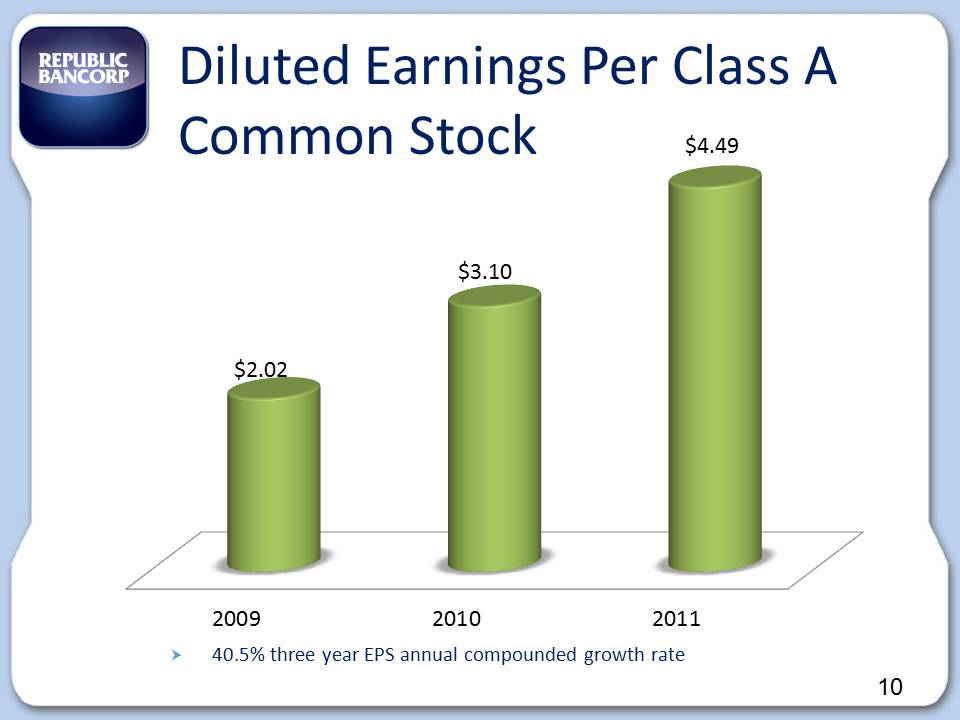
Diluted Earnings Per Class A Common Stock 2009 2010 2011 $2.02 $3.10 $4.49 40.5% three year EPS annual compounded growth rate 10

Balance Sheet 11
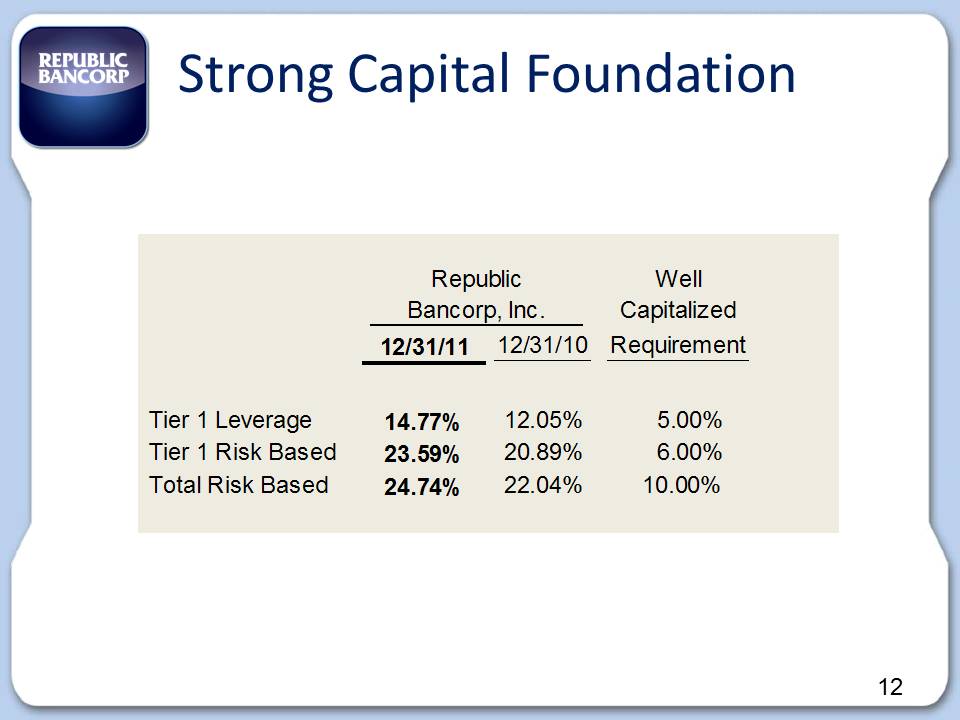
Strong Capital Foundation Republic Well Bancorp, Inc. Capitalized 12/31/11 12/31/10 Requirement Tier 1 Leverage 14.77% 12.05% 5.00% Tier 1 Risk Based 23.59% 20.89% 6.00% Total Risk Based 24.74% 22.04% 10.00% 12
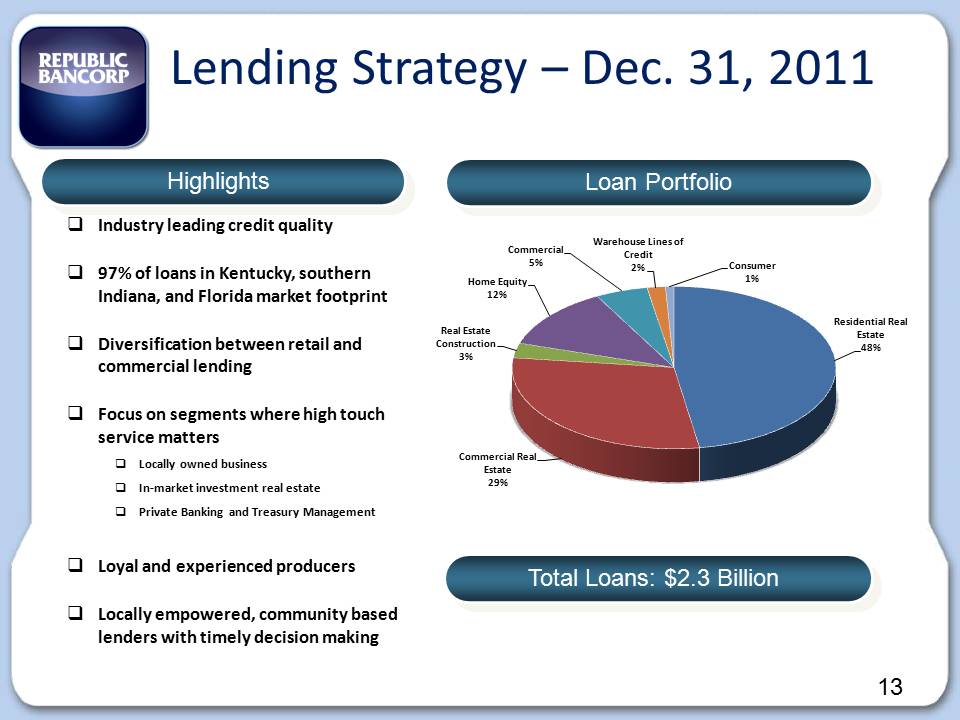
13 Residential Real Estate 48% Commercial Real Estate 29% Real Estate Construction 3% Home Equity 12% Commercial 5% Warehouse Lines of Credit 2% Consumer 1% Highlights Loan Portfolio Total Loans: $2.3 Billion Industry leading credit quality 97% of loans in Kentucky, southern Indiana, and Florida market footprint Diversification between retail and commercial lending Focus on segments where high touch service matters Locally owned business In‐market investment real estate Private Banking and Treasury Management Loyal and experienced producers Locally empowered, community based lenders with timely decision making Lending Strategy – Dec. 31, 2011 13
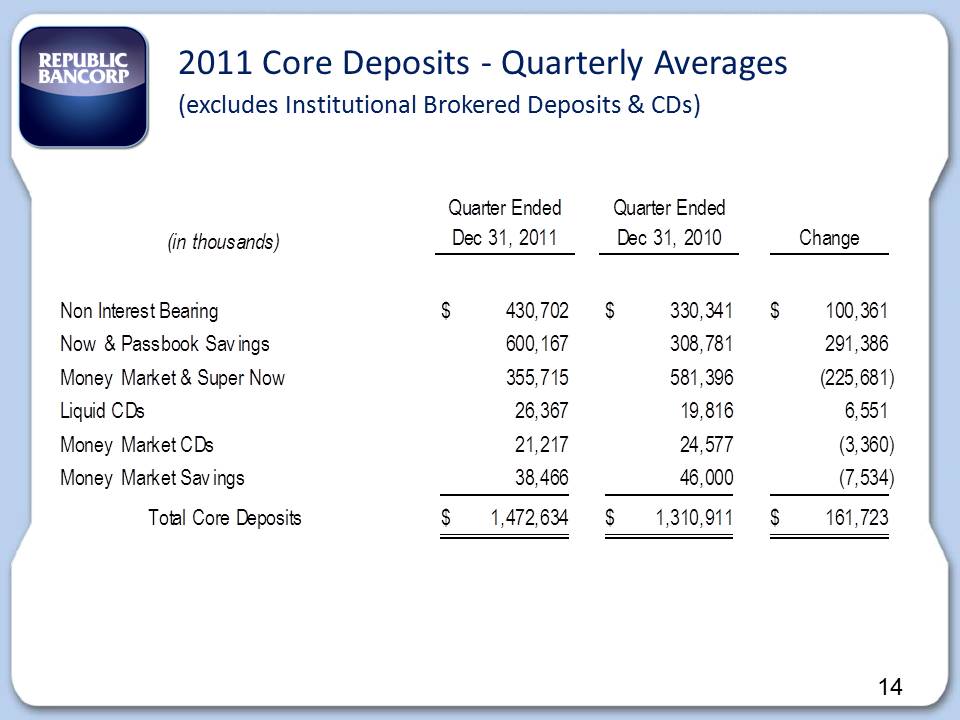
Quarter Ended Quarter Ended (in thousands) Dec 31, 2011 Dec 31, 2010 Change Non Interest Bearing $ 430,702 $ 330,341 $ 1 00,361 Now & Passbook Sav ings 600,167 308,781 291,386 Money Market & Super Now 355,715 581,396 (225,681) Liquid CDs 26,367 19,816 6,551 Money Market CDs 21,217 2 4,577 (3,360) Money Market Sav ings 3 8,466 46,000 ( 7,534) Total Core Deposits $ 1 ,472,634 $ 1 ,310,911 $ 1 61,723 2011 Core Deposits ‐ Quarterly Averages (excludes Institutional Brokered Deposits & CDs) 14
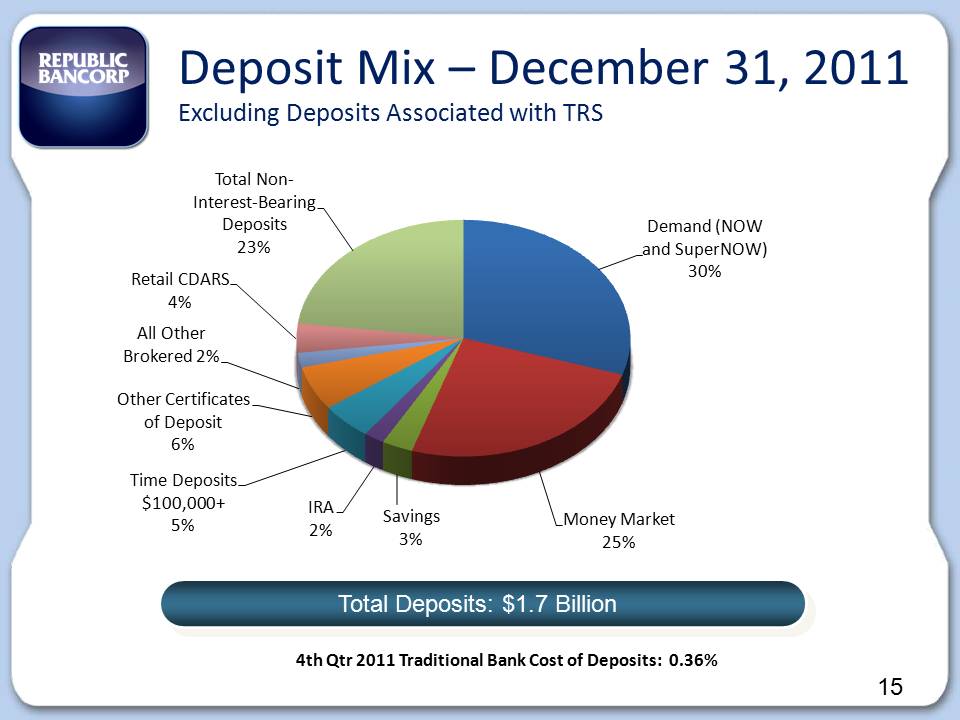
4th Qtr 2011 Traditional Bank Cost of Deposits: 0.36% Deposit Mix – December 31, 2011 Excluding Deposits Associated with TRS Total Deposits: $1.7 Billion Demand (NOW and SuperNOW) 30% Money Market 25% Savings 3% IRA 2% Time Deposits $100,000+ 5% Other Certificates of Deposit 6% All Other Brokered 2% Retail CDARS 4% Total Non‐ Interest‐Bearing Deposits 23% 15
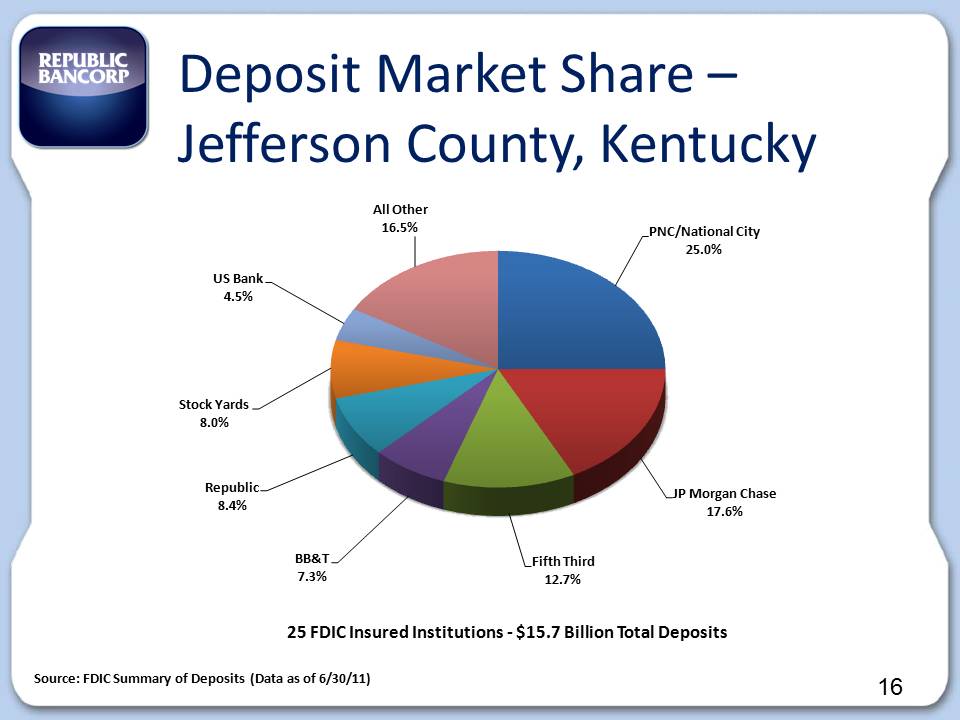
16 Deposit Market Share – Jefferson County, Kentucky Source: FDIC Summary of Deposits (Data as of 6/30/11) 25 FDIC Insured Institutions ‐ $15.7 Billion Total Deposits PNC/National City 25.0% JP Morgan Chase 17.6% Fifth Third 12.7% BB&T 7.3% Republic 8.4% Stock Yards 8.0% US Bank 4.5% All Other 16.5% 16

Industry Strong Credit Quality 17
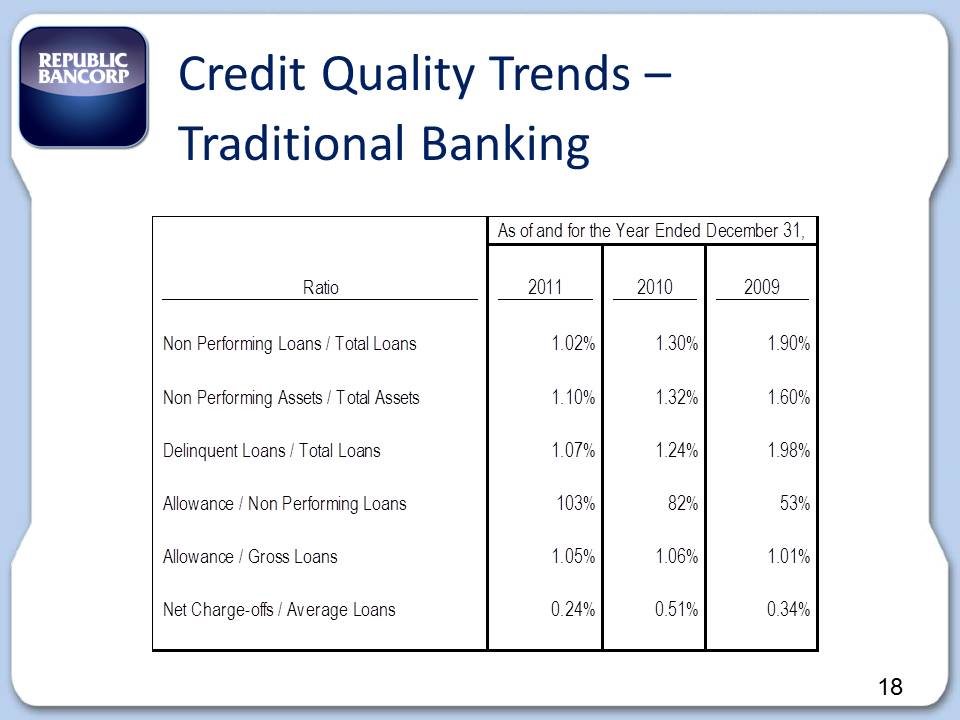
Credit Quality Trends – Traditional Banking As of and for the Year Ended December 31, Ratio 2011 2010 2009 Non Performing Loans / Total Loans 1.02% 1.30% 1.90% Non Performing Assets / Total Assets 1.10% 1.32% 1.60% Delinquent Loans / Total Loans 1.07% 1.24% 1.98% Allowance / Non Performing Loans 103% 82% 53% Allowance / Gross Loans 1.05% 1.06% 1.01% Net Charge-offs / Average Loans 0.24% 0.51% 0.34% 18
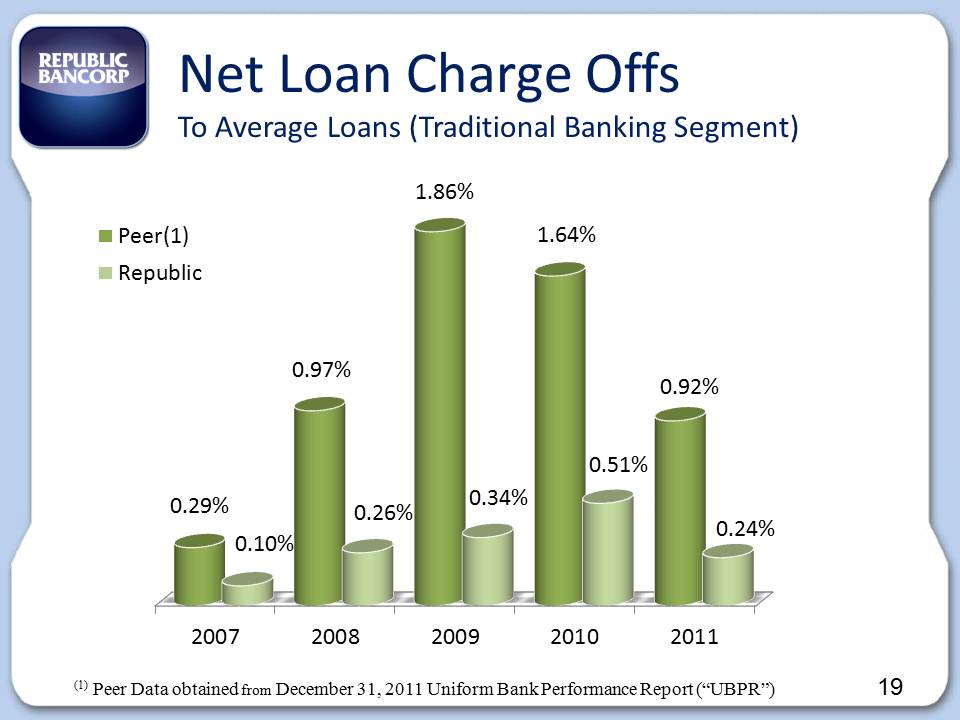
Net Loan Charge Offs To Average Loans (Traditional Banking Segment) 2007 2008 2009 2010 2011 0.29% 0.97% 1.86% 1.64% 0.92% 0.10% 0.26% 0.34% 0.51% 0.24% Peer(1) Republic (1) Peer Data obtained from December 31, 2011 Uniform Bank Performance Report (“UBPR”) 19 12/31/2007 12/31/2008 12/31/2009 12/31/2010 12/31/2011 19
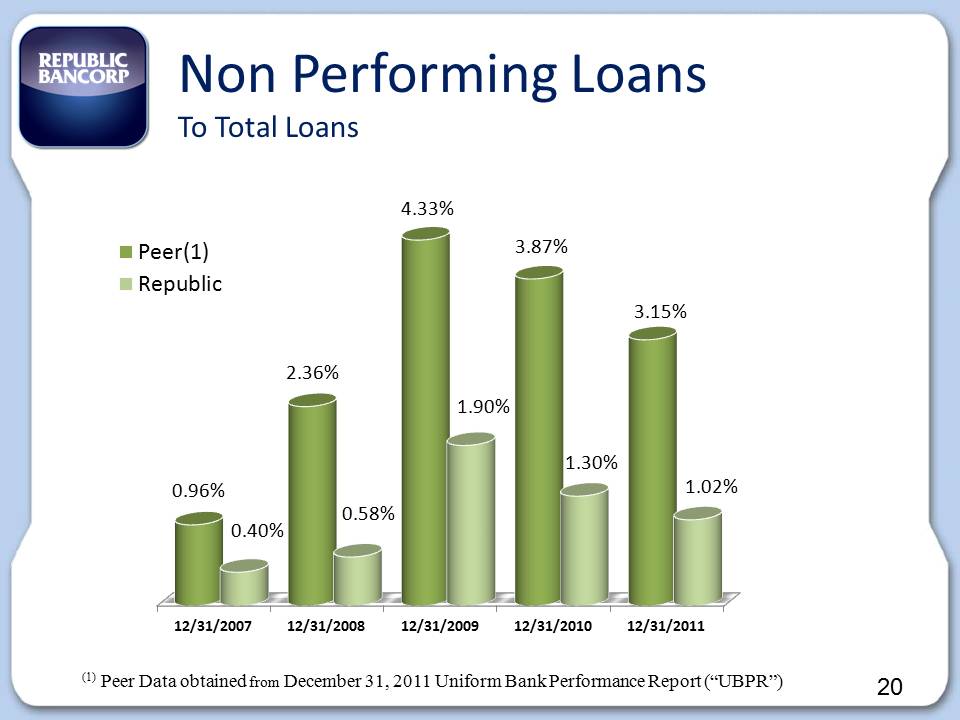
0.96% 2.36% 4.33% 3.87% 3.15% 0.40% 0.58% 1.90% 1.30% 1.02% Peer(1) Republic Non Performing Loans To Total Loans (1) Peer Data obtained from December 31, 2011 Uniform Bank Performance Report (“UBPR”) 20
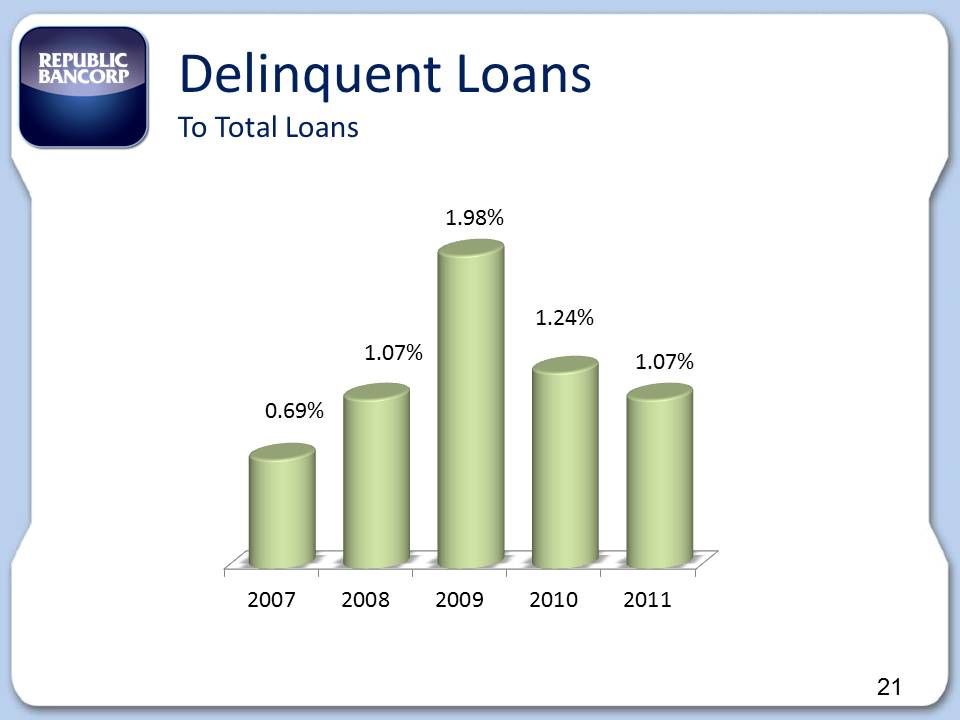
Delinquent Loans To Total Loans 2007 2008 2009 2010 2011 0.69% 1.07% 1.98% 1.24% 1.07% 21
Results of Operations
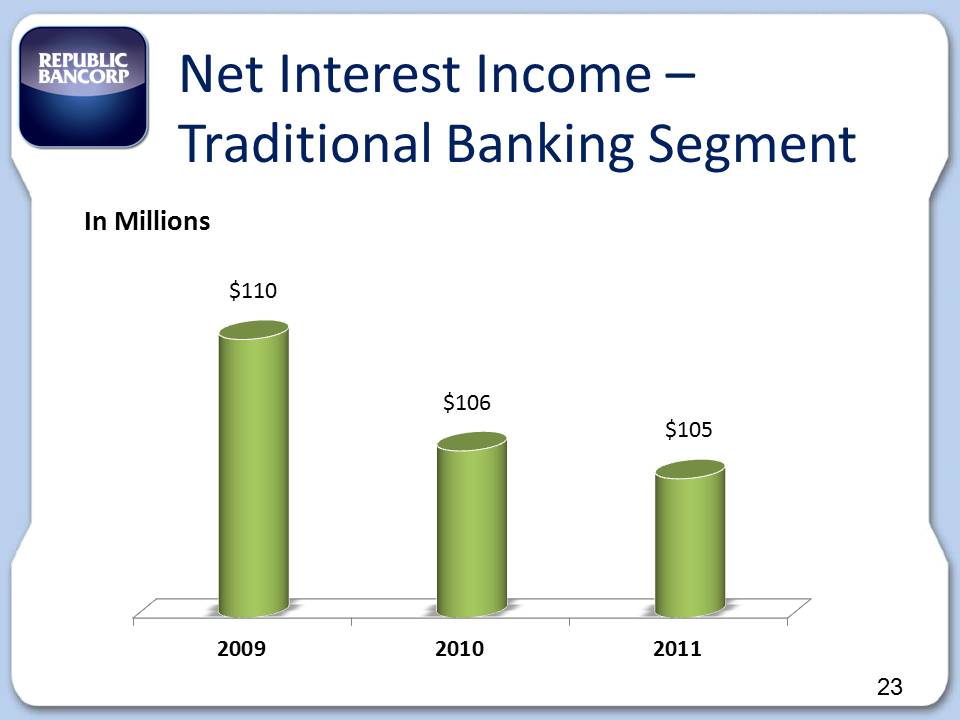
Net Interest Income – Traditional Banking Segment 2009 2010 2011 $110 $106 $105 In Millions 23
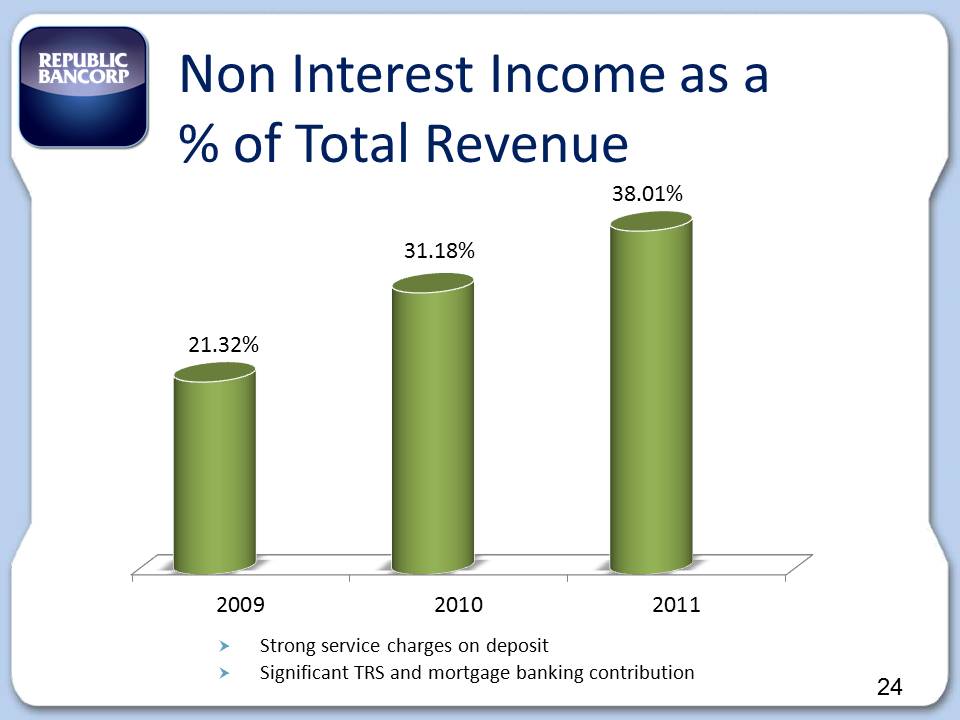
Non Interest Income as a % of Total Revenue 2009 2010 2011 21.32% 31.18% 38.01% Strong service charges on deposit Significant TRS and mortgage banking contribution 24
Highlights First Quarter 2012 25
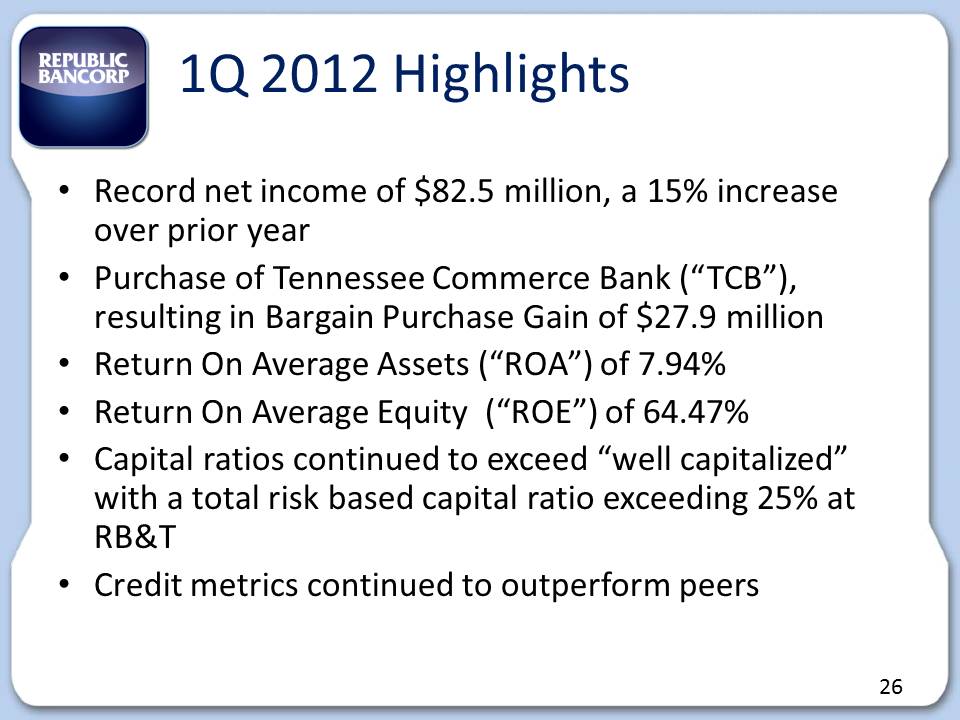
1Q 2012 Highlights Record net income of $82.5 million, a 15% increase over prior year Purchase of Tennessee Commerce Bank (“TCB”), resulting in Bargain Purchase Gain of $27.9 million Return On Average Assets (“ROA”) of 7.94% Return On Average Equity (“ROE”) of 64.47% Capital ratios continued to exceed “well capitalized” with a total risk based capital ratio exceeding 25% at RB&T Credit metrics continued to outperform peers 26
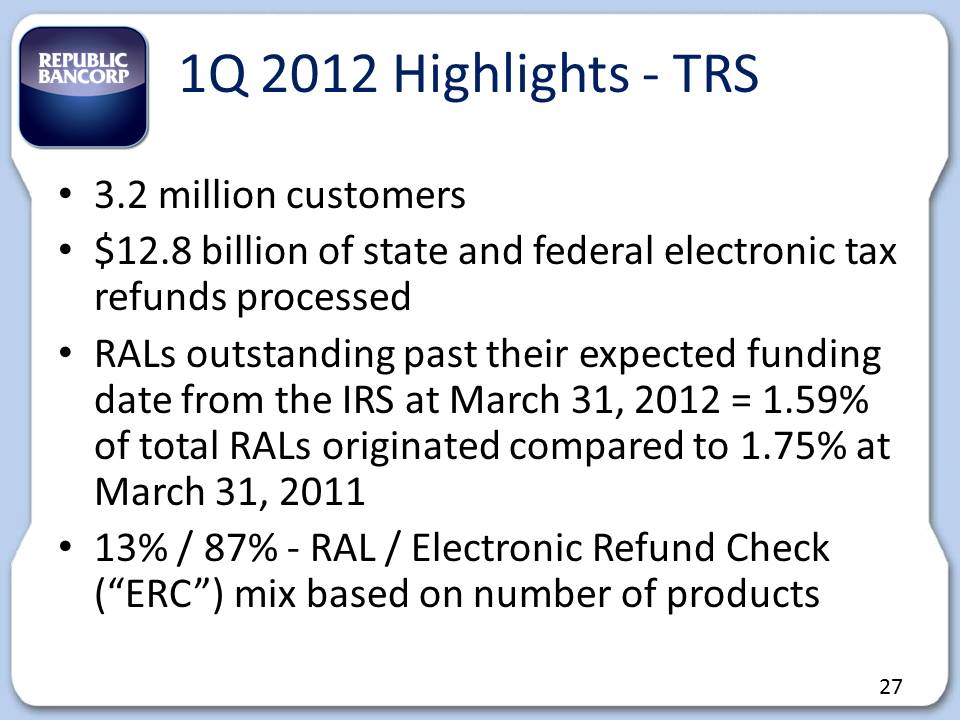
1Q 2012 Highlights ‐ TRS 3.2 million customers $12.8 billion of state and federal electronic tax refunds processed RALs outstanding past their expected funding date from the IRS at March 31, 2012 = 1.59% of total RALs originated compared to 1.75% at March 31, 2011 13% / 87% ‐ RAL / Electronic Refund Check (“ERC”) mix based on number of products 27
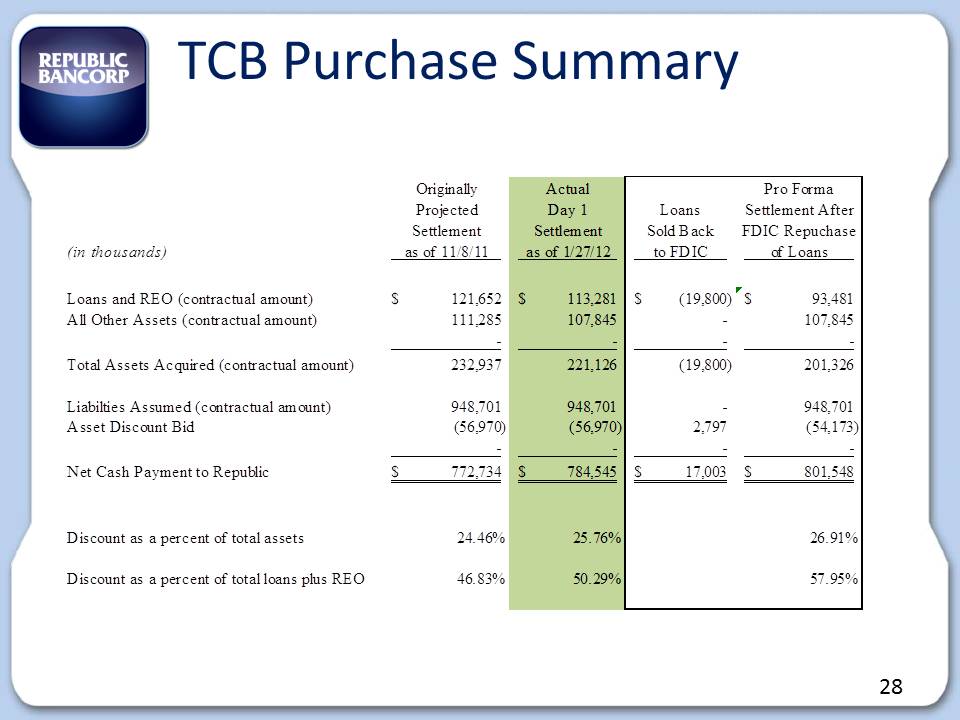
TCB Purchase Summary Originally Actual Pro Forma Projected Day 1 Loans Settlement After Settlement Settlement Sold Back FDIC Repuchase (in thousands) as of 11/8/11 as of 1/27/12 to FDIC of Loans Loans and REO (contractual amount) $ 121,652 $ 113,281 $ (19,800) $ 93,481 All Other Assets (contractual amount) 111,285 1 07,845 - 107,845 - - - - Total Assets Acquired (contractual amount) 232,937 2 21,126 (19,800) 201,326 Liabilties Assumed (contractual amount) 948,701 9 48,701 - 948,701 Asset Discount Bid ( 56,970) (56,970) 2,797 ( 54,173) - - - - Net Cash Payment to Republic $ 772,734 $ 784,545 $ 17,003 $ 801,548 Discount as a percent of total assets 24.46% 25.76% 26.91% Discount as a percent of total loans plus REO 46.83% 50.29% 57.95% 28
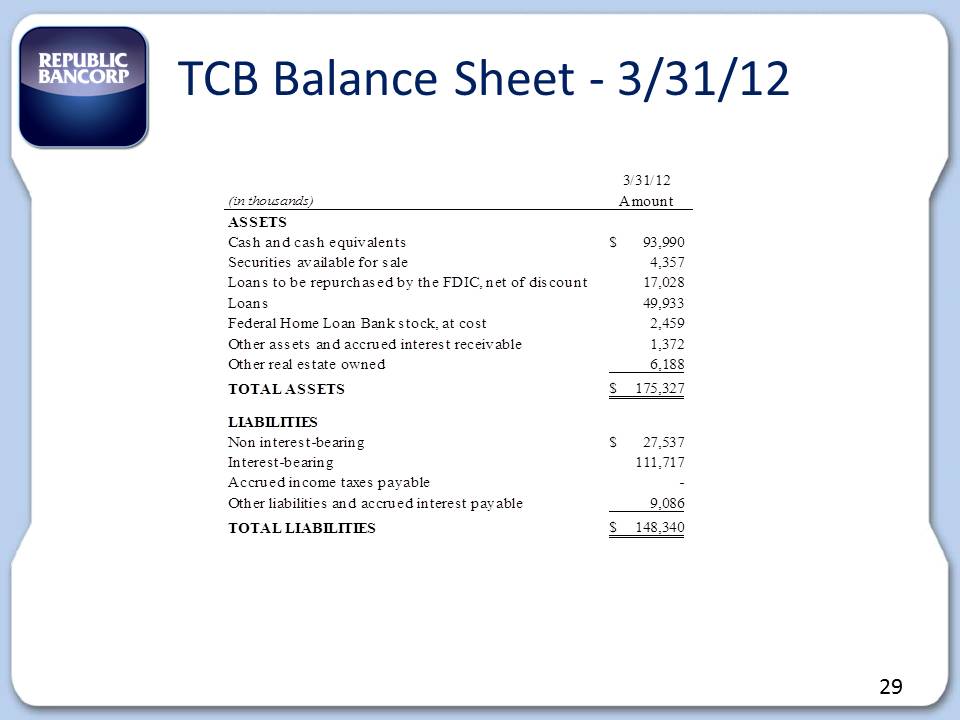
TCB Balance Sheet ‐ 3/31/12 3/31/12 (in thousands) Amount ASSETS Cash and cash equivalents $ 93,990 Securities available for sale 4,357 Loans to be repurchased by the FDIC, net of discount 17,028 Loans 49,933 Federal Home Loan Bank stock, at cost 2,459 Other assets and accrued interest receivable 1,372 Other real estate owned 6,188 TOTAL ASSETS $ 175,327 LIABILITIES Non interest-bearing $ 27,537 Interest-bearing 111,717 Accrued income taxes payable - Other liabilities and accrued interest payable 9,086 TOTAL LIABILITIES $ 148,340 29
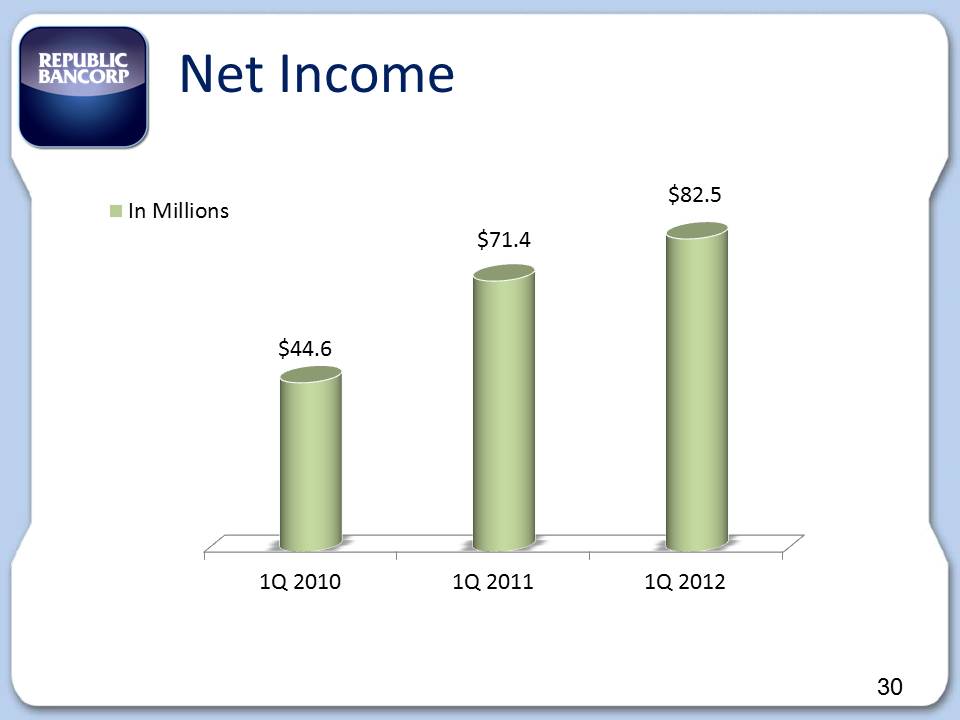
Net Income 1Q 2010 1Q 2011 1Q 2012 $44.6 $71.4 $82.5 In Millions 30
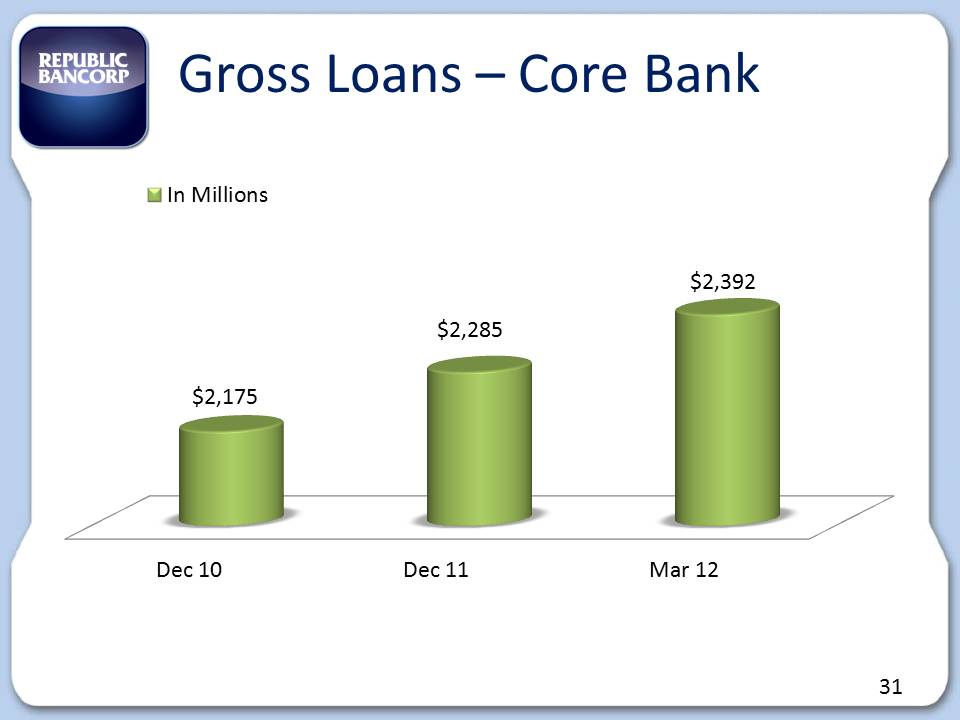
Gross Loans – Core Bank Dec 10 Dec 11 Mar 12 $2,175 $2,285 $2,392 In Millions 31
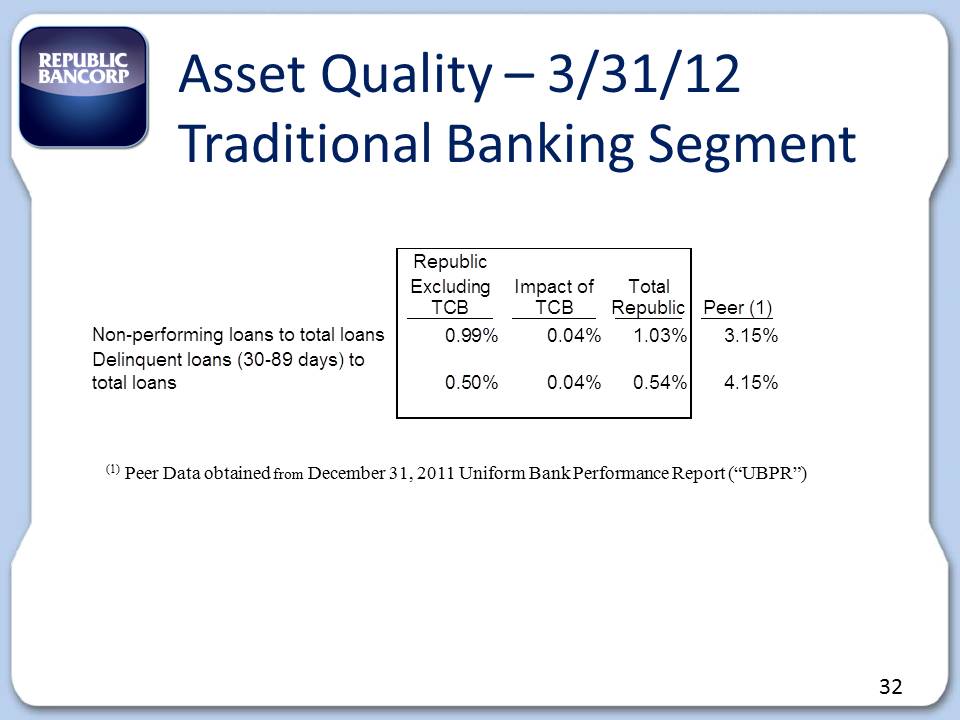
Asset Quality – 3/31/12 Traditional Banking Segment (1) Peer Data obtained from December 31, 2011 Uniform Bank Performance Report (“UBPR”) Republic Excluding Impact of Total TCB TCB Republic Peer (1) Non-performing loans to total loans 0.99% 0.04% 1.03% 3.15% Delinquent loans (30-89 days) to total loans 0.50% 0.04% 0.54% 4.15% 32
Growth Initiatives Grow existing product lines –Warehouse Lending, Credit Card, and Debit Card income Develop new lines of business – Prepaid Cards Make selective acquisitions Add strategically located banking centers Outperform peer financial performance Focus on core deposit growth initiatives Continue to improve on already solid loan quality metrics Remain positioned for sustainable, profitable growth 33
2012 Challenges & Opportunities Successfully convert TCB to Republic’s core system Improve net interest margin by capitalizing on low cost deposit opportunities within Treasury Management Control non‐interest expenses Expand product offerings to the under‐served market through nontraditional delivery channels Maintain credit quality Continue to increase the solid returns achieved at TRS 34

We were here for you yesterday. We are here for you today. We will be here for you tomorrow. 35

THANK YOU 36