Attached files
| file | filename |
|---|---|
| 8-K - FORM 8-K - FIRST NIAGARA FINANCIAL GROUP INC | d337368d8k.htm |
Exhibit 99.1
| First Quarter 2012 Earnings Highlights April 19, 2012 John R. Koelmel President & Chief Executive Officer Gregory W. Norwood Chief Financial Officer |
| Safe Harbor Statement This presentation contains forward-looking information for First Niagara Financial Group, Inc. Such information constitutes forward-looking statements (within the meaning of the Private Securities Litigation Reform Act of 1995) which involve significant risks and uncertainties. Actual results may differ materially from the results discussed in these forward-looking statements. |
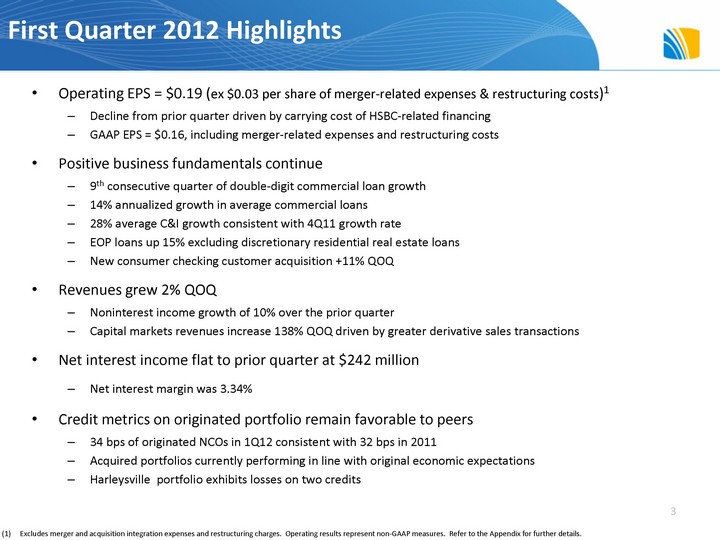
| First Quarter 2012 Highlights Operating EPS = $0.19 (ex $0.03 per share of merger-related expenses & restructuring costs)1 Decline from prior quarter driven by carrying cost of HSBC-related financing GAAP EPS = $0.16, including merger-related expenses and restructuring costs Positive business fundamentals continue 9th consecutive quarter of double-digit commercial loan growth 14% annualized growth in average commercial loans 28% average C&I growth consistent with 4Q11 growth rate EOP loans up 15% excluding discretionary residential real estate loans New consumer checking customer acquisition +11% QOQ Revenues grew 2% QOQ Noninterest income growth of 10% over the prior quarter Capital markets revenues increase 138% QOQ driven by greater derivative sales transactions Net interest income flat to prior quarter at $242 million Net interest margin was 3.34% Credit metrics on originated portfolio remain favorable to peers 34 bps of originated NCOs in 1Q12 consistent with 32 bps in 2011 Acquired portfolios currently performing in line with original economic expectations Harleysville portfolio exhibits losses on two credits 3 Excludes merger and acquisition integration expenses and restructuring charges. Operating results represent non-GAAP measures. Refer to the Appendix for further details. |
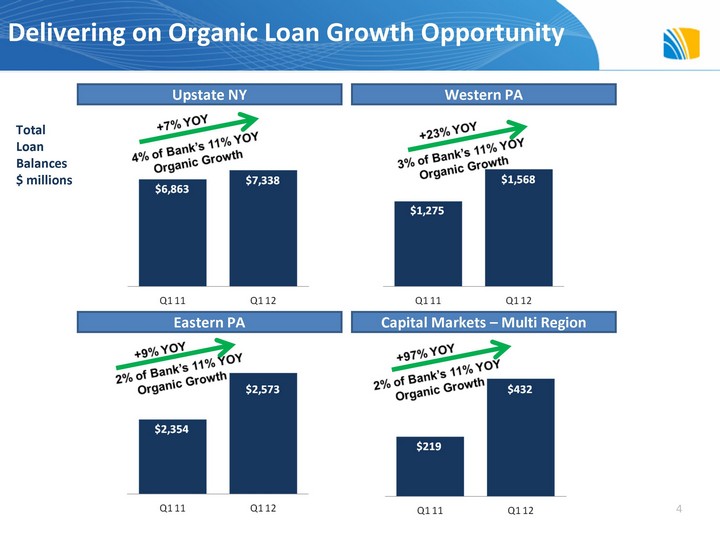
| Delivering on Organic Loan Growth Opportunity Eastern PA Upstate NY Western PA Capital Markets - Multi Region Total Loan Balances $ millions 4 |
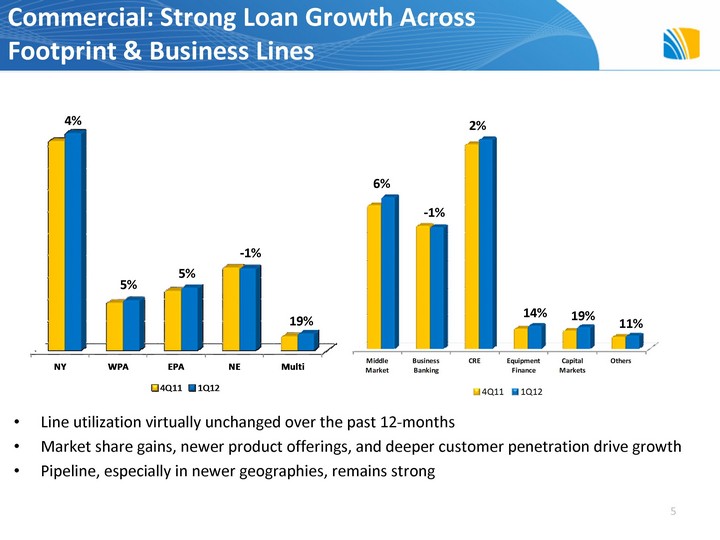
| Commercial: Strong Loan Growth Across Footprint & Business Lines Line utilization virtually unchanged over the past 12-months Market share gains, newer product offerings, and deeper customer penetration drive growth Pipeline, especially in newer geographies, remains strong 5 4% 5% 5% -1% 19% 6% -1% 2% 14% 19% 11% |
| Retail: Focus on Checking Account Growth and Growing Consumer Finance Opportunity YouFirst Checking Campaign has set the stage for checking account growth In 1Q12, new checking account openings grew 11% QOQ New checking sales per branch up 30% YOY; Strength across all markets Personal checking balances up 15% annualized Small Business deposit and lending initiative in full swing across footprint 35 new bankers On target for 5+% business checking account growth in 2012 Loan production and pipeline expected to double in 2012 Indirect Auto Lending Up and Running Accelerates balance sheet rotation into loans Strong leadership and experienced teams familiar with players within our markets Relationship and high-quality service driven approach Over 500 dealers signed up 6 |
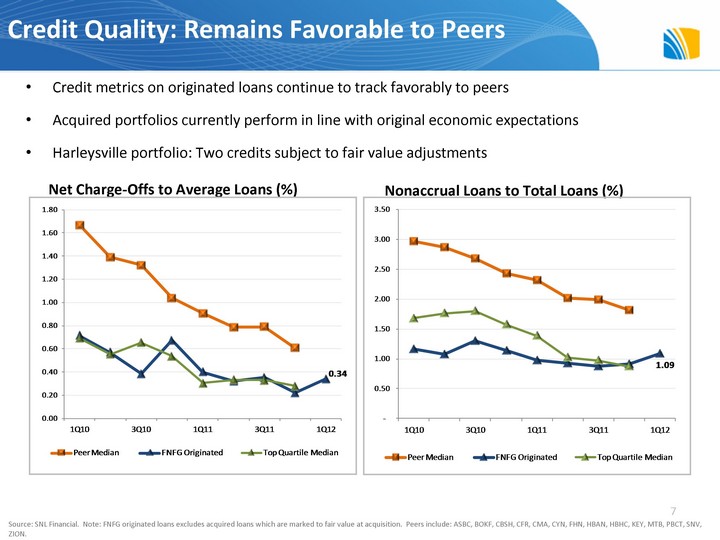
| Credit Quality: Remains Favorable to Peers Credit metrics on originated loans continue to track favorably to peers Acquired portfolios currently perform in line with original economic expectations Harleysville portfolio: Two credits subject to fair value adjustments Net Charge-Offs to Average Loans (%) Nonaccrual Loans to Total Loans (%) Source: SNL Financial. Note: FNFG originated loans excludes acquired loans which are marked to fair value at acquisition. Peers include: ASBC, BOKF, CBSH, CFR, CMA, CYN, FHN, HBAN, HBHC, KEY, MTB, PBCT, SNV, ZION. 7 |
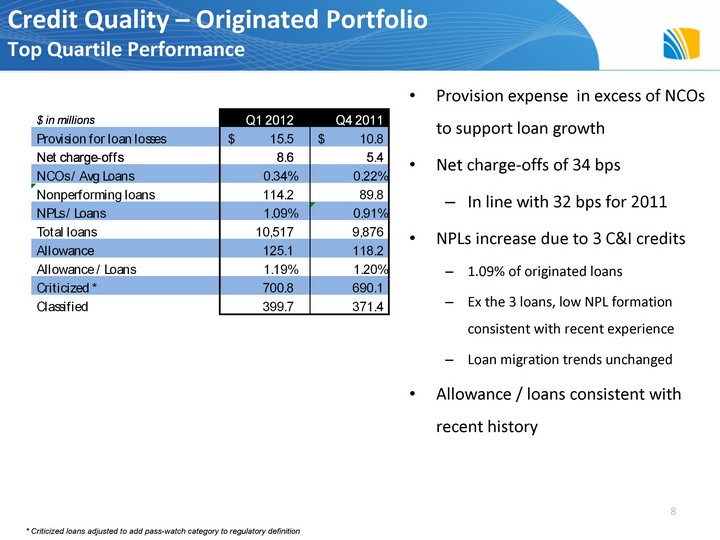
| Credit Quality - Originated Portfolio Top Quartile Performance Provision expense in excess of NCOs to support loan growth Net charge-offs of 34 bps In line with 32 bps for 2011 NPLs increase due to 3 C&I credits 1.09% of originated loans Ex the 3 loans, low NPL formation consistent with recent experience Loan migration trends unchanged Allowance / loans consistent with recent history 8 * Criticized loans adjusted to add pass-watch category to regulatory definition |
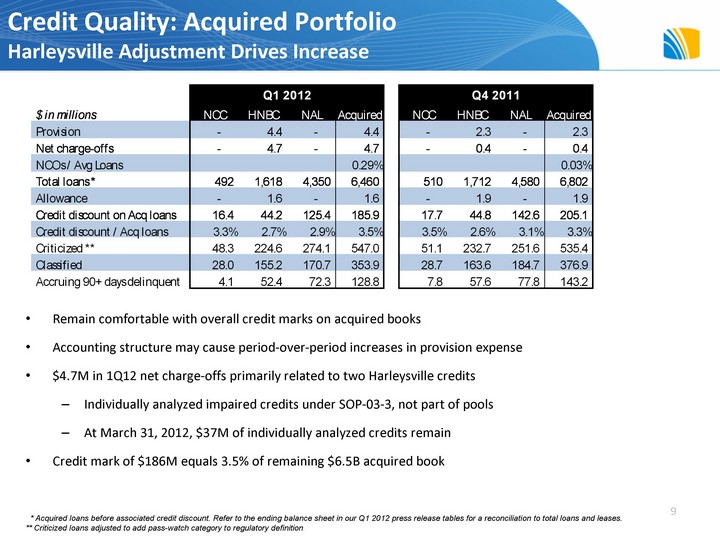
| Credit Quality: Acquired Portfolio Harleysville Adjustment Drives Increase Remain comfortable with overall credit marks on acquired books Accounting structure may cause period-over-period increases in provision expense $4.7M in 1Q12 net charge-offs primarily related to two Harleysville credits Individually analyzed impaired credits under SOP-03-3, not part of pools At March 31, 2012, $37M of individually analyzed credits remain Credit mark of $186M equals 3.5% of remaining $6.5B acquired book 9 * Acquired loans before associated credit discount. Refer to the ending balance sheet in our Q1 2012 press release tables for a reconciliation to total loans and leases. ** Criticized loans adjusted to add pass-watch category to regulatory definition |
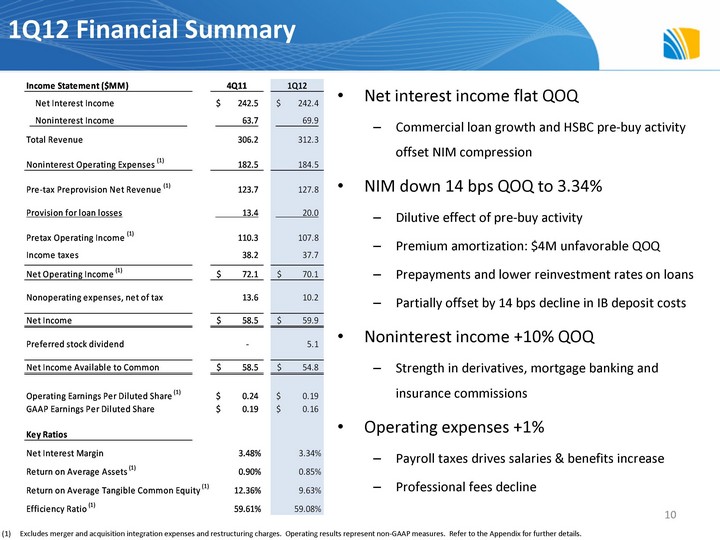
| 1Q12 Financial Summary Net interest income flat QOQ Commercial loan growth and HSBC pre-buy activity offset NIM compression NIM down 14 bps QOQ to 3.34% Dilutive effect of pre-buy activity Premium amortization: $4M unfavorable QOQ Prepayments and lower reinvestment rates on loans Partially offset by 14 bps decline in IB deposit costs Noninterest income +10% QOQ Strength in derivatives, mortgage banking and insurance commissions Operating expenses +1% Payroll taxes drives salaries & benefits increase Professional fees decline Excludes merger and acquisition integration expenses and restructuring charges. Operating results represent non-GAAP measures. Refer to the Appendix for further details. 10 |
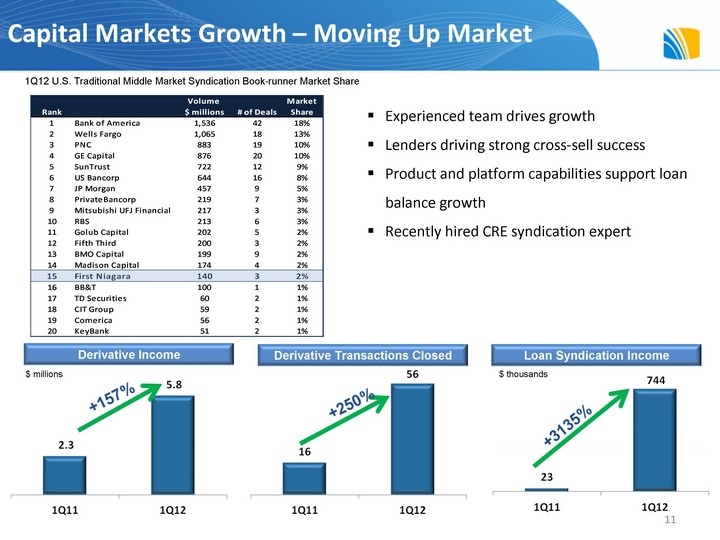
| Derivative Transactions Closed Derivative Income Loan Syndication Income $ millions $ thousands 1Q12 U.S. Traditional Middle Market Syndication Book-runner Market Share Experienced team drives growth Lenders driving strong cross-sell success Product and platform capabilities support loan balance growth Recently hired CRE syndication expert 11 Capital Markets Growth - Moving Up Market |
| Appendix 12 Non-GAAP Measures - This presentation contains financial information determined by methods other than in accordance with accounting principles generally accepted in the United States of America (GAAP). The Company believes that these non-GAAP financial measures provide a meaningful comparison of the underlying operational performance of the Company, and facilitate investors' assessments of business and performance trends in comparison to others in the financial services industry. In addition, the Company believes the exclusion of these non- operating items enables management to perform a more effective evaluation and comparison of the Company's results and to assess performance in relation to the Company's ongoing operations. These disclosures should not be viewed as a substitute for financial measures determined in accordance with GAAP, nor are they necessarily comparable to non-GAAP performance measures that may be presented by other companies. Where non-GAAP disclosures are used in this presentation, the comparable GAAP financial measure, as well as the reconciliation to the comparable GAAP financial member, can be found in this Appendix. |
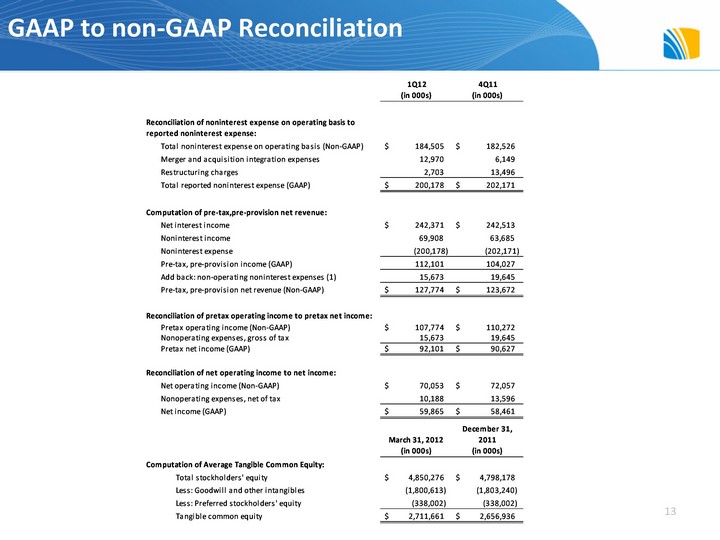
| GAAP to non-GAAP Reconciliation 13 |